Technical Note

Chemical Analysis of Plasma-Activated Culture Media by Ion Chromatography

by
Marcello Locatelli
1,2,*,†,
Miryam Perrucci
3,4,†,
Marwa Balaha
5,6,
Tirtha-Raj Acharya
7,
Nagendra-Kumar Kaushik
7,
Eun-Ha Choi
7,
Monica Rapino
8 and
Vittoria Perrotti
2,4,*
1
Department of Science, University “G. d’Annunzio” of Chieti-Pescara, 66100 Chieti, Italy
2
UdA-TechLab, Research Center, University “G. d’Annunzio” of Chieti-Pescara, 66100 Chieti, Italy
3
Department of Biosciences and Agro-Food and Environmental Technologies, University of Teramo, 64100 Teramo, Italy
4
Department of Innovative Technologies in Medicine & Dentistry, University “G. d’Annunzio” of Chieti-Pescara, 66100 Chieti, Italy
5
Department of Pharmacy, University “G. d’Annunzio” of Chieti-Pescara, 66100 Chieti, Italy
6
Department of Pharmaceutical Chemistry, Faculty of Pharmacy, Kafrelsheikh University, Kafr El Sheikh 33516, Egypt
7
Plasma Bioscience Research Center, Department of Electrical and Biological Physics, Kwangwoon University, Seoul 01897, Republic of Korea
8
Unit of Chieti, Genetic Molecular Institute of CNR, University “G. d’Annunzio” of Chieti-Pescara, 66100 Chieti, Italy
*
Authors to whom correspondence should be addressed.
These authors contributed equally to this work.
Pharmaceuticals 2025, 18(2), 199; https://doi.org/10.3390/ph18020199
Submission received: 27 November 2024 / Revised: 7 January 2025 / Accepted: 29 January 2025 / Published: 1 February 2025
(This article belongs to the Section Pharmacology)

Abstract

:
Background: Currently, the procedures and methods applied in biological and medical fields for the determination of reactive oxygen and nitrogen species (RONS), primarily rely on spectrophotometric techniques, which involve the use of colorimetric reagents. While these methods are widely accepted, they exhibit significant limitations from an analytical standpoint, particularly due to potential inaccuracies, artifacts, and pronounced susceptibility to matrix effects. The purpose of this Technical Note is to demonstrate the application of ion chromatography—a robust and well-established analytical technique—for the quantification of RONS produced in cell culture media through the exposure to cold atmospheric plasma (CAP), an innovative therapeutic approach for cancer treatment, known as CAP indirect treatment. In addition, the present protocol proposes to apply the pharmacokinetics principles to the RONS generated in plasma-treated liquids (PTLs) following CAP exposure. Methods: The strategy involves elucidating the kinetic profiles of certain characteristic species by evaluating their half-life in the specific media used for cell cultures and investigating their “pharmacokinetic” (PK) profile. In this approach the drug dose is represented by the plasma power and the infusion time corresponds to the exposure time of the culture medium to CAP. Volume-dependent results were shown, focusing on nitrites and nitrates activities, justifying cellular inhibition. Results: This methodology enables the correlation of the PTL biological effects on different cell lines with the PK profiles (dose/time) obtained via ion chromatography. Conclusions: In conclusion, being a simple and green method, it could be used as an alternative to toxic reactions and analytical techniques with higher detection limits, while achieving good resolution.

1. Introduction

Cold atmospheric plasma (CAP) is an ionized gas that operates at ambient pressure and room temperature (<40 °C). It is composed of free electrons, ions, radicals, and reactive species (e.g., reactive oxygen and nitrogen species—RONS), as well as excited atoms and molecules, neutral molecules, electromagnetic fields, and UV/Vis radiation [1,2]. There are two recognized approaches for CAP application:
(i)
Direct plasma treatment: This involves the direct exposure of biological targets (e.g., cells, tissues, or animals) to CAP, resulting in a synergistic effect of all the plasma components mentioned above.
(ii)
Indirect plasma treatment: In this method, a liquid (e.g., cell culture medium) is exposed to CAP and then applied to the biological target. In this case, the effect is mainly due to the RONS generated in the activated liquid (PTL: plasma-treated liquid), particularly through its enrichment with long-lived secondary RONS [3].
Among the liquids that can be exposed to CAP, various water-based solutions commonly used in clinics—such as Ringer’s lactate solution, phosphate-buffered saline, deionized water, and electrolyte rehydrating III solution—show potential for clinical application of this emerging technology [3,4].
CAP demonstrated remarkable anti-tumoral potential across a wide range of cancer types [5], although its underlying mechanisms remain unclear. Several short-lived species (e.g., radical hydroxyl OH, anion superoxide O2, and singlet oxygen 1O2) and long-lived species (hydrogen peroxide H2O2, nitrite NO2, and nitrate NO3) have been detected in both gas and liquid phases [6]. Hence, the standardization of chemical analyses for plasma-generated species in liquids is an urgent priority and could play a key role in elucidating the role of individual species in eliciting specific biological effects.
Nowadays, the chemical characterization of PTLs primarily involves the quantification of NO, H2O2, and total ROS using commercial test kits. These kits typically reply on UV/Vis or fluorescence (FL) spectroscopy to detect single species. The Griess test detects stable metabolites of nitric oxide (NO), such as nitrites and nitrates, through a colorimetric assay with UV/Vis absorbance at 540 nm. It involves the reaction with sulfanilic acid and N-(1-naphthyl)-ethylene diamine hydrochloride to produce a pink compound. Other methods include the QuantiChrom Nitric Oxide Assay Kit (BioAssays Systems, Hayward, CA, USA), the Measure-IT Nitrite assay, based on the reaction of 2,3-diaminonaphtalene (DAN) with nitrite under acidic conditions to generate 1H-naphthotriazole, and reactions with 2,6-dimethylphenol for nitrate detection. Graves D.B., 2014 [7], highlighted the potential role of NO biochemistry in plasma oncology, particularly noting the formation of peroxynitrite (ONOO) under specific conditions, which can be detected using 2′,7′-dichlorodihydrofluorescein (DCDHF).
For ROS quantification, 2′,7′-dichlorodihydrofluorescein diacetate (DCFH-DA) assays are commonly employed. H2O2 detection often relies on the Amplex™ Red Hydrogen Peroxide/Peroxidase Assay Kit (Thermo Fisher, Waltham, MA, USA) or QuantiChromTM Peroxide Assay Kit (DIOX-250) (BioAssays Systems, USA), as well as the titanyl sulfate assay. For hydroxyl radicals (OH), the 3′-(p-aminophenyl) fluorescein (APF) assay is typically used [8]. While these techniques are widely utilized, they suffer from several drawbacks, including interference between the assay components and PTL, challenges in data interpretation across laboratories due to varying kits and equipment, and the inability to analyze multiple species simultaneously. Finally, it is worth noting that, nowadays, there is a tendency to avoid and/or minimize the use of toxic solvents, as recommended by the principles of Green Chemistry (GC) [9]. To address these limitations, ion chromatography (IC) presents a promising alternative. IC, a form of liquid chromatography based on ion interactions with a stationary phase made of ion-exchange resins, is widely applied in the analysis of aqueous samples containing common anions (i.e., fluoride, chloride, nitrite, nitrate, and sulfate) [10]. To the best of our knowledge, IC has not yet been applied to PTL characterization. It is most employed for the quantification of anions in water quality analysis, environmental monitoring, pharmaceutical compounds and food/beverage analysis, biomedical research, and chemical process control. IC offers several advantages, including the ability to simultaneously analyze multiple species (multianalyte analysis), resulting in fast, accurate, and reproducible results. In addition, it enables the correlation of anion quantitative data with PK profiles using computational tools such as Excel Add On PK Solver, an extension of Excel (Microsoft Office) made of different methods, as non-compartmental or compartmental analysis [11].
Therefore, this article aims to provide a detailed protocol to standardize the chemical analysis of PTLs and facilitate their potential clinical application as therapeutic agents. The protocol has already been applied to plasma-activated cell culture media, enabling the investigation of their effects on cell proliferation, apoptosis occurrence, and cell cycle regulation in a panel of head and neck cancer (HNC) cell lines [12]. This approach allows for the selection of the most effective PAM for therapeutic purposes.

2. Results and Discussion

2.1. Analysis of Results

Once areas are obtained from Chromeleon, a calibration curve was used to correlate them with the corresponding concentrations, reported in µg/mL. With the Excel Add On PK Solver, the PK of the abovementioned anions was calculated, taking into account the following parameters:
Type of administration;
Dose;
Time of infusion;
Time on abscissa and concentration on ordinate.
The type of administration was set as non-compartmental IV constant infusion (NCA IV infusion); the dose considered was the device’s duty cycle and power calculated as follows.
The duty cycle can be defined as [13,14]
Duty cycle (%) = (On time)/(On time + Off time) × 100
Energy (E) = Q × V= ∫_t1^t2V(t)I(t)dt [J]
Power (P) = Duty cycle × E × 1/t [W]
where Q = charge, V = peak voltage, I = peak current, and t = plasma discharge time.
Time of infusion was set as the time of sample treatment (5, 10, or 20 min exposure time). With the non-compartmental method, several parameters, fundamental for PK assessment, are obtained:
Lambda_z (individual estimate of the terminal elimination rate constant);
T½ (half-life);
Tmax (time when the maximum concentration is found);
Cmax (maximum concentration found);
Clast_obs/Cmax (the observed concentration at Tlast, where Tlast is the time of the last sample measurable with the analytical method);
AUC0-t (expressed in µg/mL × min);
AUC0-inf_obs (expressed in µg/mL × min);
AUC0-t/0-inf_obs (expressed in µg/mL × min);
AUMC0-inf_obs (the area under the moment curve from time zero (pre-dose) to the time of the last sample, including after the application of the LOQ rules);
MRT0-inf_obs (the mean residence times, based on AUC);
Vz_obs (apparent volume of distribution) expressed in (J/s)/(µg/mL);
Cl_obs (systemic clearance) expressed in (J/s)/(µg/mL)/min;
Vss_obs (volume of distribution at steady state) expressed in (J/s)/(µg/mL).
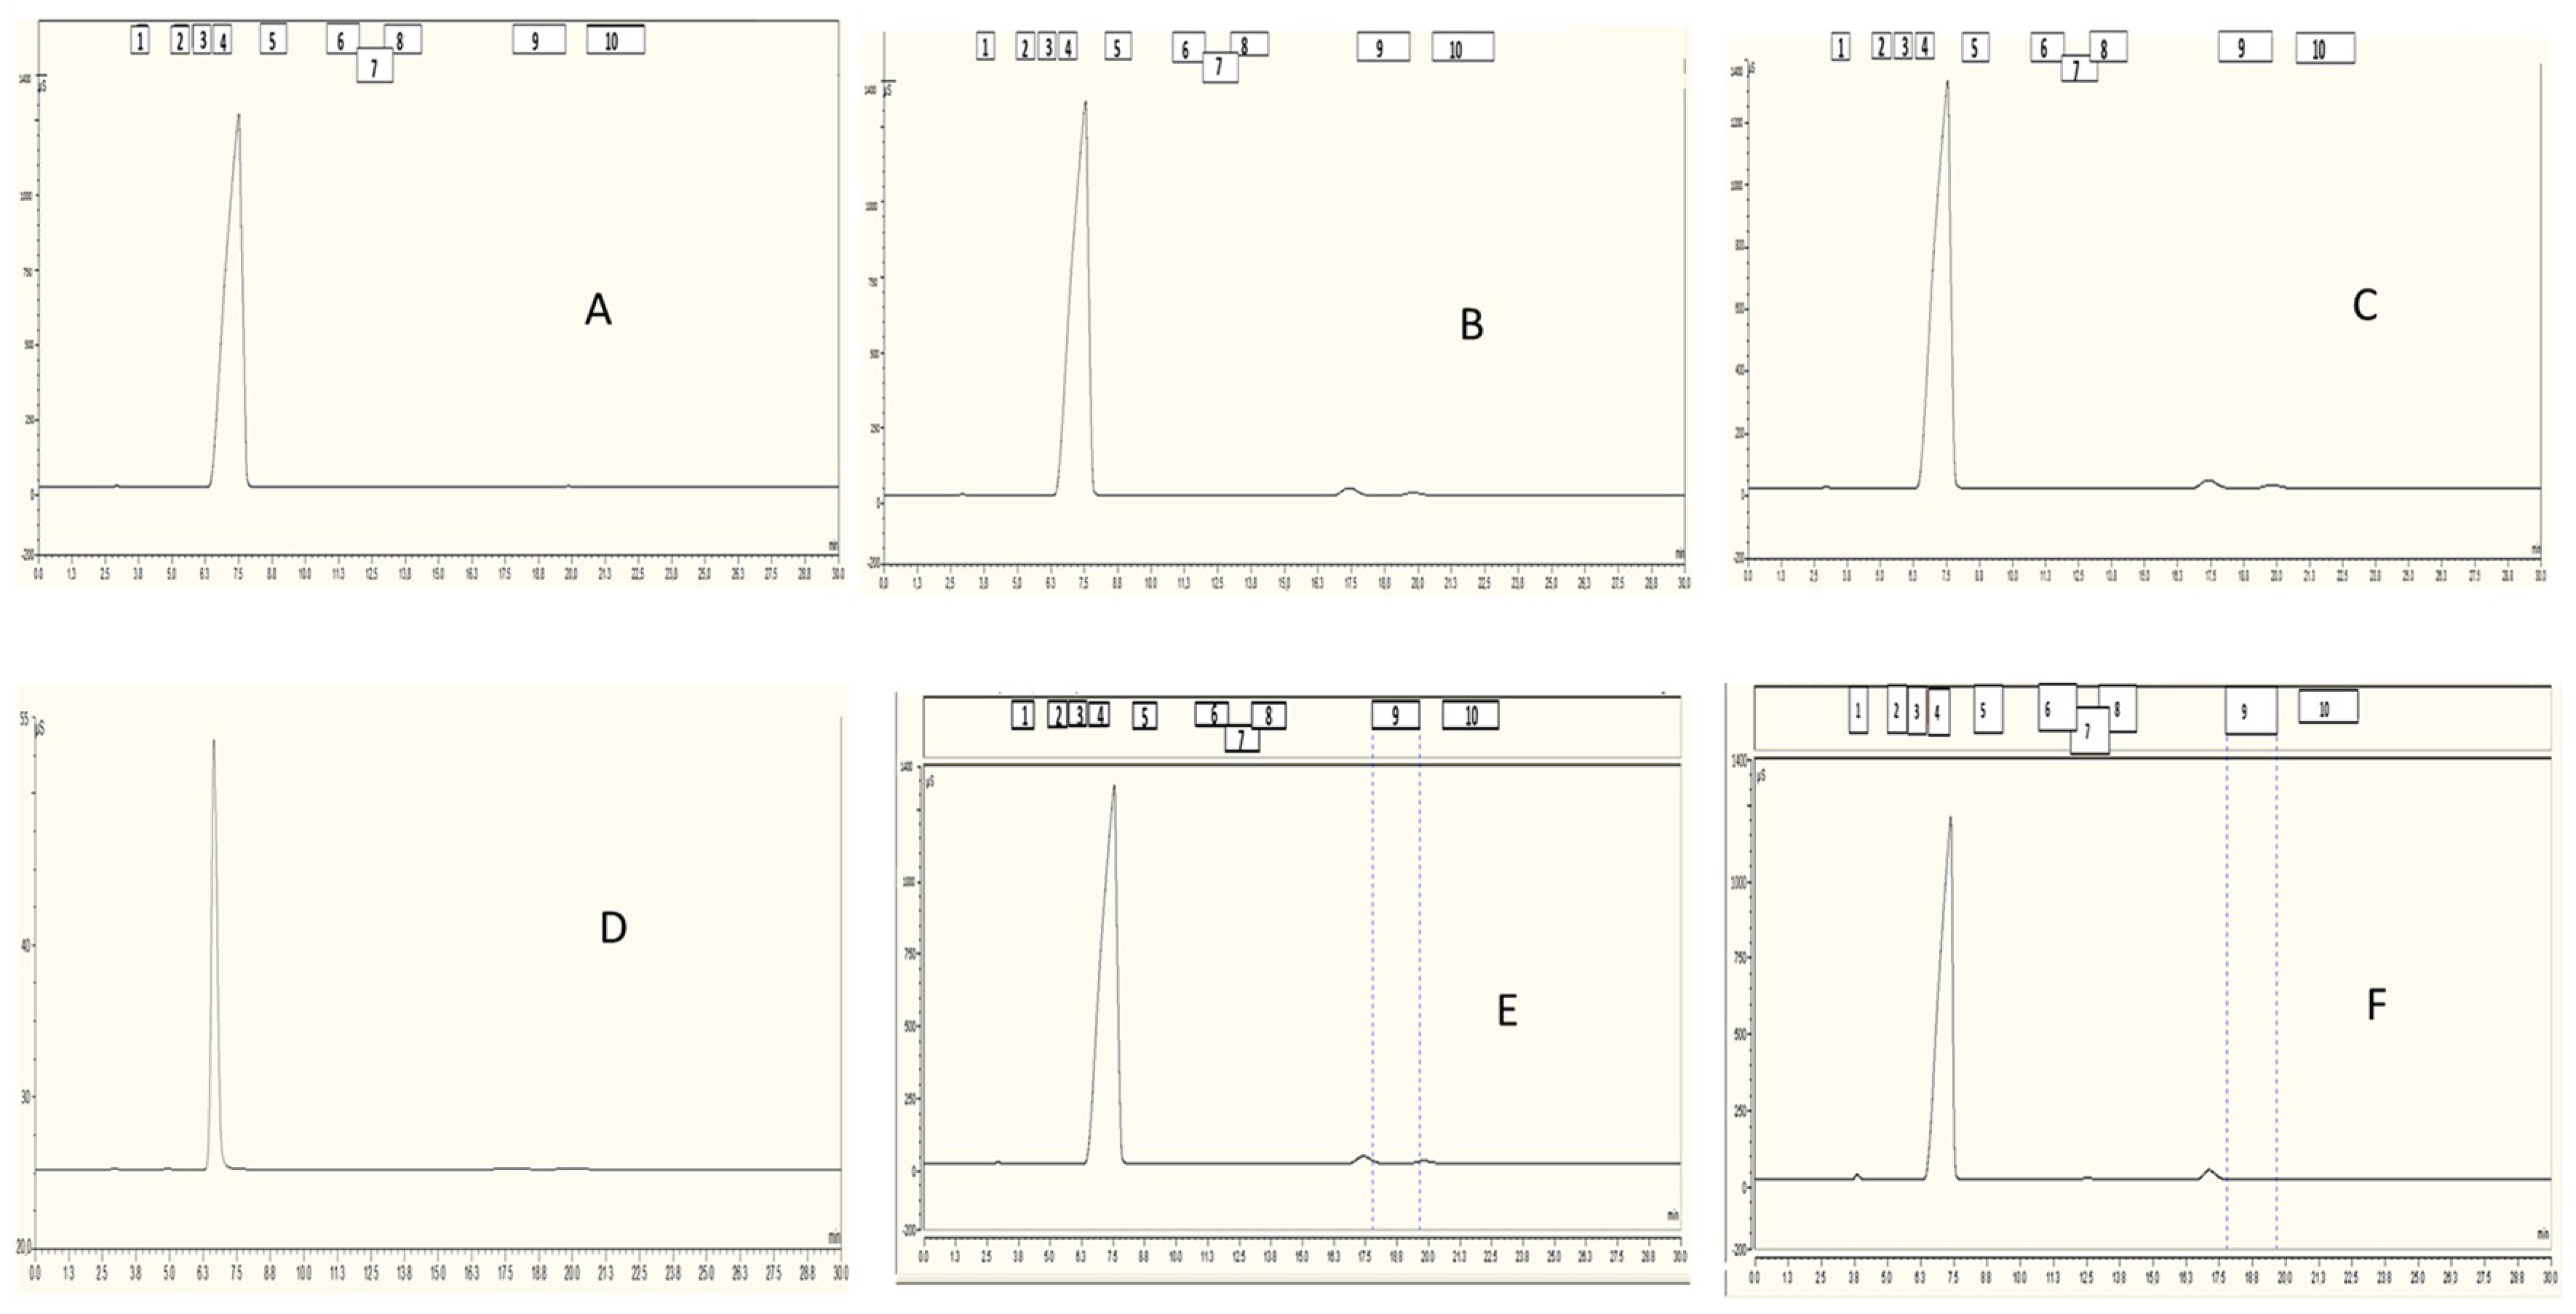
2.2. Results

Given the growing interest in using CAP as a potential treatment for cancer, it was deemed important to evaluate the PK profiles of analytes that are considered critical in this field. The interest in CAP’s efficacy against cancer is rooted in the differences in oxidative states between normal and tumor cells. Specifically, cancer cells have a higher concentration of ROS, lower antioxidant activity, and greater porosity. Based on this evaluation, our aim was to understand how the chemical composition of PTL could affect cell viability. The 6 mm distance was chosen as the best condition between the plasma plume and the media’s surface through a deep revision of the literature and considering 6 mm as an average. At a close distance of 3 mm, the plasma jet is dense, leading to a dominance of nitrogen-based species (RNS) such as NO2, due to strong interactions with nitrogen molecules. As the distance increases to 6 mm, the plasma plume expands, creating a balanced interaction between nitrogen and oxygen, resulting in a mixture of both RNS and ROS, including H2O2 and superoxide. At longer distances (9 mm), the plasma disperses further, reducing nitrogen interactions and increasing the concentration of oxygen-based species (ROS), such as H2O2 and superoxide.
In this way, the safety of the operator is ensured, but media were mainly subjected to uniform treatment, avoiding undesirable non-uniform effects due to being too close to the instrument, and plasma plume was protected from possible drops generated by collusion between flame and media. In addition, temperature, with this distance, appears more stable, avoiding heating and protecting heat-labile compounds.
Therefore, the present protocol aims to provide selective, accurate, rapid, and sensitive quantification of the anions produced in PTLs, which are considered fundamental for the anticancer effects of indirect CAP treatment. It is important to note the use of high-purity water (HPW), as it does not contain anions that could interfere with the analysis. Similarly, the use of transparent rack and Falcon tubes is crucial for visualizing the plasma plume and the surface of the media. This method was fully validated in accordance with ICH Guidelines [15,16,17].
Firstly, we ensured that the blank matrix (i.e., medium without plasma activation) did not contain the analytes of interest. If any analyte was detected in the blank matrix, its values were subtracted from the subsequent quantification to avoid skewing the results, as shown in Figure 1. The absence of anions of interest in the blank matrices is evident, as also supported by the presence of tangent lines in their respective retention times (considering also the standard deviation stdev), when doubts were present. To ensure the absence of overlap regarding the first peak, a dilution 1:1000 was carried out for each matrix, obtaining a single peak, which was useless for this study.
Table 1 reports the major analytical parameters used for the quantification of each anion. The sensitivity of this method is of crucial importance, as it allows for the quantification of anions even at very low concentrations.
It is worth noting that in a previously published study [12], IC allowed us to understand how the volume-dependent proliferation inhibition in HNC cells was linked to the volume-dependent increase in nitrites and nitrates. A similar result was obtained by Zhang et al., which confirmed data present in the literature showing that the increase in nitrites and nitrates correlate with a decrease in cell proliferation [18].
The key element of this protocol is that it describes, for the first time, a robust analytical method to standardize the chemical analysis of PTL administrated as a drug, following typical principles of pharmacotoxicology (evaluation of PK profiles with experimental parameters). In this way, plasma can be considered the “drug” and the culture medium, the “patient”, analyzing the latter’s response to the treatment, which was administered on the first day. Thus, using Excel, we obtained the PK parameters, as previously shown [11]. It was interesting to observe that nitrite and nitrate concentrations increased in a volume-dependent manner, with their levels rising until X hours and then decreasing at the final time point (72 h). Unlike nitrites and nitrates, no scientific studies in the literature have highlighted the importance of phosphate and sulfateSome PK parameters obtained from this study are reported in Supplementary Table S1, as also previously shown in our last publication [12]. Additionally, some chromatograms are shown in Supplementary Figure S1.
Furthermore, the protocol described here refers to an experimental setting where 2 and 5 mL of culture medium were activated for 5, 10, and 20 min, maintaining a 6 mm distance between the tip of the plasma jet and the media. However, it can be easily extended to any other experimental setup, allowing PTL to be characterized and administered as a drug in a unique and reproducible way. The simplicity of the protocol, the absence of toxic/hazardous substances, and the type of instrumentation make this method applicable not only to other PK studies and potential PTL applications but also to further research related to the parameters mentioned above.
Additionally, PAM is useful also for other pathologies, as reported by Martin and Yao, who discussed its role in inhibiting fungal and viral growth [19,20].
Based on the easy use of this protocol, it is important to also highlight the greenness of the method, which does not use organic solvents as mobile phases and is able to detect a low concentration of ten analytes; thus, it could be defined as a multianalyte method, as required by Green Analytical Chemistry principles.

3. Materials and Methods

3.1. Chemicals and Materials
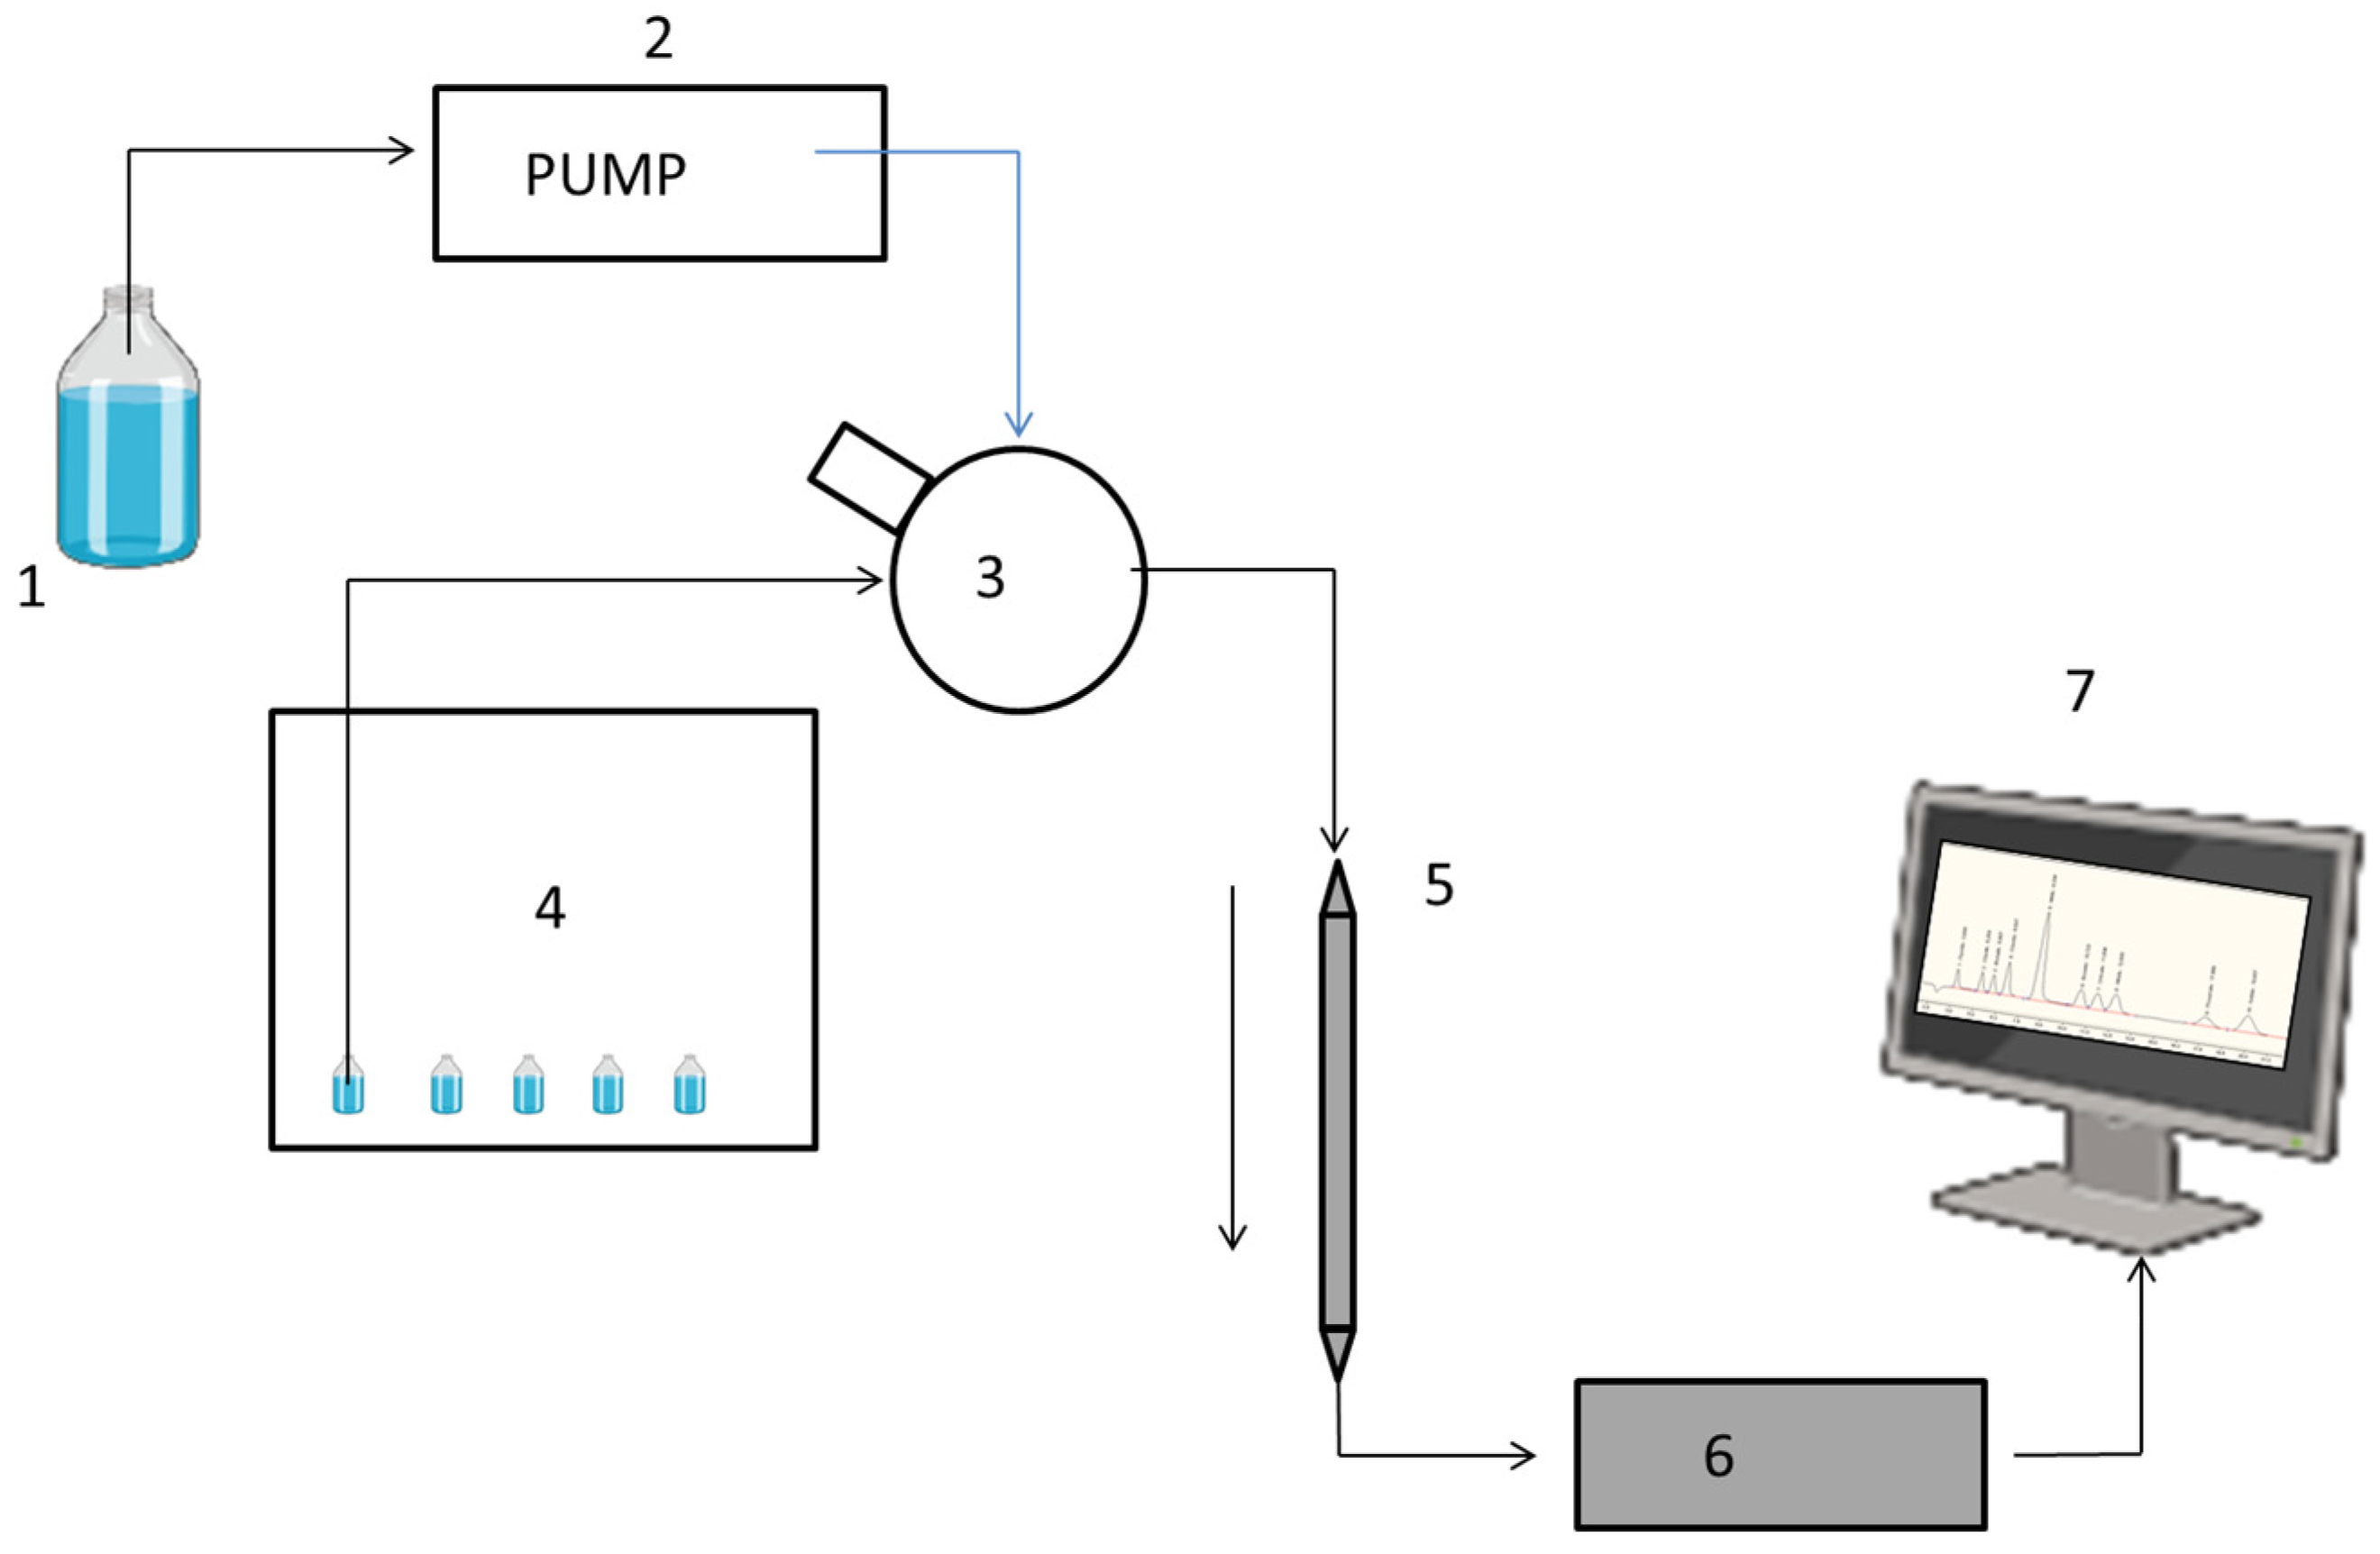
Multi Anion Standard 1 for IC, containing fluoride, chloride, bromide, nitrate, sulfate, phosphate, chlorite, bromate, nitrite, and chlorate, was purchased from Supelco (Milan, Italy). Sodium carbonate (Na2CO3) and sodium bicarbonate were obtained from Sigma Aldrich (Milan, Italy); meanwhile, PTFE filters were sourced from Whatman, (Clifton, NJ, USA). McCOY’s 5, DMEM, and RPMI were bought from Gibco (Waltham, MA, USA). Double-distilled water was obtained using a Millipore Milli-Q Plus water treatment system (Millipore Bedford Corp., Bedford, MA, USA).

3.2. Equipment

For the cold plasma air jet, a voltage controller was used to regulate the peak voltage, and the feed air gas flow rate was maintained at a steady 2 L per minute (Lpm). The high-voltage electrode was made of stainless steel, measuring 1.20 mm by 0.27 mm, and served as the inner electrode. The ground electrode was also made of stainless steel, with dimensions of 6.00 mm in length and 0.27 mm in thickness and a centrally drilled hole of 0.70 mm for plasma formation.
For the analytical part, a Dionex ICS 1600 (Thermo Fisher, USA) was equipped with an AS autosampler with controlled temperature and a DS6 heated conductivity cell detector. Chromeleon Software version 6.8 (Thermo Fisher, Waltham, MA, USA) was used for data acquisition and elaboration. During the analysis, samples were maintained at 25 ± 1 °C. The stationary phase used for the separation was a Dionex IonPac AS9-HC column (4 × 250 mm), with the temperature controlled at 30 ± 1 °C using a column oven. A Dionex AERS500 carbonate (4 mm) electrolytically regenerated suppressor, with an electrical current of 58 mA, was used during the analyses. The DS6 heated conductivity cell detector was thermostated at 30 ± 1 °C with autozero enabled.
A schematic representation of the instrument is reported in Figure 2.

3.3. Standard Solution Preparation

The stock solutions (SSs) of ten anion standards were prepared in mobile phase, consisting of 9 mM sodium carbonate, for which their concentrations are reported in Table 2. The working solutions used for the validation procedure were obtained by diluting the stock solution (SS) in volumetric flasks using mobile phase. The SS was stable at room temperature for three days; meanwhile, at +4 °C, the SS remained stable for longer (ten days). Based on this, it is preferrable to store the SS in the fridge.

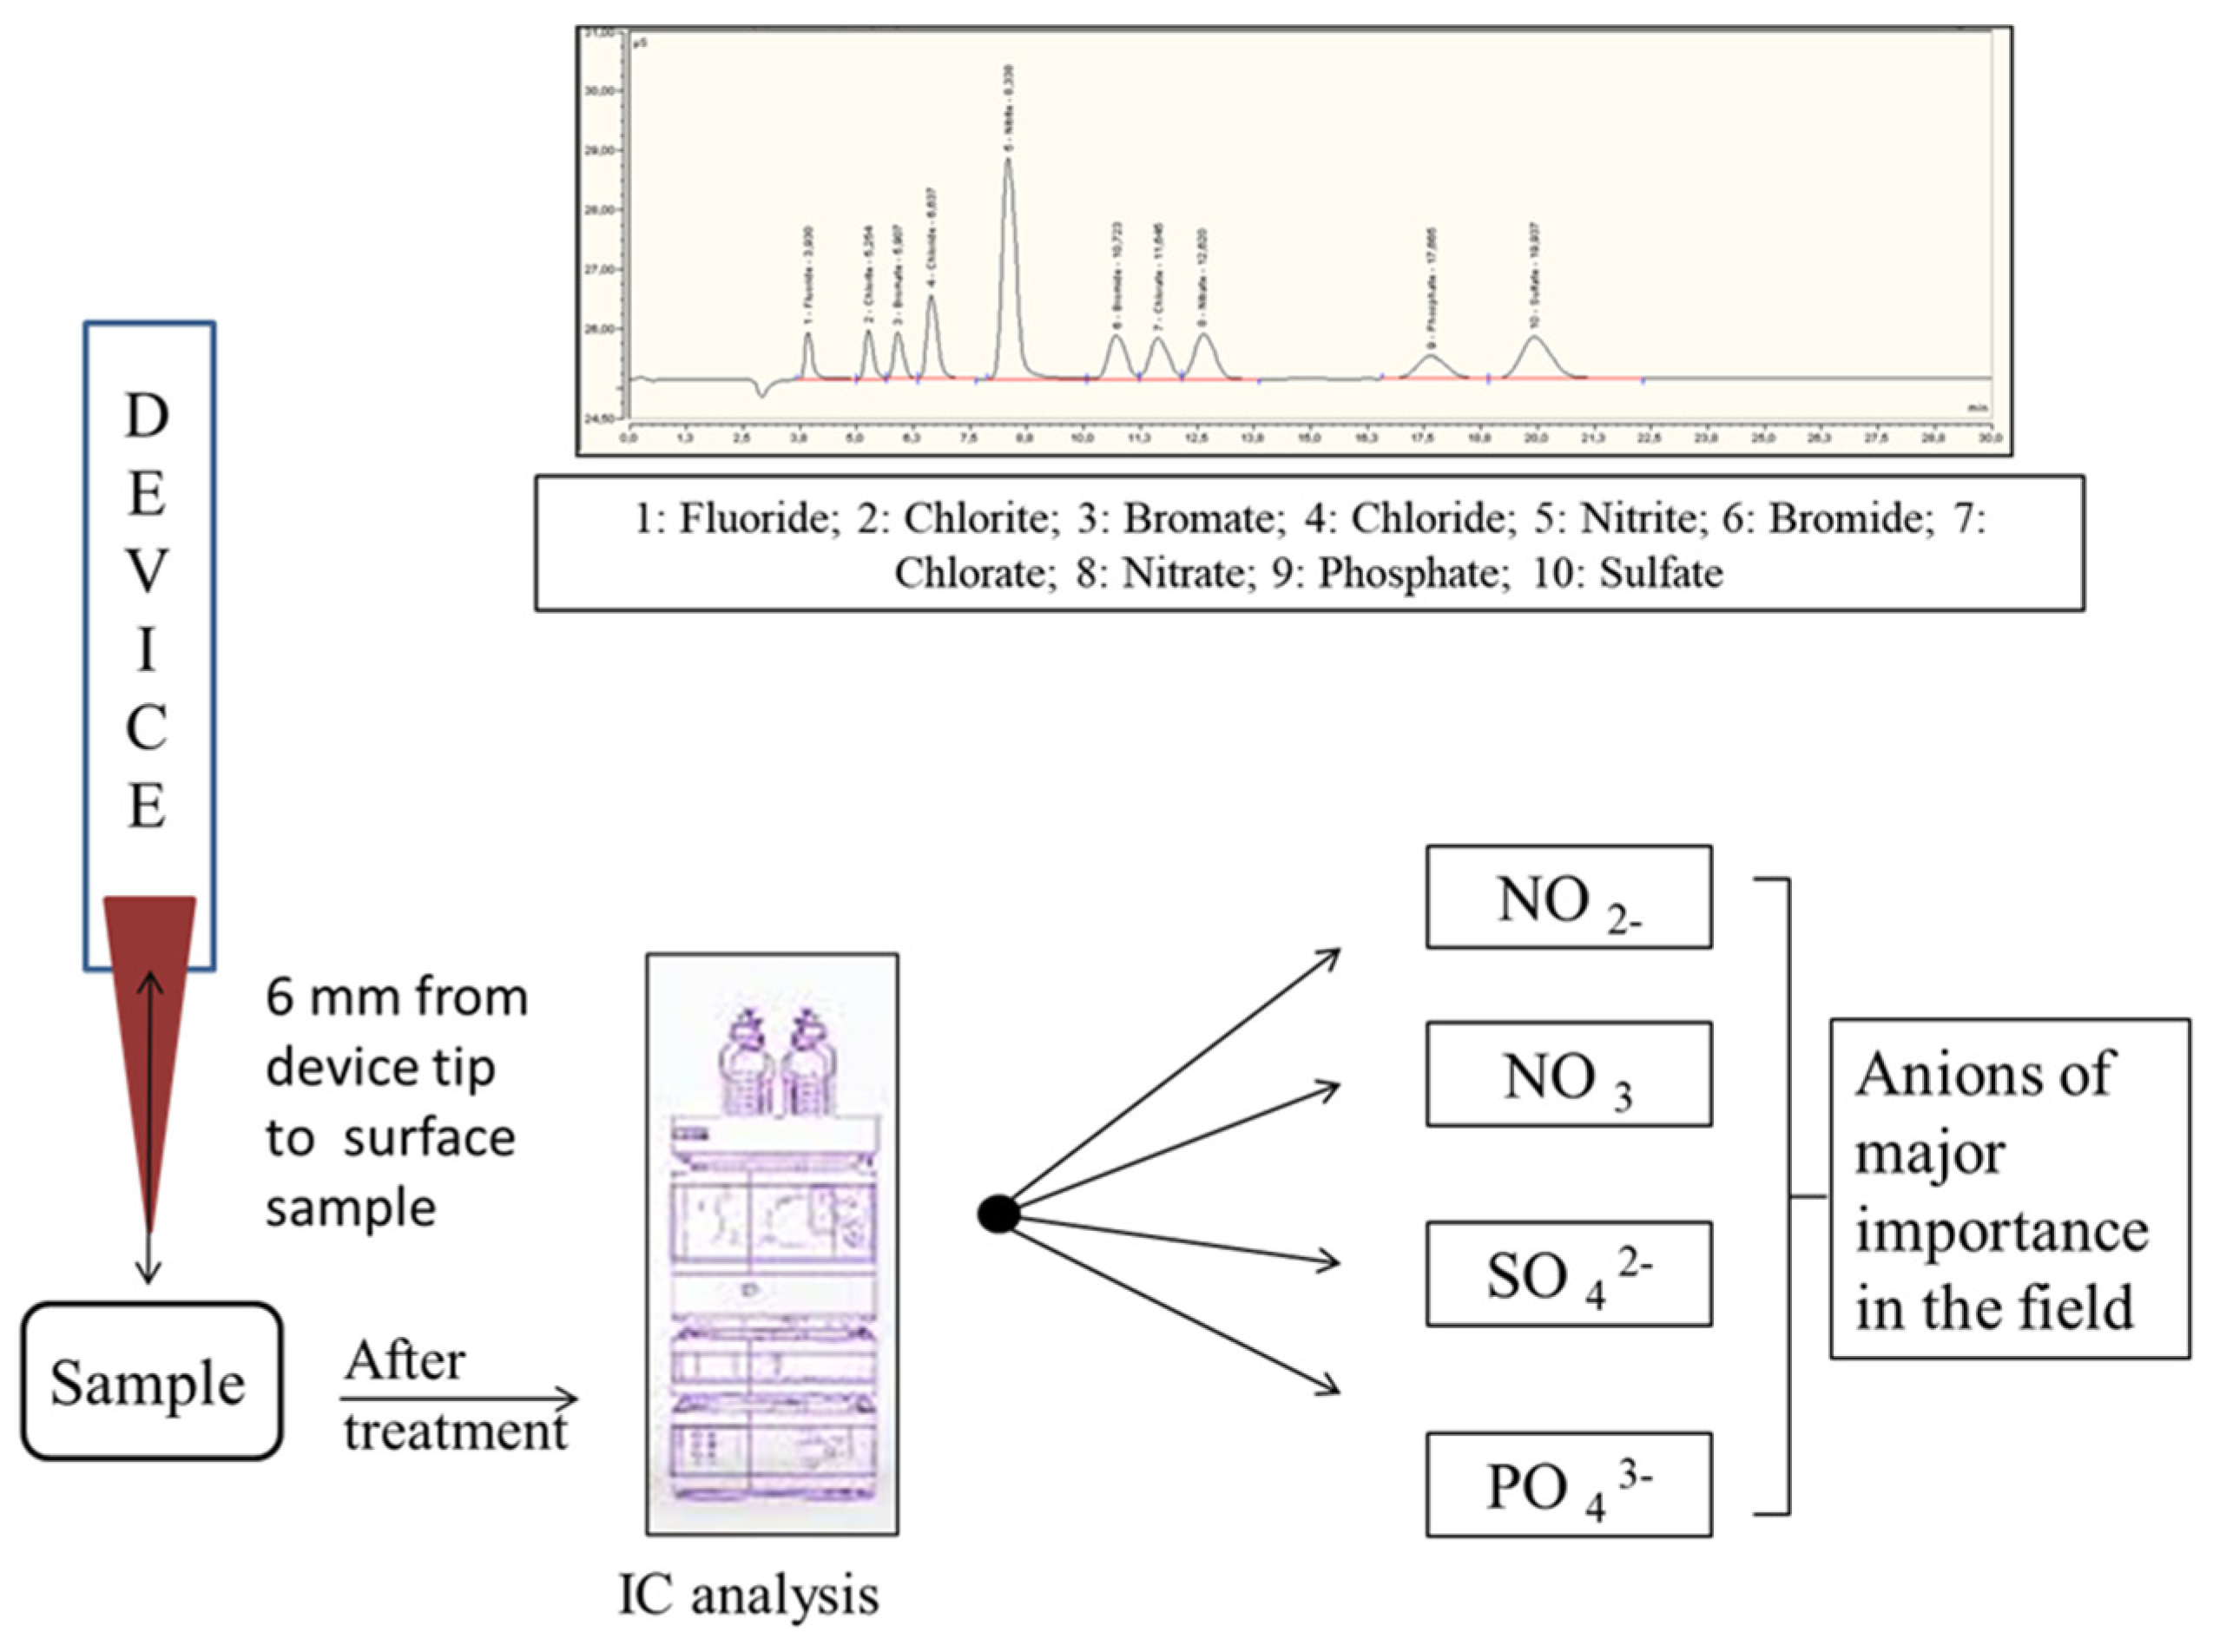
3.4. Sample Preparation

A volume of 2 or 5 mL of the chosen medium was placed in transparent tubes held by a transparent rack. Transparency was essential to ensure the visibility of both the medium and the plasma plume. For the selected protocol, the plasma plume of the device was positioned 6 mm away from the surface of the media. Then, the device was switched on, directing the plasma flow perpendicularly to the center of the medium’s surface. A timer was used to measure the exposure time of each medium sample to the plasma. At the end of the designed exposure time (5, 10, 20 min), the device was turned off, and the activated medium was transferred into a vial for IC analysis. The samples were then injected into the IC system and subsequently kept at 37 °C until the next analysis.
Figure 3 presents a schematic representation of the sample treatment process, including the volumes and exposure times used in this study.

3.5. IC Analysis

To separate 10 anions, a 9 mM solution with Na2CO3 in MilliQ water was prepared. After sonication, the chromatographic system and the computer were turned on, whereas the “Chromeleon” software was used for the separation and quantification of the samples. Once the system was conditioned to minimize the noise floor, the analysis began. Immediately following the sample treatment, as described in Section 3.2, the solution was filtered and injected, without requiring dilution (as shown in Figure 1, where blank matrix are reported). Treated samples were reanalyzed after 24, 48, and 72 h (without any further treatment) to investigate the analytes’ profile. During this time, samples were stored at 37 °C.
For long-term storage (over one week), the instrument and column were washed with a solution containing 100 mM sodium bicarbonate, while the suppressor was turned off. Subsequently, the suppressor was cleaned with HPW. Figure 4 provides a simplified illustration of the protocol and the corresponding chromatogram.

3.6. Software

Chromeleon was utilized for the analysis. This software operates based on specific parameters and, upon the completion of the chromatographic run, generates a chromatogram displaying the peaks corresponding to the analytes present in the analysis. These peaks are converted into concentrations (µg/mL) using a calibration curve derived from the analysis of solutions with varying analyte concentrations. For the calibration curve and statistical analysis, GraphPad Prism 9.0 Software (GraphPad Software, Inc., San Diego, CA, USA) was employed. Specifically, experiments were repeated 3 times, with the results reported as averages and standard deviations. A two-way ANOVA test was performed for statistical evaluation.

4. Conclusions

This study highlights the versatility and potential of IC as a key analytical tool for the chemical characterization of PTL. Its applicability extends to various experimental conditions, including variations in CAP power, distances, volumes, and exposure times, which are likely to yield further meaningful insights. IC enables the simultaneous quantification of nitrite, nitrate, and other anions, establishing a linear correlation between biological responses and chemical composition.
Traditional methods for quantifying anion species often rely on complex or toxic chemical reactions and can be time-consuming, leading to inefficiencies. Moreover, spectrophotometric methods, while widely used, lack the sensitivity and accuracy that liquid chromatography offers. With IC, a single chromatographic run allows for the detection and quantification of 10 different anions, providing a comprehensive overview of the chemical landscape. This holistic approach has the potential to significantly enhance the understanding of biological effects and improve the reproducibility and relevance of experimental results.

Supplementary Materials

The following supporting information can be downloaded at: https://www.mdpi.com/article/10.3390/ph18020199/s1, Table S1: “PK parameters”; Figure S1: “Chromatograms of DMEM at 24 and 72 h”.

Author Contributions

M.L.: conceptualization, investigation, methodology, validation, formal analysis, data curation, and writing—original draft preparation. M.P.: investigation, methodology, validation, formal analysis, data curation, and writing—original draft preparation. M.B.: formal analysis, methodology, and writing—review and editing. T.-R.A.: resources and writing—original draft preparation. N.-K.K.: resources and writing—review and editing. E.-H.C.: resources and writing—original draft preparation. M.R.: investigation. V.P.: funding acquisition, project administration, writing—original draft preparation and writing-review and editing. All authors have read and agreed to the published version of the manuscript.

Funding

This research was funded by NextGenerationEU—MUR, Fondo Promozione e Sviluppo, DM 737/2021—Project title: COld atmospheric plasma therapy to target head and neck Tumours by A multImodaL approach; Acronym: Cocktail; CUP number: D75F21003210001 and by PRINPNRR 2022-P2022F4P8P Bi-functioNal plasma-treated solutions as a new thErapeutiC Tool for cAnceR Acronym: NECTAR; CUP number: D53D23021600001. This study was also supported by the National Research Foundation (NRF) of Korea, funded by the Korean government, 2021R1A6A1A03038785. Marcello Locatelli and Vittoria Perrotti acknowledge financial support funded by the European Union NextGenerationEU, under the National Recovery and Resilience Plan (NRRP), Mission 4 Component 2, M4C2, Investment 1.5, Call for tender No. 3277 of 30.12.2021, Italian Ministry of University, Award Number: ECS00000041, Project Title: Innovation, digitalization and sustainability for the diffused economy in Central Italy, Concession Degree No. 1057 of 23 June 2022 adopted by the Italian Ministry of University. CUP: D73C22000840006. The preliminary data of this work were presented at the 2nd Training School—Cold Plasmas to fight microorganisms, viruses & toxins for medical and agricultural applications—13–16 February 2023, Bari, Italy. We also thank COST Actions CA20114 (Therapeutical Applications of Cold Plasmas) for the stimulating environment provided.

Institutional Review Board Statement

Not applicable.

Informed Consent Statement

Not applicable.

Data Availability Statement

Data is contained within the article.

Acknowledgments

The authors would like to thank all respective universities for the support provided in the literature survey. The authors are grateful to Viviana di Giacomo for her role as supervisor of M.B. and M.R. throughout this research.

Conflicts of Interest

The authors declare that they have no known competing financial interests or personal relationships that could have appeared to influence the work reported in this paper.

References

  1. Tornin, J.; Labay, C.; Tampieri, F.; Ginebra, M.P.; Canal, C. Evaluation of the effects of cold atmospheric plasma and plasma-treated liquids in cancer cell cultures. Nat. Protoc. 2021, 16, 2826–2850. [Google Scholar] [CrossRef]
  2. Lu, X.; Naidis, G.V.; Laroussi, M.; Reuter, S.; Graves, D.B.; Ostrikov, K. Reactive species in non-equilibrium atmospheric-pressure plasmas: Generation, transport, and biological effects. Phys. Rep. 2016, 630, 1–84. [Google Scholar] [CrossRef]
  3. Veronico, V.; Morelli, S.; Piscioneri, A.; Gristina, R.; Casiello, M.; Favia, P.; Armenise, V.; Fracassi, F.; De Bartolo, L.; Sardella, E. Anticancer Effects of Plasma-Treated Water Solutions from Clinically Approved Infusion Liquids Supplemented with Organic Molecules. ACS Omega 2023, 8, 33723–33736. [Google Scholar] [CrossRef] [PubMed]
  4. Negi, M.; Kaushik, N.; Nguyen, L.N.; Choi, E.H.; Kaushik, N.K. Argon gas plasma-treated physiological solutions stimulate immunogenic cell death and eradicates immunosuppressive CD47 protein in lung carcinoma. Free Radic. Biol. Med. 2023, 201, 26–40. [Google Scholar] [CrossRef] [PubMed]
  5. Gay-Mimbrera, J.; Garica, M.C.; Isla-Tejera, B.; Rodero-Serrano, A.; Garcia-Nieto, A.V.; Ruano, J. Clinical and Biological Principles of Cold Atmospheric Plasma Application in Skin Cancer. Adv. Ther. 2016, 33, 894–909. [Google Scholar] [CrossRef] [PubMed]
  6. Sklias, K.; Sousa, J.S.; Girard, P.M. Role of short- and long-lived reactive species on the selectivity and anti-cancer action of plasma treatment in vitro. Cancers 2021, 13, 615. [Google Scholar] [CrossRef] [PubMed]
  7. Graves, D.B. Reactive species from cold atmospheric plasma: Implications for cancer therapy. Plasma Process. Polym. 2014, 11, 1120–1127. [Google Scholar] [CrossRef]
  8. Jablonowski, H.; von Woedtke, T. Research on plasma medicine-relevant plasma-liquid interaction: What happened in the past five years? Clin. Plasma Med. 2015, 3, 42–52. [Google Scholar] [CrossRef]
  9. Locatelli, M.; Kabir, A.; Perrucci, M.; Ulusoy, S.; Ulusoy, H.I.; Ali, I. Green profile tools: Current status and future perspectives. Adv. Sample Prep. 2023, 6, 100068. [Google Scholar] [CrossRef]
  10. Haddad, P.R. Ion chromatography. Anal. Bioanal. Chem. 2004, 379, 341–343. [Google Scholar] [CrossRef] [PubMed]
  11. Zhang, Y.; Huo, M.; Zhou, J.; Xie, S. PKSolver: An add-in program for pharmacokinetic and Pharmacodynamic data analysis in Microsoft Excel. Comput. Methods Programs Biomed. 2010, 99, 306–314. [Google Scholar] [CrossRef] [PubMed]
  12. di Giacomo, V.; Balaha, M.; Pinti, M.; Di Marcantonio, M.C.; Cela, I.; Acharya, T.R.; Kaushik, N.K.; Choi, E.H.; Mincione, G.; Sala, G.; et al. Cold atmospheric plasma activated media selectively affects human head and neck cancer cell lines. Oral Dis. 2024, in press. [Google Scholar] [CrossRef]
  13. Acharya, T.R.; Lamichhane, P.; Jaiswal, A.; Amsalu, K.; Hong, Y.J.; Kaushik, N.; Kaushik, N.K.; Choi, E.H. The potential of multicylindrical dielectric barrier discharge plasma for diesel-contaminated soil remediation and biocompatibility assessment. Environ. Res. 2024, 240, 117398. [Google Scholar] [CrossRef] [PubMed]
  14. Acharya, T.R.; Lamichhane, P.; Jaiswal, A.; Kaushik, N.; Kaushik, N.K. Evaluation of degradation efficacy and toxicity mitigation for 4-nitrophenol using argon and air-mixed argon plasma jets. Chemosphere 2024, 358, 142211. [Google Scholar] [CrossRef] [PubMed]
  15. FDA. Bioanalytical Method Validation Guidance for Industry. 2018. Available online: https://www.fda.gov/regulatory-information/search-fda-guidance-documents/bioanalytical-method-validation-guidance-industry (accessed on 28 January 2025).
  16. European Medicines Agency. ICH M10 on Bioanalytical Method Validation–Scientific Guideline. 2019. Available online: https://www.ema.europa.eu/en/ich-m10-bioanalytical-method-validation-scientific-guideline (accessed on 28 January 2025).
  17. Ich Official Web Site: Ich. 2023. Available online: https://www.ich.org/fileadmin/Publi%20c_Web_Site/ICH_Products/Guidelines/Quality/Q2_R1/Step4/Q2_R1_Guideline (accessed on 28 January 2025).
  18. Zhang, Y.; Du, X.; Shi, Q.; Xiao, W.; Li, H. Precise Control of Glioma Cell Apoptosis Induced by Micro-Plasma-Activated Water (μ-PAW). Micromachines 2022, 13, 2145. [Google Scholar] [CrossRef] [PubMed]
  19. Yap, Q.; Xu, H.; Zhuang, J.; Cui, D.; Ma, R.; Jiao, Z. Inhibition of Fungal Growth and Aflatoxin B1 Synthesis in Aspergillus flavus by Plasma-Activated Water. Foods 2023, 12, 2490. [Google Scholar] [CrossRef] [PubMed]
  20. Martin, A.J.; Shackleford, D.M.; Charman, S.A.; Wagstaff, K.M.; Porter, C.J.H.; Jans, D.A. Increased In Vivo Exposure of N-(4-Hydroxyphenyl) Retinamide (4-HPR) to Achieve Plasma Concentrations Effective against Dengue Virus. Pharmaceutics 2023, 15, 1974. [Google Scholar] [CrossRef] [PubMed]
Figure 1. Chromatogram obtained in analyzing IC media without plasma activation. (A): DMEM 1:1; (B): McCOY 1:1; (C): RPMI 1:1; (D): DMEM 1:1000; (E): McCOY considering retention time (and stdev) of analytes of interest; (F): RPMI considering retention time (and stdev) of analytes of interest; the rectangles represent each analyte= 1: fluoride, 2: chlorite; 3: bromate, 4: chloride, 5: nitrite, 6: bromide, 7: chlorate, 8: nitrate, 9: phosphate, 10: sulfate.
Pharmaceuticals 18 00199 g001
Figure 2. Representation of the instrument used: 1: mobile phase; 2: pump that picks up and pushes mobile phase; 3: injection valve; 4: autosampler with vials containing samples; 5: stationary phase; 6: conductivity detector; 7: computer with Chromeleon.
Pharmaceuticals 18 00199 g002
Figure 3. Simplified illustration of plasma-treated liquid (PTL) production using (a) 2 mL and (b) 5 mL of media.
Pharmaceuticals 18 00199 g003
Figure 4. Schematic representation of the protocol reported and the chromatogram obtained from analysis.
Pharmaceuticals 18 00199 g004
Table 1. Analytical parameters used for anion quantification.
AnalyteSlopeInterceptLinearity aWeighting Factorr2LODLOQ
Fluoride0.12660.0035490.0275–2.71/X20.99850.0010.0275
Chlorite0.040680.0000292360.101–100.99730.0340.1010
Bromate0.022160.0000469630.202–200.99840.0670.2020
Chloride0.10450.016630.091–90.99300.0300.0910
Nitrite0.21990.00060670.152–150.99970.0500.1520
Bromide0.00039990.00020640.182–180.99890.0600.1820
Chlorate0.034620.00062500.202–200.99820.0670.2020
Nitrate0.047680.0036280.182–180.99940.0600.1820
Phosphate0.021010.00074200.273–270.99850.0110.2730
Sulfate0.068020.0028540.182–180.99760.0600.1820
a expressed as µg/mL.
Table 2. Concentration of each anion calculated for SS.
AnalyteFlClO2BrO3ClNO2BrClO3NO3PO4SO4
Conc
[µg/mL]
2.710189151820182718
Disclaimer/Publisher’s Note: The statements, opinions and data contained in all publications are solely those of the individual author(s) and contributor(s) and not of MDPI and/or the editor(s). MDPI and/or the editor(s) disclaim responsibility for any injury to people or property resulting from any ideas, methods, instructions or products referred to in the content.

