
A Machine Learning Platform for Isoform-Specific Identification and Profiling of Human Carbonic Anhydrase Inhibitors

 , , ,
, , ,  ,
,  , ,
, ,  , ,
, ,  and
and 
Abstract

1. Introduction
2. Results
2.1. Data Retrieval and Datasets Inspection
2.2. Models Development and Evaluation
2.3. Virtual Screening and Results Analysis
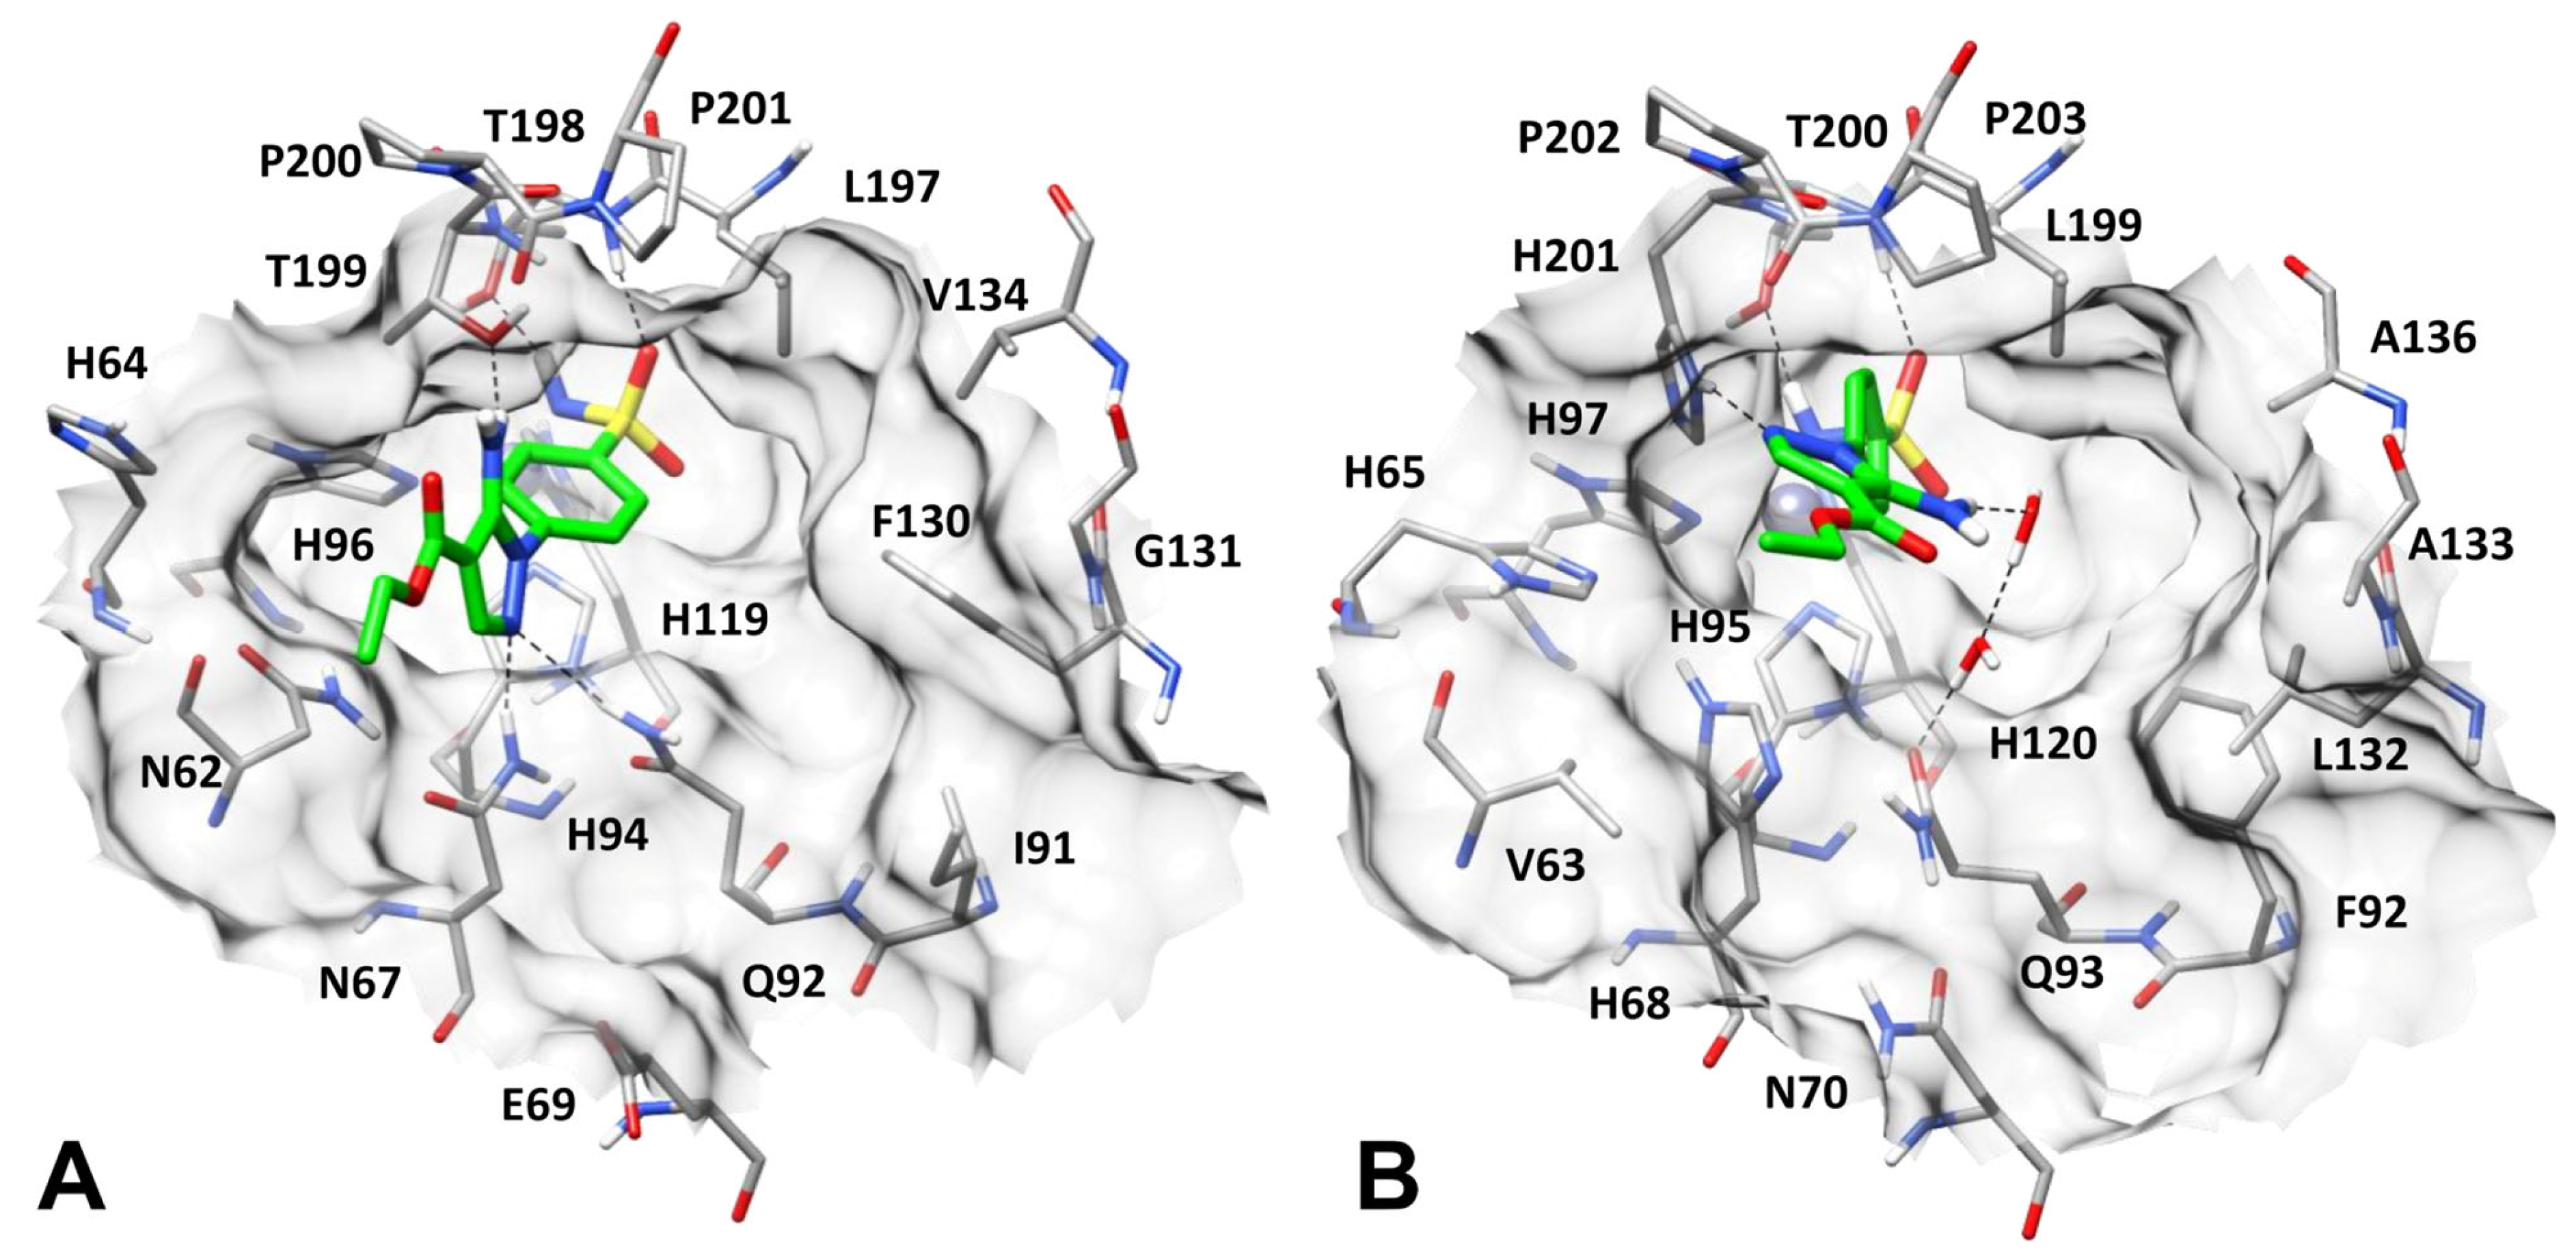
2.4. Binding Mode Analysis of Compound 1
2.5. Machine Learning-Based Feature Importance Analysis of Compound 1
3. Discussion
4. Materials and Methods
4.1. Modeling Datasets
4.2. Molecular Representations
4.3. Machine Learning Algorithms
4.4. Performance and Similarity Metrics
4.5. Models Development and Cross Validation
4.6. Virtual Screening Dataset and Compounds Selection Criteria
4.7. Carbonic Anhydrases In Vitro Inhibition Test
4.8. Molecular Dynamics Simulations
4.9. Ensemble Docking
4.10. Feature Contributions and Importance Mapping
5. Conclusions
Supplementary Materials
Author Contributions
Funding
Institutional Review Board Statement
Informed Consent Statement
Data Availability Statement
Conflicts of Interest
References
- Supuran, C.T. Multi- and Polypharmacology of Carbonic Anhydrase Inhibitors. Pharmacol. Rev. 2025, 77, 100004. [Google Scholar] [CrossRef] [PubMed]
- Supuran, C.T. A Simple yet Multifaceted 90 Years Old, Evergreen Enzyme: Carbonic Anhydrase, Its Inhibition and Activation. Bioorg Med. Chem. Lett. 2023, 93, 129411. [Google Scholar] [CrossRef] [PubMed]
- Grüneberg, S.; Stubbs, M.T.; Klebe, G. Successful Virtual Screening for Novel Inhibitors of Human Carbonic Anhydrase: Strategy and Experimental Confirmation. J. Med. Chem. 2002, 45, 3588–3602. [Google Scholar] [CrossRef] [PubMed]
- Poli, G.; Jha, V.; Martinelli, A.; Supuran, C.; Tuccinardi, T. Development of a Fingerprint-Based Scoring Function for the Prediction of the Binding Mode of Carbonic Anhydrase II Inhibitors. Int. J. Mol. Sci. 2018, 19, 1851. [Google Scholar] [CrossRef]
- Cheng, T.; Wang, N.; Wen, R.; Wang, S.; Zhang, H.; Cheng, M. Discovery of Non-Sulfonamide Carbonic Anhydrase IX Inhibitors through Structure-Based Virtual Screening. Phys. Chem. Chem. Phys. 2024, 26, 8767–8774. [Google Scholar] [CrossRef]
- Salmas, R.E.; Senturk, M.; Yurtsever, M.; Durdagi, S. Discovering Novel Carbonic Anhydrase Type IX (CA IX) Inhibitors from Seven Million Compounds Using Virtual Screening and in Vitro Analysis. J. Enzyme Inhib. Med. Chem. 2016, 31, 425–453. [Google Scholar] [CrossRef]
- Yang, M.; Tao, B.; Chen, C.; Jia, W.; Sun, S.; Zhang, T.; Wang, X. Machine Learning Models Based on Molecular Fingerprints and an Extreme Gradient Boosting Method Lead to the Discovery of JAK2 Inhibitors. J. Chem. Inf. Model. 2019, 59, 5002–5012. [Google Scholar] [CrossRef]
- Chen, X.; Xie, W.; Yang, Y.; Hua, Y.; Xing, G.M.; Liang, L.; Deng, C.; Wang, Y.; Fan, Y.; Liu, H.; et al. Discovery of Dual FGFR4 and EGFR Inhibitors by Machine Learning and Biological Evaluation. J. Chem. Inf. Model. 2020, 60, 4640–4652. [Google Scholar] [CrossRef]
- Tran-Nguyen, V.K.; Junaid, M.; Simeon, S.; Ballester, P.J. A Practical Guide to Machine-Learning Scoring for Structure-Based Virtual Screening. Nat. Protoc. 2023, 18, 3460–3511. [Google Scholar] [CrossRef]
- Shen, Z.; Seabra, G.; Brant, J.; Shirlekar, K.; Deleyrolle, L.; Lewis, B.; Li, C. Discovery of PRMT5 N-Terminal TIM Barrel Ligands from Machine-Learning-Based Virtual Screening. ACS Omega 2025, 10, 1156–1163. [Google Scholar] [CrossRef]
- Di Stefano, M.; Galati, S.; Ortore, G.; Caligiuri, I.; Rizzolio, F.; Ceni, C.; Bertini, S.; Bononi, G.; Granchi, C.; Macchia, M.; et al. Machine Learning-Based Virtual Screening for the Identification of Cdk5 Inhibitors. Int. J. Mol. Sci. 2022, 23, 10653. [Google Scholar] [CrossRef] [PubMed]
- Kırboğa, K.K.; Işık, M. Explainable Artificial Intelligence in the Design of Selective Carbonic Anhydrase I-II Inhibitors via Molecular Fingerprinting. J. Comput. Chem. 2024, 45, 1530–1539. [Google Scholar] [CrossRef] [PubMed]
- Kim, M.J.; Pandit, S.; Jee, J.G. Discovery of Kinase and Carbonic Anhydrase Dual Inhibitors by Machine Learning Classification and Experiments. Pharmaceuticals 2022, 15, 236. [Google Scholar] [CrossRef] [PubMed]
- Galati, S.; Yonchev, D.; Rodríguez-Pérez, R.; Vogt, M.; Tuccinardi, T.; Bajorath, J. Predicting Isoform-Selective Carbonic Anhydrase Inhibitors via Machine Learning and Rationalizing Structural Features Important for Selectivity. ACS Omega 2021, 6, 4080–4089. [Google Scholar] [CrossRef]
- Tinivella, A.; Pinzi, L.; Rastelli, G. Prediction of Activity and Selectivity Profiles of Human Carbonic Anhydrase Inhibitors Using Machine Learning Classification Models. J. Cheminform. 2021, 13, 18. [Google Scholar] [CrossRef]
- Krasavin, M.; Shetnev, A.; Sharonova, T.; Baykov, S.; Tuccinardi, T.; Kalinin, S.; Angeli, A.; Supuran, C.T. Heterocyclic Periphery in the Design of Carbonic Anhydrase Inhibitors: 1,2,4-Oxadiazol-5-Yl Benzenesulfonamides as Potent and Selective Inhibitors of Cytosolic HCA II and Membrane-Bound HCA IX Isoforms. Bioorg. Chem. 2018, 76, 88–97. [Google Scholar] [CrossRef]
- Zdrazil, B.; Felix, E.; Hunter, F.; Manners, E.J.; Blackshaw, J.; Corbett, S.; de Veij, M.; Ioannidis, H.; Lopez, D.M.; Mosquera, J.F.; et al. The ChEMBL Database in 2023: A Drug Discovery Platform Spanning Multiple Bioactivity Data Types and Time Periods. Nucleic Acids Res. 2024, 52, D1180–D1192. [Google Scholar] [CrossRef]
- Blanco-González, A.; Cabezón, A.; Seco-González, A.; Conde-Torres, D.; Antelo-Riveiro, P.; Piñeiro, Á.; Garcia-Fandino, R. The Role of AI in Drug Discovery: Challenges, Opportunities, and Strategies. Pharmaceuticals 2023, 16, 891. [Google Scholar] [CrossRef]
- Pedregosa, F.; Varoquaux, G.; Gramfort, A.; Michel, V.; Thirion, B.; Grisel, O.; Blondel, M.; Müller, A.; Nothman, J.; Louppe, G.; et al. Scikit-Learn: Machine Learning in Python. J. Mach. Learn. Res. 2011, 12, 2825–2830. [Google Scholar]
- Chicco, D.; Jurman, G. The Matthews Correlation Coefficient (MCC) Should Replace the ROC AUC as the Standard Metric for Assessing Binary Classification. BioData Min. 2023, 16, 4. [Google Scholar] [CrossRef]
- Baell, J.B.; Holloway, G.A. New Substructure Filters for Removal of Pan Assay Interference Compounds (PAINS) from Screening Libraries and for Their Exclusion in Bioassays. J. Med. Chem. 2010, 53, 2719–2740. [Google Scholar] [CrossRef] [PubMed]
- Galati, S.; Di Stefano, M.; Macchia, M.; Poli, G.; Tuccinardi, T. MolBook UNIPI─Create, Manage, Analyze, and Share Your Chemical Data for Free. J. Chem. Inf. Model. 2023, 63, 3977–3982. [Google Scholar] [CrossRef] [PubMed]
- Brenk, R.; Schipani, A.; James, D.; Krasowski, A.; Gilbert, I.H.; Frearson, J.; Wyatt, P.G. Lessons Learnt from Assembling Screening Libraries for Drug Discovery for Neglected Diseases. ChemMedChem 2008, 3, 435–444. [Google Scholar] [CrossRef]
- Pearce, B.C.; Sofia, M.J.; Good, A.C.; Drexler, D.M.; Stock, D.A. An Empirical Process for the Design of High-Throughput Screening Deck Filters. J. Chem. Inf. Model. 2006, 46, 1060–1068. [Google Scholar] [CrossRef]
- Schuffenhauer, A.; Schneider, N.; Hintermann, S.; Auld, D.; Blank, J.; Cotesta, S.; Engeloch, C.; Fechner, N.; Gaul, C.; Giovannoni, J.; et al. Evolution of Novartis’ Small Molecule Screening Deck Design. J. Med. Chem. 2020, 63, 14425–14447. [Google Scholar] [CrossRef]
- Di Stefano, M.; Galati, S.; Piazza, L.; Granchi, C.; Mancini, S.; Fratini, F.; Macchia, M.; Poli, G.; Tuccinardi, T. VenomPred 2.0: A Novel In Silico Platform for an Extended and Human Interpretable Toxicological Profiling of Small Molecules. J. Chem. Inf. Model. 2023, 64, 2275–2289. [Google Scholar] [CrossRef]
- Swenson, E.R. Safety of Carbonic Anhydrase Inhibitors. Expert. Opin. Drug Saf. 2014, 13, 459–472. [Google Scholar] [CrossRef]
- Zhu, T.; Cao, S.; Su, P.C.; Patel, R.; Shah, D.; Chokshi, H.B.; Szukala, R.; Johnson, M.E.; Hevener, K.E. Hit Identification and Optimization in Virtual Screening: Practical Recommendations Based on a Critical Literature Analysis. J. Med. Chem. 2013, 56, 6560–6572. [Google Scholar] [CrossRef]
- Al-Asri, J.; Fazekas, E.; Lehoczki, G.; Perdih, A.; Görick, C.; Melzig, M.F.; Gyémánt, G.; Wolber, G.; Mortier, J. From Carbohydrates to Drug-like Fragments: Rational Development of Novel α-Amylase Inhibitors. Bioorg. Med. Chem. 2015, 23, 6725–6732. [Google Scholar] [CrossRef]
- Mallya, M.; Phillips, R.L.; Saldanha, S.A.; Gooptu, B.; Leigh Brown, S.C.; Termine, D.J.; Shirvani, A.M.; Wu, Y.; Sifers, R.N.; Abagyan, R.; et al. Small Molecules Block the Polymerization of Z Alpha1-Antitrypsin and Increase the Clearance of Intracellular Aggregates. J. Med. Chem. 2007, 50, 5357–5363. [Google Scholar] [CrossRef]
- Brvar, M.; Perdih, A.; Oblak, M.; Mašič, L.P.; Solmajer, T. In Silico Discovery of 2-Amino-4-(2,4-Dihydroxyphenyl)Thiazoles as Novel Inhibitors of DNA Gyrase B. Bioorg. Med. Chem. Lett. 2010, 20, 958–962. [Google Scholar] [CrossRef] [PubMed]
- Cascioferro, S.; Maggio, B.; Raffa, D.; Raimondi, M.V.; Cusimano, M.G.; Schillaci, D.; Manachini, B.; Plescia, F.; Daidone, G. Synthesis and Biofilm Formation Reduction of Pyrazole-4-Carboxamide Derivatives in Some Staphylococcus Aureus Strains. Eur. J. Med. Chem. 2016, 123, 58–68. [Google Scholar] [CrossRef]
- Aiello, D.; Barnes, M.H.; Biswas, E.E.; Biswas, S.B.; Gu, S.; Williams, J.D.; Bowlin, T.L.; Moir, D.T. Discovery, Characterization and Comparison of Inhibitors of Bacillus Anthracis and Staphylococcus Aureus Replicative DNA Helicases. Bioorg. Med. Chem. 2009, 17, 4466–4476. [Google Scholar] [CrossRef] [PubMed]
- Antonova-Koch, Y.; Meister, S.; Abraham, M.; Luth, M.R.; Ottilie, S.; Lukens, A.K.; Sakata-Kato, T.; Vanaerschot, M.; Owen, E.; Jado Rodriguez, J.C.; et al. Open-Source Discovery of Chemical Leads for next-Generation Chemoprotective Antimalarials. Science 2018, 362, eaat9446. [Google Scholar] [CrossRef]
- Abraham, M.; Gagaring, K.; Martino, M.L.; Vanaerschot, M.; Plouffe, D.M.; Calla, J.; Godinez-Macias, K.P.; Du, A.Y.; Wree, M.; Antonova-Koch, Y.; et al. Probing the Open Global Health Chemical Diversity Library for Multistage-Active Starting Points for Next-Generation Antimalarials. ACS Infect. Dis. 2020, 6, 613–628. [Google Scholar] [CrossRef]
- Cross, P.E.; Dickinson, R.P.; Parry, M.J.; Randall, M.J. Selective Thromboxane Synthetase Inhibitors. 1. 1-[(Aryloxy)Alkyl]-1H-Imidazoles. J. Med. Chem. 1985, 28, 1427–1432. [Google Scholar] [CrossRef]
- Al-Nadaf, A.; Sheikha, G.A.; Taha, M.O. Elaborate Ligand-Based Pharmacophore Exploration and QSAR Analysis Guide the Synthesis of Novel Pyridinium-Based Potent Beta-Secretase Inhibitory Leads. Bioorg. Med. Chem. 2010, 18, 3088–3115. [Google Scholar] [CrossRef]
- Lundberg, S.M.; Erion, G.; Chen, H.; DeGrave, A.; Prutkin, J.M.; Nair, B.; Katz, R.; Himmelfarb, J.; Bansal, N.; Lee, S.-I. From Local Explanations to Global Understanding with Explainable AI for Trees. Nat. Mach. Intell. 2020, 2, 56–67. [Google Scholar] [CrossRef]
- Cunha, L.B.; Freitas, H.F.; Castilho, M.S. Hologram- and Descriptor-Based QSAR Studies for a Series of Non-Azoles Derivatives Active against C. Neoformans. J. Braz. Chem. Soc. 2013, 24, 1623–1634. [Google Scholar] [CrossRef]
- Myint, K.Z.; Xie, X.Q. Recent Advances in Fragment-Based QSAR and Multi-Dimensional QSAR Methods. Int. J. Mol. Sci. 2010, 11, 3846–3866. [Google Scholar] [CrossRef]
- ROCS 3.7.0.0 OpenEye; Cadence Molecular Sciences: Santa Fe, NM, USA, 2010. Available online: http://www.eyesopen.com (accessed on 3 December 2023).
- Bajusz, D.; Rácz, A.; Héberger, K. Why Is Tanimoto Index an Appropriate Choice for Fingerprint-Based Similarity Calculations? J. Cheminform. 2015, 7, 20. [Google Scholar] [CrossRef] [PubMed]
- Landrum, G. RDKit: Open-Source Cheminformatics. Available online: https://www.rdkit.org (accessed on 1 February 2023).
- Cereto-Massagué, A.; Ojeda, M.J.; Valls, C.; Mulero, M.; Garcia-Vallvé, S.; Pujadas, G. Molecular Fingerprint Similarity Search in Virtual Screening. Methods 2015, 71, 58–63. [Google Scholar] [CrossRef] [PubMed]
- Noble, W.S. What Is a Support Vector Machine? Nat. Biotechnol. 2006, 24, 1565–1567. [Google Scholar] [CrossRef] [PubMed]
- Ralaivola, L.; Swamidass, S.J.; Saigo, H.; Baldi, P. Graph Kernels for Chemical Informatics. Neural Netw. 2005, 18, 1093–1110. [Google Scholar] [CrossRef]
- Breiman, L. Random Forests. Mach. Learn. 2001, 45, 5–32. [Google Scholar] [CrossRef]
- Zhang, Z. Introduction to Machine Learning: K-Nearest Neighbors. Ann. Transl. Med. 2016, 4, 218. [Google Scholar] [CrossRef]
- Enot, D.P.; Gautier, R.; Le Marouille, J.Y. Gaussian Process: An Efficient Technique to Solve Quantitative Structure-Property Relationship Problems. SAR QSAR Environ. Res. 2001, 12, 461–469. [Google Scholar] [CrossRef]
- Khalifah, R.G. The Carbon Dioxide Hydration Activity of Carbonic Anhydrase. I. Stop-Flow Kinetic Studies on the Native Human Isoenzymes B and C. J. Biol. Chem. 1971, 246, 2561–2573. [Google Scholar] [CrossRef]
- Casin, A.; Scozzafava, A.; Mincione, F.; Menabuoni, L.; Supuran, C.T. Carbonic Anhydrase Inhibitors: Synthesis of Water Soluble Sulfonamides Incorporating a 4-Sulfamoylphenylmethylthiourea Scaffold, with Potent Intraocular Pressure Lowering Properties. J. Enzyme Inhib. Med. Chem. 2002, 17, 333–343. [Google Scholar] [CrossRef]
- Maresca, A.; Supuran, C.T. Coumarins Incorporating Hydroxy- and Chloro-Moieties Selectively Inhibit the Transmembrane, Tumor-Associated Carbonic Anhydrase Isoforms IX and XII over the Cytosolic Ones I and II. Bioorg. Med. Chem. Lett. 2010, 20, 4511–4514. [Google Scholar] [CrossRef]
- Berman, H.M.; Westbrook, J.; Feng, Z.; Gilliland, G.; Bhat, T.N.; Weissig, H.; Shindyalov, I.N.; Bourne, P.E. The Protein Data Bank. Nucleic Acids Res. 2000, 28, 235–242. [Google Scholar] [CrossRef] [PubMed]
- Case, D.A.; Cheatham, T.E.; Darden, T.; Gohlke, H.; Luo, R.; Merz, K.M.; Onufriev, A.; Simmerling, C.; Wang, B.; Woods, R.J. The Amber Biomolecular Simulation Programs. J. Comput. Chem. 2005, 26, 1668–1688. [Google Scholar] [CrossRef] [PubMed]
- Farag, M.; Kieffer, C.; Guedeney, N.; Voisin-Chiret, A.S.; Sopkova-de Oliveira Santos, J. Computational Tool to Design Small Synthetic Inhibitors Selective for XIAP-BIR3 Domain. Molecules 2023, 28, 5155. [Google Scholar] [CrossRef] [PubMed]
- Roe, D.R.; Cheatham, T.E. PTRAJ and CPPTRAJ: Software for Processing and Analysis of Molecular Dynamics Trajectory Data. J. Chem. Theory Comput. 2013, 9, 3084–3095. [Google Scholar] [CrossRef]
- Verdonk, M.L.; Cole, J.C.; Hartshorn, M.J.; Murray, C.W.; Taylor, R.D. Improved Protein–Ligand Docking Using GOLD. Proteins Struct. Funct. Bioinform. 2003, 52, 609–623. [Google Scholar] [CrossRef]


| hCA I | hCA II | hCA IX | hCA XII | |
|---|---|---|---|---|
| Model | SVM—Morgan FPs | SVM—Morgan FPs | RF—Morgan FPs | RF—Morgan FPs |
| MCC | 0.79 | 0.79 | 0.73 | 0.73 |
| Accuracy | 0.90 | 0.90 | 0.86 | 0.86 |
| Precision | 0.87 | 0.87 | 0.85 | 0.85 |
| Recall | 0.89 | 0.89 | 0.85 | 0.88 |
| Specificity | 0.91 | 0.90 | 0.88 | 0.85 |
| NPV | 0.92 | 0.92 | 0.88 | 0.88 |
| Cpds. | Structure | Experimental Ki (nM) | |||
|---|---|---|---|---|---|
| hCA I | hCA II | hCA IX | hCA XII | ||
| 1 |  | 7.3 | 1.4 | 67.7 | 716.5 |
| 2 | 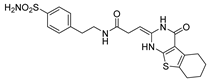 | 1023.0 | 11.6 | 713.1 | 30.6 |
| 3 | 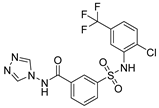 | >100,000 | >100,000 | >100,000 | >100,000 |
| 4 | 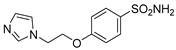 | 36.2 | 6.8 | 2523.8 | 603.0 |
| 5 | 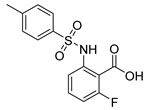 | >100,000 | >100,000 | >100,000 | >100,000 |
| 6 |  | >100,000 | 7050.3 | >100,000 | >100,000 |
| 7 | 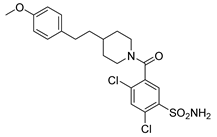 | 2858.1 | 9.8 | 6826.7 | 350.9 |
| 8 | 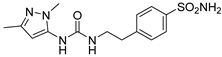 | 1204.8 | 23.9 | 715.4 | 832.5 |
| 9 | 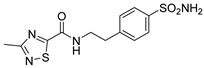 | 212.6 | 443.6 | 728.5 | 568.4 |
| 10 | 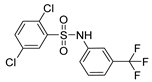 | 31,589 | >100,000 | >100,000 | >100,000 |
| 11 |  | 665.6 | 16.4 | 73.7 | 49.4 |
| 12 |  | 1076.3 | 151.4 | 313.2 | 648.1 |
| AAZ | 250.0 | 12.1 | 25.3 | 5.7 | |
| hCA Isoform | pKi Threshold Value (±Interval) |
|---|---|
| hCA I | 6.30 (±0.25) |
| hCA II | 7.30 (±0.25) |
| hCA IX | 7.30 (±0.25) |
| hCA XII | 7.45 (±0.25) |
| Datasets hCA I | |||
|---|---|---|---|
| Active | Inactive | Total | |
| Training | 1618 | 2278 | 3896 |
| Test | 405 | 570 | 975 |
| Datasets hCA II | |||
| Active | Inactive | Total | |
| Training | 1682 | 2319 | 4001 |
| Test | 421 | 580 | 1001 |
| Datasets hCA IX | |||
| Active | Inactive | Total | |
| Training | 1208 | 1512 | 2720 |
| Test | 302 | 379 | 681 |
| Datasets hCA I | |||
| Active | Inactive | Total | |
| Training | 1104 | 1166 | 2270 |
| Test | 277 | 292 | 569 |
Disclaimer/Publisher’s Note: The statements, opinions and data contained in all publications are solely those of the individual author(s) and contributor(s) and not of MDPI and/or the editor(s). MDPI and/or the editor(s) disclaim responsibility for any injury to people or property resulting from any ideas, methods, instructions or products referred to in the content. |
© 2025 by the authors. Licensee MDPI, Basel, Switzerland. This article is an open access article distributed under the terms and conditions of the Creative Commons Attribution (CC BY) license (https://creativecommons.org/licenses/by/4.0/).
Share and Cite
Piazza, L.; Di Stefano, M.; Poles, C.; Bononi, G.; Poli, G.; Renzi, G.; Galati, S.; Giordano, A.; Macchia, M.; Carta, F.; et al. A Machine Learning Platform for Isoform-Specific Identification and Profiling of Human Carbonic Anhydrase Inhibitors. Pharmaceuticals 2025, 18, 1007. https://doi.org/10.3390/ph18071007
Piazza L, Di Stefano M, Poles C, Bononi G, Poli G, Renzi G, Galati S, Giordano A, Macchia M, Carta F, et al. A Machine Learning Platform for Isoform-Specific Identification and Profiling of Human Carbonic Anhydrase Inhibitors. Pharmaceuticals. 2025; 18(7):1007. https://doi.org/10.3390/ph18071007
Chicago/Turabian StylePiazza, Lisa, Miriana Di Stefano, Clarissa Poles, Giulia Bononi, Giulio Poli, Gioele Renzi, Salvatore Galati, Antonio Giordano, Marco Macchia, Fabrizio Carta, and et al. 2025. "A Machine Learning Platform for Isoform-Specific Identification and Profiling of Human Carbonic Anhydrase Inhibitors" Pharmaceuticals 18, no. 7: 1007. https://doi.org/10.3390/ph18071007
APA StylePiazza, L., Di Stefano, M., Poles, C., Bononi, G., Poli, G., Renzi, G., Galati, S., Giordano, A., Macchia, M., Carta, F., Supuran, C. T., & Tuccinardi, T. (2025). A Machine Learning Platform for Isoform-Specific Identification and Profiling of Human Carbonic Anhydrase Inhibitors. Pharmaceuticals, 18(7), 1007. https://doi.org/10.3390/ph18071007