Article

Fusion Retrieval of Sea Surface Barometric Pressure from the Microwave Humidity and Temperature Sounder and Microwave Temperature Sounder-II Onboard the Fengyun-3 Satellite

1
School of information Technology, Luoyang Normal University, Luoyang 471934, China
2
Key Laboratory of Microwave Remote Sensing, National Space Science Center, Chinese Academy of Sciences, Beijing 100190, China
3
Department of Electrical and Computer Engineering, Michigan State University, East Lansing, MI 48824, USA
*
Author to whom correspondence should be addressed.
Remote Sens. 2022, 14(2), 276; https://doi.org/10.3390/rs14020276
Submission received: 30 November 2021 / Revised: 26 December 2021 / Accepted: 6 January 2022 / Published: 7 January 2022

Abstract

:
Both the Microwave Humidity and Temperature Sounder (MWHTS) and the Microwave Temperature Sounder-II (MWTS-II) operate on the Fengyun-3 (FY-3) satellite platform, which provides an opportunity to retrieve the sea surface barometric pressure (SSP) with high accuracy by fusing the observations from the 60 GHz, 118.75 GHz, and 183.31 GHz channels. The theory of retrieving SSP using passive microwave observations is analyzed, and the sensitivity test experiments of MWHTS and MWTS-II to SSP as well as the test experiments of the contributions of MWHTS and MWTS-II to SSP retrieval are carried out. The theoretical channel combination is established based on the theoretical analysis, and the SSP retrieval experiment is carried out based on the Deep Neural Network (DNN) for the theoretical channel combination. The experimental results show that the retrieval accuracy of SSP using the theoretical channel combination is higher than that of MWHTS or MWTS-II. In addition, based on the test results of the contributions of MWHTS and MWTS-II to the retrieval SSP, the optimal theoretical channel combination can be built, and can further improve the retrieval accuracy of SSP from the theoretical channel combination.

1. Introduction

Sea surface barometric pressure (SSP) is an important atmospheric parameter that plays an essential role in applications such as numerical weather prediction (NWP), tropical cyclone forecasting and analysis, and climatological studies [1,2,3]. Meanwhile, SSP is also significant in various theoretical studies in the field of atmospheric remote sensing. For example, SSP, as the endpoint of the microwave radiative transfer path, has a direct impact on the calculation of the microwave radiometer’s simulated brightness temperature, and thereby affects the application of the observed brightness temperature. The acquisition of SSP with high accuracy has been a hotspot in the research field of atmospheric science due to the significance of SSP in various applied and theoretical studies.
Until recently, SSP has mainly been obtained by in situ measurements, such as barometers onboard buoys, merchant ships, and airborne platforms, which are sparse in spatial coverage and high cost in implementation [4]. Both the spatial and temporal coverage and resolution of the in situ measurements are limited, which restrict the effectiveness and scope of the application of SSP in the field of atmospheric science. Compared to many remote sensing techniques of SSP, such as raster spectrometer, airborne differential absorption radar, and GPS occultation detection, among others, the satellite-based microwave remote sensing has the advantages of a wide detection area, high horizontal resolution, and global intensive observation, among others, which is an ideal method for obtaining continuous and high spatial and temporal resolution of SSP data [5,6,7]. Currently, the satellite-based scatterometer can obtain the SSP gradient fields by measuring the surface wind field [8,9]. However, the output of this method is the SSP gradient rather than the SSP itself, and at least one reliable observation (e.g., buoy or coastal station) is required to obtain SSP [10,11]. This requirement is difficult to meet due to the lack of in situ observations for the ocean areas. As a passive microwave remote sensing instrument, the satellite-based microwave radiometer can detect SSP due to its capability to measure the total columnar oxygen absorption [12,13]. In the microwave band, the oxygen absorption spectrum has a clear frequency partitioning feature, with one resonance absorption line located at 118.75 GHz and the remaining 45 absorption lines forming a resonance absorption band centered at 60 GHz [14]. Currently, the satellite-based microwave radiometers with channels near 118.75 GHz or in the 60 GHz band, such as MWHTS, MWTS-II, Advanced Microwave Sounding Unit (AMSU), and Advanced Technology Microwave Sounder (ATMS), all have the capability to detect SSP. Zhang and colleagues have carried out a study on the retrieval of SSP using the ATMS observations and the MWHTS observations, and their experimental results show that both ATMS and MWHTS are capable of acquiring SSP with an accuracy of 2 hPa under clear sky conditions and 3 hPa under cloudy conditions, which can meet the application requirements in NWP and also validate the comparable detection capability of ATMS and MWHTS for SSP [15]. Meanwhile, they have verified that the detection channel at 183.31 GHz contributes to the retrieval of SSP by the retrieval experiments [15,16]. Although all of these three microwave frequency bands centered at 60 GHz, 118.75 GHz, and 183.31 GHz are capable of detecting SSP, studies on the fusion of multiple frequency bands based on 60 GHz, 118.75 GHz, and 183.31 GHz to retrieve SSP have not been reported.
In general, the combined detection of atmospheric parameters through multiple remote sensing platforms or multiple frequency bands is expected to obtain richer detection information, which in turn has the potential to achieve higher retrieval accuracy. MWHTS, with channels set at 118.75 GHz and 183.31 GHz, and MWTS-II, with channels set at 60 GHz, are both carried on the FY-3C and FY-3D satellites, which provides an opportunity to fuse the observations at 60 GHz, 118.75 GHz, and 183.31 GHz to retrieve SSP. In this paper, a study of fusion retrieval of SSP with 60 GHz, 118.75 GHz, and 183.31 GHz is carried out using MWHTS and MWTS-II observations. Based on the theoretical analysis of microwave remote sensing SSP and the contribution test experiments of each channel of MWHTS and MWTS-II to the SSP retrieval, this paper builds the theoretical channel combination and the optimal theoretical channel combination for the fusion retrieval of SSP, and also achieves the purpose of fusion retrieval of SSP with high accuracy using MWHTS and MWTS-II observations.
This paper is organized as follows: Section 2 describes the characteristics of the MWHTS and MWTS-II instruments, the datasets, and the microwave radiative transfer model used in this study; the theoretical analysis of measuring SSP by satellite-based microwave radiometer and the sensitivity test of MWHTS and MWTS-II to SSP are contained in Section 3; in Section 4, the retrieval algorithm and experimental designs of the contribution tests of MWHTS and MWTS-II to the SSP retrieval and fusion retrieval of SSP from observations of MWHTS and MWTS-II are presented; the experimental results and analysis are highlighted in Section 5; Section 6 concludes the study.

2. Data Description and Pre-Processing

2.1. Instrument Characteristics

MWHTS and MWTS-II are important payloads onboard the FY-3C and FY-3D satellites, both of which are total power microwave radiometers. MWHTS has eight temperature sounding channels at the 118.75 GHz oxygen absorption line, five humidity sounding channels at the 183.31 GHz water vapor absorption line, and two window channels at 89 GHz and 150 GHz mainly for sounding the Earth’s surface parameters. MWTS-II has 13 channels in the 60 GHz oxygen absorption band mainly for sounding the atmospheric temperature. Both MWHTS and MWTS-II scan in a cross-track manner within ±53.35° and ±49.5° with respect to the nadir direction, respectively. Each field of view (FOV) in the scan line corresponds to one scan angle. MWHTS has 98 FOVs per scan line with a normal FOV of 15 km at the nadir, and MWTS-II has 90 FOVs per scan line with a normal FOV of 33 km at the nadir [17,18,19].
The weighting function (WF) distributions for 15 channels of MWHTS and 13 channels of MWTS-II, calculated from the standard U.S. atmosphere profile at nadir by the Millimeter-wave Propagation Model (MPM)-93 [20], are displayed in Figure 1. The relative contribution of each atmospheric layer to the channel observations is indicated by the WFs. As shown in Figure 1a, MWHTS channels 2–9 detect the temperature information mainly in the stratosphere (from the surface to 30 hPa), and MWHTS channels 11–15 detect the humidity information in the troposphere. It can be seen from Figure 1b that MWTS-II channels 3–13 detect the temperature information from the surface to 3 hPa. MWHTS channels 1 and 10, and MWTS-II channels 1–2, with their peak WF heights closer to the surface, are affected by the radiation from the surface and can thus be used to obtain surface information. In addition, it can be observed from Figure 1 that the WF distributions of different channels are overlapped, which indicates that these channels detect the same atmosphere layer or surface information and therefore their observations may be correlated. Some channel characteristics of MWHTS and MWTS-II are listed in Table 1 and Table 2, respectively, including the channel frequency, sensitivity requirement, on-orbit sensitivity, calibration accuracy, and peak weighting function (WF) height.

2.2. Date Description and Pre-Processing

The datasets used in this study include: (1) level 1b brightness temperature dataset of MWHTS and MWTS-II onboard the FY-3D satellite from the National Satellite Meteorological Center (NSMC) (http://satellite.nsmc.org.cn/, 18 December 2019); (2) ERA-Interim reanalysis dataset obtained from the European Centre for Medium-Range Weather Forecasts (ECMWF) website (http://apps.ecmwf.int/datasets/, 18 December 2019) is produced by a data assimilation system, which assimilates many sounding measurements, including radiosondes and in situ sounders [21,22]. The reanalysis dataset can typically be used as the truth data to verify the retrieval accuracy of atmospheric parameters. In this study, the profile parameters and the surface parameters from the ERA-Interim reanalysis dataset are used to build the atmospheric parameter dataset. The profile parameters include temperature, relative humidity, and specific cloud liquid content, which have a total of 37 pressure levels unevenly from 1000–1 hPa. The surface parameters include 2 m temperature, 2 m dewpoint temperature, surface pressure, skin temperature, 10 m u wind component, 10 m v wind component, and vertical integral of cloud liquid water. These parameters that are used to build the atmospheric parameter dataset have the horizontal resolution of 0.5° × 0.5° and the temporal resolution of 6 h (i.e., with data available at 0000 UTC, 0600 UTC, 1200 UTC, and 1800 UTC). The atmospheric parameter dataset and the brightness temperature data of MWHTS and MWTS-II used in this work are over the ocean covering a geographic area of 25° N–45° N and 160° E–220° E from 1 September 2018 to 31 August 2019.
The radiative transfer model RTTOV (Radiative Transfer for Television and Infrared Observation Satellite Operational Vertical Sounders) Version 11.2, developed by the ECMWF, is selected to calculate the simulated brightness temperatures and carry out the sensitivity test experiments. RTTOV is a fast radiative transfer model for simulating top-of-atmosphere radiances from passive visible, infrared, and microwave downward-viewing satellite radiometers, and is widely used in the satellite retrieval and data assimilation communities. The core of RTTOV is a fast parameterization of layer optical depths due to gas absorption. Given an atmospheric profile of temperature, water vapor, and, optionally, trace gases, aerosols, and hydrometeors, together with surface parameters and the viewing geometry, RTTOV can rapidly obtain the corresponding layer optical depth by interpolation and compute the top-of-atmosphere radiances in each of the channels of the sensor being simulated. For additional details on the RTTOV model, as well as the updates and increased capabilities of the latest versions, one can refer to [23,24].
In this study, three steps of data pre-processing are performed. First, the collocated brightness temperatures are collected by collocating the observations of MWHTS and MWTS-II with the criteria that their time difference is less than 2 s and the absolute distance between their positions (latitude and longitude) is less than 0.1°. Next, the collocated dataset is built by collocating the collocated brightness temperatures with the atmospheric parameter dataset, with the criteria that their time difference is less than 0.5 h and the absolute distance between their positions (latitude and longitude) is less than 0.1°. Finally, two collocated datasets both containing the observed brightness temperatures, and the atmospheric parameters have been built. One is the analysis dataset, with 321,448 collocated samples from 1 September 2018 to 30 June 2019, which is used to develop the retrieval algorithm of the SSP. The other is the testing dataset, with 64,831 collocated samples from 1 July to 30 August 2019, which is used to evaluate the retrieval algorithm performance. It is important to note that the analysis dataset and the testing dataset are completely independent from each other, as their data come from different time periods. The overall procedures of the data pre-processing are summarized in Figure 2.

3. The Principle of Measuring SSP by Satellite-Based Microwave Radiometer

In this section, the theoretical basis of the passive microwave remote sensing of SSP is provided and analyzed from the perspective of the relationship of SSP and atmospheric transmissivity. The relationship of SSP and atmospheric surface transmissivity is tested by the sensitivity test experiments of MWHTS and MWTS-II to SSP based on the radiative transfer model. In addition, in order to fully utilize the detection information about SSP from MWHTS and MWTS-II to retrieve SSP, a correlation analysis of the channel observations of MWHTS and/or MWTS-II is performed.

3.1. Theoretical Basis

For a satellite-based, downward-looking radiometer, the upward-emitted brightness temperature can be expressed as [25],
T B = T U P ( f , θ ) + T S K Y ( f , θ ) Γ Υ ( 0 , ) + T S E Υ ( 0 , )
where T U P ( f , θ ) and T S K Y ( f , θ ) are the upwelling and downwelling radiations of the atmosphere at frequency f and zenith angle θ given by Equations (2) and (3),
T U P ( f , θ ) = s e c θ 0 κ a ( f , z ) T ( z ) e τ 0 ( z , ) s e c θ d z
T S K Y ( f , θ ) = T E X T R A e τ 0 ( 0 , ) s e c θ + s e c θ 0 κ a ( f , z ) T ( z ) e τ 0 ( 0 , z ) s e c θ d z
where κ a ( f , z ) is the total power absorption coefficient of the atmosphere at height z , which usually contains three components: the oxygen power absorption coefficient, the water vapor power absorption coefficient, and the liquid water power absorption coefficient. T ( z ) is the atmospheric temperature profile. T E X T R A is the galactic and cosmic radiation originating from outside of the Earth’s atmosphere. T S E is the brightness temperature of the ocean (or ground) surface when observed in the absence of the atmosphere. Γ is the reflectivity of the surface. τ 0 ( 0 , z ) is the zenith optical thickness of the atmospheric layer between the surface and height z , which is related to κ a ( f , z ) by,
τ 0 ( 0 , z ) = 0 z κ a ( f , z ) d z
and Υ ( 0 , ) is the one-way transmissivity of the atmosphere layer between the surface and the top of the atmosphere along direction θ , which is given by,
Υ ( 0 , ) = e τ 0 ( 0 ,   ) s e c θ = e 0 κ a ( f , z ) s e c θ d z
According to Equation (5), and replacing the height z with the integral variable l n P , Equation (1) can be simplified as,
T B = l n P S W ( f , P ) T ( P ) d ( l n P ) + T S ε ( f , θ ) Υ ( P S , 0 )
where T ( P ) represents the vertical distribution of temperature at atmospheric pressure level P , P S denotes SSP, ε ( f , θ ) is the emissivity of the surface, T S is the surface temperature, Υ ( P S , 0 ) is the transmissivity between the surface and the top of the atmosphere (i.e., the surface transmissivity), and W ( f , P ) is given by,
W ( f , P ) = [ 1 + ( 1 ε ( f , θ ) ) ( Υ ( P S , 0 ) Υ ( P , 0 ) ) 2 ] Υ ( P , 0 ) ( l n P )
From Equation (6), it can be seen that the atmosphere transmissivity Υ directly affects the satellite brightness temperature, and SSP, which is the endpoint of the detection path of the satellite-based microwave radiometer, not only participates in the calculation of the atmospheric absorption, but also has an important impact on the transmission of surface radiation in the detection path. However, although SSP, as the integral limit in Equation (6), seems to establish a connection with the satellite brightness temperature, it can be noted that SSP does not affect the satellite brightness temperature if the surface transmissivity   Υ ( P S , 0 ) is zero. Meanwhile, it is concluded that the measurements of the satellite-based microwave radiometer channels with non-zero Υ ( P S , 0 ) can be influenced by SSP, and thus contain the detection information about SSP.
Based on the above analysis, the surface transmissivity, Υ ( P S , 0 ) , of all channels of MWHTS and MWTS-II are calculated by RTTOV. The inputs of RTTOV are the profile parameters and the surface parameters of the analysis dataset. The mean value of Υ ( P S , 0 ) for each channel is shown in Figure 3. It can be seen that the mean values of the surface transmissivity, Υ ( P S , 0 ) , for channel 1, channels 5–10, and channel 15 of MWHTS and for channels 1–5 of MWHTS are not zero. Thus, these channels are sensitive to SSP.
However, as can be concluded from Figure 1, there is a correlation between microwave channels due to the same atmospheric layer or the surface information in detection. Therefore, measurements of microwave channels with non-zero Υ ( P S , 0 ) contain the detection information about SSP, and measurements of microwave channels whose Υ ( P S , 0 ) are zero are also likely to contain SSP information. For MWHTS and MWTS-II, the correlation coefficients between observations of the channels with zero Υ ( P S , 0 ) and observations of the channels with non-zero Υ ( P S , 0 ) are calculated using the observations of MWHTS and MWTS-II in the analysis dataset. The calculated results of the correlation coefficients are shown in Table 3, where H-n, n = 1, 2, 3, ..., 15. denotes the MWHTS channel, and T-m, m = 1, 2, 3, ..., 13. denotes the MWTS-II channel.
As shown in Table 3, although channel 2, channel 3, and channel 4 of MWHTS are not sensitive to SSP, their observations have certain correlations with the observations of MWTS-II channel 1, MWTS-II channel 3, and MWTS-II channel 3, which contain the SSP information, with correlation coefficients of 0.39, −0.41, and −0.56, respectively. The observations of MWHTS channels 11–14 are all strongly correlated with that of MWHTS channel 15, with correlation coefficients of 0.62, 0.74, 0.83, and 0.90, respectively. The observations of MWTS-II channels 6 and 7 are also strongly correlated with that of MWHTS channel 5, with correlation coefficients of 0.98 and 0.68, respectively. MWTS-II channels 8–13 are all insensitive to SSP, but their observations are correlated with those of channel 3, channel 4, channel 2, channel 2, channel 2, and channel 3 of MWTS-II, with respective correlation coefficients of −0.54, −0.27, 0.48, 0.54, 0.50, and 0.44. In addition, it should be noted that MWHTS channel 15, which mainly detects the atmospheric humidity information, shows a correlation with the temperature sounding channels, such as MWHTS channel 2, MWHTS channel 3, and MWTS-II channel 8, which may be due to the correlation between the atmospheric parameters. In a natural climate, there are natural linkages between atmospheric parameters such as pressure, temperature, and humidity, among others [26]. Therefore, in addition to the fact that microwave channels detect the same information about atmospheric parameters, the correlation between atmospheric parameters may also be a reason for the correlation of the observations of the microwave channels.
Furthermore, based on the correlation analysis of the channel observations of MWHTS and/or MWTS-II, a theoretical assumption that the observations of the channels whose surface transmissivity is zero contain the SSP information and can be used to retrieve SSP is presented. According to the above theoretical analysis, in order to fully utilize the SSP information in observations of MWHTS and MWTS-II to retrieve SSP, a theoretical channel combination including all of the 15 channels of MWHTS, and 13 channels of MWTS-II is established. However, as for the fusion retrieval of SSP from MWHTS and MWTS-II, whether each channel of MWHTS and MWTS-II can contribute to the retrieval of SSP can be verified by the retrieval experiment for SSP.

3.2. The Sensitivity Test of MWHTS and MWTS-II to SSP

Inputting the artificially perturbed atmospheric parameter into the microwave radiative transfer model to calculate the simulated brightness temperatures, and then obtaining the relationship between the simulated brightness temperatures and the specific atmospheric parameter, is the traditional sensitivity test method in microwave remote sensing of the atmosphere, especially in testing the sensitivity of the passive microwave observations to temperature, humidity, and cloud parameters [27,28,29]. Similarly, in this study, the traditional sensitivity test method based on the radiative transfer model is chosen to carry out the sensitivity test of MWHTS and MWTS-II to SSP, where RTTOV is used as the radiative transfer model and the atmospheric parameters are from ERA-Interim reanalysis instead of artificial perturbation, such that the atmospheric parameters used will be closer to the natural atmospheric situation. According to the theoretical analysis in Section 3.1, both channels of MWHTS and MWTS-II with zero and non-zero surface transmissivity are sensitive to SSP. In this study, the sensitivities of all channels of MWHTS and MWTS-II to SSP are tested.
For the sensitivity test experiments of MWHTS and MWTS-II to SSP, the test scheme is to input the atmospheric parameters, which are as identical as possible with the exception of SSP, into RTTOV to calculate the simulated brightness temperature and obtain the simulated brightness temperature versus SSP. However, since each channel of MWHTS and MWTS-II has a different sensitivity to atmospheric parameters such as temperature, humidity, and cloud water content at different pressure levels, the sensitivity test datasets where the atmospheric parameters, except for SSP, have as little effect as possible on the simulated brightness temperature for that channel need to be built for each channel. Following the method used to build the atmospheric parameter dataset in Section 2.2, except using data from a different time range, the atmospheric parameter dataset with 142,492,873 samples from 1 September 2014 to 31 August 2019 is used to build the sensitivity test dataset for each channel of MWHTS and MWTS-II. The sensitivity test datasets are built as follows.
First, in order to reduce the impact of the clouds and precipitation on the simulated brightness temperature, while taking into account the amount of available data, the vertical integral of cloud liquid water of 0.01 mm was set as the cloud filtering threshold, with only the atmospheric parameters with a vertical integral of cloud liquid water less than 0.01 mm in the atmospheric parameter dataset are used. Next, since the brightness temperature of each channel is influenced by the atmospheric parameters only at some pressure levels, the main affected pressure levels for each channel need to be determined. Based on the WF distributions, the main affected pressure levels of each channel of MWHTS and MWTS-II can be determined by inputting the perturbed atmospheric temperature and humidity profiles into RTTOV to calculate the simulated brightness temperature. Finally, the mean atmospheric parameters in the atmospheric parameter dataset are calculated and the mean surface emissivity for each channel is calculated by the Fast Emissivity (FASTEM)-5 model [23]. The atmospheric parameters, with the exception of SSP, that are similar to the mean values of the atmospheric parameters are searched for each channel. The search criterion is that the difference between the temperatures and the mean values of temperatures at the main affected pressure levels needs to satisfy the temperature threshold, and the searched atmospheric parameters based on the temperature thresholds can generate the same simulated brightness temperatures as the mean values of the atmospheric parameters. Following the same approach, the humidity threshold for each channel can be determined. It is noted that the determination of temperature and humidity thresholds requires a comprehensive consideration of the effects of temperature and humidity differences on the sensitivity test and the number of available samples. In addition, in order to reduce the impact of the surface emissivity on the simulations of channels with the peak WF heights close to the surface, only the difference between the surface emissivity and the mean surface emissivity for channels with non-zero surface emissivity within the range of 0.001 is selected. The overall procedures for building the sensitivity test dataset are summarized in Figure 4.
Based on the above steps, the sensitivity test dataset for each channel of MWHTS and MWTS-II can be built. Table 4 lists the main affected pressure levels, temperature threshold, humidity threshold, and the number of samples in the sensitivity test dataset for each channel of MWHTS and MWTS-II, where channels with similar WF distributions can share the same configuration of the sensitivity test dataset. For example, H-1, H-7, H-8, H-9, H-10, T-1, and T-2 with peak WF heights are close to the surface, which can use the same sensitivity test dataset. In addition, the temperature threshold affects all channels of MWHTS and MWTS-II, while the humidity threshold affects the window channels H-1 and H-10, the temperature sounding channels H-5, H-6, H-7, H-8, and H-9, and the humidity sounding channels H-11, H-12, H-13, H-14, and H-15.
The zenith angle is set to be 0° and the sensitivity test dataset is input into RTTOV to calculate the simulated brightness temperature and the surface transmissivity, Υ ( P S , 0 ) , of MWHTS and MWTS-II, respectively. The simulated brightness temperature for each channel of MWHTS and MWTS-II versus SSP, and the results of the linear regression fits to the relationship between the simulated brightness temperature and SSP, are shown in Figure 5. The mean values of surface transmissivity, Υ ( P S , 0 ) , of each channel of MWHTS and MWTS-II are shown in Figure 6.
In Figure 5, the slope of the linear regression is an indicator of whether a channel is sensitive to SSP. If the slope is almost zero, it means that the simulated brightness temperature hardly varies with the changed SSP, and is therefore not sensitive to SSP. Based on the slope of the linear regression fit results of the relationship between the simulated brightness temperature and SSP for each channel, the sensitivity of each channel to SSP can be determined. It can be seen from Figure 5a and Figure 6 that MWHTS channel 1, channels 5–10, and channel 15 have non-zero slopes and non-zero transmissivity, Υ ( P S , 0 ) , are sensitive to SSP. It is also shown that the simulated brightness temperatures of MWHTS channel 1 and channels 5–10 all show a significant linear relationship with SSP. MWHTS humidity sounding channel 15 is weakly sensitive to SSP, while MWHTS humidity sounding channels 11–14 are not. For the sensitivity test results of MWTS-II to SSP, it can be observed from Figure 5b and Figure 6 that MWTS-II channels 1–5 with non-zero slopes and non-zero transmissivity, Υ ( P S , 0 ) , are sensitive to SSP, and there is a clear linear relationship between their simulated brightness temperatures and SSP. However, MWTS-II channels 6–13 are not sensitive to SSP.
It should be noted that only the MWHTS and MWTS-II channels with the non-zero transmissivity, Υ ( P S , 0 ) , are sensitive to SSP, which is consistent with Equation (6), but inconsistent with the assumptions presented in the theoretical analysis in Section 3.1. The inconsistency between the sensitivity test results and the theoretical assumptions could be due to the following three reasons:
(1) The commonly used operational radiative transfer models, such as RTTOV, CRTM, and ARTS, are developed with the main purpose of improving the accuracy of the simulated brightness temperature, in which surface transmissivity is obtained by linearly interpolating SSP to a fixed pressure grid [23,30,31]. Such treatment reduces the weight of SSP in the entire radiative transfer calculation and is crude for obtaining the relationship between the simulated brightness temperature and SSP. In addition, obtaining the surface transmissivity in this way is also the reason why the simulated brightness temperature of the channel with non-zero surface transmissivity shows an obvious linear relationship with the variations of SSP in the results of the sensitivity test of MWHTS and MWTS-II to SSP;
(2) The radiative transfer model may not well characterize the correlation between atmospheric parameters and the correlation about SSP between channels when calculating the simulated brightness temperature. This means that the sensitivity test method based on the radiative transfer model cannot capture the observations of the channels whose surface transmissivity is zero and contain the SSP information;
(3) Errors in the simulated brightness temperature from the radiative transfer model due to non-modeled atmospheric processes, signal distortion in the ionosphere, errors in the spectroscopy, etc. [22,23,24,25,26,27,28,29,30,31,32,33,34], may adversely affect the sensitivity test results. In addition, whether the atmospheric parameters in the sensitivity test dataset are representative, as well as the scope of their values, are also important factors affecting the sensitivity test results.
It is obvious that the sensitivity test method based on the radiative transfer model, although successfully applied to some other atmospheric parameters such as temperature, humidity, and cloud parameters, is not applicable to SSP. Furthermore, in this study, the sensitivity test method based on the radiative transfer model cannot validate the theoretical assumption in Section 3.1 that the observations of the channels whose surface transmissivity is zero contain the SSP information and can be used to retrieve SSP. Fortunately, the theoretical assumption in Section 3.1 can be validated by determining whether each channel contributes to the SSP retrieval in the retrieval experiments, as detailed in Section 4.2.

4. Algorithm and Experiment Design

In this section, according to the nonlinear relationship between passive microwave observations and SSP presented in Equation (6), a neural-network-based retrieval algorithm that can describe the linear and nonlinear relationships between the input and output samples is developed. Experimental designs to test whether each channel of MWHTS and MWTS-II contributes to the SSP retrieval in the retrieval experiment and to establish the optimal channel combination for fusion retrieval of SSP from MWHTS and MWTS-II are also presented.

4.1. Neural-Network-Based Retrieval Algorithm

As a typical representative of machine learning algorithms, neural networks (NNs) are widely used in the field of atmosphere microwave remote sensing because of their advantages of low computational effort, high computational efficiency, ease of operation, and comparable retrieval accuracy compared with physical retrieval algorithms. In the supervised learning process, the NN is trained using a training dataset in which each set of input samples is corresponding to a given output label to build a NN model that can describe the relationship between the inputs and outputs. When the new testing inputs are provided to the trained NN model, the model can predict the new outputs which correspond to the new testing inputs [35,36]. When NNs are applied to the satellite-based microwave remote sensing of atmospheric parameters, the inputs are usually the brightness temperatures of satellite-based radiometers, and the corresponding outputs can be the atmospheric temperature profile, humidity profile, cloud-water parameters, and surface parameters, etc. The additional details on the initialization, training, and optimization of the NNs, as well as other advanced topics, are detailed in previous work [37,38,39,40].
Following the vast majority of publications on applying NNs to atmosphere remote sensing, and considering the strongly linear and non-linear mapping ability required in this research, a deep neural network (DNN), which contains an input layer, two hidden layers, and an output layer, is selected to retrieve SSP from MWHTS and MWTS-II. A DNN can be understood as a neural network that contains many hidden layers and the hidden layers contain many neurons. The DNN design used here is fully connected networks, where each neuron in each layer is connected to all neurons in the next layer, and the neurons in the hidden layer perform nonlinear computation on all input vectors to characterize the relationship between input and output samples. In the SSP retrieval, the input layer of the DNN receives the measurements of MWHTS or MWTS-II, and the number of neurons of the input layer corresponds to the number of channels contained in the measurements of MWHTS or MWTS-II. The output layer has one neuron output SSP. There are 512 neurons in each hidden layer of the DNN, and this configuration is selected after extensive testing with smaller and larger numbers of neurons. In the extensive testing, the trained DNN produces the best result in terms of reproducing SSP, which is evaluated by the root mean square error (RMSE) between the predictions of SSP and the SSP in the testing dataset.
In the training of the DNN, the error back propagation learning algorithm is used. A DNN with the learning rate of 0.001 targets the minimum squared error of prediction and adjusts the threshold and weight of the network to fit the expected SSP. For the activation function in this study, the rectified linear unit (ReLU) is selected for its ability to overcome the problems of saturation and vanishing gradients [37]. More importantly, a DNN with ReLU can obtain the highest prediction accuracies in the SSP retrievals compared to sigmoid and Leaky ReLU. Another concerning problem is setting the number of epochs for the training of the DNN. Too few epochs can lead to an underfit model, while too many may result in overfitting. In this study, in order to avoid the underfit model, an arbitrarily large number of epochs is set, and the method called early stopping is selected to terminate the training of the DNN before overfitting occurs. Early stopping split the training dataset and used a subset (20%) as a validation dataset to monitor the performance of the DNN during training. If the loss on the validation dataset remains unchanged over a set number of epochs (or patience), the training of the DNN will be stopped. After extensive testing, the arbitrarily large number of epochs and the patience in this study are 1500 and 100, respectively.
The developed DNN is trained and tested using the analysis dataset and the testing dataset established in Section 2.2, respectively, with the observed brightness temperatures and the corresponding SSP in the analysis dataset being used as the inputs and outputs of the DNN, respectively, to train and build the DNN-based retrieval model. Next, the observed brightness temperatures in the testing dataset as new data are input to the DNN-based retrieval model to generate the predictions of SSP, and the SSP in the testing dataset is used as the truth value to verify the accuracy of the DNN-based retrieval model. An illustration of the schematic of the SSP retrieval process is displayed in Figure 7.

4.2. Design of Retrieval Experiment

Following the theoretical assumption of the theoretical analysis in Section 3.1, the channels of MWHTS and MWTS-II with zero surface transmissivity can be used for retrieving SSP. However, only the channels of MWHTS and MWTS-II with non-zero surface transmissivity can be useful for retrieving SSP according to the sensitivity test results, as shown in Section 3.2. Therefore, in order to further validate whether each channel contributes to the SSP retrieval in the retrieval experiment, an experiment is designed to test the contribution of each channel of MWHTS and MWTS-II to the SSP retrieval. Based on the test results of the contribution of each channel to the SSP retrieval, the optimal theoretical channel combination for retrieving SSP can be established, and then the fusion retrieval experiment of SSP from MWHTS and MWTS-II is designed. The specific designs of the above two experiments are as follows.
Experiment 1: testing the contribution of each channel of MWHTS and MWTS-II to the retrieval of SSP. To further validate the theoretical assumption in Section 3.1 by determining whether each channel contributes to the SSP retrieval, this experiment is designed as follows.
First, taking MWHTS as an example, according to the SSP retrieval process in Section 4.1, the observed brightness temperatures of all 13 channels of MWHTS replace the brightness temperatures in Figure 7 to carry out the DNN training, build the DNN-based retrieval model from MWHTS, and obtain the SSP retrieval accuracy from MWHTS. Next, one channel is removed from MWHTS to build the MWHTS channel combination removing one channel, and the observed brightness temperatures of the MWHTS channel combination removing one channel replace the brightness temperatures in Figure 7, with the retrieval of SSP being carried out according to Figure 7 to obtain the SSP retrieval accuracy from the MWHTS channel combination removing one channel. The SSP retrieval accuracies from MWHTS and from the MWHTS channel combination removing one channel are then compared to determine whether the removed channel in MWHTS contributes to the SSP retrieval. Finally, following the same operation, the contribution of each channel of MWHTS to the SSP retrieval can be determined. By following the same method, the contribution of each channel of MWTS-II to the SSP retrieval can also be determined.
Experiment 2: the fusion retrieval of SSP from MWTS-II and MWHTS. In order to make full use of the information about SSP in the observations of MWTS-II and MWHTS, and obtain the SSP retrieval with higher accuracy than that of MWTS-II or MWHTS, the theoretical channel combination (all 15 channels of MWHTS and all 13 channels of MWTS-II, i.e., MWHTS + MWTS-II) based on the theoretical analysis in Section 3.1 is built, and the fusion retrieval experiment of SSP is carried out. According to the SSP retrieval process in Section 4.1, the observed brightness temperatures of the theoretical channel combination replace the brightness temperatures in Figure 7 to carry out the DNN training, build the DNN-based retrieval model from the theoretical channel combination, and obtain the SSP retrieval accuracy from the theoretical channel combination.
However, it is important to note that the retrieval of atmospheric parameters using the satellite observations is affected by the instrument observation errors, and the data quality of each channel of the microwave radiometer varies greatly, which in turn leads to some channels in the retrieval calculation not being useful for the retrieval, or even reducing the retrieval accuracy. Therefore, according to the test results of the contribution of each channel of MWHTS and MWTS-II to the SSP retrieval in Experiment 1, the channels that do not contribute to the SSP retrieval can be obtained, and the optimal theoretical channel combination is established by removing channels that do not contribute to the SSP retrieval in the theoretical channel combination.
The procedure of establishing the optimal theoretical channel combination is as follows. First, the theoretical channel combination removing one channel is created by randomly removing one channel that does not contribute to the SSP retrieval from the theoretical channel combination. According to the SSP retrieval process in Section 4.1, the observed brightness temperatures of the theoretical channel combination removing one channel replace the brightness temperatures in Figure 7 to carry out the DNN training, build the DNN-based retrieval model from the theoretical channel combination removing one channel, and obtain the SSP retrieval accuracy from the theoretical channel combination removing one channel. When the SSP retrieval accuracy from the theoretical channel combination removing one channel is better than that of the theoretical channel combination, the theoretical channel combination removing two channels is created by randomly removing another one channel that does not contribute to the SSP retrieval from the theoretical channel combination removing one channel. Next, the theoretical channel combination removing three channels can be built according to the same operation of building the theoretical channel combination removing two channels, until all the channels that do not contribute to the SSP retrieval are removed from the theoretical channel combination, and thus the optimal theoretical channel combination is built. Meanwhile, the validation of the established optimal theoretical channel combination is necessary to be carried out by the following two steps. First, when any one or more channels that do not contribute to the SSP retrieval are added from the established optimal theoretical channel combination, if the SSP retrieval accuracy does not increase, then it can be shown that the optimal theoretical channel combination is preliminarily verified to be able to obtain the optimal retrieval accuracy of SSP. Next, when any one or more channels contributing to the SSP retrieval are removed from the established optimal theoretical channel combination, if the SSP retrieval accuracy decreases, then it can be shown that the optimal theoretical channel combination is able to obtain the optimal retrieval accuracy of SSP.
For the established optimal theoretical channel combination, the observed brightness temperatures of the optimal theoretical channel combination replace the brightness temperatures in Figure 7 to carry out the DNN training, build the DNN-based retrieval model from the optimal theoretical channel combination, and obtain the SSP retrieval accuracy from the optimal theoretical channel combination.

5. Experimental Results

In this section, the test results of the contribution of each channel of MWHTS and MWTS-II to the SSP retrieval in Experiment 1, and the retrieval results of SSP from the theoretical channel combination and the optimal theoretical channel combination in Experiment 2, are presented, where the SSP from ERA-Interim reanalysis in the testing dataset is used as the truth value to verify the retrieval accuracy, i.e., the RMSE between the SSP from ERA-Interim and the predicted retrieval of SSP is calculated, and the correlation coefficient and the mean bias between them are also presented for further explanation of the retrieval results.

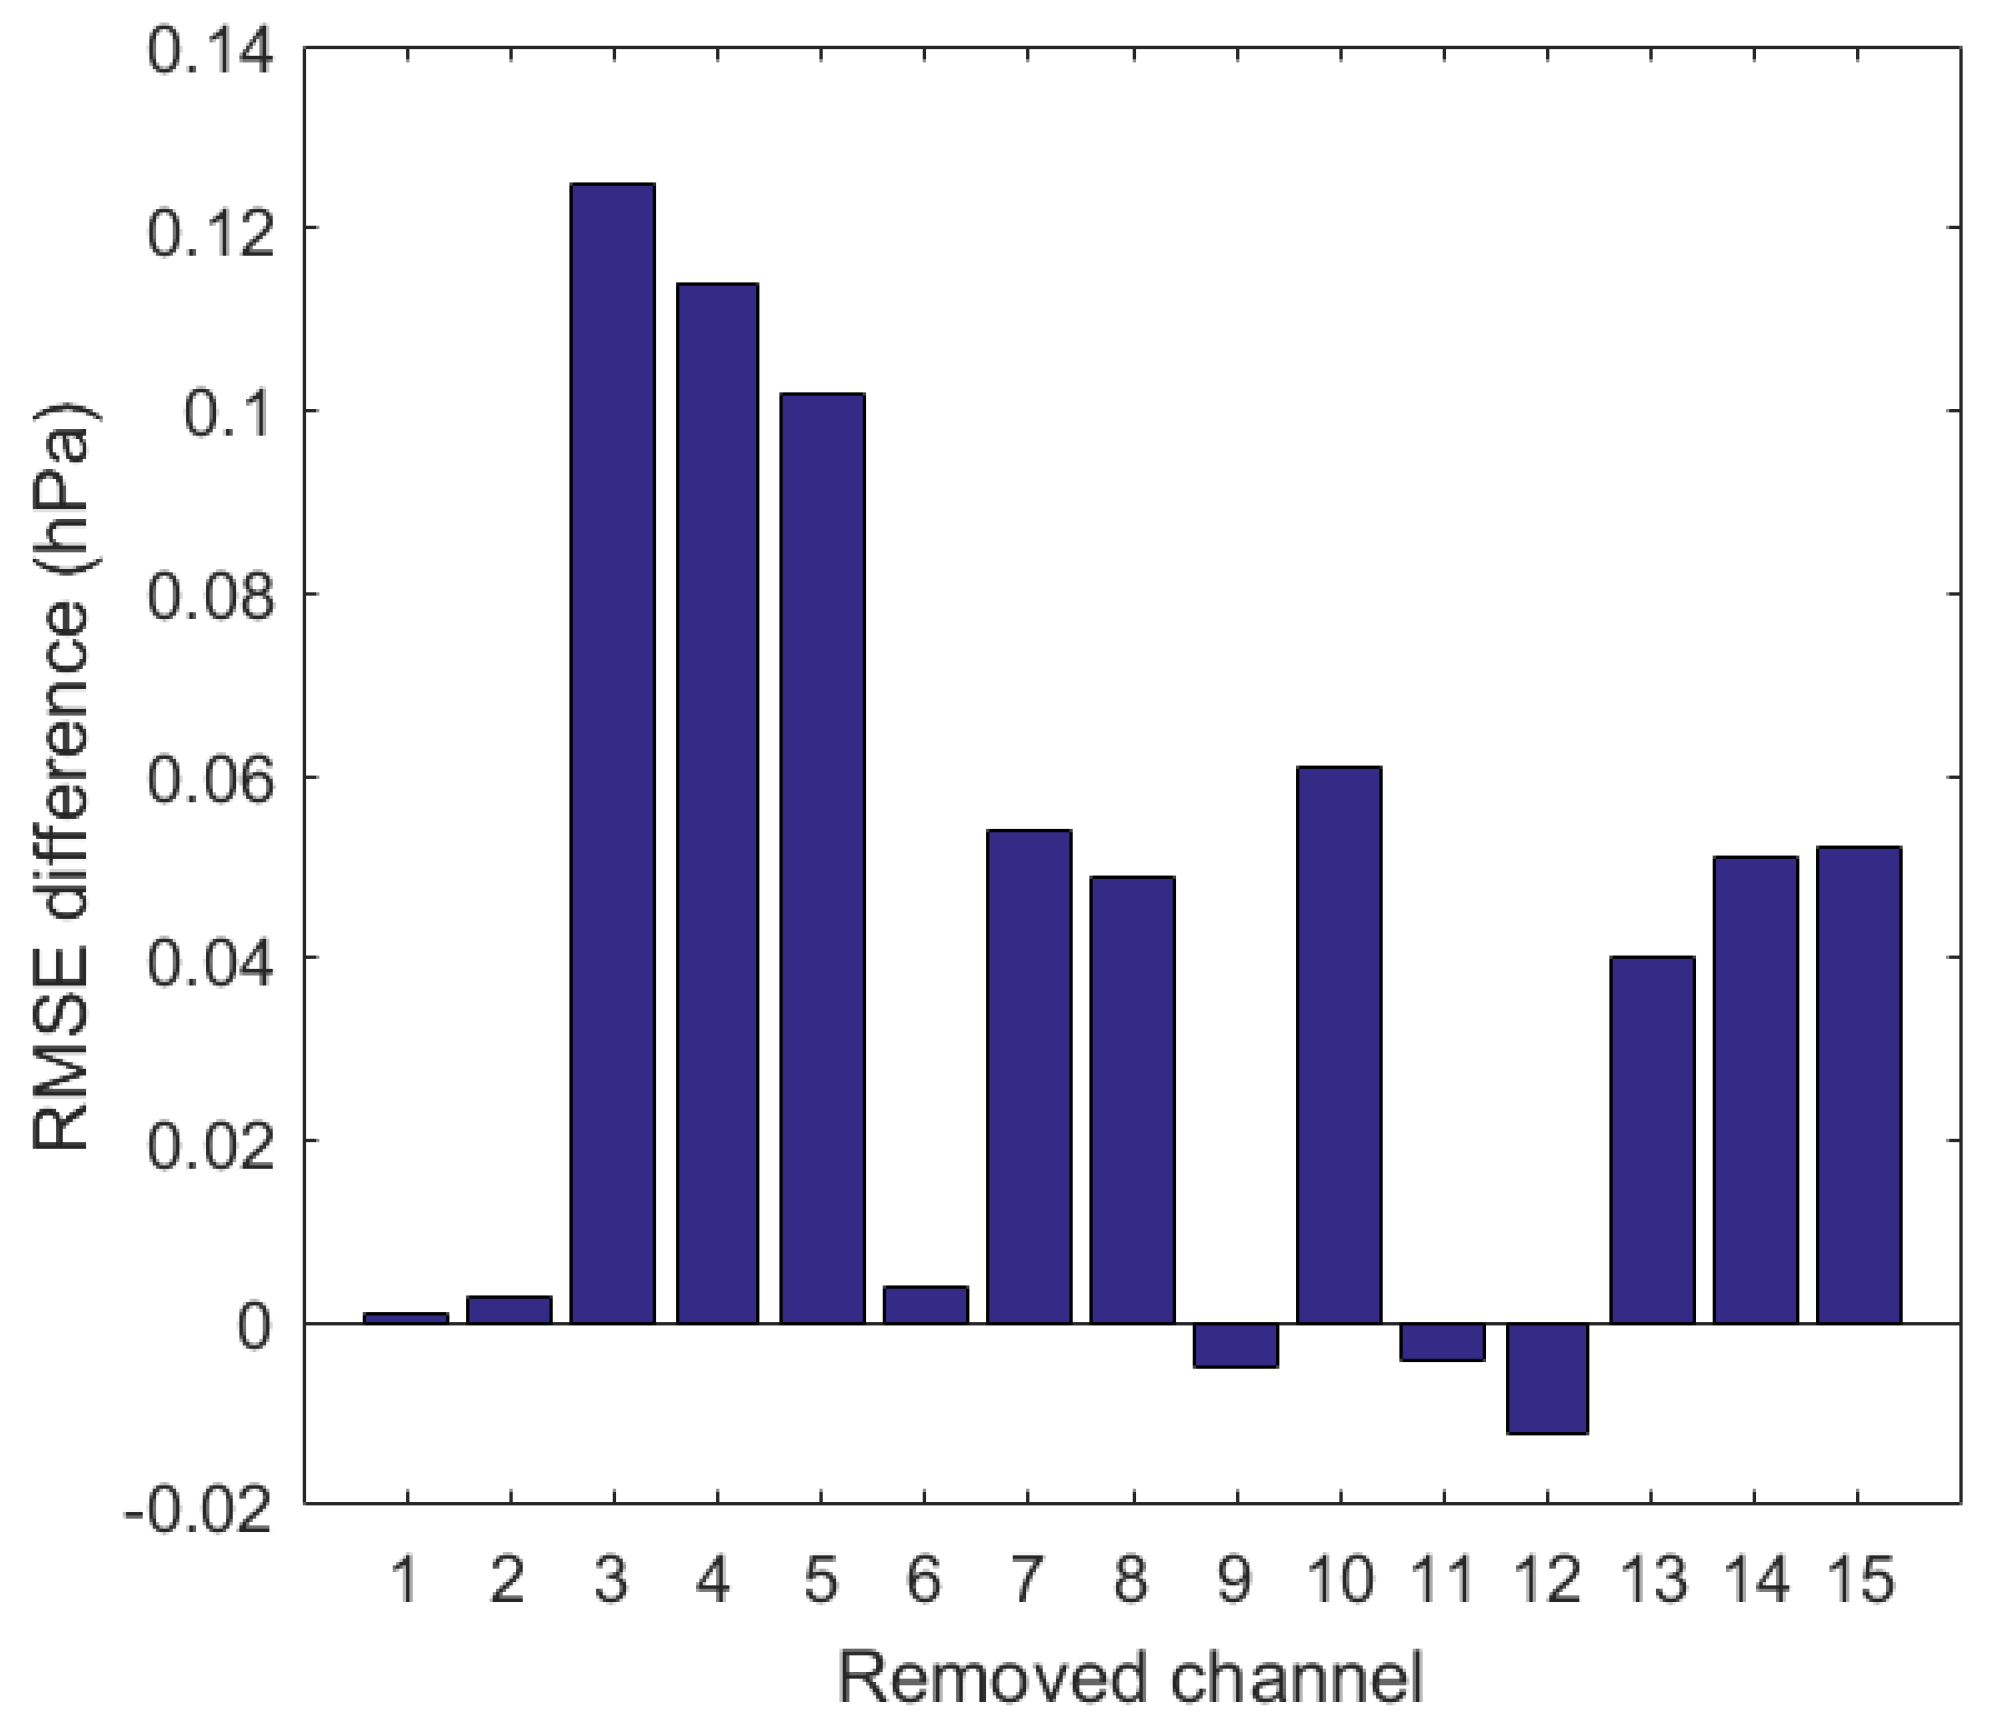
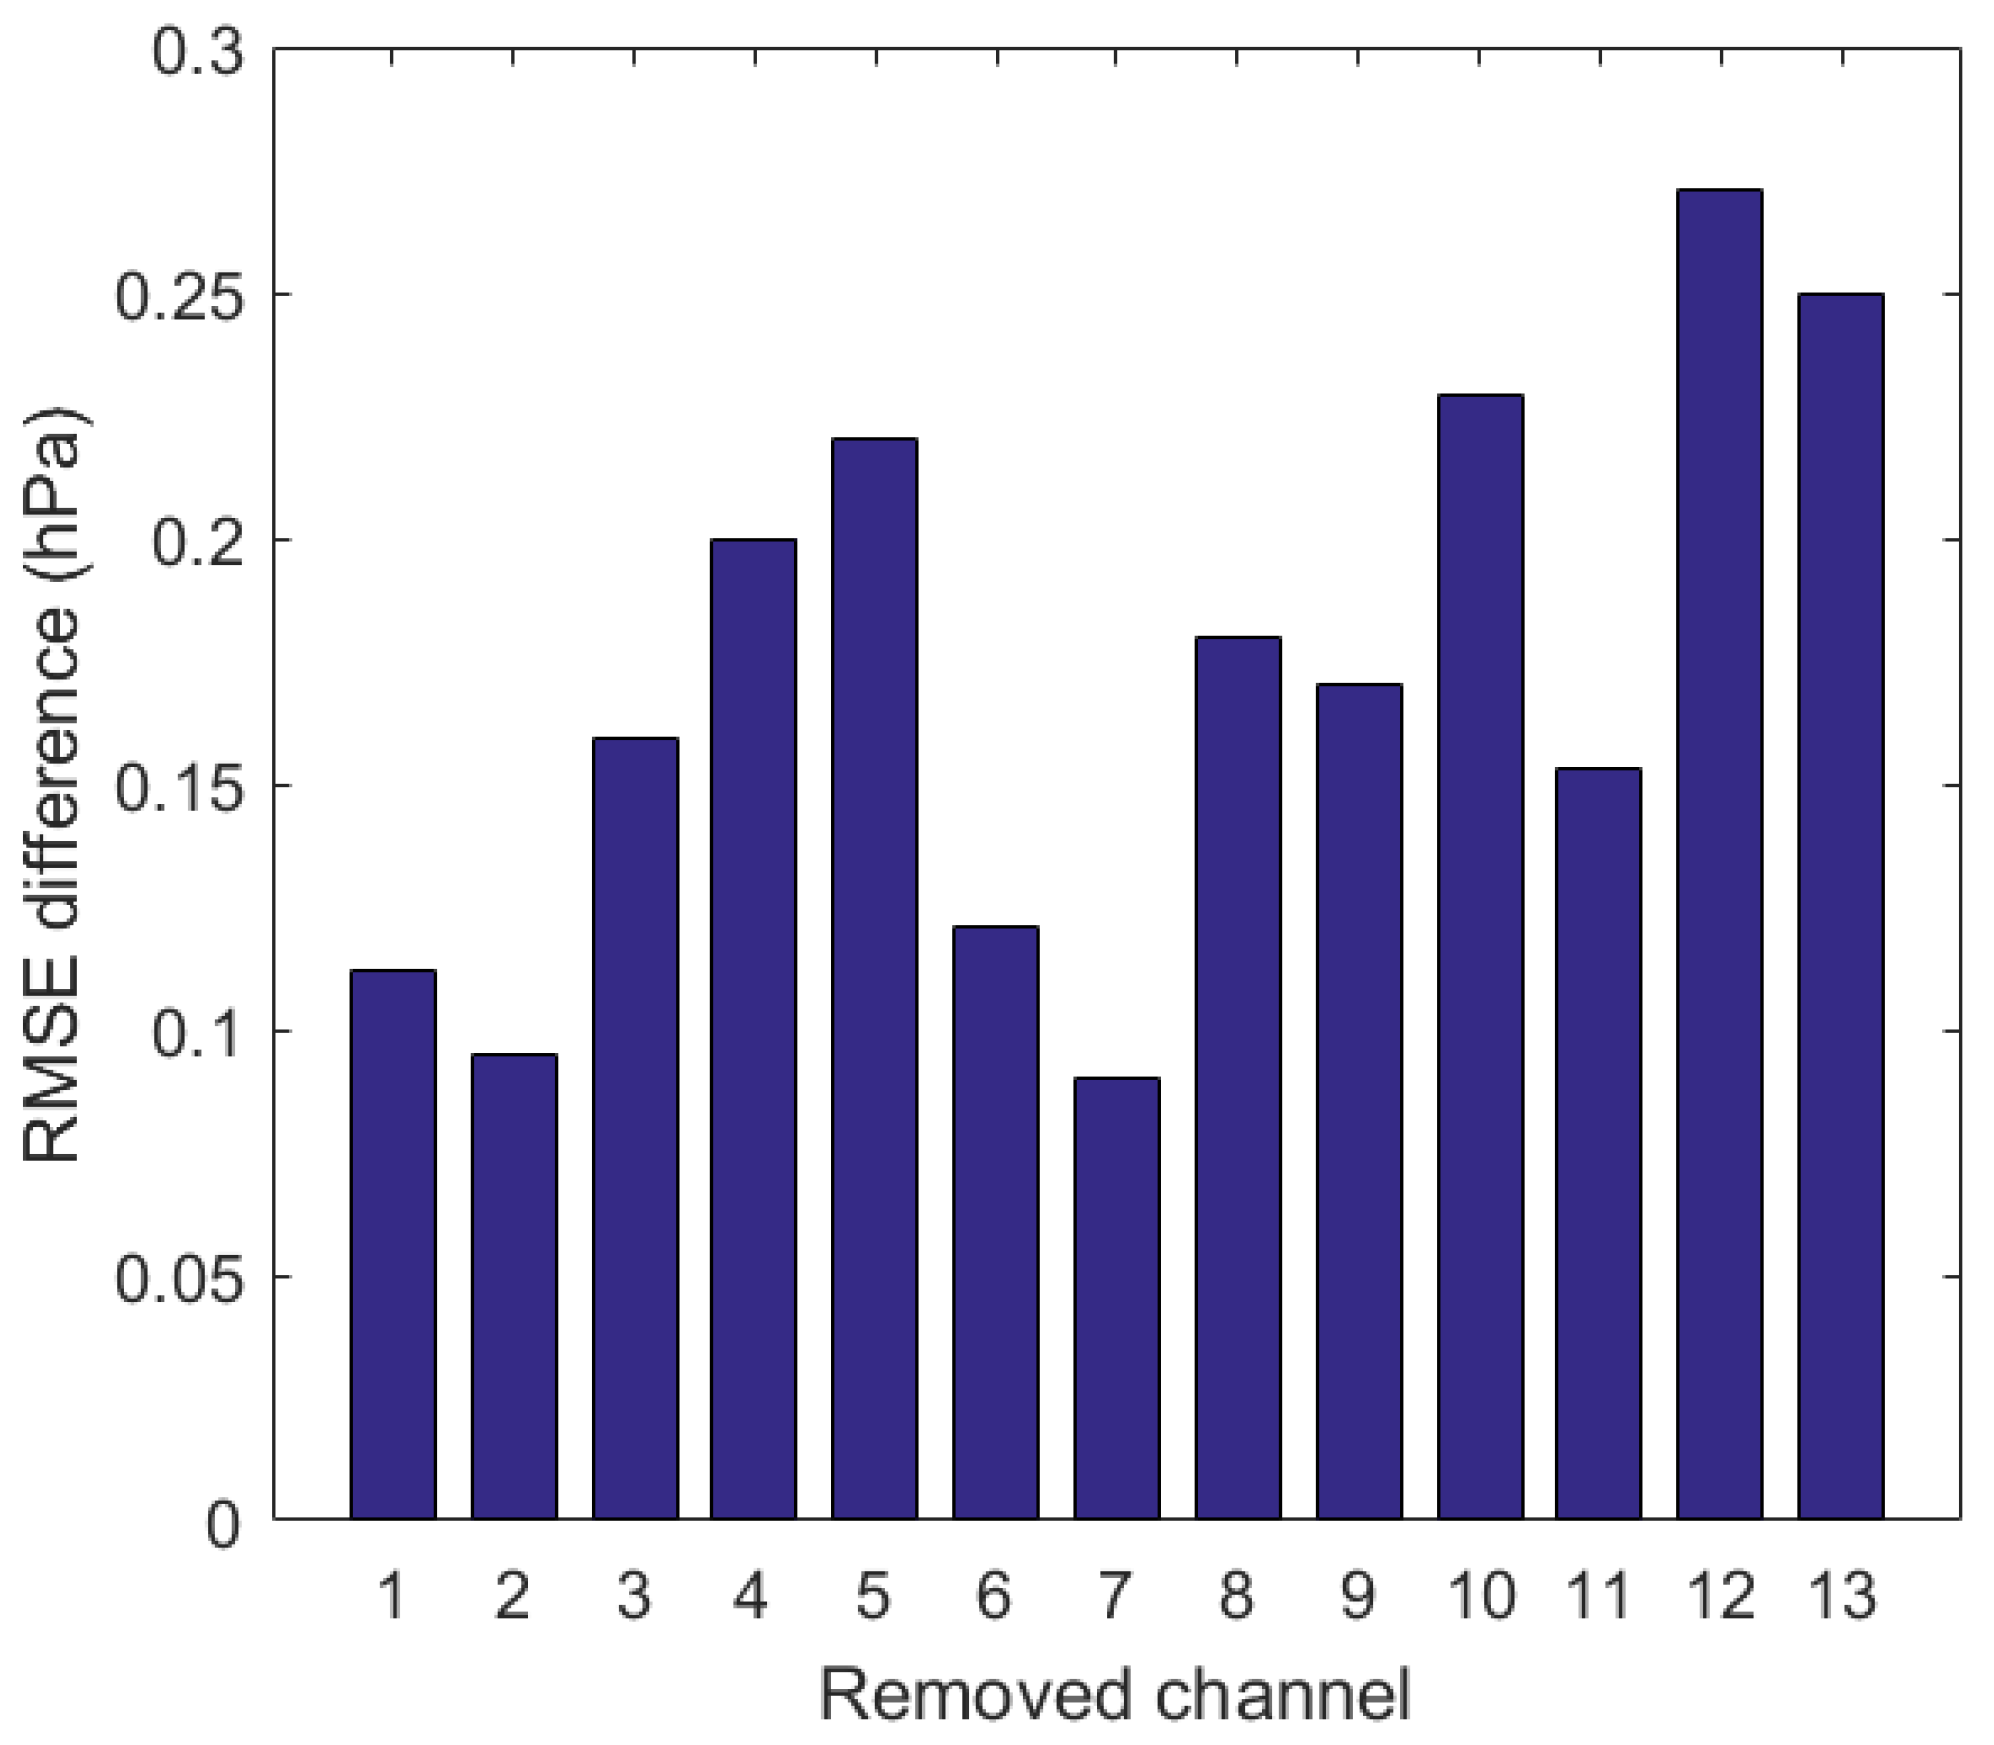
5.1. The Test Results of the Contribution of Each Channel to the SSP Retrieval

According to the design of Experiment 1, the DNN-based retrieval model from MWHTS by training the DNN, where the loss presented by RMSEs on the validation dataset and the training dataset both converge around 3.87 hPa, can be built. The retrieval result of SSP using the MWHTS observed brightness temperatures in the testing dataset is shown in Figure 8. Fifteen DNN-based retrieval models from the MWHTS channel combination removing one channel and the corresponding 15 SSP retrieval accuracies from the MWHTS channel combination removing one channel can be obtained, and the differences between the SSP retrieval accuracy from MWHTS and these 15 SSP retrieval accuracies from the MWHTS channel combination removing one channel, respectively, are shown in Figure 9.
For MWHTS, Figure 8a shows that the correlation coefficient between the retrievals and the validation values of SSP is 0.848, and although the correlation coefficient is high, the SSP retrieval accuracy from MWHTS is relatively low at 3.903 hPa. According to the comparison of the SSP retrieval accuracy from MWHTS with that of from the MWHTS channel combination removing one channel as shown in Figure 9, it can be observed that the SSP retrieval accuracy decreases by more than 0.05 hPa after removing channels 3–5, 7–8, 10, and 13–15 in MWHTS, respectively, which in turn indicates the important contribution of these channels to the SSP retrieval.
However, the retrieval of atmospheric parameters using the satellite observations is affected by the instrument observation errors, and the data quality of each channel of the microwave radiometer varies greatly, which in turn leads to some channels in the retrieval calculation not being useful for the retrieval or even reducing the retrieval accuracy. As shown in Figure 9, when channels 1, 2, 6, 9, 11, and 12 are removed from MWHTS, respectively, there is almost no effect on the SSP retrieval accuracy from MWHTS. The main reason may be because the data quality of these channels is poor for retrieving SSP, while the exact reason needs to be further investigated.
The test results of the contribution of each channel of MWHTS to the SSP retrieval also reveal that channels 3, 4, 13, and 14, with zero surface transmissivity, contribute to the SSP retrieval, thus also validating that the sensitivity test results based on the radiative transfer model in Section 3.2 cannot accurately describe the relationship between MWHTS observations and SSP.
Following the same operation as for testing the contribution of each channel of MWHTS to the SSP retrieval, the DNN-based retrieval model from MWTS-II by training the DNN, where the losses converge around 2.71 hPa, can be built. The SSP retrieval results using the MWTS-II observed brightness temperatures in the testing dataset is shown in Figure 10. Thirteen DNN-based retrieval models from the MWTS-II channel combination removing one channel and the corresponding 13 SSP retrieval accuracies from the MWTS-II channel combination removing one channel can be obtained, and the differences between the SSP retrieval accuracy from MWTS-II and these 13 SSP retrieval accuracies, respectively, are shown in Figure 11.
For MWTS-II, it can be found from Figure 10a that the correlation coefficient between the retrievals and validation values of SSP is 0.934, and the retrieval accuracy of SSP is 2.725 hPa. From Figure 11, it can be observed that the decreases in the SSP retrieval accuracy from MWTS-II are above 0.1 hPa after removing any channel in MWTS-II, which can indicate that each channel in MWTS-II contributes to the SSP retrieval. Meanwhile, according to the comparison of the SSP retrieval accuracy from MWTS-II with that of from the MWTS-II channel combination removing one channel, the theoretical assumption presented in Section 3.1 that the observations of the channels whose surface transmissivity are zero can be used to retrieve SSP has been validated. The test results of the contribution of each channel of MWTS-II to the SSP retrieval can also validate that the sensitivity test results based on the radiative transfer model in Section 3.2 do not accurately describe the relationship between MWTS-II observations and SSP.
Based on the test results of the contribution of each channel of MWHTS and MWTS-II to the SSP retrieval, it can be demonstrated that the theoretical assumption presented in Section 3.1 and the sensitivity test method based on the radiative transfer model is not applicable to the SSP retrieval. Therefore, the sensitivity test results based on the radiative transfer model as shown in Section 3.2 are not applied in the fusion retrieval. For the fusion retrieval from MWHTS and MWTS-II, according to the procedure of establishing the optimal theoretical channel combination given in the design of Experiment 2 and the test results of the contribution of each channel of MWHTS and MWTS-II to the SSP retrieval, the optimal theoretical channel combination can be created by removing channels 1–2, 6, 9, 11, and 12 in MWHTS that do not contribute to the SSP retrieval in the theoretical channel combination. Therefore, the theoretical channel combination and the optimal theoretical channel combination will be used to carry out the fusion retrieval experiments for SSP, and the configurations of these two channel combinations are listed in Table 5.

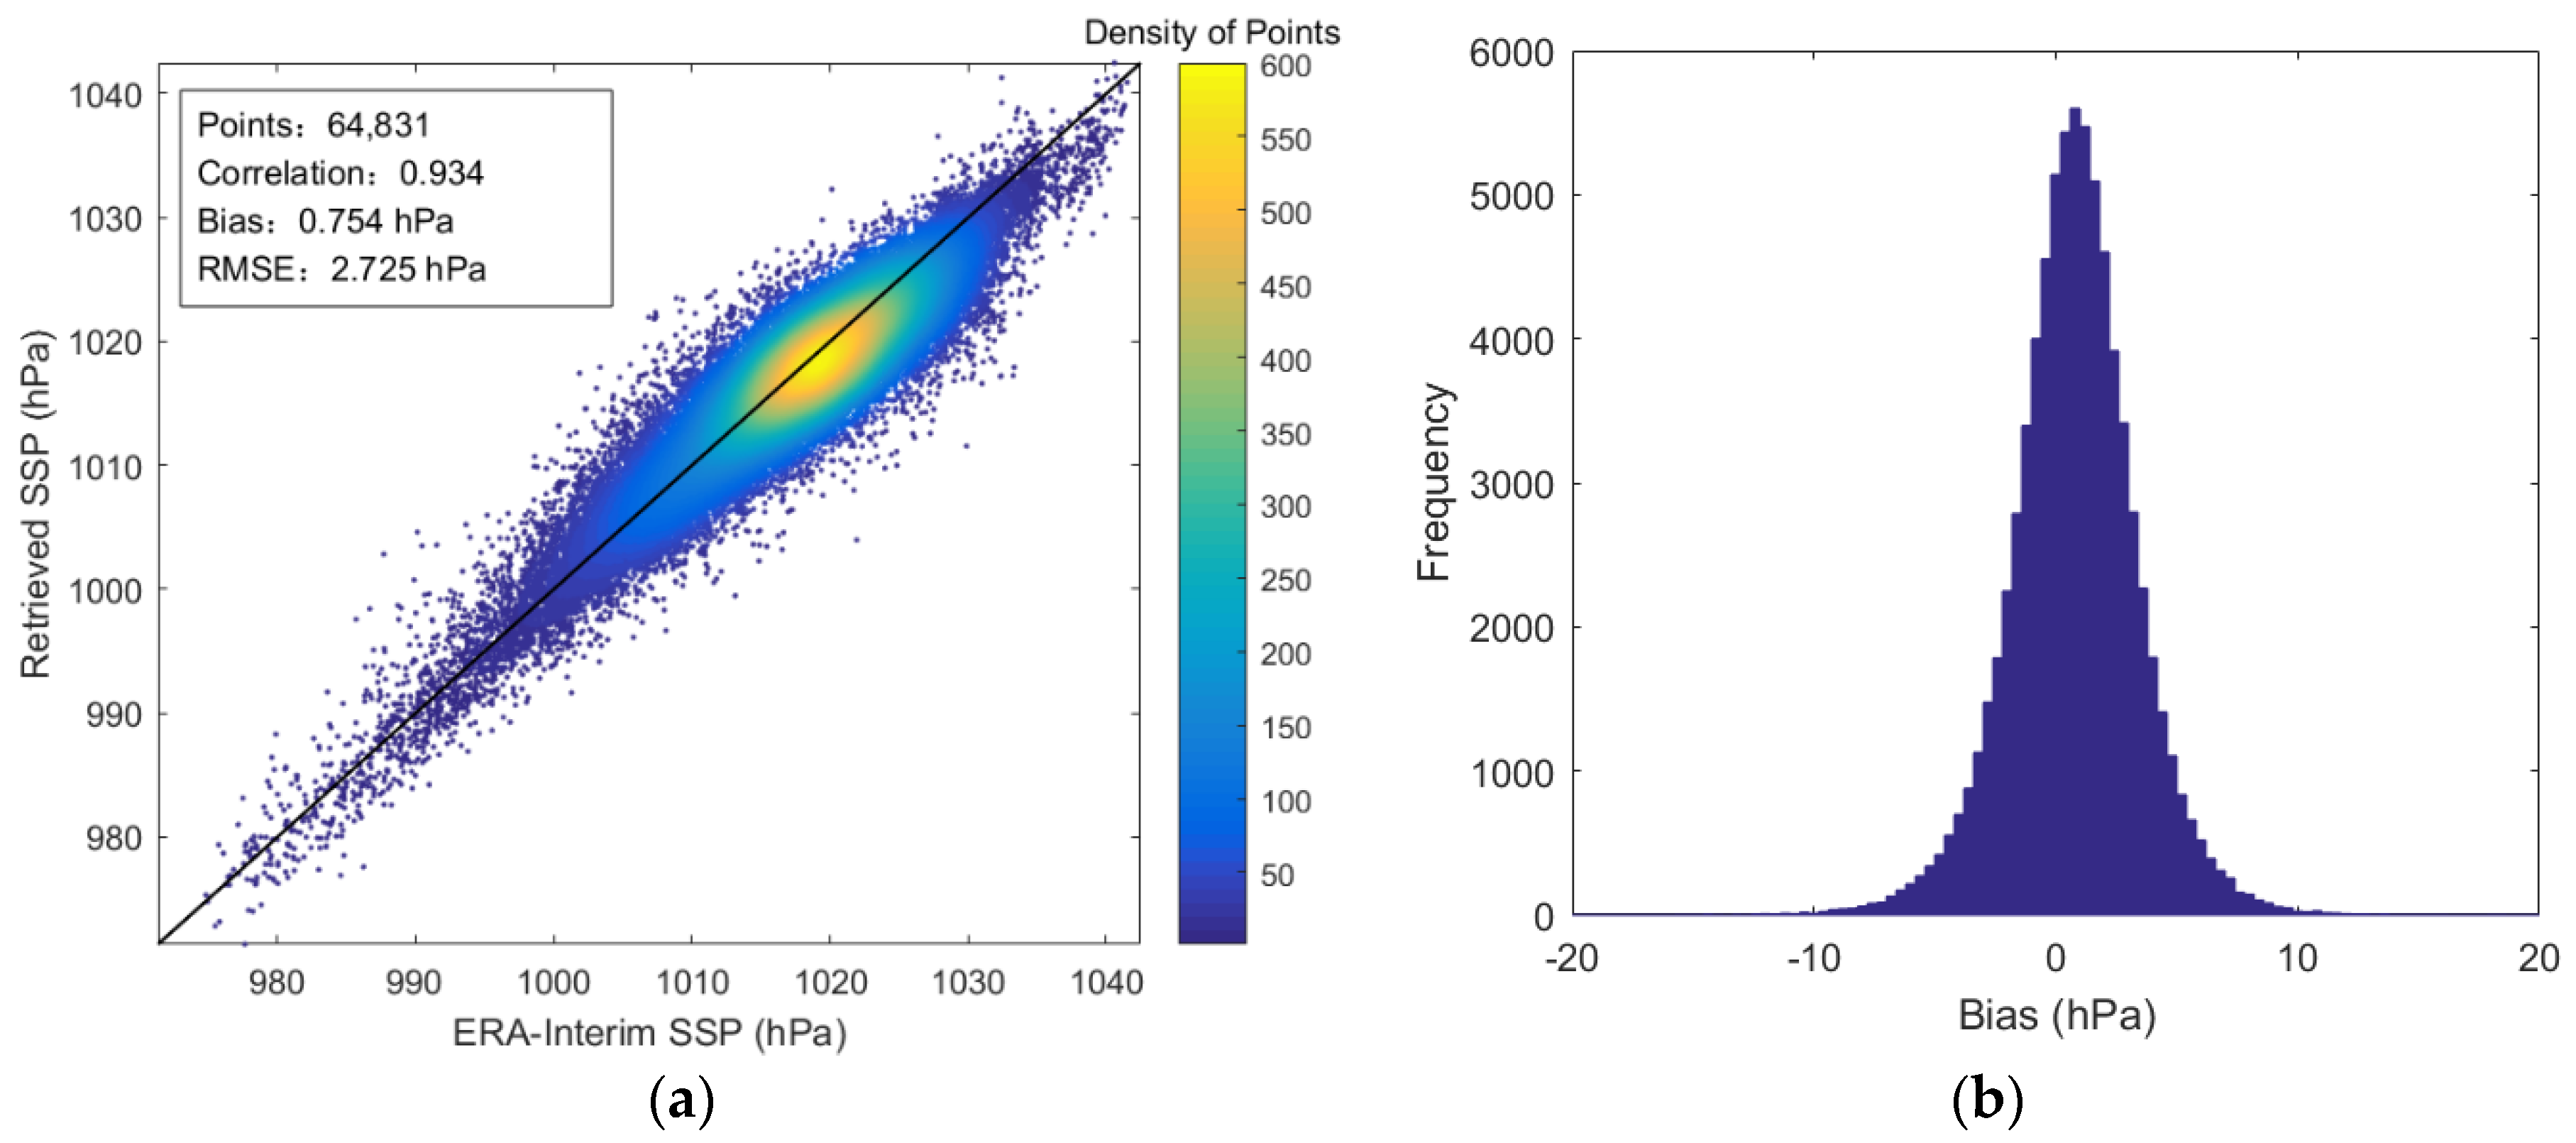
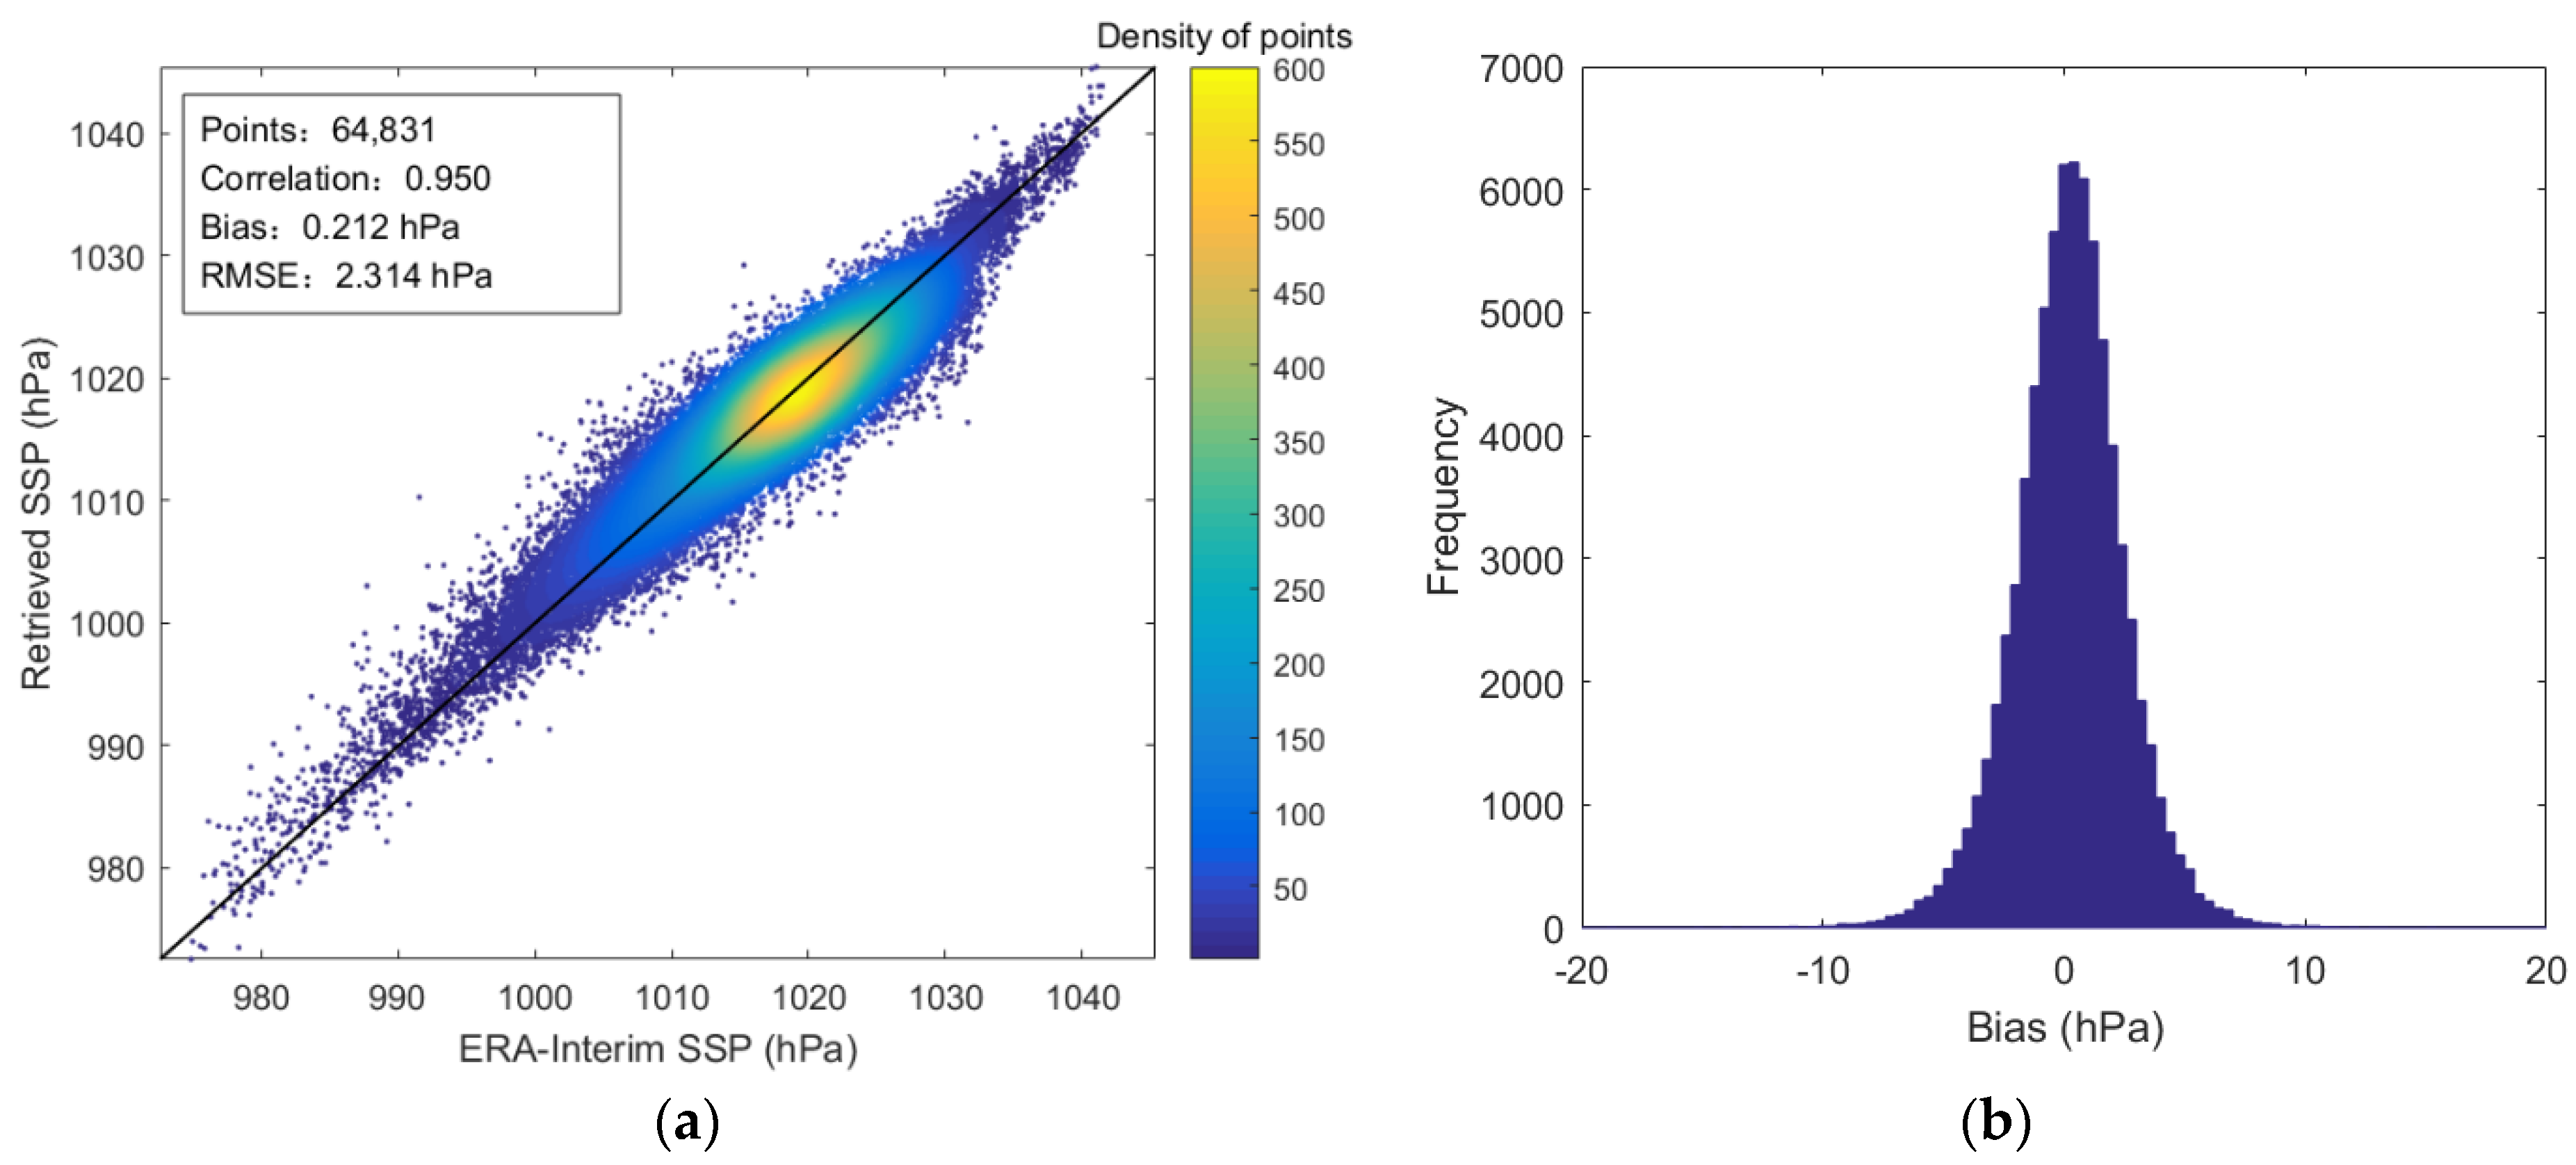
5.2. The Fusion Retrieval Results of SSP from MWHTS and MWTS-II

According to the design of Experiment 2, the DNN-based retrieval model from the theoretical channel combination by training the DNN where the loss presented by RMSEs on the validation dataset, and the training dataset both converge around 2.29 hPa, can be built. The SSP retrieval result using the observed brightness temperatures of the theoretical channel combination in the testing dataset is shown in Figure 12. Following the same operation as for retrieving SSP using the theoretical channel combination, the DNN-based retrieval model from the optimal theoretical channel combination by training the DNN, where the losses converge around 2.09 hPa, can be built. The SSP retrieval result using the observed brightness temperatures of the optimal theoretical channel combination in the testing dataset is shown in Figure 13.
When the theoretical channel combination (i.e., MWHTS + MWTS-II) is used to retrieve SSP, Figure 12a shows that the retrieval result is significantly improved compared with that of the single sounder (3.903 hPa from MWHTS or 2.725 hPa from MWTS-II) as shown in Figure 8a and Figure 10a. The correlation coefficient between the retrievals and validation values of SSP is 0.950, and the retrieval accuracy is 2.314 hPa, which is 1.59 hPa better than that of MWHTS and 0.41 hPa better than that of MWTS-II. This retrieval result indicates that the retrieval accuracy of SSP can be improved by combining the observations of MWHTS and MWTS-II in retrieving SSP.
Compared with the theoretical channel combination, the retrieval results of SSP from the optimal theoretical channel combination have been further improved as shown in Figure 13a. The correlation coefficient between the retrieval values and the validation values of SSP is 0.961, and the retrieval accuracy is 2.104, which is 0.21 hPa better than that of the theoretical channel combination. This validates the method of building the optimal theoretical channel combination for the fusion retrieval of SSP from MWHTS and MWTS-II by removing the channels which have no contribution to the retrieval of SSP in the theoretical channel combination as effective, and can further improve the retrieval accuracy of SSP.
In this study, the number of epochs is set to be large enough to avoid obtaining an underfit model, and the method of early stopping is used to avoid overfitting in the training of the DNN. These two means are effective because the experimental results from these two channel combinations do not suffer from overfitting or underfitting based on the convergence of the losses on the training dataset, the validation dataset, and the testing dataset. Measurements from more channels would theoretically contain more information about SSP and should obtain a higher retrieval accuracy. However, the SSP retrieval accuracy from the optimal theoretical channel combination (including 22 channels) in the retrieval experimental results is higher than that of the theoretical channel combination (including 28 channels). The main reason may be that the data quality of the channel observations is an important factor affecting the SSP retrieval accuracy when using the same DNN-based retrieval algorithm.
For MWHTS channels 1, 2, 6, 9, 11, and 12 that do not contribute to the SSP retrieval, there have been numerous studies demonstrating the important contribution of the observations of these channels to the retrieval of the atmospheric temperature and humidity profiles [41,42]. However, the data quality of these channels is poor for retrieving SSP. Comparison of the SSP retrieval experimental results from the theoretical channel combination and from the optimal theoretical channel combination shows that the channels that do not contribute to the SSP retrieval adversely affect the SSP retrieval accuracy, and removing these channels can further improve the SSP retrieval accuracy. However, it should be noted that a more optimized retrieval algorithm may be able to extract the information about SSP from the observations with poor data quality, and thus further optimize the effectiveness of microwave observations for retrieving SSP. Therefore, the continuous optimization of the retrieval algorithm is also important for the retrieval of SSP.
In summary, although the sensitivity test method of atmospheric parameters based on the radiative transfer model cannot describe the relationship between microwave observations and SSP and its sensitivity test results cannot be applied to the fusion retrieval of SSP, the optimal channel combination for the fusion retrieval can be established by testing the contribution of each channel of MWHTS and MWTS-II to the SSP retrieval, and then obtaining the SSP data with high accuracy, as well as achieving the purpose of obtaining higher retrieval accuracy of SSP than that of a single instrument (MWHTS or MWTS-II). In addition, it can be found through the fusion retrieval of SSP that although MWHTS contains observations in both the 118.75 GHz and 183.31 GHz bands, it still does not have a higher accuracy than MWTS-II, which only contains observations in a single frequency band of 60 GHz for retrieving SSP. The reason could be related to various factors such as frequency band characteristics, instrument channel settings, and atmospheric observation conditions. Therefore, for the theoretical development of passive microwave remote sensing of SSP, the comparison of the detection capability of different microwave bands for SSP needs further research.

6. Discussion and Conclusions

In this paper, in order to combine MWHTS and MWTS-II observations to retrieve SSP with high accuracy, the theoretical principle of retrieving SSP is analyzed using the passive microwave observations, and the sensitivity test experiments based on the radiative model for SSP are carried out. Meanwhile, the contribution of each channel of MWHTS and MWTS-II to the SSP retrieval is tested. According to the theoretical analysis, the theoretical channel combination is established, and the SSP retrieval experiment based on the theoretical channel combination is performed. The experimental result shows that the theoretical channel combination can achieve the purpose of combining the 60 GHz, 118.75 GHz, and 183.31 GHz observations to retrieve SSP with high accuracy, and its retrieval accuracy can be improved by 1.59 hPa and 0.41 hPa compared with that of MWHTS and MWTS-II alone, respectively. In addition, the retrieval accuracy can be further improved by 0.21 hPa when removing the channels which have no contribution to the SSP retrieval from the theoretical channel combination.
Based on the microwave radiative transfer equation, a direct link between satellite brightness temperature and SSP is established, and it can be deduced that the channels with non-zero surface transmissivity are sensitive to SSP. Meanwhile, based on the correlation between channels and the correlation between atmospheric parameters, the assumption that the channels with zero surface transmissivity also contain the SSP information and can be used to retrieve SSP is proposed, and verified by testing the contribution of each channel of MWHTS and MWTS-II to the retrieval of SSP.
In this study, the research objective of combining MWHTS and MWTS-II to retrieve SSP with higher accuracy than that of MWHTS or MWTS-II alone is achieved with no dependence on the sensitivity test results, and the sensitivity test results are verified by the test results of the contribution of each channel of MWHTS and MWTS-II to the SSP retrieval to be not valuable for the SSP retrieval. However, continued research on the sensitivity test of passive microwave observations to SSP can not only provide an essential reference for retrieving the atmospheric parameters, but also have important significance for the subsequent multi-band fusion retrieval or the data application of hyperspectral microwave radiometer. It is necessary to find a new sensitivity test method for SSP, which is also the focus of our future work. In addition, comparing the detection capability of different microwave bands for SSP from the perspective of physical retrieval or improved DNN-based retrieval is of great significance for the development of the retrieval theory of SSP, which is also the focus of our future work.

Author Contributions

Q.H. and Z.W. designed the study; Q.H. and J.L. carried out the experiments; Z.W. presented some conclusions; Q.H. wrote the manuscript; and Z.W. and J.L. edited the article. All authors have read and agreed to the published version of the manuscript.

Funding

This research was funded by the National Natural Science Foundation of China under Grant No. 41901297, 41806209, the Science and Technology Key Project of Henan Province under Grant No. 202102310017, the Key Research Projects for the Universities of Henan Province under Grant No. 20A170013, and the China Postdoctoral Science Foundation under Grant No. 2021M693201.

Acknowledgments

The authors would like to thank NSMC for providing the MWHTS and MWTS-II observations, as well as ECMWF for providing the ERA-Interim reanalysis data.

Conflicts of Interest

The authors declare no conflict of interest. The funders had no role in the design of the study, in the collection, analyses, or interpretation of data, in the writing of the manuscript, or in the decision to publish the results.

References

  1. Flasar, F.M.; Baines, K.H.; Bird, M.K.; Tokano, T.; West, R.A. Atmospheric Dynamics and Meteorology; Springer: Dordrecht, The Netherlands, 2009. [Google Scholar] [CrossRef]
  2. Lorenc, A.C. Analysis methods for numerical weather prediction. Q. J. R. Meteorol. Soc. 2010, 112, 1177–1194. [Google Scholar] [CrossRef]
  3. Min, Q.; Gong, W.; Lin, B.; Hu, Y. Application of surface pressure measurements from O2-band differential absorption radar system in three-dimensional data assimilation on hurricane: Part I. An observing system simulation experiments study. J. Quant. Spectrosc. Radiat. Transf. 2011, 150, 148–165. [Google Scholar] [CrossRef] [Green Version]
  4. Lin, B.; Hu, Y.; Harrah, S.; Neece, R.; Lawrence, R.; Fralick, D. The Feasibility of Radar-Based Remote Sensing of Barometric Pressure; Hampton, V.A., Ed.; NASA Langley Research Center: Hampton, VA, USA, 2006.
  5. Liu, H.; Duan, M.; Lü, D.; Zhang, Y. Algorithm for retrieving surface pressure from hyperspectral measurements in oxygen A-band. Chin. Sci. Bull. 2014, 59, 1492–1498. [Google Scholar] [CrossRef]
  6. O’Brien, D.M.; Mitchell, R.M.; English, S.A.; da Costa, G.A. Airborne measurements of air mass from O2 A-band absorption spectral. J. Atmos. Ocean. Technol. 1998, 15, 1272–1286. [Google Scholar] [CrossRef]
  7. Healy, S.B. Surface pressure information retrieved from GPS radio occultation measurements. Q. J. R. Meteorol. Soc. 2013, 139, 2108–2118. [Google Scholar] [CrossRef]
  8. Hsu, C.S.; Liu, W.T. Wind and pressure fields near tropical cyclone Oliver derived from scatterometer observations. J. Geophys. Res. 1996, 101, 17021–17027. [Google Scholar] [CrossRef]
  9. Patoux, J.; Foster, R.C.; Brown, R.A. An evaluation of scatterometer-derived oceanic surface pressure fields. J. Appl. Meteorol. Clim. 2008, 47, 835–852. [Google Scholar] [CrossRef] [Green Version]
  10. Zhang, L.; Huang, S.; Du, H. A new method of retrieving typhoon’s sea level pressure fields and central positions from scatterometer-derived sea surface winds. Acta Phys. Sin. 2011, 60, 119202. [Google Scholar] [CrossRef]
  11. Van Zadelhoff, G.J.; Stoffelen, A.; Vachon, P.W.; Wolfe, J.; Horstmann, J.; Belmonte Rivas, M. Retrieving hurricane wind speeds using C-band measurements. Atmos. Meas. Tech. 2014, 7, 437–449. [Google Scholar] [CrossRef] [Green Version]
  12. Kidder, S.Q.; Goldberg, M.D.; Zehr, R.M.; Demaria, M.; Purdom, J.F.W.; Velden, C.S.; Grody, N.C.; Kusselson, S.J. Satellite analysis of Tropical cyclones using the advanced Microwave Sounding Unit (AMSU). Bull. Amer. Meteor. Soc. 2000, 81, 1241–1260. [Google Scholar] [CrossRef] [Green Version]
  13. Elachi, C.; van Zyl, J. Introduction to the Physics and Techniques of Remote Sensing; John Wiley & Sons Inc.: Hoboken, NJ, USA, 2006. [Google Scholar] [CrossRef]
  14. Ulaby, F.T.; Moore, R.K.; Fung, A.K. Microwave Remote Sensing: Active and Passive; Addison-Wesley: Reading, MA, USA, 1981. [Google Scholar]
  15. Zhang, Z. Study on the Retrieval Theory and Method of Sea Surface Pressure Basing on Passive Microwave Observations. Ph.D. Thesis, Chinese Academy of Science, Beijing, China, 2019. [Google Scholar]
  16. Zhang, Z.; Dong, X.; Liu, L.; He, J. Retrieval of barometric pressure from satellite passive microwave observations over the oceans. J. Geophys. Res. 2018, 123, 4360–4372. [Google Scholar] [CrossRef]
  17. He, J.; Zhang, S. Regional profiles and precipitation retrievals and analysis using FY-3C MWHTS. Atmos. Clim. Sci. 2016, 6, 273–284. [Google Scholar] [CrossRef] [Green Version]
  18. Guo, Y.; Lu, N.; Qi, C.; Gu, S.; Xu, J. Calibration and validation of microwave humidity and temperature sounder onboard FY-3C satellite. Chin. J. Geophys. Chin. 2015, 58, 20–31. [Google Scholar] [CrossRef]
  19. He, Q.; Wang, Z.; He, J. Bias correction for retrieval of atmospheric parameters from the Microwave Humidity and Temperature Sounder onboard the Fengyun-3C satellite. Atmosphere 2016, 7, 156. [Google Scholar] [CrossRef] [Green Version]
  20. Liebe, H.J.; Hufford, G.A.; Cotton, M.G. Propagation modeling of moist air and suspended water/ice particles at frequencies below 1000 GHz. In Proceedings of the AGARD 52nd Specialists Meeting of Electromagnetic Wave Propagation Panel, Palma De Mallorca, Spain, 17–21 May 1993. [Google Scholar]
  21. Berrisford, P.; Dee, D.; Poli, P.; Brugge, R.; Fielding, K.; Fuentes, M.; Kallberg, P.; Kobayashi, S. The ERA-Interim Archive Version 2.0; ERA Report Series 1; ECMWF: Reading, UK, 2011. [Google Scholar]
  22. Dee, D.P.; Uppala, S.M.; Simmons, A.J.; Berrisford, P.; Poli, P.; Kobayashi, S.; Andrae, U.; Balmaseda, M.A.; Balsamo, G.; Bauer, P.; et al. The ERA-Interim reanalysis: Configuration and performance of the data assimilation system. Q. J. R. Meteorol. Soc. 2011, 137, 553–597. [Google Scholar] [CrossRef]
  23. Saunders, R.; Hocking, J.; Rundle, D.; Rayer, P.; Matricardi, M.; Geer, A.; Lupu, C.; Brunel, P.; Vidot, J. RTTOV-11 Science and Validation Report; NWP-SAF Report; Met Office: Exeter, UK, 2013; pp. 1–62.
  24. Saunders, R.; Hocking, J.; Turner, E.; Rayer, P.; Rundle, D.; Brunel, P.; Vidot, J.; Roquet, P.; Matricardi, M.; Geer, A.; et al. An update on the RTTOV fast radiative transfer model (currently at version 12). Geosci. Model Dev. 2018, 11, 2717–2737. [Google Scholar] [CrossRef] [Green Version]
  25. Wang, J.R.; Chang, L.A. Retrieval of water vapor profiles from microwave radiometric measurements near 90 and 183 GHz. J. Appl. Meteorol. 1990, 29, 1005–1013. [Google Scholar] [CrossRef] [Green Version]
  26. Boukabara, S.A.; Garrett, K.; Chen, W.; Iturbide-Sanchez, F.; Grassotti, C.; Kongoli, C.; Chen, R.; Liu, Q.; Yan, B.; Weng, F.; et al. MiRS: An all-weather 1DVAR satellite data assimilation and retrieval system. IEEE Trans. Geosci. Remote Sens. 2011, 49, 3249–3272. [Google Scholar] [CrossRef]
  27. Weng, F.; Zou, X.; Qin, Z. Uncertainty of AMSU-A derived temperature trends in relationship with clouds and precipitation over ocean. Clim. Dyn. 2014, 43, 1439–1448. [Google Scholar] [CrossRef]
  28. Moradi, I.; Ferraro, R.R.; Soden, B.J.; Eriksson, P.; Arkin, P. Retrieving Layer-Averaged Tropospheric Humidity from Advanced Technology Microwave Sounder Water Vapor Channels. IEEE Trans. Geosci. Remote Sens. 2015, 53, 6675–6688. [Google Scholar] [CrossRef] [Green Version]
  29. Navas-Guzmán, F.; Stähli, O.; Kämpfer, N. An integrated approach toward the incorporation of clouds in the temperature retrievals from microwave measurements. Atmos. Meas. Technol. 2014, 7, 1619–1628. [Google Scholar] [CrossRef] [Green Version]
  30. Han, Y.; Van Delst, P.; Liu, Q.H.; Weng, F.Z.; Yan, B.; Treadon, R.; Derber, J. Community Radiative Transfer Model (CRTM),-Version 1; NOAA Technical Report 122; Department of Commerce/NOAA/NESDIS: Washington, DC, USA, 2006.
  31. Buehler, S.A.; Mendrok, J.; Eriksson, P.; Perrin, A.; Larsson, R.; Lemke, O. ARTS, the Atmospheric Radiative Transfer Simulator—version 2.2, the planetary toolbox edition. Geosci. Model Deve. 2018, 11, 1537–1556. [Google Scholar] [CrossRef] [Green Version]
  32. Dee, D.P. Bias and data assimilation. Q. J. R. Meteorol. Soc. 2005, 131, 3323–3343. [Google Scholar] [CrossRef] [Green Version]
  33. Auligné, T.; McNally, A.P.; Dee, D.P. Adaptive bias correction for satellite data in a numerical weather prediction system. Q. J. R. Meteorol. Soc. 2007, 133, 631–642. [Google Scholar] [CrossRef]
  34. Golubkov, G.V.; Manzhelii, M.I.; Berlin, A.A.; Eppelbaum, L.V.; Lushnikov, A.A.; Morozov, I.I.; Dmitriev, A.V.; Adamson, S.O.; Dyakov, Y.A.; Morozov, A.N.; et al. The Problems of Passive Remote Sensing of the Earth’s Surface in the Range of 1.2–1.6 GHz. Atmosphere 2020, 11, 650. [Google Scholar] [CrossRef]
  35. He, Q.; Wang, Z.; Li, J. Application of the deep neural network in retrieving the atmospheric temperature and humidity profiles from the Microwave Humidity and Temperature Sounder onboard the Feng-Yun-3 satellite. Sensors-Basel 2021, 21, 4673. [Google Scholar] [CrossRef] [PubMed]
  36. Zhou, Y.; Grasstotti, C. Development of a machine learning-based radiometric bias correction for NOAA’s Microwave integrated retrieval system (MIRS). Remote Sens. 2020, 12, 3160. [Google Scholar] [CrossRef]
  37. Yan, X.; Liang, C.; Jiang, Y.; Luo, N.; Zang, Z.; Li, Z. A deep learning approach to improve the retrieval of temperature and humidity profiles from a ground-based microwave radiometer. IEEE Trans. Geosci. Remote Sens. 2020, 58, 8427–8437. [Google Scholar] [CrossRef]
  38. Blackwell, W.J.; Chen, F.W. Neural Networks in Atmospheric Remote Sensing; Artech House: Norwood, MA, USA, 2009. [Google Scholar]
  39. Srivastava, N.; Hinton, G.; Krizhevsky, A.; Sutskever, I.; Salakhutdinov, R. Dropout: A simple way to prevent neural networks from overfitting. J. Mach. Learn. Res. 2014, 15, 1929–1958. [Google Scholar]
  40. Lee, Y.; Han, D.; Ahn, M.H.; Im, J.; Lee, S.J. Retrieval of total precipitable water from Himawari-8 AHI data: A comparison of random forest, extreme gradient boosting, and deep neural network. Remote Sens. 2019, 11, 1741. [Google Scholar] [CrossRef] [Green Version]
  41. Lu, Q.; Hu, J.; Wu, C.; Qi, C.; Wu, S.; Xu, N.; Sun, L.; Li, X.; Liu, H.; Guo, Y.; et al. Monitoring the performance of the Fengyun satellite instruments using radiative transfer models and NWP fields. J. Quant. Spectrosc. Radiat. Transf. 2020, 225, 107239. [Google Scholar] [CrossRef]
  42. Carminati, F.; Migliorini, S. All-sky Data Assimilation of MWTS-2 and MWHS-2 in the Met Office Global NWP System. Adv. Atmos. Sci. 2021, 38, 1682–1694. [Google Scholar] [CrossRef]
Figure 1. Weighting functions for MWHTS and MWTS-II calculated from the U.S. standard atmospheric profile at nadir, assuming a surface emissivity of 0.6: (a) MWHTS; (b) MWTS-II.
Remotesensing 14 00276 g001
Figure 2. The schematic of the data pre-processing procedures.
Remotesensing 14 00276 g002
Figure 3. The mean value of the surface transmissivity, Υ ( P S , 0 ) , of each channel of MWHTS and MWTS-II in the analysis dataset.
Remotesensing 14 00276 g003
Figure 4. The schematic of building the sensitivity test dataset.
Remotesensing 14 00276 g004
Figure 5. The results of the sensitivity test of MWHTS and MWTS-II to SSP: (a) MWHTS; (b) MWTS-II.
Remotesensing 14 00276 g005
Figure 6. The mean value of surface transmissivity, Υ ( P S , 0 ) , of each channel of MWHTS and MWTS in sensitivity test datasets.
Remotesensing 14 00276 g006
Figure 7. The schematic of retrieving SSP.
Remotesensing 14 00276 g007
Figure 8. The retrieval result of SSP and the distribution of retrieval bias from MWHTS: (a) the retrieval result; (b) the distribution of bias.
Remotesensing 14 00276 g008
Figure 9. The differences between the SSP retrieval accuracy from MWHTS and the 15 SSP retrieval accuracies from the MWHTS channel combination removing one channel.
Remotesensing 14 00276 g009
Figure 10. The SSP retrieval results and the distribution of retrieval bias from MWTS-II: (a) the retrieval results; (b) the distribution of bias.
Remotesensing 14 00276 g010
Figure 11. The differences between the SSP retrieval accuracy from MWTS-II and the 13 SSP retrieval accuracies from the MWTS-II channel combination removing one channel.
Remotesensing 14 00276 g011
Figure 12. The SSP retrieval result and the distribution of retrieval bias from the theoretical channel combination: (a) The retrieval result; (b) The distribution of bias.
Remotesensing 14 00276 g012
Figure 13. The SSP retrieval result and the distribution of retrieval bias from the optimal theoretical channel combination: (a) The retrieval result; (b) The distribution of bias.
Remotesensing 14 00276 g013
Table 1. Channel characteristics of MWHTS.
ChannelFrequency (GHz)Sensitivity Requirements (K)On-Orbit Sensitivity (K)Calibration Accuracy (K)Peak WF Height (hPa)
189.01.00.231.3surface
2118.75 ± 0.083.61.622.030
3118.75 ± 0.22.00.752.050
4118.75 ± 0.31.60.592.0100
5118.75 ± 0.81.60.652.0250
6118.75 ± 1.11.60.522.0350
7118.75 ± 2.51.60.492.0surface
8118.75 ± 3.01.00.272.0surface
9118.75 ± 5.01.00.272.0surface
10150.01.00.341.3surface
11183.31 ± 1.01.00.471.3300
12183.31 ± 1.81.00.341.3400
13183.31 ± 3.01.00.301.3500
14183.31 ± 4.51.00.221.3700
15183.31 ± 7.01.00.271.3800
Table 2. Channel characteristics of MWTS-II.
ChannelFrequency (GHz)Sensitivity Requirements (K)On-Orbit Sensitivity (K)Calibration Accuracy (K)Peak WF Height (hPa)
153.301.50.261.5surface
251.7600.90.201.5surface
352.8000.90.211.5950
453.5960.90.181.5700
554.4000.90.191.5400
654.9400.90.191.5250
755.5000.90.231.5180
857.290(f0)0.90.741.590
9f0 ± 0.2171.50.661.550
10f0 ± 0.322 ± 0.0481.50.491.525
11f0 ± 0.322 ± 0.0222.30.531.510
12f0 ± 0.322 ± 0.0103.00.931.56
13f0 ± 0.322 ± 0.0054.52.111.53
Table 3. The correlation coefficients between observations of the channels with zero Υ ( P S , 0 ) and observations of the channels with non-zero Υ ( P S , 0 ) for MWHTS and MWTS-II.
Correlation Coefficient
ChannelH-1H-5H-6H-7H-8H-9H-10H-15T-1T-2T-3T-4T-5
H-20.38−0.22−0.170.220.280.360.32−0.100.390.380.21−0.09−0.16
H-3−0.03−0.09−0.23−0.25−0.20−0.09−0.15−0.400.02−0.06−0.41−0.35−0.21
H-4−0.310.15−0.09−0.47−0.45−0.38−0.41−0.49−0.30−0.41−0.56−0.28−0.06
H-11−0.180.380.400.08−0.01−0.13−0.080.62−0.26−0.200.12−0.320.37
H-12−0.120.420.470.180.10−0.040.010.74−0.24−0.160.22−0.260.43
H-13−0.060.420.490.250.170.020.080.83−0.20−0.110.30−0.220.46
H-14−0.010.440.540.320.240.090.150.90−0.20−0.090.37−0.170.50
T-6−0.190.980.910.160.04−0.11−0.030.29−0.67−0.600.100.760.92
T-7−0.420.680.45−0.33−0.39−0.43−0.40−0.20−0.65−0.67−0.420.180.47
T-8−0.15−0.10−0.29−0.40−0.35−0.23−0.29−0.44−0.05−0.17−0.54−0.42−0.26
T-90.22−0.20−0.25−0.010.050.160.10−0.220.260.21−0.06−0.27−0.23
T-100.47−0.27−0.190.300.370.450.41−0.060.470.480.29−0.07−0.18
T-110.50−0.34−0.200.380.440.510.490.080.520.540.38−0.03−0.19
T-120.47−0.28−0.120.400.440.480.480.160.460.500.420.06−0.11
T-130.37−0.020.130.410.410.400.420.250.260.320.440.250.11
Table 4. The configuration of sensitivity test datasets for MWHTS and MWTS-II.
ChannelMain Affected Pressure LevelsTemperature Threshold (K)Humidity Threshold (%)Number of Samples
H-1, H-7, H-8, H-9, H-10, T-1, T-2 825–10001.208468
H-2, T-103–1500.45-163
H-3, H-4, T-8, T-95–2250.50-152
H-5, H-6100–10001.2025181
T-3, T-4200–9750.95-115
T-5, T-650–8250.85-212
T-75–5500.65-133
T-112–1000.45-148
T-122–500.40-188
T-131–100.35-265
H-11, H-12150–6501.503238
H-13, H-14, H-15200–9501.805260
Table 5. Channel combinations for the fusion retrieval of SSP from MWHTS and MWTS-II.
Channel CombinationChannel
The theoretical channel combinationMWHTS channels: 1–15,
MWTS-II channels: 1–13
The optimal theoretical channel combinationMWHTS channels: 3–5, 7–8, 10, 13–15,
MWTS-II channels: 1–13
Publisher’s Note: MDPI stays neutral with regard to jurisdictional claims in published maps and institutional affiliations.

