


Remote Sens. 2026, 18(14), 2343; https://doi.org/10.3390/rs18142343 - 13 Jul 2026
Abstract
Small objects in UAV and remote sensing images often occupy only a few to several dozen pixels, and their edge and texture information is easily further weakened after processing by the network backbone. Although high-frequency information helps capture details of small objects, the
[...] Read more.
Small objects in UAV and remote sensing images often occupy only a few to several dozen pixels, and their edge and texture information is easily further weakened after processing by the network backbone. Although high-frequency information helps capture details of small objects, the background texture will also generate high-frequency responses. To address this issue, this paper proposes HFG-YOLO, a high-frequency-guided network. First, we propose the High-Frequency Feature Guidance Module (HFFGM), which extracts high-frequency information from images to compensate for the loss of small-object information caused by backbone downsampling. Second, we design the Background Suppression Fusion Module (BSFM) to reduce the impact of irrelevant high-frequency information on the model’s detection results. Experimental results on the VisDrone2019 and VEDAI datasets demonstrate the effectiveness of the proposed design. On VisDrone2019, HFG-YOLO achieves a 31.10% mAP50 and 6.08% mAPs, outperforming the YOLO11n baseline by 2.70 and 1.71 percentage points, respectively. On VEDAI, HFG-YOLO achieves a 33.40% mAP50:95 and 22.93% mAPs, improving over YOLO11n by 2.40 and 3.26 percentage points, respectively.
Full article
(This article belongs to the Section AI Remote Sensing)
►
Show Figures
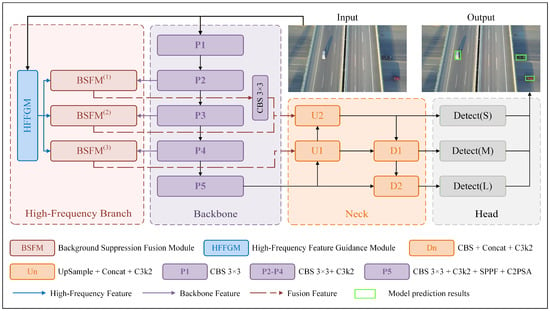
Figure 1


