
Superhydrophobic Ni-Reduced Graphene Oxide Hybrid Coatings with Quasi-Periodic Spike Structures

 , ,
, ,
Abstract
:1. Introduction
2. Materials and Methods
2.1. Preparation of Graphene Oxide
2.2. Mixing with Nickel Sulfate
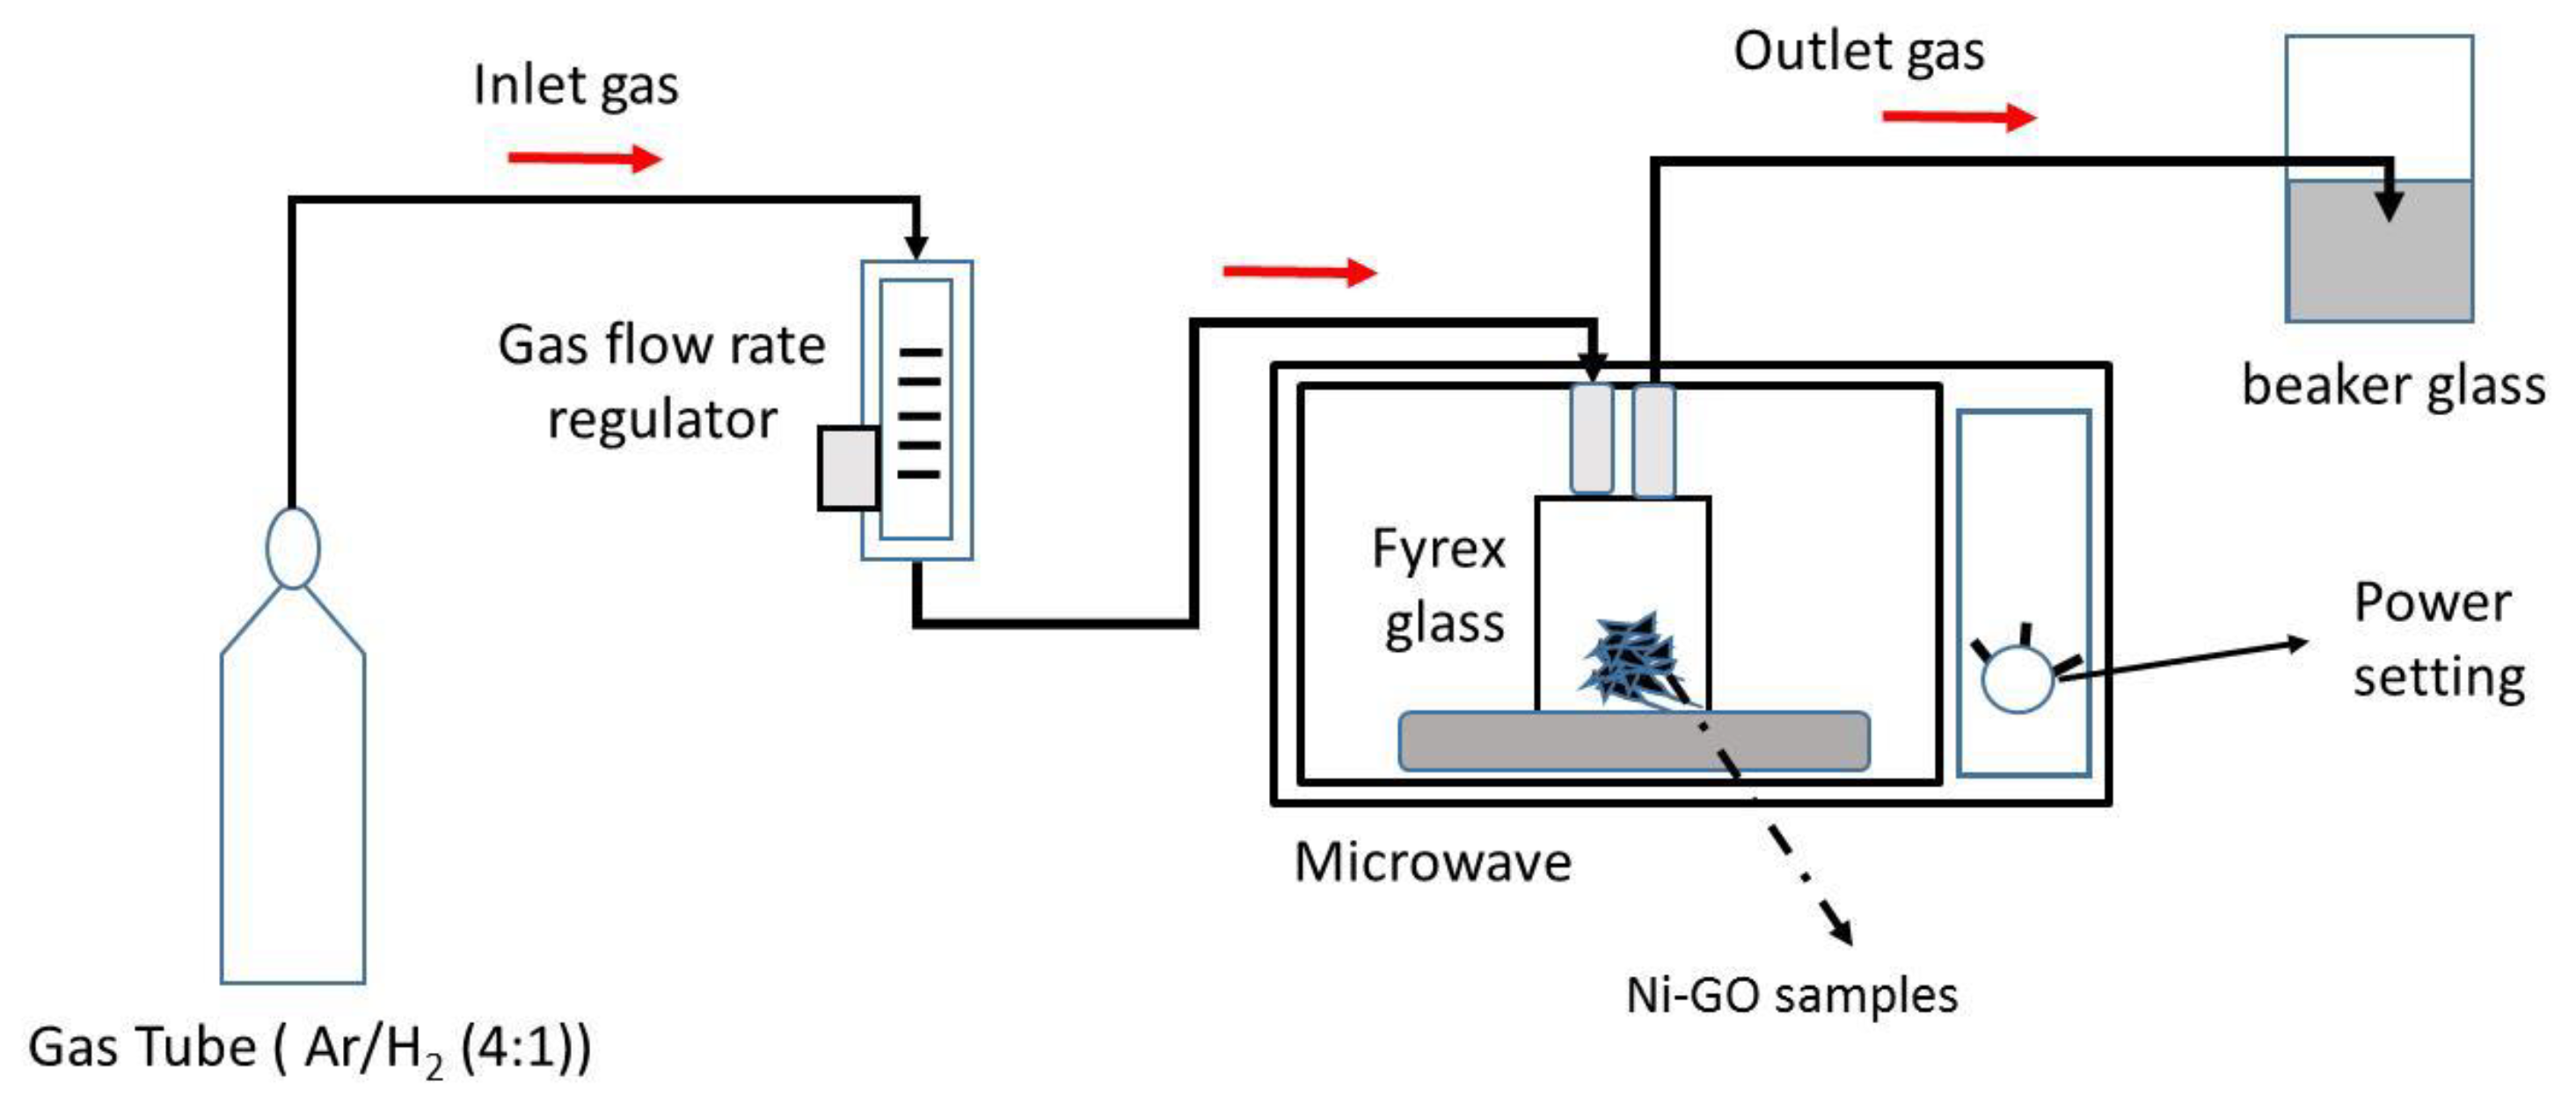
2.3. Reduction of GO
2.4. Preparation of GO Layer
2.5. Characterization
3. Results and Discussion
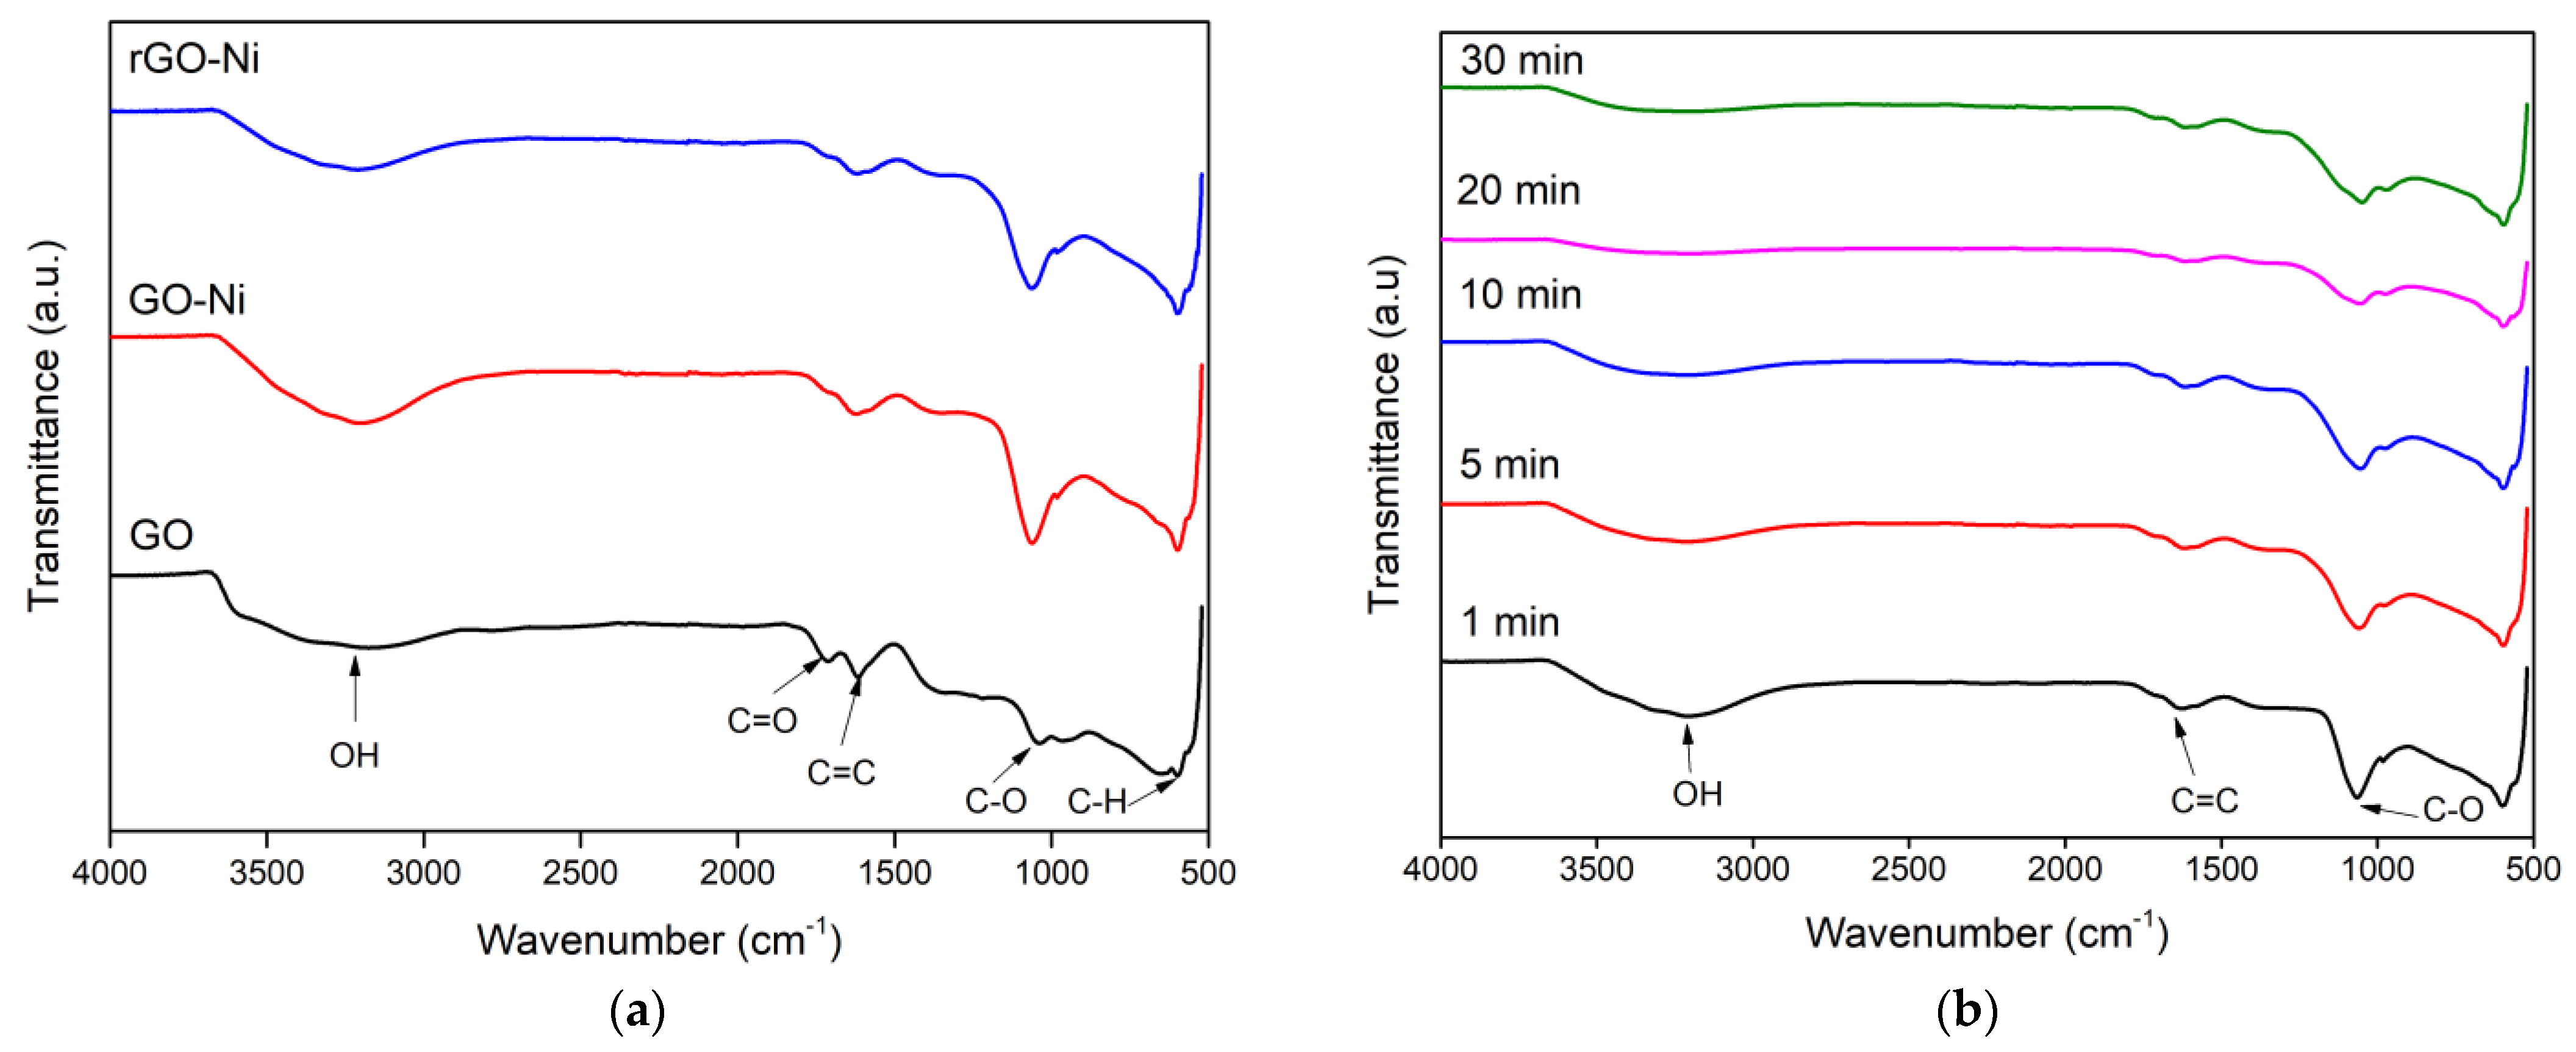
3.1. FTIR Analysis
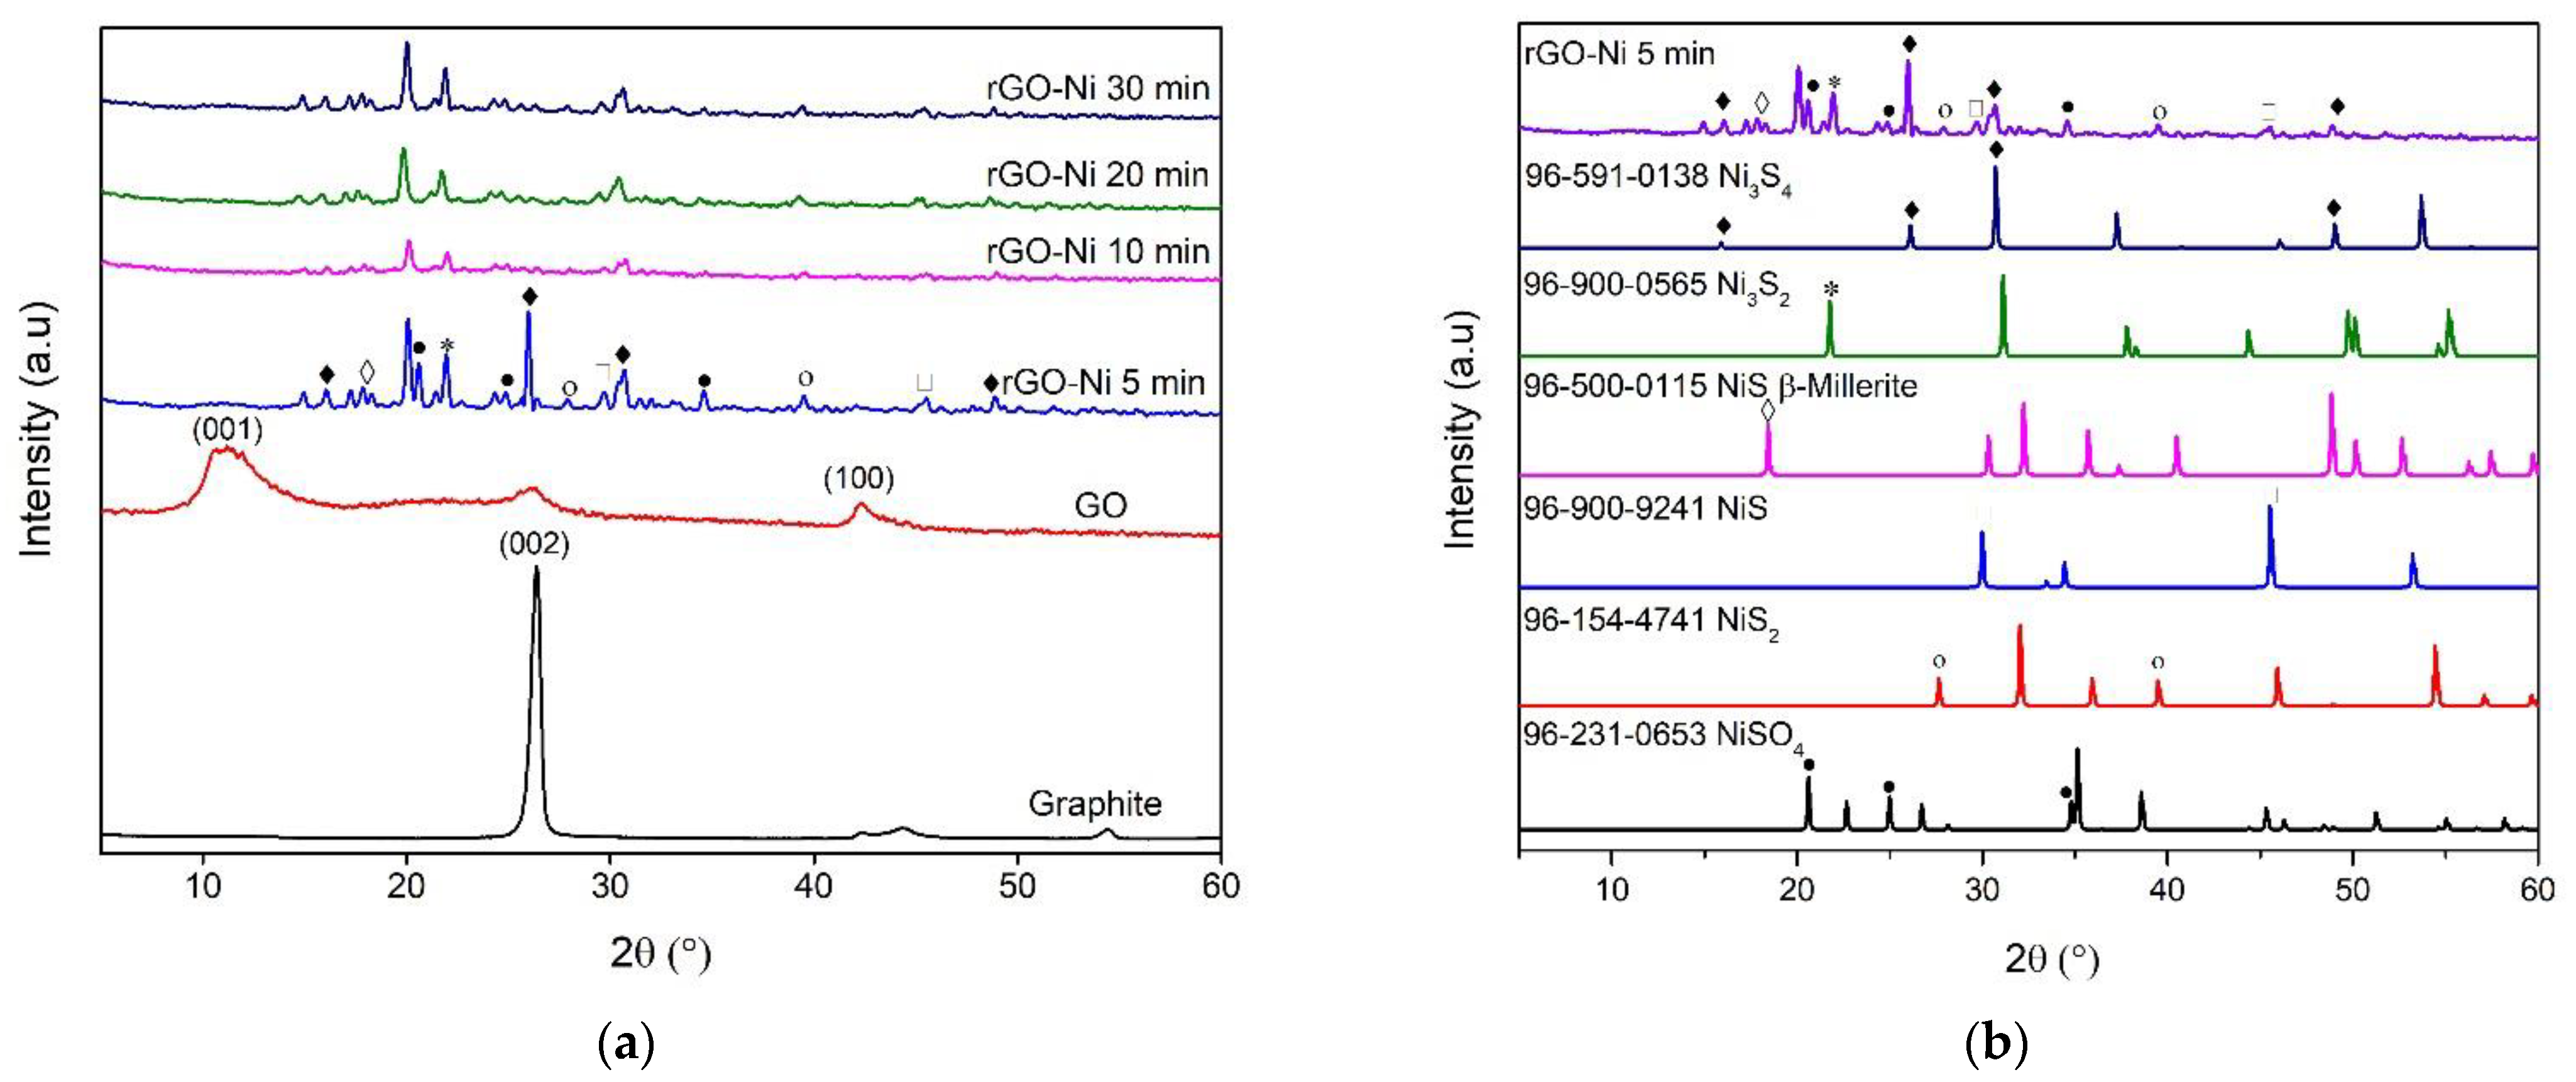
3.2. XRD Analysis
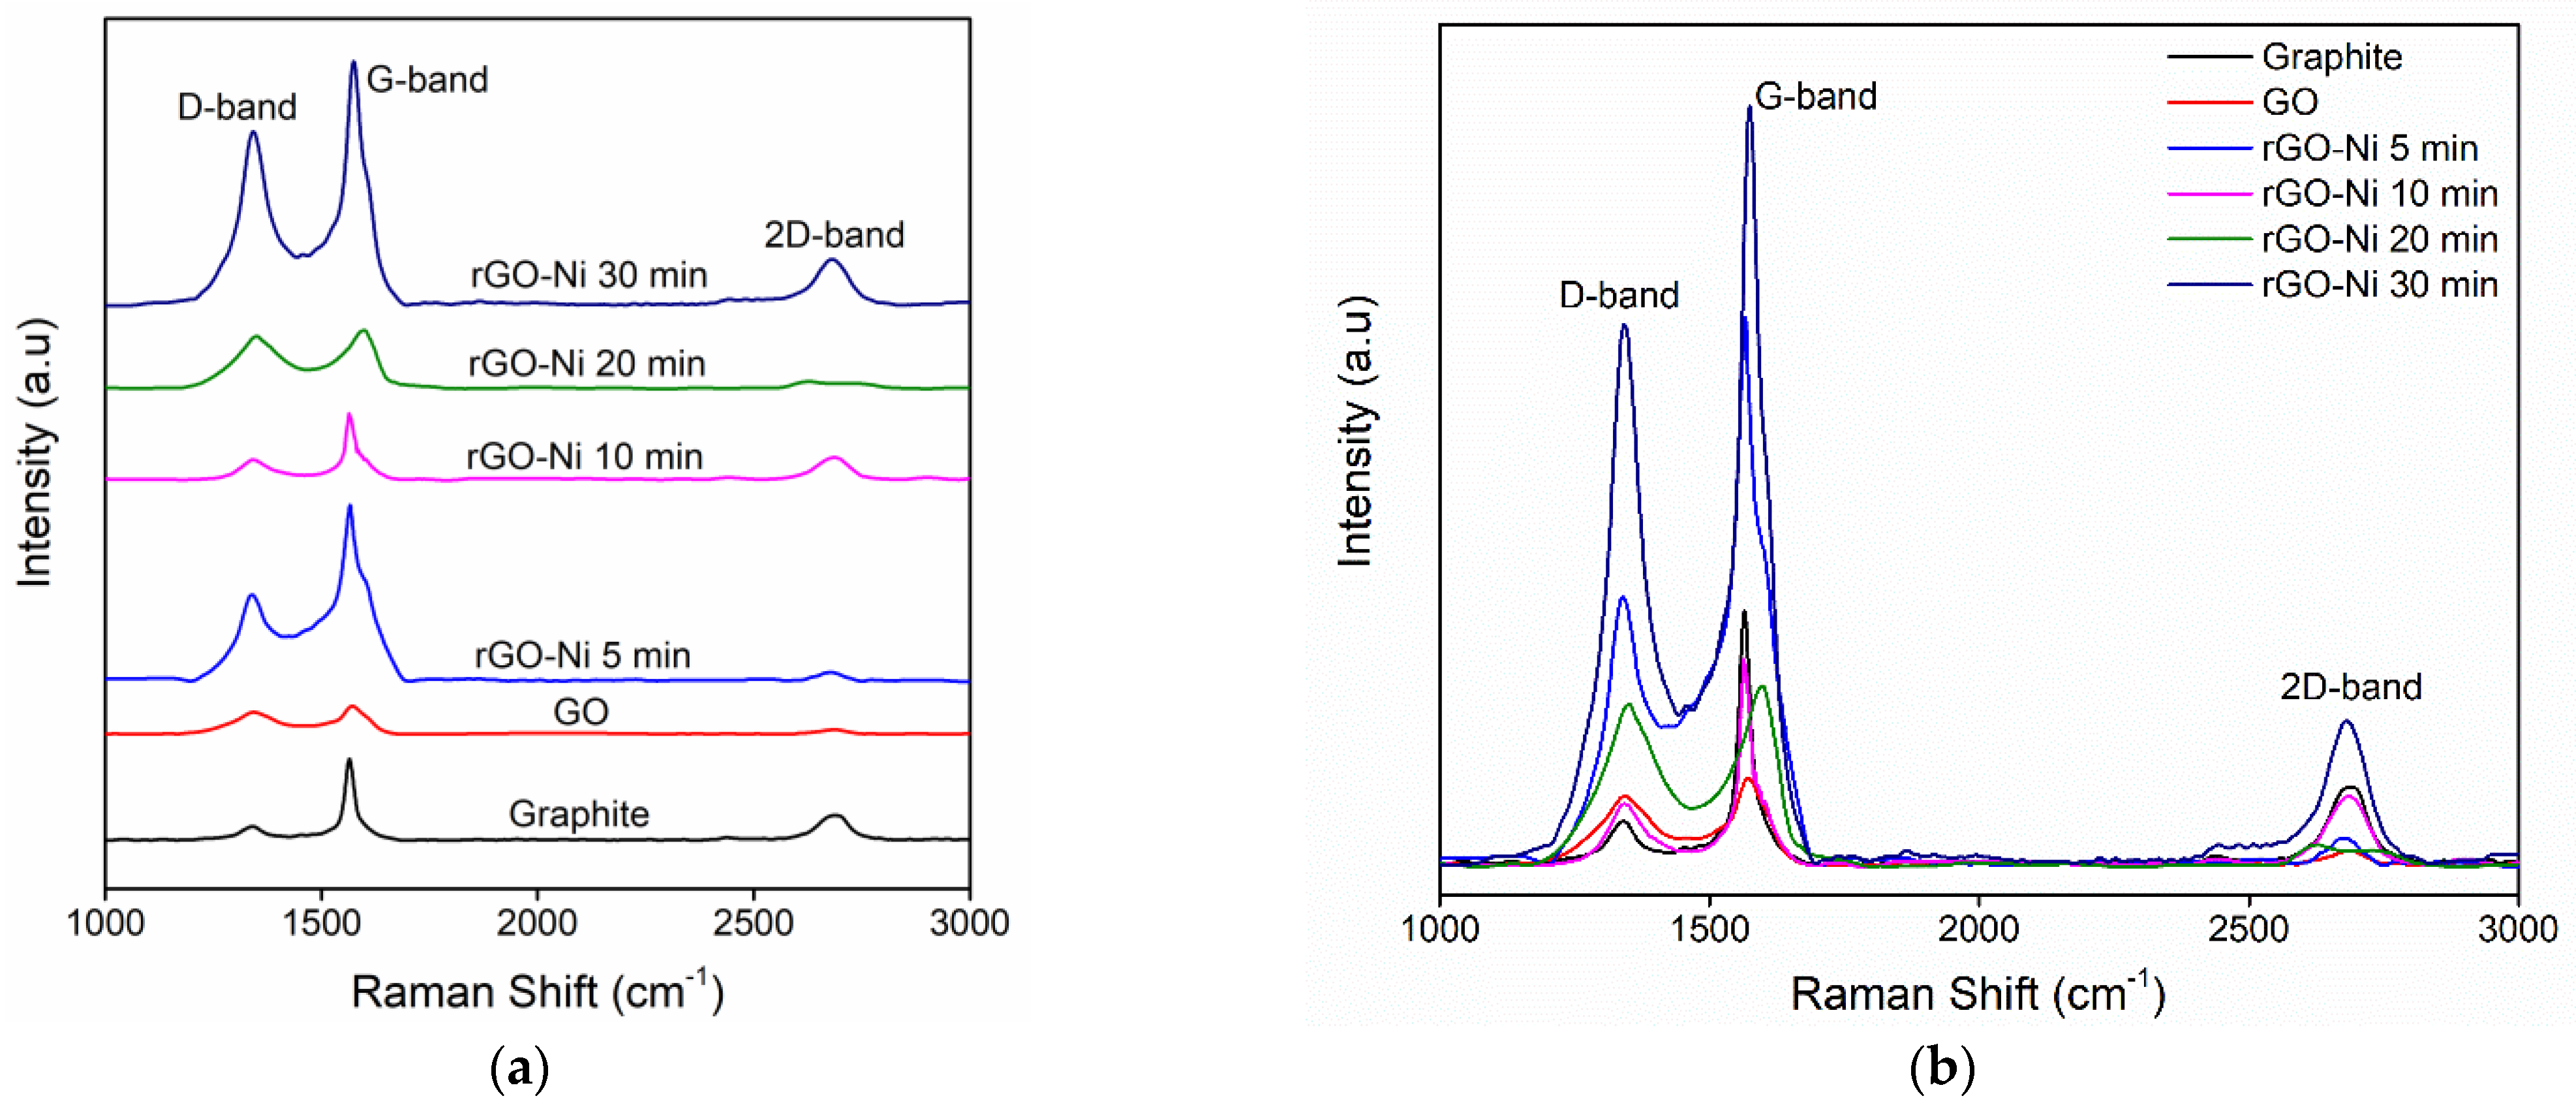
3.3. Raman Spectroscopy
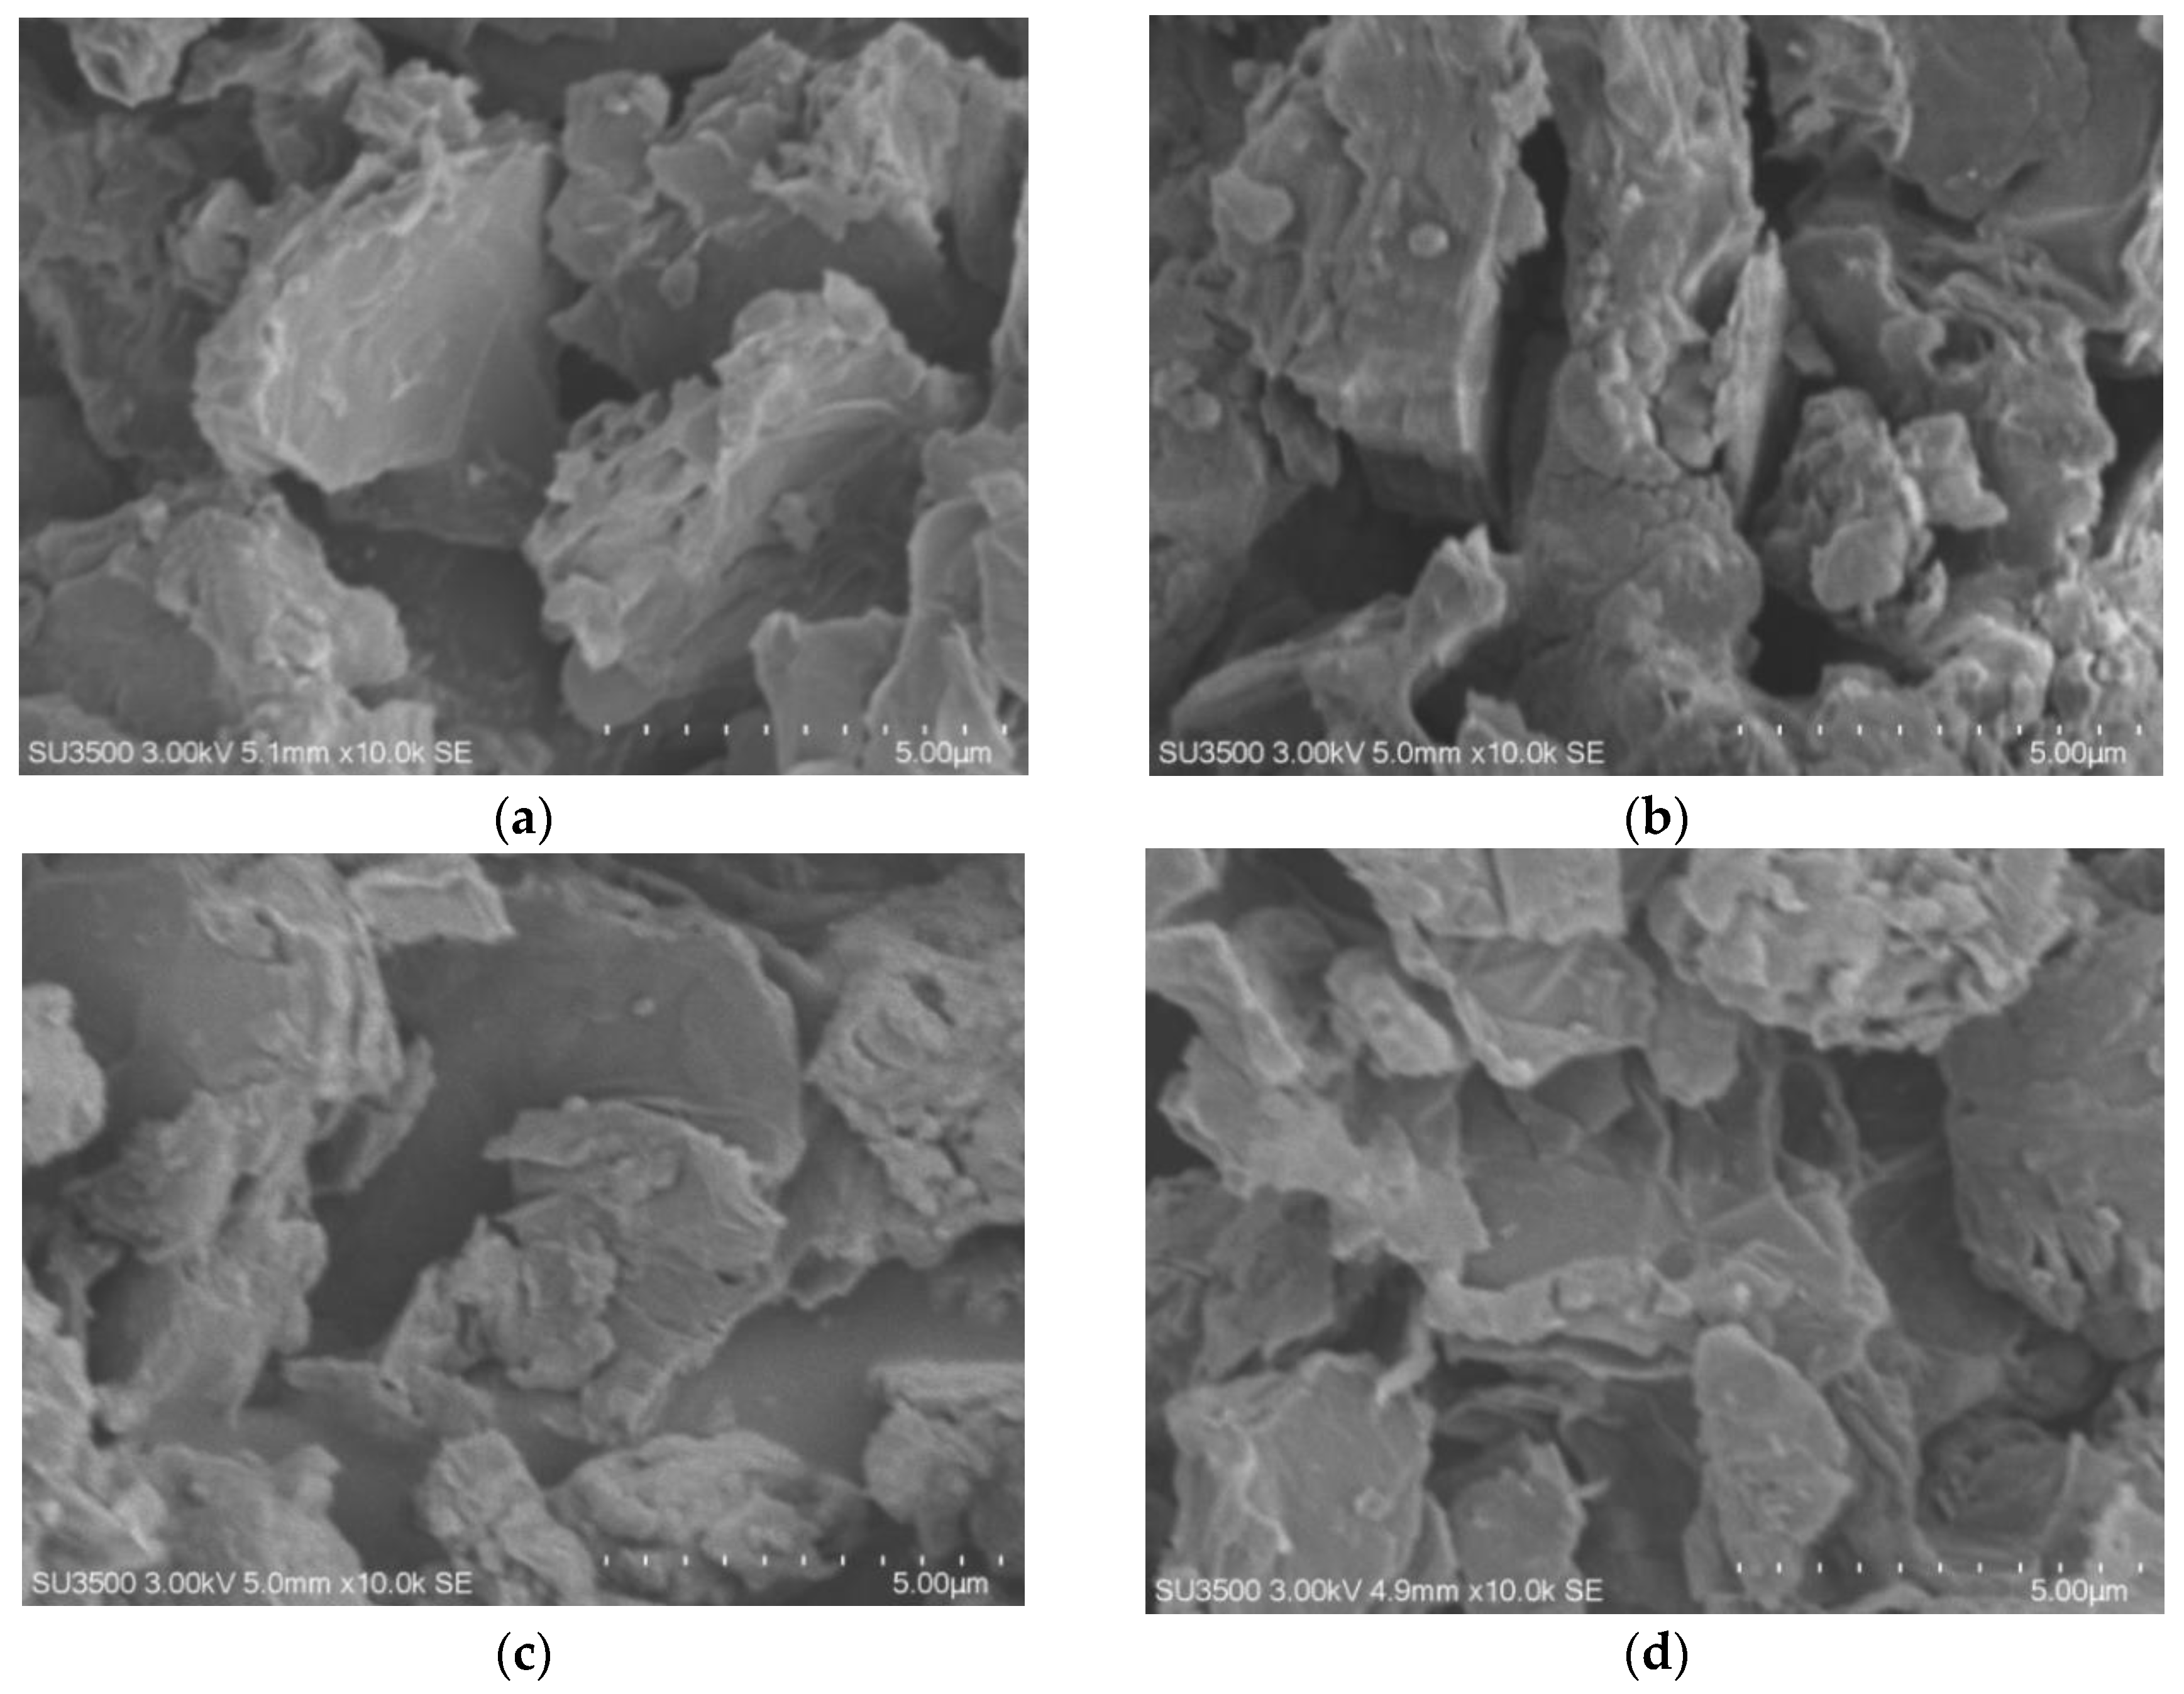
3.4. SEM–EDS
3.5. Contact Angle
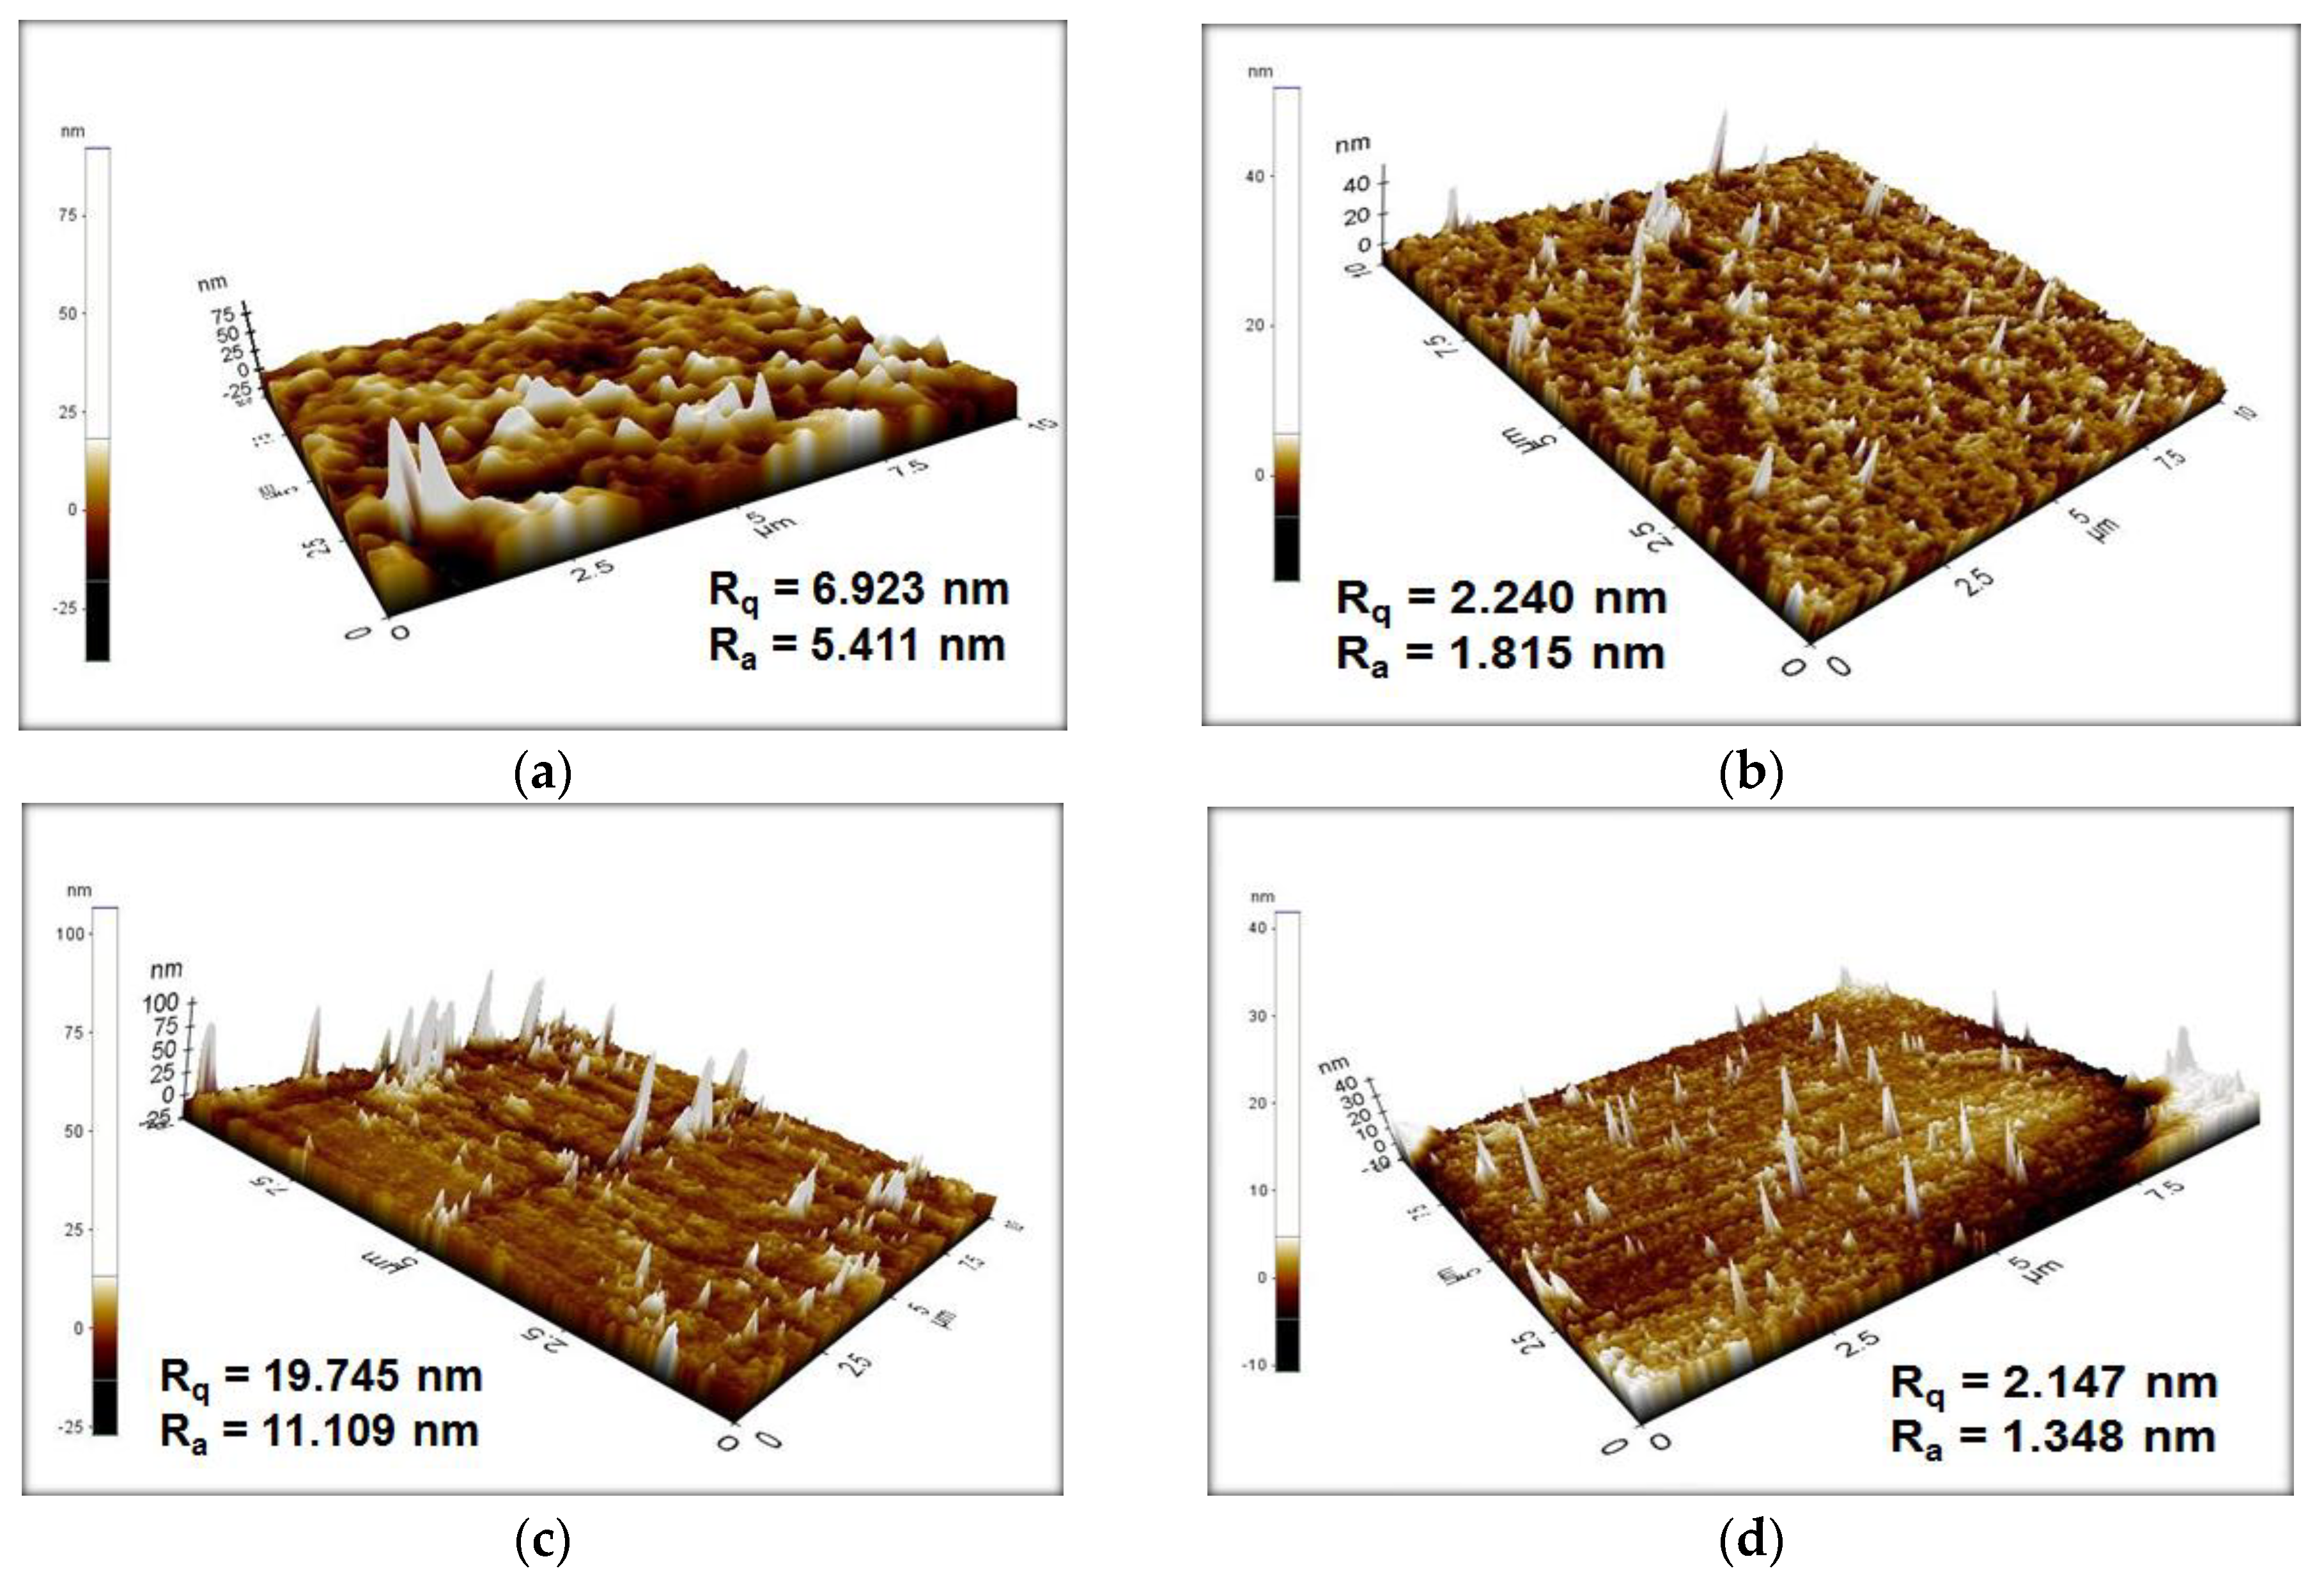
3.6. AFM
4. Conclusions
Author Contributions
Funding
Institutional Review Board Statement
Informed Consent Statement
Data Availability Statement
Conflicts of Interest
References
- Geim, A.K. Graphene: Status and prospects. Science 2019, 324, 1530–1534. [Google Scholar] [CrossRef] [Green Version]
- Strankowski, M.; Bodarczyk, D.; Piszczyk, A.; Strankowska, J. Polyurethane nanocomposites containing reduced graphene oxide, FTIR, Raman, and XRD studies. J. Spectrosc. 2016, 2016, 7520741. [Google Scholar] [CrossRef] [Green Version]
- Wang, Y.; Zhao, Y.; Bao, T.; Li, X.; Su, Y.; Duan, Y. Preparation of Ni-reduced graphene oxide nanocomposites by Pd-activated electroless deposition and their magnetic properties. Appl. Surf. Sci. 2012, 258, 8603–8608. [Google Scholar] [CrossRef]
- Antolini, E. Graphene as a new carbon support for low-temperature fuel cell catalysts. Appl. Catal. B Environ. 2012, 123–124, 52–68. [Google Scholar] [CrossRef]
- Singh, B.P.; Nayak, S.; Nanda, K.K.; Jena, B.K.; Bhattacharjee, S.; Besra, L. The production of a corrosion resistant graphene reinforced composite coating on copper by electrophoretic deposition. Carbon 2013, 614, 7–56. [Google Scholar] [CrossRef]
- Liu, Y.; Zhang, J.; Li, S.; Wang, Y.; Han, Z.; Ren, L. Fabrication of a superhydrophobic graphene surface with excellent mechanical abrasion and corrosion resistance on an aluminum alloy substrate. RSC Adv. 2014, 4, 45389–45396. [Google Scholar] [CrossRef]
- Wang, J.-N.; Zhang, Y.-L.; Liu, Y.; Zheng, W.; Lee, L.P.; Sun, H.-B. Recent developments in superhydrophobic graphene and graphene-related materials: From preparation to potential applications. Nanoscale 2015, 7, 7101–7114. [Google Scholar] [CrossRef]
- Kiran, N.U.; Dey, S.; Singh, B.P.; Besra, L. Graphene coating on copper by electrophoretic deposition for corrosion prevention. Coatings 2017, 7, 214. [Google Scholar] [CrossRef] [Green Version]
- Nine, M.J.; Cole, M.A.; Johnson, L.; Tran, D.N.H.; Losic, D. Robust superhydrophobic graphene-based composite coatings with self-cleaning and corrosion barrier properties. ACS Appl. Mater. Interfaces 2015, 7, 28482–28493. [Google Scholar] [CrossRef]
- Jishnu, A.; Jayan, J.S.; Saritha, A.; Sethulekshmi, A.S.; Venu, G. Superhydrophobic graphene-based materials with self-cleaning and anticorrosion performance: An appraisal of neoteric advancement and future perspectives. Colloids Surf. A Physicochem. Eng. Asp. 2020, 606, 125395. [Google Scholar]
- Pei, S.; Cheng, H.-M. The reduction of graphene oxide. Carbon 2012, 50, 3210–3228. [Google Scholar] [CrossRef]
- Miao, C.; Zheng, C.; Liang, O.; Xie, Y.-H. Chemical Vapor Deposition of Graphene. In Physics and Applications of Graphene; Mikhailov, S., Ed.; InTech Europe: Rijeka, Croatia, 2011; pp. 37–54. [Google Scholar]
- Paulchamy, B.; Arthi, G.; Lignesh, B.D. A simple approach to stepwise synthesis of graphene oxide nanomaterial. J. Nanomed. Nanotechnol. 2015, 6, 253. [Google Scholar]
- Kim, T.; Jo, C.; Lim, W.G.; Lee, J.; Lee, J.; Lee, K.H. Facile conversion of activated carbon to battery anode material using microwave graphitization. Carbon 2016, 104, 106–111. [Google Scholar] [CrossRef]
- Kim, T.; Lee, J.; Lee, K.-H. Full graphitization of amorphous carbon by microwave heating. RSC Adv. 2016, 6, 24667–24674. [Google Scholar] [CrossRef] [Green Version]
- Sevilla, M.; Fuertes, A.B. Catalytic graphitization of templated mesoporous carbons. Carbon 2006, 44, 468–474. [Google Scholar] [CrossRef]
- Zou, L.; Huang, B.; Huang, Y.; Huang, Q.; Wang, C. An investigation of heterogeneity of the degree of graphitization in carbon-carbon composites. Mater. Chem. Phys. 2003, 82, 654–662. [Google Scholar] [CrossRef]
- Chu, P.K.; Li, L. Characterization of amorphous and nanocrystalline carbon films. Mater. Chem. Phys. 2006, 96, 253–277. [Google Scholar] [CrossRef]
- Khai, T.V.; Kwak, D.S.; Kwon, Y.J.; Kim, S.S.; Shim, K.B.; Kim, H.W. High-quality graphene thin films synthesized by H2 ambient-annealing of reduced graphene oxide sheets. J. Ceram. Process. Res. 2013, 14, 355–362. [Google Scholar]
- Chen, W.; Yan, L.; Bangal, P.R. Preparation of graphene by the rapid and mild thermal reduction of graphene oxide induced by microwaves. Carbon 2010, 48, 1146–1152. [Google Scholar] [CrossRef]
- Joni, I.M.; Hardiati, M.S.; Faizal, F.; Panatarani, C. Synthesis of rGO-Ni by microwave irradiation method. AIP Conf. Proc. 2020, 2219, 080019. [Google Scholar]
- Jeevahan, J.; Chandrasekaran, M.; Joseph, G.B.; Durairaj, R.B.; Mageshwaran, G. Superhydrophobic surfaces: A review on fundamentals, applications, and challenges. J. Coat. Technol. Res. 2018, 15, 231–250. [Google Scholar] [CrossRef]
- Jin, M.; Xing, Q.; Chen, Z. A Review: Natural superhydrophobic surfaces and applications. J. Biomater. Nanobiotechnol. 2020, 11, 110–149. [Google Scholar] [CrossRef] [Green Version]
- Liravi, M.; Pakzad, H.; Moosavi, A.; Nouri-Borujerdi, A. A comprehensive review on recent advances in superhydrophobic surfaces and their applications for drag reduction. Prog. Org. Coat. 2020, 140, 105537. [Google Scholar] [CrossRef]
- Yan, Y.Y.; Gao, N.; Barthlott, W. Mimicking natural superhydrophobic surfaces and grasping the wetting process: A review on recent progress in preparing superhydrophobic surfaces. Adv. Colloid Interface Sci. 2011, 169, 80–105. [Google Scholar] [CrossRef]
- Wei, D.W.; Wei, H.; Gauthier, A.C.; Song, J.; Jin, Y.; Xiao, H. Superhydrophobic modification of cellulose and cotton textiles: Methodologies and applications. J. Bioresour. Bioprod. 2020, 5, 1–15. [Google Scholar] [CrossRef]
- Guan, F.; Song, Z.; Xin, F.; Wang, H.; Yu, D.; Li, G.; Liu, W. Preparation of hydrophobic transparent paper via using polydimethylsiloxane as transparent agent. J. Bioresour. Bioprod. 2020, 5, 37–43. [Google Scholar] [CrossRef]
- Esmailzadeh, S.; Khorsand, S.; Raeissi, K.; Ashrafizadeh, F. Microstructural evolution and corrosion resistance of super-hydrophobic electrodeposited nickel films. Surf. Coat. Technol. 2015, 283, 337–346. [Google Scholar] [CrossRef]
- Ding, S.B.; Xiang, T.F.; Li, C.; Zheng, S.L.; Wang, J.; Zhang, M.X.; Dong, C.D.; Chan, W.M. Fabrication of self-cleaning super-hydrophobic nickel/graphene hybrid film with improved corrosion resistance on mild steel. Mater. Des. 2017, 117, 280–288. [Google Scholar] [CrossRef]
- Bai, Z.; Zhang, B. Fabrication of superhydrophobic reduced-graphene oxide/nickel coating with mechanical durability, self-cleaning and anticorrosion performance. Nano Mater. Sci. 2020, 2, 151–158. [Google Scholar] [CrossRef]
- Schneider, L.; Laustsen, M.; Mandsberg, N.; Taboryski, R. The Influence of structure heights and opening angles of micro- and nanocones on the macroscopic surface wetting properties. Sci. Rep. 2016, 6, 21400. [Google Scholar] [CrossRef] [Green Version]
- Hummers, W.S.; Offeman, R.E. Preparation of graphitic oxide. J. Am. Chem. Soc. 1958, 80, 1339. [Google Scholar] [CrossRef]
- Joni, I.M.; Vanitha, M.; Camellia, P.; Balasubramanian, N. Augmentation of graphite purity from mineral resources and enhancing % graphitization using microwave irradiation: XRD and Raman studies. Diam. Relat. Mater. 2018, 88, 129–136. [Google Scholar]
- Zhu, Y.; Murali, S.; Stoller, M.D.; Velamakanni, A.; Piner, R.D.; Ruoff, R.S. Microwave assisted exfoliation and reduction of graphite oxide for ultracapacitors. Carbon 2010, 48, 2118–2122. [Google Scholar] [CrossRef]
- Lu, M.; Gao, N.; Zhang, X.J.; Wang, G.S. Reduced graphene oxide decorated with octahedral NiS2/NiS nanocrystals: Facile synthesis and tunable high frequency attenuation. RSC Adv. 2019, 9, 5550–5556. [Google Scholar] [CrossRef] [Green Version]
- Muthukannan, V.; Praveen, K.; Natesan, B. Fabrication and characterization of magnetite/reduced graphene oxide composite incurred from iron ore tailings for high performance application. Mater. Chem. Phys. 2015, 162, 400–407. [Google Scholar] [CrossRef]
- Sundaram, R.S. Chemically Derived Graphene. In Graphene: Properties, Preparation, Characterisation and Devices, 2nd ed.; Skakalova, V., Kaiser, A.B., Eds.; Woodhead Publishing: Duxford, UK, 2014; pp. 50–80. [Google Scholar]
- Dinh, D.A.; Hui, K.S.; Hui, K.N.; Cho, Y.R.; Zhou, W.; Hong, X.; Chun, H.-H. Green synthesis of high conductivity silver nanoparticle-reduced graphene oxide composite films. Appl. Surf. Sci. 2014, 298, 62–67. [Google Scholar] [CrossRef]
- Alice, A.K.; Benjamin, R.; Tamara, L.; Andrew, T.; Joselito, M.; Andrew, I.A.; King, A.A.K.; Davies, B.R.; Noorbehesht, N.; Newman, P. A new Raman metric for the characterisation of graphene oxide and its derivatives. Sci. Rep. 2016, 6, 19491. [Google Scholar]
- Wang, G.; Bai, J.; Wang, Y.; Ren, Z.; Bai, J. Preparation and electrochemical performance of a cerium oxide-graphene nanocomposite as the anode material of a lithium ion battery. Scr. Mater. 2011, 65, 339–342. [Google Scholar] [CrossRef]
- De Oliveira, R.R.L.; Albuquerque, D.A.C.; Cruz, T.G.S.; Yamaji, F.M.; Leite, F.L. Measurement of the Nanoscale Roughness by Atomic Force Microscopy: Basic Principles and Applications. In Atomic Force Microscopy Imaging, Measuring and Manipulating Surfaces at the Atomic Scale; Bellitto, V., Ed.; InTech Europe: Rijeka, Croatia, 2012; pp. 147–174. [Google Scholar]
- Yun, X.; Xiong, Z.; He, Y.; Wang, X. Superhydrophobic lotus-leaf-like surface made from reduced graphene oxide through softlithographic duplication. RSC Adv. 2020, 10, 5478–5486. [Google Scholar] [CrossRef]
- Cho, Y.; Park, C.H. Objective quantification of surface roughness parameters affecting superhydrophobicity. RSC Adv. 2020, 10, 31251–31260. [Google Scholar] [CrossRef]
- Yamamoto, M.; Nishikawa, N.; Mayama, H.; Nonomura, Y.; Yokojima, S.; Nakamura, S.; Uchida, K. Theoretical explanation of the lotus effect: Superhydrophobic property changes by removal of nanostructures from the surface of a lotus leaf. Langmuir 2015, 31, 7355–7363. [Google Scholar] [CrossRef] [PubMed]
- Spori, D.M.; Drobek, T.; Zürcher, S.; Ochsner, M.; Sprecher, C.; Mühlebach, A.; Spencer, N.D. Beyond the lotus effect: Roughness influences on wetting over a wide surface-energy range. Langmuir 2008, 24, 5411–5417. [Google Scholar] [CrossRef]
- Nosonovsky, M.; Bhushan, B. Roughness-induced superhydrophobicity: A way to design non-adhesive surfaces. J. Phys. Condens. Matter 2008, 20, 225009. [Google Scholar] [CrossRef]
- Koch, K.; Bhushan, B.; Jung, Y.C.; Barthlott, W. Fabrication of artificial Lotus leaves and significance of hierarchical structure for superhydrophobicity and low adhesion. Soft Matter 2009, 5, 1386–1393. [Google Scholar] [CrossRef]
- Nosonovsky, M.; Bhushan, B. Hierarchical roughness makes superhydrophobic surfaces stable. Microelectron. Eng. 2007, 84, 382–386. [Google Scholar]
- Bhushan, B.; Jung, Y.C.; Koch, K. Micro-, nano- and hierarchical structures for superhydrophobicity, self-cleaning and low adhesion. Philos. Trans. R. Soc. A 2009, 367, 1631–1672. [Google Scholar] [CrossRef] [PubMed]


| Peak | Peak Type | FWHM | Intensity | Center | Area (%) | ID/IG |
|---|---|---|---|---|---|---|
| D* | Lorentz | 44.10074 | 2.30117 | 1263.187 | 0.37276 | 0.0055 |
| D** | Gauss | 88.18919 | 15.12388 | 1471.11 | 3.38514 | 0.036 |
| D*** | Lorentz | 20.34075 | 13.58623 | 1518.833 | 1.02809 | 0.03125 |
| G | Lorentz | 25.53374 | 416.2986 | 1565.301 | 39.48637 | - |
| D’ | Lorentz | 34.40976 | 32.90883 | 1603.995 | 4.19551 | 0.0792 |
| 2D | Lorentz | 73.10103 | 137.5077 | 2684.201 | 36.03281 | 0.33 |
| Peak | Peak Type | FWHM | Intensity | Center | Area (%) | ID/IG | |
|---|---|---|---|---|---|---|---|
| GO | D | Lorentz | 103.871 | 111.7583 | 1345.573 | 52.09472 | 0.87 |
| D* | Lorentz | 76.86495 | 25.79214 | 1464.012 | 9.02568 | 0.2 | |
| D** | Gauss | 36.33935 | 21.84247 | 1507.944 | 2.51529 | 0.17 | |
| G | Lorentz | 72.56196 | 128.7674 | 1576.557 | 29.60897 | - | |
| 2D | Lorentz | 63.38208 | 23.66892 | 2682.37 | 6.75535 | 0.18 | |
| rGO-Ni 5 min | D | Lorentz | 72.36115 | 400.6227 | 1338.942 | 28.3476 | 0.625 |
| D* | Gauss | 190.0877 | 208.7136 | 1488.591 | 27.05743 | 0.325 | |
| D** | Lorentz | 47.10426 | 48.40645 | 1522.598 | 2.25922 | 0.075 | |
| G | Lorentz | 35.12459 | 640.2111 | 1565.578 | 22.37714 | - | |
| D’ | Lorentz | 53.94309 | 316.8547 | 1606.357 | 16.91193 | 0.494 | |
| 2D | Lorentz | 68.07937 | 46.27574 | 2675.5 | 3.04668 | 0.072 | |
| rGO-Ni 10 min | D | Lorentz | 59.55056 | 94.77432 | 1341.33 | 19.9872 | 0.32 |
| D* | Lorentz | 77.81392 | 23.73011 | 1391.398 | 6.49989 | 0.078 | |
| D** | Gauss | 115.7242 | 23.72099 | 1546.179 | 6.81632 | 0.078 | |
| G | Lorentz | 22.21343 | 296.4301 | 1566.151 | 23.91736 | - | |
| D’ | Lorentz | 42.80226 | 68.37753 | 1599.675 | 10.54987 | 0.23 | |
| 2D | Lorentz | 75.84276 | 121.4737 | 2682.816 | 32.22935 | 0.41 | |
| rGO-Ni 20 min | D | Lorentz | 114.0963 | 261.4571 | 1353.322 | 50.3196 | 1.144 |
| D* | Lorentz | 114.0583 | 121.8159 | 1541.898 | 23.60508 | 0.53 | |
| G | Gauss | 60.28815 | 228.7064 | 1599.37 | 16.4825 | - | |
| G’ | Lorentz | 72.94592 | 32.05832 | 2625.254 | 3.97089 | 0.14 | |
| D + D’ | Lorentz | 128.4541 | 27.1002 | 2726.328 | 5.62193 | 0.118 | |
| rGO-Ni 30 min | D | Lorentz | 72.95094 | 872.99907 | 1342.89959 | 39.75877 | 0.82 |
| D* | Lorentz | 69.28206 | 84.36227 | 1412.81349 | 3.66186 | 0.079 | |
| D** | Gauss | 132.96085 | 213.42246 | 1522.65928 | 12.35659 | 0.2 | |
| G | Lorentz | 36.67842 | 1061.63651 | 1575.12468 | 24.72983 | - | |
| D’ | Lorentz | 31.03816 | 321.42136 | 1608.95909 | 6.34852 | 0.3 | |
| 2D | Lorentz | 88.23703 | 244.30122 | 2679.46551 | 13.14443 | 0.23 |
| No. | Element | Before MWI Atomic % | 5 min. Atomic % | 10 min. Atomic % | 20 min. Atomic % | 30 min. Atomic % |
|---|---|---|---|---|---|---|
| 1 | C | 61.75 | 55.96 | 62.1 | 64.08 | 47.34 |
| 2 | O | 32.53 | 36.86 | 25.06 | 30.58 | 42.11 |
| 3 | S | 3.99 | 3.7 | 3.76 | 2.67 | 4.03 |
| 4 | Ni | 1.73 | 3.49 | 9.06 | 2.67 | 6.51 |
| C/O ratio | 1.89 | 1.52 | 2.48 | 2.10 | 1.12 |
Publisher’s Note: MDPI stays neutral with regard to jurisdictional claims in published maps and institutional affiliations. |
© 2022 by the authors. Licensee MDPI, Basel, Switzerland. This article is an open access article distributed under the terms and conditions of the Creative Commons Attribution (CC BY) license (https://creativecommons.org/licenses/by/4.0/).
Share and Cite
Bahtiar, A.; Hardiati, M.S.; Faizal, F.; Muthukannan, V.; Panatarani, C.; Joni, I.M. Superhydrophobic Ni-Reduced Graphene Oxide Hybrid Coatings with Quasi-Periodic Spike Structures. Nanomaterials 2022, 12, 314. https://doi.org/10.3390/nano12030314
Bahtiar A, Hardiati MS, Faizal F, Muthukannan V, Panatarani C, Joni IM. Superhydrophobic Ni-Reduced Graphene Oxide Hybrid Coatings with Quasi-Periodic Spike Structures. Nanomaterials. 2022; 12(3):314. https://doi.org/10.3390/nano12030314
Chicago/Turabian StyleBahtiar, Ayi, Mila Sri Hardiati, Ferry Faizal, Vanitha Muthukannan, Camellia Panatarani, and I Made Joni. 2022. "Superhydrophobic Ni-Reduced Graphene Oxide Hybrid Coatings with Quasi-Periodic Spike Structures" Nanomaterials 12, no. 3: 314. https://doi.org/10.3390/nano12030314