
Serum Adropin Levels in Patients with Rheumatoid Arthritis

 and
and
Abstract
:1. Introduction
2. Materials and Methods
2.1. Study Design
2.2. Ethical Considerations
2.3. Subjects
2.4. Anthropometric Measurements and Clinical Examination
2.5. Disease Severity Assessment and Measurement of Functional Disability
2.6. Blood Sampling and Laboratory Analysis
2.7. Statistical Analysis
2.8. Sample Size Analysis
3. Results
Baseline Characteristics and Laboratory Parameters
4. Discussion
5. Conclusions
Supplementary Materials
Author Contributions
Funding
Institutional Review Board Statement
Informed Consent Statement
Data Availability Statement
Acknowledgments
Conflicts of Interest
References
- Alamanos, Y.; Voulgari, P.V.; Drosos, A.A. Incidence and prevalence of rheumatoid arthritis, based on the 1987 American College of Rheumatology criteria: A systematic review. Semin. Arthritis Rheum. 2006, 36, 182–188. [Google Scholar] [CrossRef] [PubMed]
- López-Mejías, R.; Castañeda, S.; González-Juanatey, C.; Corrales, A.; Ferraz-Amaro, I.; Genre, F.; Remuzgo-Martínez, S.; Rodriguez-Rodriguez, L.; Blanco, R.; Llorca, J.; et al. Cardiovascular risk assessment in patients with rheumatoid arthritis: The relevance of clinical, genetic and serological markers. Autoimmun. Rev. 2016, 15, 1013–1030. [Google Scholar] [CrossRef] [PubMed] [Green Version]
- Baghdadi, L.R.; Woodman, R.J.; Shanahan, E.M.; Mangoni, A.A. The impact of traditional cardiovascular risk factors on cardiovascular outcomes in patients with rheumatoid arthritis: A systematic review and metaanalysis. PLoS ONE 2015, 17, e0117952. [Google Scholar] [CrossRef] [PubMed] [Green Version]
- Crepaldi, G.; Scirè, C.A.; Carrara, G.; Sakellariou, G.; Caporali, R.; Hmamouchi, I.; Dougados, M.; Montecucco, C. Cardiovascular comorbidities relate more than others with disease activity in rheumatoid arthritis. PLoS ONE 2016, 11, e0146991. [Google Scholar] [CrossRef]
- Solomon, D.H.; Reed, G.W.; Kremer, J.M.; Curtis, J.R.; Farkouh, M.E.; Harrold, L.R.; Hochberg, M.C.; Tsao, P.; Greenberg, J.D. Disease activity in rheumatoid arthritis and the risk of cardiovascular events. Arthritis Rheumatol. 2015, 67, 1449–1455. [Google Scholar] [CrossRef]
- Arts, E.E.; Fransen, J.; den Broeder, A.A.; Popa, C.D.; van Riel, P.L. The effect of disease duration and disease activity on the risk of cardiovascular disease in rheumatoid arthritis patients. Ann. Rheum. Dis. 2015, 74, 998–1003. [Google Scholar] [CrossRef]
- Donath, M.Y.; Shoelson, S.E. Type 2 diabetes as an inflammatory disease. Nat. Rev. Immunol. 2011, 11, 98–107. [Google Scholar] [CrossRef]
- Zuliani, G.; Morieri, M.L.; Volpato, S.; Maggio, M.; Cherubini, A.; Francesconi, D.; Bandinelli, S.; Paolisso, G.; Guralnik, J.M.; Ferrucci, L. Insulin resistance and systemic inflammation, but not metabolic syndrome phenotype, predict 9 years mortality in older adults. Atherosclerosis 2014, 235, 538–545. [Google Scholar] [CrossRef] [Green Version]
- Aydin, S.; Kuloglu, T.; Aydin, S.; Eren, M.N.; Yilmaz, M.; Kalayci, M.; Sahin, I.; Kocaman, N.; Citil, C.; Kendir, Y. Expression of adropin in rat brain, cerebellum, kidneys, heart, liver, and pancreas in streptozotocin-induced diabetes. Mol. Cell Biochem. 2013, 380, 73–81. [Google Scholar] [CrossRef]
- Kumar, K.G.; Trevaskis, J.L.; Lam, D.D.; Sutton, G.M.; Koza, R.A.; Chouljenko, V.N.; Kousoulas, K.G.; Rogers, P.M.; Kesterson, R.A.; Thearle, M.; et al. Identification of adropin as a secreted factor linking dietary macronutrient intake with energy homeostasis and lipid metabolism. Cell. Metab. 2008, 8, 468–481. [Google Scholar] [CrossRef] [Green Version]
- Gao, S.; McMillan, R.P.; Zhu, Q.; Lopaschuk, G.D.; Hulver, M.W.; Butler, A.A. Therapeutic effects of adropin on glucose tolerance and substrate utilization in diet-induced obese mice with insulin resistance. Mol. Metab. 2015, 4, 310–324. [Google Scholar] [CrossRef] [PubMed]
- Jasaszwili, M.; Billert, M.; Strowski, M.Z.; Nowak, K.W.; Skrzypski, M. Adropin as A Fat-Burning Hormone with Multiple Functions-Review of a Decade of Research. Molecules 2020, 25, 549. [Google Scholar] [CrossRef] [PubMed] [Green Version]
- Topuz, M.; Celik, A.; Aslantas, T.; Demir, A.K.; Aydin, S.; Aydin, S. Plasma adropin levels predict endothelial dysfunction like flow-mediated dilatation in patients with type 2 diabetes mellitus. J. Investig. Med. 2013, 61, 1161–1164. [Google Scholar] [CrossRef] [PubMed]
- Yu, H.Y.; Zhao, P.; Wu, M.C.; Liu, J.; Yin, W. Serum adropin levels are decreased in patients with acute myocardial infarction. Regul. Pept. 2014, 190–191, 46–49. [Google Scholar] [CrossRef] [PubMed]
- Gu, X.; Li, H.; Zhu, X.; Gu, H.; Chen, J.; Wang, L.; Harding, P.; Xu, W. Inverse Correlation Between Plasma Adropin and ET-1 Levels in Essential Hypertension: A Cross-Sectional Study. Medicine 2015, 94, e1712. [Google Scholar] [CrossRef]
- Brnić, D.; Martinovic, D.; Zivkovic, P.M.; Tokic, D.; Tadin Hadjina, I.; Rusic, D.; Vilovic, M.; Supe-Domic, D.; Tonkic, A.; Bozic, J. Serum adropin levels are reduced in patients with inflammatory bowel diseases. Sci. Rep. 2020, 10, 9264. [Google Scholar] [CrossRef]
- Gundogdu, G.; Gundogdu, K. A novel biomarker in patients with knee osteoarthritis: Adropin. Clin. Rheumatol. 2018, 37, 2179–2186. [Google Scholar] [CrossRef]
- Yolbas, S.; Kara, M.; Yilmaz, M.; Aydin, S.; Koca, S.S. Serum adropin level and ENHO gene expression in systemic sclerosis. Clin. Rheumatol. 2016, 35, 1535–1540. [Google Scholar] [CrossRef]
- Danolić, M.J.; Perković, D.; Petrić, M.; Barišić, I.; Gugo, K.; Božić, J. Adropin Serum Levels in Patients with Primary Sjögren’s Syndrome. Biomolecules 2021, 11, 1296. [Google Scholar] [CrossRef]
- Yolbas, S.; Kara, M.; Kalayci, M.; Yildirim, A.; Gundogdu, B.; Aydin, S.; Koca, S.S. ENHO gene expression and serum adropin level in rheumatoid arthritis and systemic lupus erythematosus. Adv. Clin. Exp. Med. 2018, 27, 1637–1641. [Google Scholar] [CrossRef] [Green Version]
- Zielonka, J.; Sikora, A.; Joseph, J.; Kalyanaraman, B. Peroxynitrite is the major species formed from different flux ratios of co-generated nitric oxide and superoxide: Direct reaction with boronate-based fluorescent probe. J. Biol. Chem. 2010, 285, 14210–14216. [Google Scholar] [CrossRef] [PubMed] [Green Version]
- Aletaha, D.; Neogi, T.; Silman, A.J.; Funovits, J.; Felson, D.T.; Bingham, C.O., III; Birnbaum, N.S.; Burmester, G.R.; Bykerk, V.P.; Cohen, M.D.; et al. Rheumatoid arthritis classification criteria: An American College of Rheumatology/European League Against Rheumatism collaborative initiative. Arthritis Rheum. 2010, 62, 2569–2581. [Google Scholar] [CrossRef] [PubMed]
- Wells, G.; Becker, J.C.; Teng, J.; Dougados, M.; Schiff, M.; Smolen, J.; Aletaha, D.; van Riel, P.L. Validation of the 28-joint Disease Activity Score (DAS28) and European League Against Rheumatism response criteria based on C-reactive protein against disease progression in patients with rheumatoid arthritis, and comparison with the DAS28 based on erythrocyte sedimentation rate. Ann. Rheum. Dis. 2009, 68, 54–60. [Google Scholar] [CrossRef]
- Fries, J.F.; Spitz, P.; Kraines, R.G.; Holman, H.R. Measurement of patient outcome in arthritis. Arthritis Rheum. 1980, 23, 137–145. [Google Scholar] [CrossRef] [PubMed]
- Zang, H.; Jiang, F.; Cheng, X.; Xu, H.; Hu, X. Serum adropin levels are decreased in Chinese type 2 diabetic patients and negatively correlated with body mass index. Endocr. J. 2018, 65, 685–691. [Google Scholar] [CrossRef] [PubMed] [Green Version]
- Wu, L.; Fang, J.; Chen, L.; Zhao, Z.; Luo, Y.; Lin, C.; Fan, L. Low serum adropin is associated with coronary atherosclerosis in type 2 diabetic and non-diabetic patients. Clin. Chem. Lab. Med. 2014, 52, 751–758. [Google Scholar] [CrossRef]
- Boric-Skaro, D.; Mizdrak, M.; Luketin, M.; Martinovic, D.; Tokic, D.; Vilovic, M.; Supe-Domic, D.; Kurir, T.T.; Bozic, J. Serum Adropin Levels in Patients on Hemodialysis. Life 2021, 11, 337. [Google Scholar] [CrossRef]
- Butler, A.A.; Tam, C.S.; Stanhope, K.L.; Wolfe, B.M.; Ali, M.R.; O’Keeffe, M.; St-Onge, M.P.; Ravussin, E.; Havel, P.J. Low Circulating Adropin Concentrations with Obesity and Aging Correlate with Risk Factors for Metabolic Disease and Increase after Gastric Bypass Surgery in Humans. J. Clin. Endocrinol. Metab. 2012, 97, 3783–3791. [Google Scholar] [CrossRef] [Green Version]
- Zhang, S.; Chen, Q.; Lin, X.; Chen, M.; Liu, Q. A Review of Adropin as the Medium of Dialogue between Energy Regulation and Immune Regulation. Oxid. Med. Cell. Longev. 2020, 2020, 3947806. [Google Scholar] [CrossRef]
- Gao, F.; Fang, J.; Chen, F.; Wang, C.; Chen, S.; Zhang, S.; Lv, X.; Zhang, J.; He, Q.; Weng, S.; et al. Enho mutations causing low adropin: A possible pathomechanism of MPO-ANCA associated lung injury. EbioMedicine 2016, 9, 324–335. [Google Scholar] [CrossRef] [Green Version]
- Akcılar, R.; Emel Koçak, F.; Şimşek, H.; Akcılar, A.; Bayat, Z.; Ece, E.; Kökdaşgil, H. The effect of adropin on lipid and glucose metabolism in rats with hyperlipidemia. Iran. J. Basic. Med. Sci. 2016, 19, 245–251. [Google Scholar] [PubMed]
- Lovren, F.; Pan, Y.; Quan, A.; Singh, K.K.; Shukla, P.C.; Gupta, M.; Al-Omran, M.; Teoh, H.; Verma, S. Adropin is a novel regulator of endothelial function. Circulation 2010, 122, 185–192. [Google Scholar] [CrossRef] [PubMed] [Green Version]
- Bozic, J.; Borovac, J.A.; Galic, T.; Ticinovic-Kurir, T.; Supe-Domic, D.; Dogas, Z. Adropin and inflammation biomarker levels in male patients with obstructive sleep apnea: A link with glucose metabolism and sleep parameters. J. Clin. Sleep Med. 2018, 14, 1109–1118. [Google Scholar] [CrossRef] [PubMed] [Green Version]
- Gregersen, P.K.; Amos, C.I.; Lee, A.T.; Lu, E.; Remmers, E.F.; Kastner, D.L.; Seldin, M.F.; Criswell, L.A.; Plenge, R.M.; Holers, V.M.; et al. REL, a member of the NF-κB family of transcription factor, is a newlydefined risk locus for rheumatoid arthritis. Nat. Genet. 2009, 41, 820–823. [Google Scholar] [CrossRef] [Green Version]
- Takayanagi, H.; Iizuka, H.; Juji, T.; Nakagawa, T.; Yamamoto, A.; Miyazaki, T.; Koshihara, Y.; Oda, H.; Nakamura, K.; Tanaka, S. Involvement of receptor activator of nuclear factor kappaB ligand/osteoclast differentiation factor in osteoclastogenesis from synoviocytes in rheumatoid arthritis. Arthritis Rheum. 2000, 43, 259–269. [Google Scholar] [CrossRef]
- Handel, M.L.; McMorrow, L.B.; Gravallese, E.M. Nuclear factor-kappa B in rheumatoid synovium. Localization of p50 and p65. Arthritis Rheum. 1995, 38, 1762–1770. [Google Scholar] [CrossRef]
- Marok, R.; Winyard, P.G.; Coumbe, A.; Kus, M.L.; Gaffney, K.; Blades, S.; Mapp, P.I.; Morris, C.J.; Blake, D.R.; Kaltschmidt, C.; et al. Activation of the transcription factor nuclear factor-kappaB in human inflamed synovial tissue. Arthritis Rheum. 1996, 39, 583–591. [Google Scholar] [CrossRef]
- Miagkov, A.V.; Kovalenko, D.V.; Brown, C.E.; Didsbury, J.R.; Cogswell, J.P.; Stimpson, S.A.; Baldwin, A.S.; Makarov, S.S. NF-kappaB activation provides the potential link between inflammation and hyperplasia in the arthritic joint. Proc. Natl. Acad. Sci. USA 1998, 95, 13859–13864. [Google Scholar] [CrossRef] [Green Version]
- Ghoshal, S.; Stevens, J.R.; Billon, C.; Girardet, C.; Sitaula, S.; Leon, A.S.; Rao, D.C.; Skinner, J.S.; Rankinen, T.; Bouchard, C.; et al. Adropin: An endocrine link between the biological clock and cholesterol homeostasis. Mol. Metab. 2018, 8, 51–64. [Google Scholar] [CrossRef]
- Mamontova, A.; Séguret-Macé, S.; Esposito, B.; Chaniale, C.; Bouly, M.; Delhaye-Bouchaud, N.; Luc, G.; Staels, B.; Duverger, N.; Mariani, J.; et al. Severe atherosclerosis and hypoalphalipoproteinemia in the staggerer mouse, a mutant of the nuclear receptor RORalpha. Circulation 1998, 98, 2738–2743. [Google Scholar] [CrossRef]
- Kopmels, B.; Mariani, J.; Delhaye-Bouchaud, N.; Audibert, F.; Fradelizi, D.; Wollman, E.E. Evidence for a hyperexcitability state of staggerer mutant mice macrophages. J. Neurochem. 1992, 58, 192–199. [Google Scholar] [CrossRef] [PubMed]
- Delerive, P.; Monté, D.; Dubois, G.; Trottein, F.; Fruchart-Najib, J.; Mariani, J.; Fruchart, J.C.; Staels, B. The orphan nuclear receptor ROR alpha is a negative regulator of the inflammatory response. EMBO Rep. 2001, 2, 42–48. [Google Scholar] [CrossRef] [PubMed]
- Sayın, O.; Tokgöz, Y.; Arslan, N. Investigation of adropin and leptin levels in pediatric obesity-related nonalcoholic fatty liver disease. J. Pediatr. Endocrinol. Metab. 2014, 27, 479–484. [Google Scholar] [CrossRef]
- Solomon, D.H.; Love, T.J.; Canning, C.; Schneeweiss, S. Risk of diabetes among patients with rheumatoid arthritis, psoriatic arthritis and psoriasis. Ann. Rheum. Dis. 2010, 69, 2114–2117. [Google Scholar] [CrossRef] [PubMed] [Green Version]
- Del Rincón, I.; Freeman, G.L.; Haas, R.W.; O’Leary, D.H.; Escalante, A. Relative contribution of cardiovascular risk factors and rheumatoid arthritis clinical manifestations to atherosclerosis. Arthritis Rheum. 2005, 52, 3413–3423. [Google Scholar] [CrossRef]
- Danve, A.S.; Kulkarni, S. Do Tumor Necrosis Factor (TNF) Inhibitors Improve the Glycemic Control in Patients with Rheumatoid Arthritis and Concomitant Diabetes Mellitus? Am. J. Ther. 2017, 24, e347–e350. [Google Scholar] [CrossRef]
- Tam, L.S.; Tomlinson, B.; Chu, T.T.; Li, T.K.; Li, E.K. Impact of TNF inhibition on insulin resistance and lipids levels in patients with rheumatoid arthritis. Clin. Rheumatol. 2007, 26, 1495–1498. [Google Scholar] [CrossRef]
- Jasaszwili, M.; Pruszy’nska-Oszmałek, E.; Wojciechowicz, T.; Strowski, M.Z.; Nowak, K.W.; Skrzypski, M. Adropin Slightly Modulates Lipolysis, Lipogenesis and Expression of Adipokines but Not Glucose Uptake in Rodent Adipocytes. Genes 2021, 12, 914. [Google Scholar] [CrossRef]
- Fatel, E.C.S.; Rosa, F.T.; Simão, A.N.C.; Dichi, I. Adipokines in rheumatoid arthritis. Adv. Rheumatol. 2018, 58, 25. [Google Scholar] [CrossRef]
- Abella, V.; Scotece, M.; Conde, J.; López, V.; Lazzaro, V.; Pino, J.; Gómez-Reino, J.J.; Gualillo, O. Adipokines, metabolic syndrome and rheumatic Diseases. J. Immunol. Rese. 2014, 343746. [Google Scholar] [CrossRef]


| Parameter | RA Group (n = 70) | Control Group (n = 70) | p * |
|---|---|---|---|
| Female sex (N,%) | 64 (91.4) | 61 (87.1) | 0.737 |
| Age (years) | 55.9 ± 12.5 | 52.5 ± 14.1 | 0.134 |
| Body weight (kg) | 73.2 ± 13.6 | 69.6 ± 14.1 | 0.124 |
| Body height (cm) | 169.1 ± 7.2 | 168.1 ± 10.1 | 0.487 |
| Body mass index (kg/m2) | 25.6 ± 4.2 | 25.0 ± 4.3 | 0.394 |
| SBP (mmHg) | 131.2 ± 17.5 | 126.3 ± 15.2 | 0.078 |
| DBP (mmHg) | 80.9 ± 10.9 | 78.7 ± 11.4 | 0.244 |
| Smoking (N,%) | 22 (31.4) | 16 (22.9) | 0.349 |
| Disease duration (years) † | 15.0 (10.0–20.0) | - | - |
| Rheumatoid factor (N,%) | 46 (65.7) | - | - |
| Anti-CCP (N,%) | 51 (72.8) | - | - |
| DAS28 (score) ‡ | 2.49 ± 0.94 | - | - |
| HAQ (score) | 0.83 ± 0.60 | - | - |
| csDMARD | 50 (71.4) | - | - |
| tsDMARD | 10 (14.2) | - | - |
| bDMARD | 60 (85.8) | - | - |
| Parameter. | RA Group (n = 70) | Control Group (n = 70) | p * |
|---|---|---|---|
| Erythrocytes (×1012/L) | 4.4 ± 0.4 | 4.5 ± 0.5 | 0.330 |
| Hemoglobin (g/L) | 133.8 ± 12.9 | 136.1 ± 10.8 | 0.269 |
| TSH (mIU/mL) | 2.2 (1.3–3.4) | 1.8 (1.2–3.2) | 0.365 |
| Urea (mmol/L) | 5.2 ± 1.7 | 5.0 ± 1.6 | 0.355 |
| Creatinine (μmol/L) | 70.0 ± 17.3 | 64.1 ± 10.7 | 0.017 |
| hsCRP (mg/L) | 1.7 (0.7–3.1) | 1.2 (0.6–1.9) | 0.009 |
| Triglycerides (mmol/L) | 1.4 ± 0.7 | 1.3 ± 0.6 | 0.384 |
| Total cholesterol (mmol/L) | 5.3 ± 1.2 | 4.7 ± 1.0 | 0.002 |
| HDL cholesterol (mmol/L) | 1.8 ± 0.4 | 1.8 ± 0.5 | 0.515 |
| LDL cholesterol (mmol/L) | 3.3 (2.5–3.8) | 2.7 (2.0–3.6) | 0.025 |
| Fasting glucose (mmol/L) | 5.0 ± 0.7 | 4.7 ± 0.5 | 0.007 |
| Fasting insulin (pmol/L) | 80.3 ± 37.0 | 71.1 ± 36.2 | 0.164 |
| HbA1c (%) | 5.7 ± 0.4 | 5.5 ± 0.4 | 0.052 |
| HOMA-IR | 2.7 ± 1.6 | 2.1 ± 1.1 | 0.027 |
| Parameter | r * | p |
|---|---|---|
| hsCRP (mg/L) | 0.103 † | 0.641 |
| Triglycerides (mmol/L) | −0.199 | 0.098 |
| Total cholesterol (mmol/L) | −0.172 | 0.043 |
| HDL (mmol/L) | 0.045 | 0.597 |
| LDL (mmol/L) | −0.057 † | 0.641 |
| Urea (mmol/L) | −0.112 | 0.187 |
| Creatinine (μmol/L) | −0.102 | 0.230 |
| TSH (mIU/mL) | −0.187 † | 0.120 |
| Age (years) | −0.036 | 0.671 |
| Body mass index (kg/m2) | 0.026 | 0.760 |
| SBP (mmHg) | −0.109 | 0.199 |
| DBP (mmHg) | −0.038 | 0.659 |
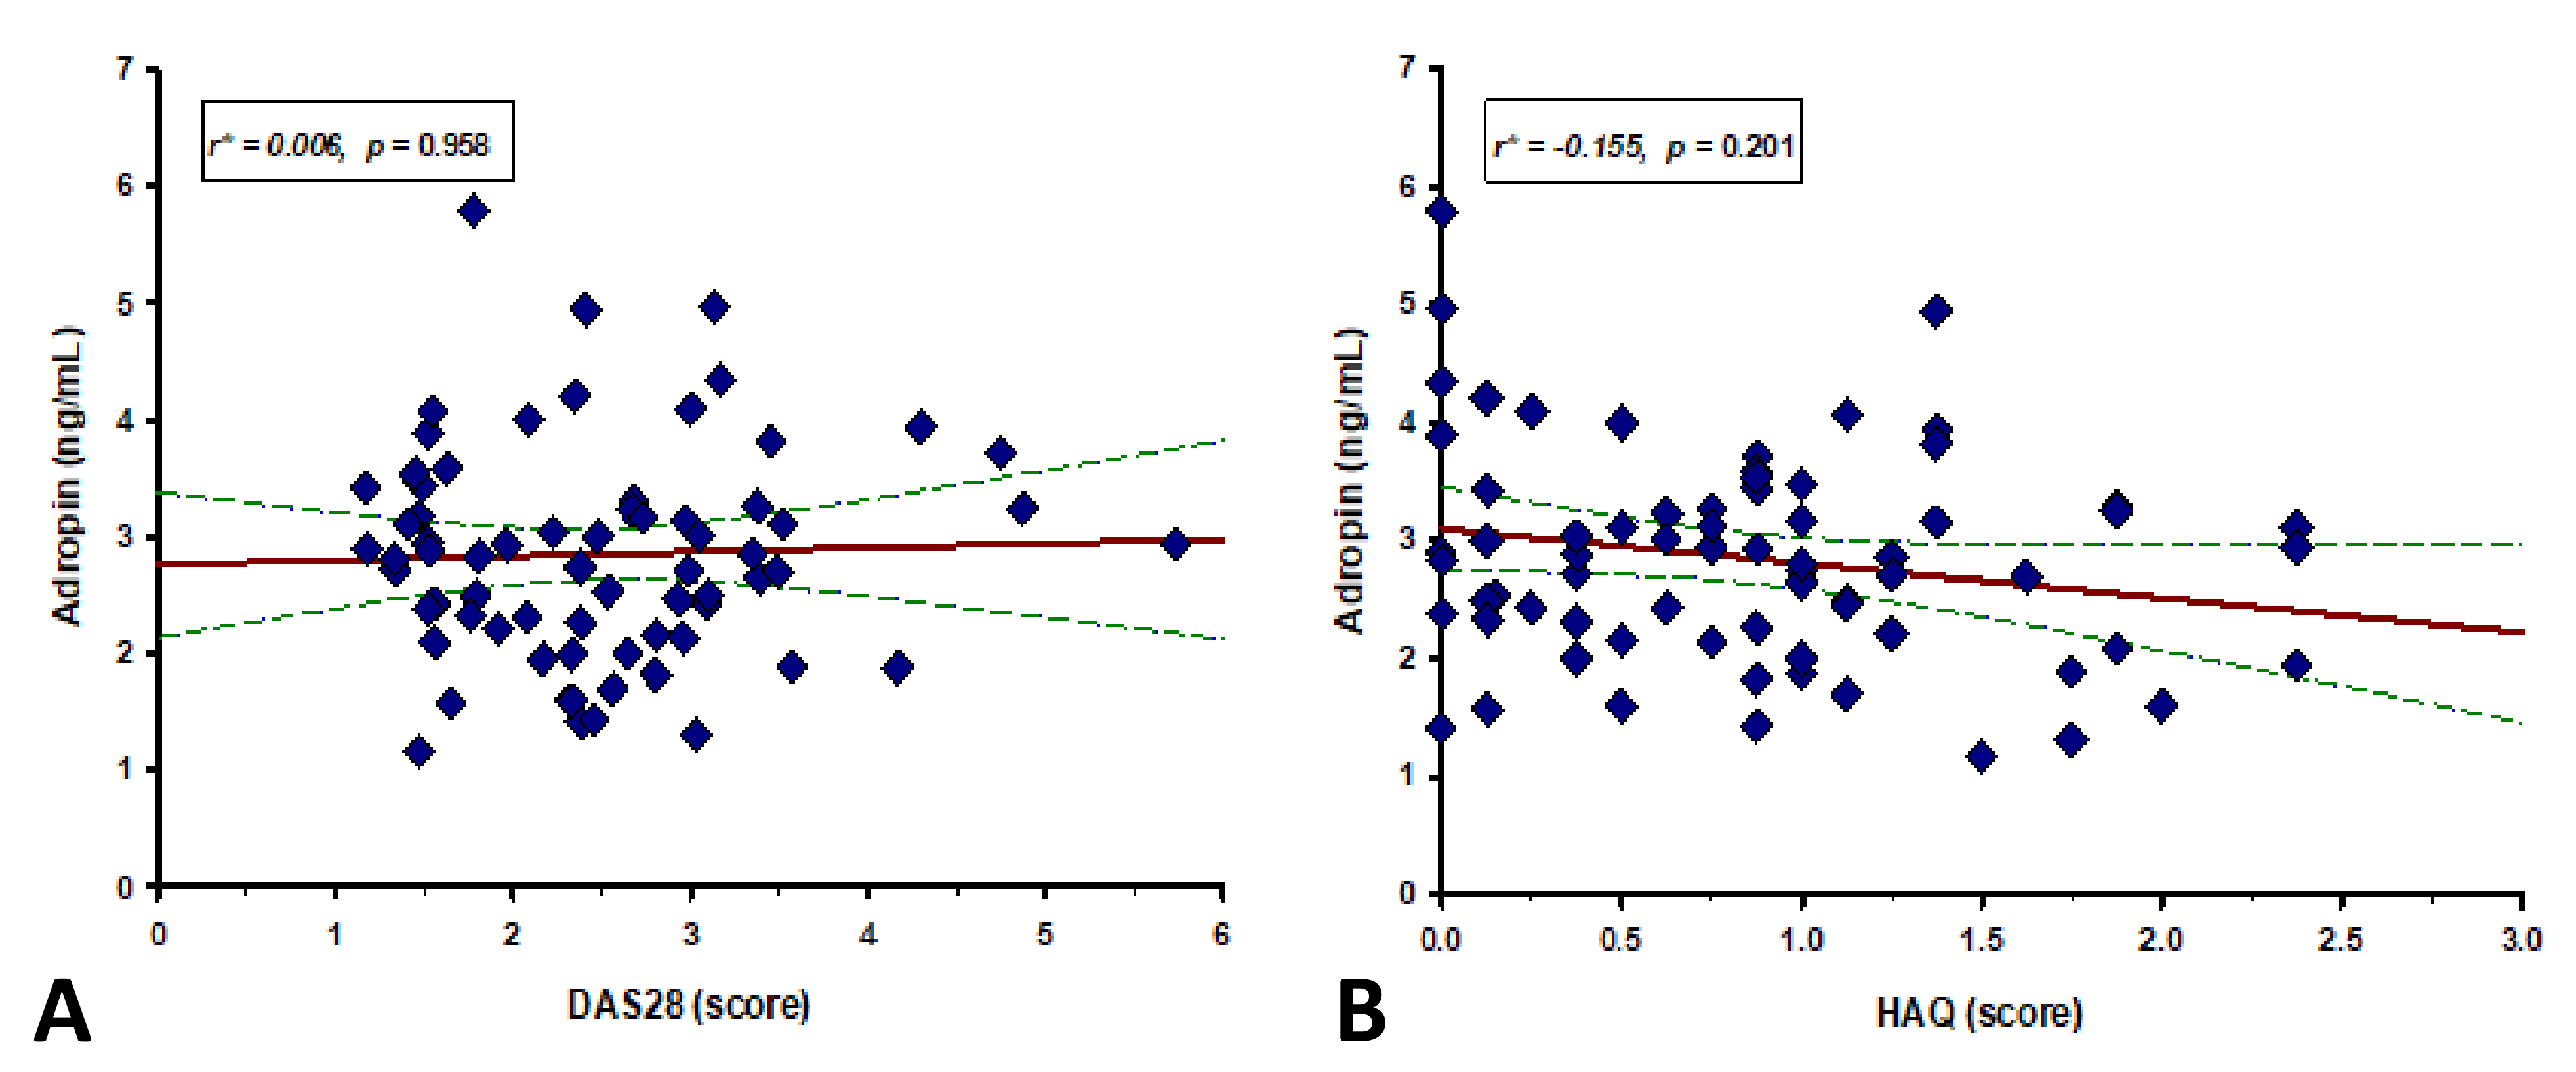
| HAQ (score) | −0.155 | 0.201 |
| DAS28 (score) | 0.006 | 0.958 |
| Variable | β † | SE ‡ | t-Value | p |
|---|---|---|---|---|
| Age (years) | −0.007 | 0.009 | −0.816 | 0.418 |
| Body mass index (kg/m2) | 0.046 | 0.024 | 1.892 | 0.063 |
| DAS28 (score) | −0.089 | 0.137 | −0.655 | 0.515 |
| HAQ (score) | 0.362 | 0.208 | 1.740 | 0.087 |
| Disease duration (years) | 0.014 | 0.011 | 1.264 | 0.211 |
| Fasting glucose (mmol/L) | −0.450 | 0.140 | −3.219 | 0.002 |
| HbA1c (%) | −0.528 | 0.223 | −2.361 | 0.021 |
Publisher’s Note: MDPI stays neutral with regard to jurisdictional claims in published maps and institutional affiliations. |
© 2022 by the authors. Licensee MDPI, Basel, Switzerland. This article is an open access article distributed under the terms and conditions of the Creative Commons Attribution (CC BY) license (https://creativecommons.org/licenses/by/4.0/).
Share and Cite
Simac, P.; Perkovic, D.; Bozic, I.; Bilopavlovic, N.; Martinovic, D.; Bozic, J. Serum Adropin Levels in Patients with Rheumatoid Arthritis. Life 2022, 12, 169. https://doi.org/10.3390/life12020169
Simac P, Perkovic D, Bozic I, Bilopavlovic N, Martinovic D, Bozic J. Serum Adropin Levels in Patients with Rheumatoid Arthritis. Life. 2022; 12(2):169. https://doi.org/10.3390/life12020169
Chicago/Turabian StyleSimac, Petra, Dijana Perkovic, Ivona Bozic, Nada Bilopavlovic, Dinko Martinovic, and Josko Bozic. 2022. "Serum Adropin Levels in Patients with Rheumatoid Arthritis" Life 12, no. 2: 169. https://doi.org/10.3390/life12020169