
ICOS Gene Polymorphisms (IVS1 + 173 T/C and c. 1624 C/T) in Primary Sjögren’s Syndrome Patients: Analysis of ICOS Expression

 ,
,  , , ,
, , ,
Abstract
: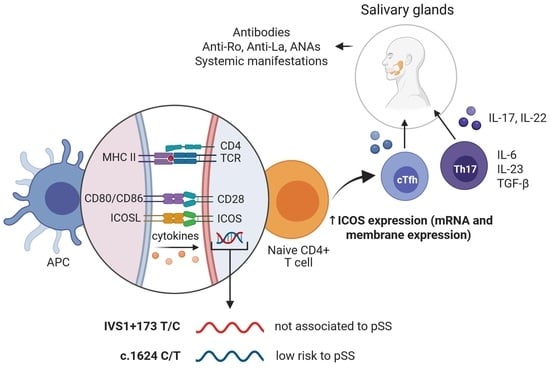
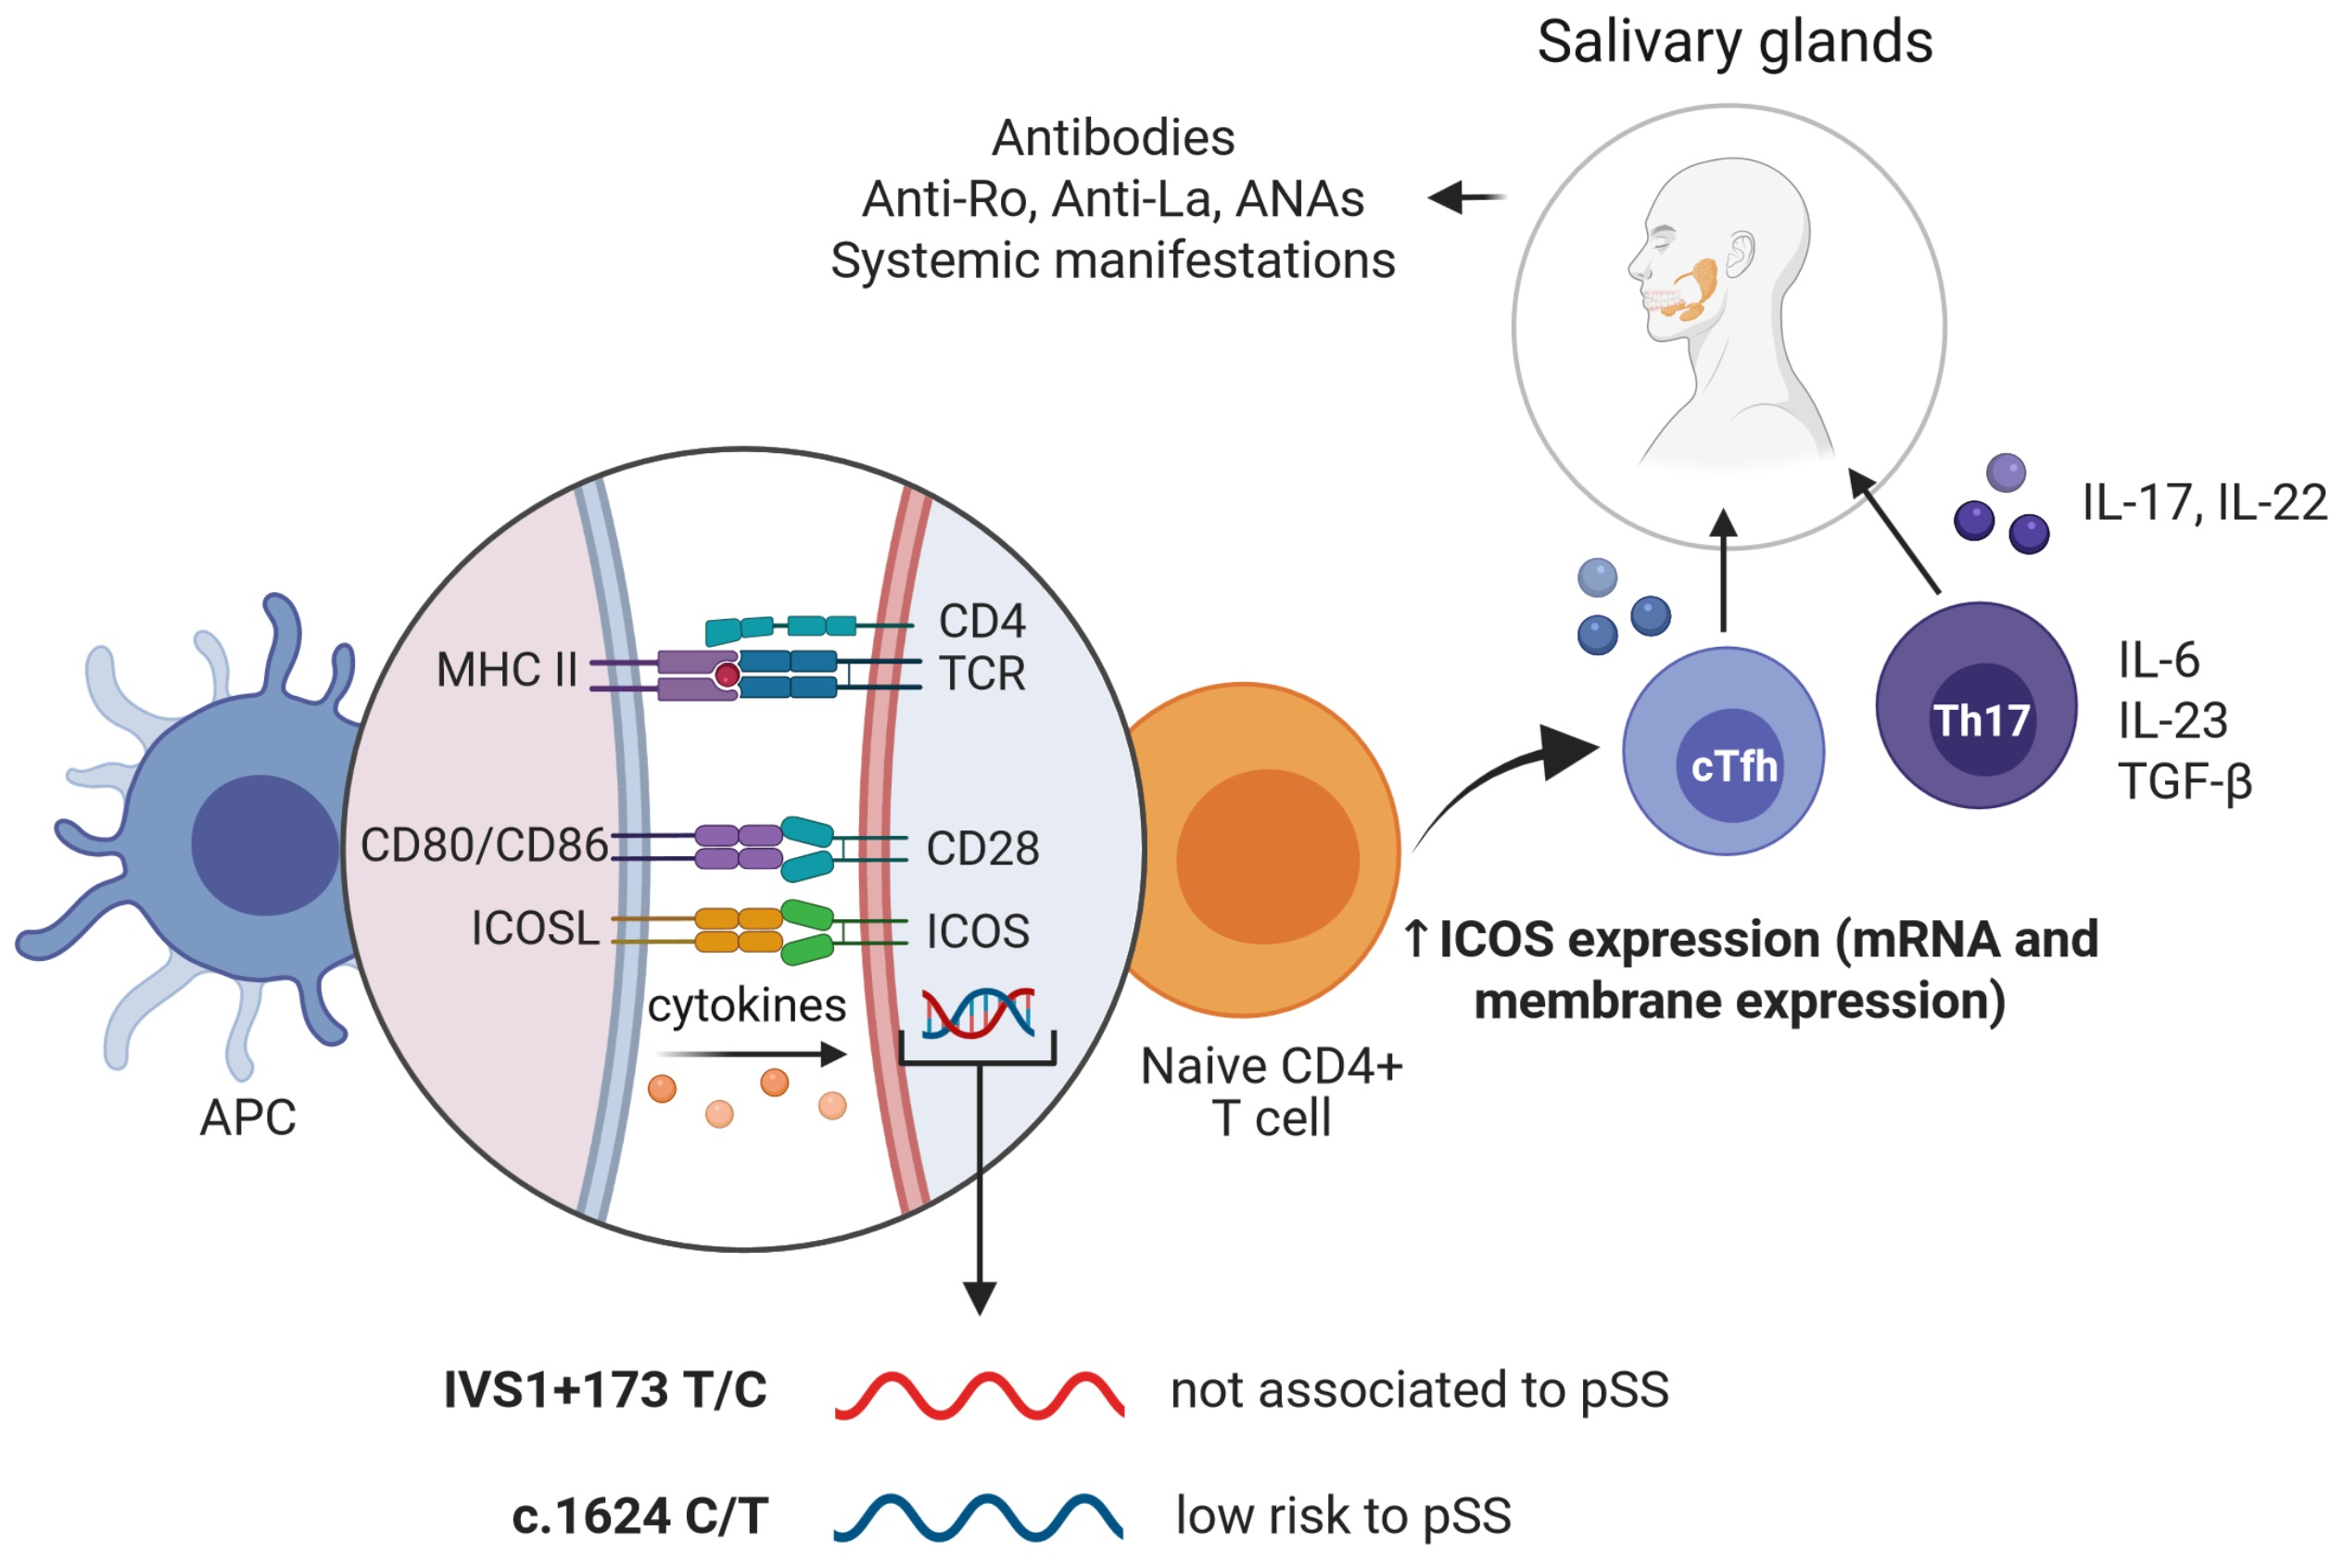
1. Introduction
2. Methods
2.1. Study Group
2.2. Genotype Analysis
2.3. ICOS mRNA Expression Analysis
2.4. Flow Cytometry
2.5. Statistical Analysis
3. Results
3.1. Demographic and Clinical Characteristics
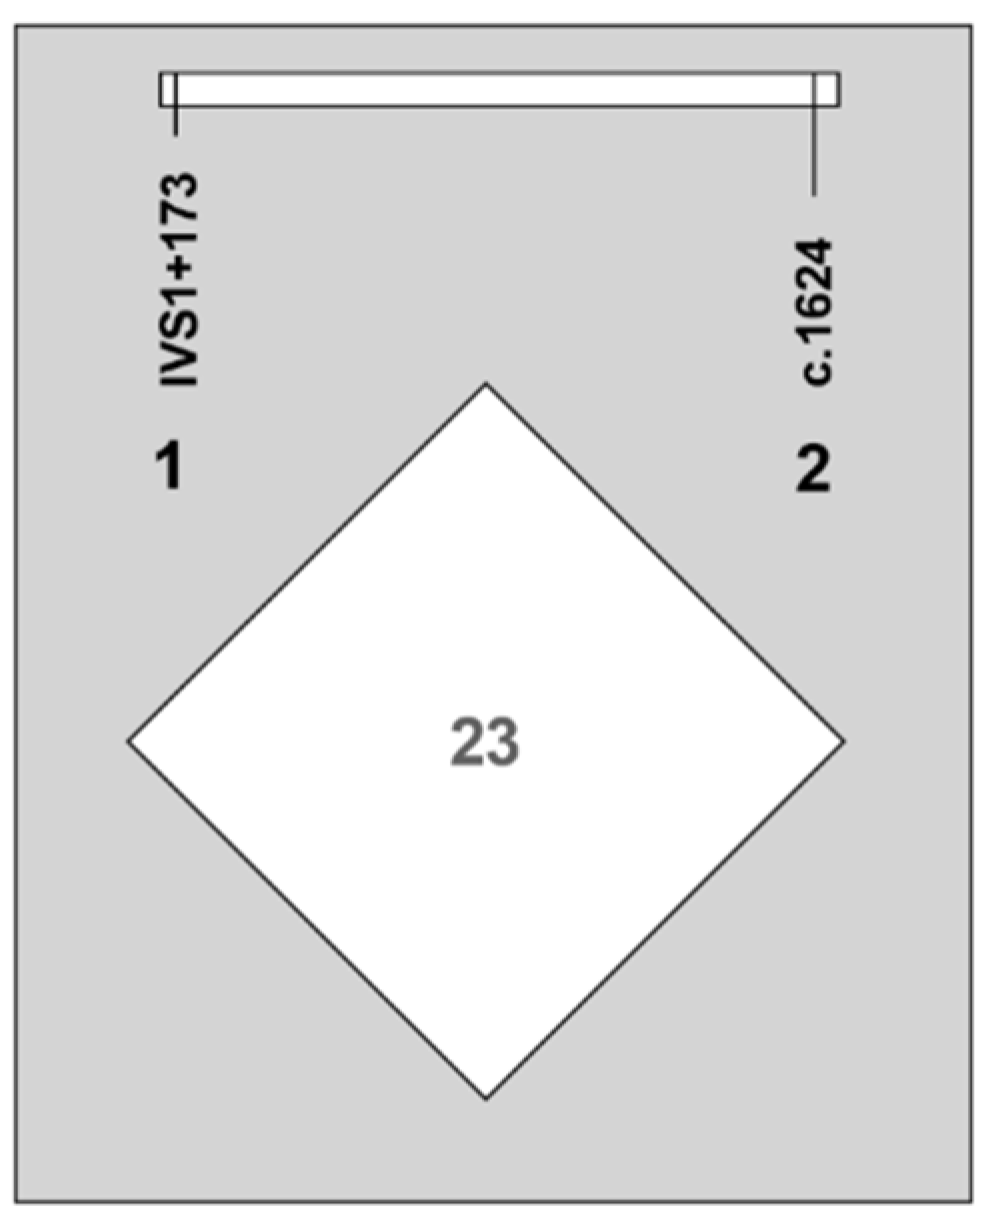
3.2. Frequency of ICOS Polymorphisms
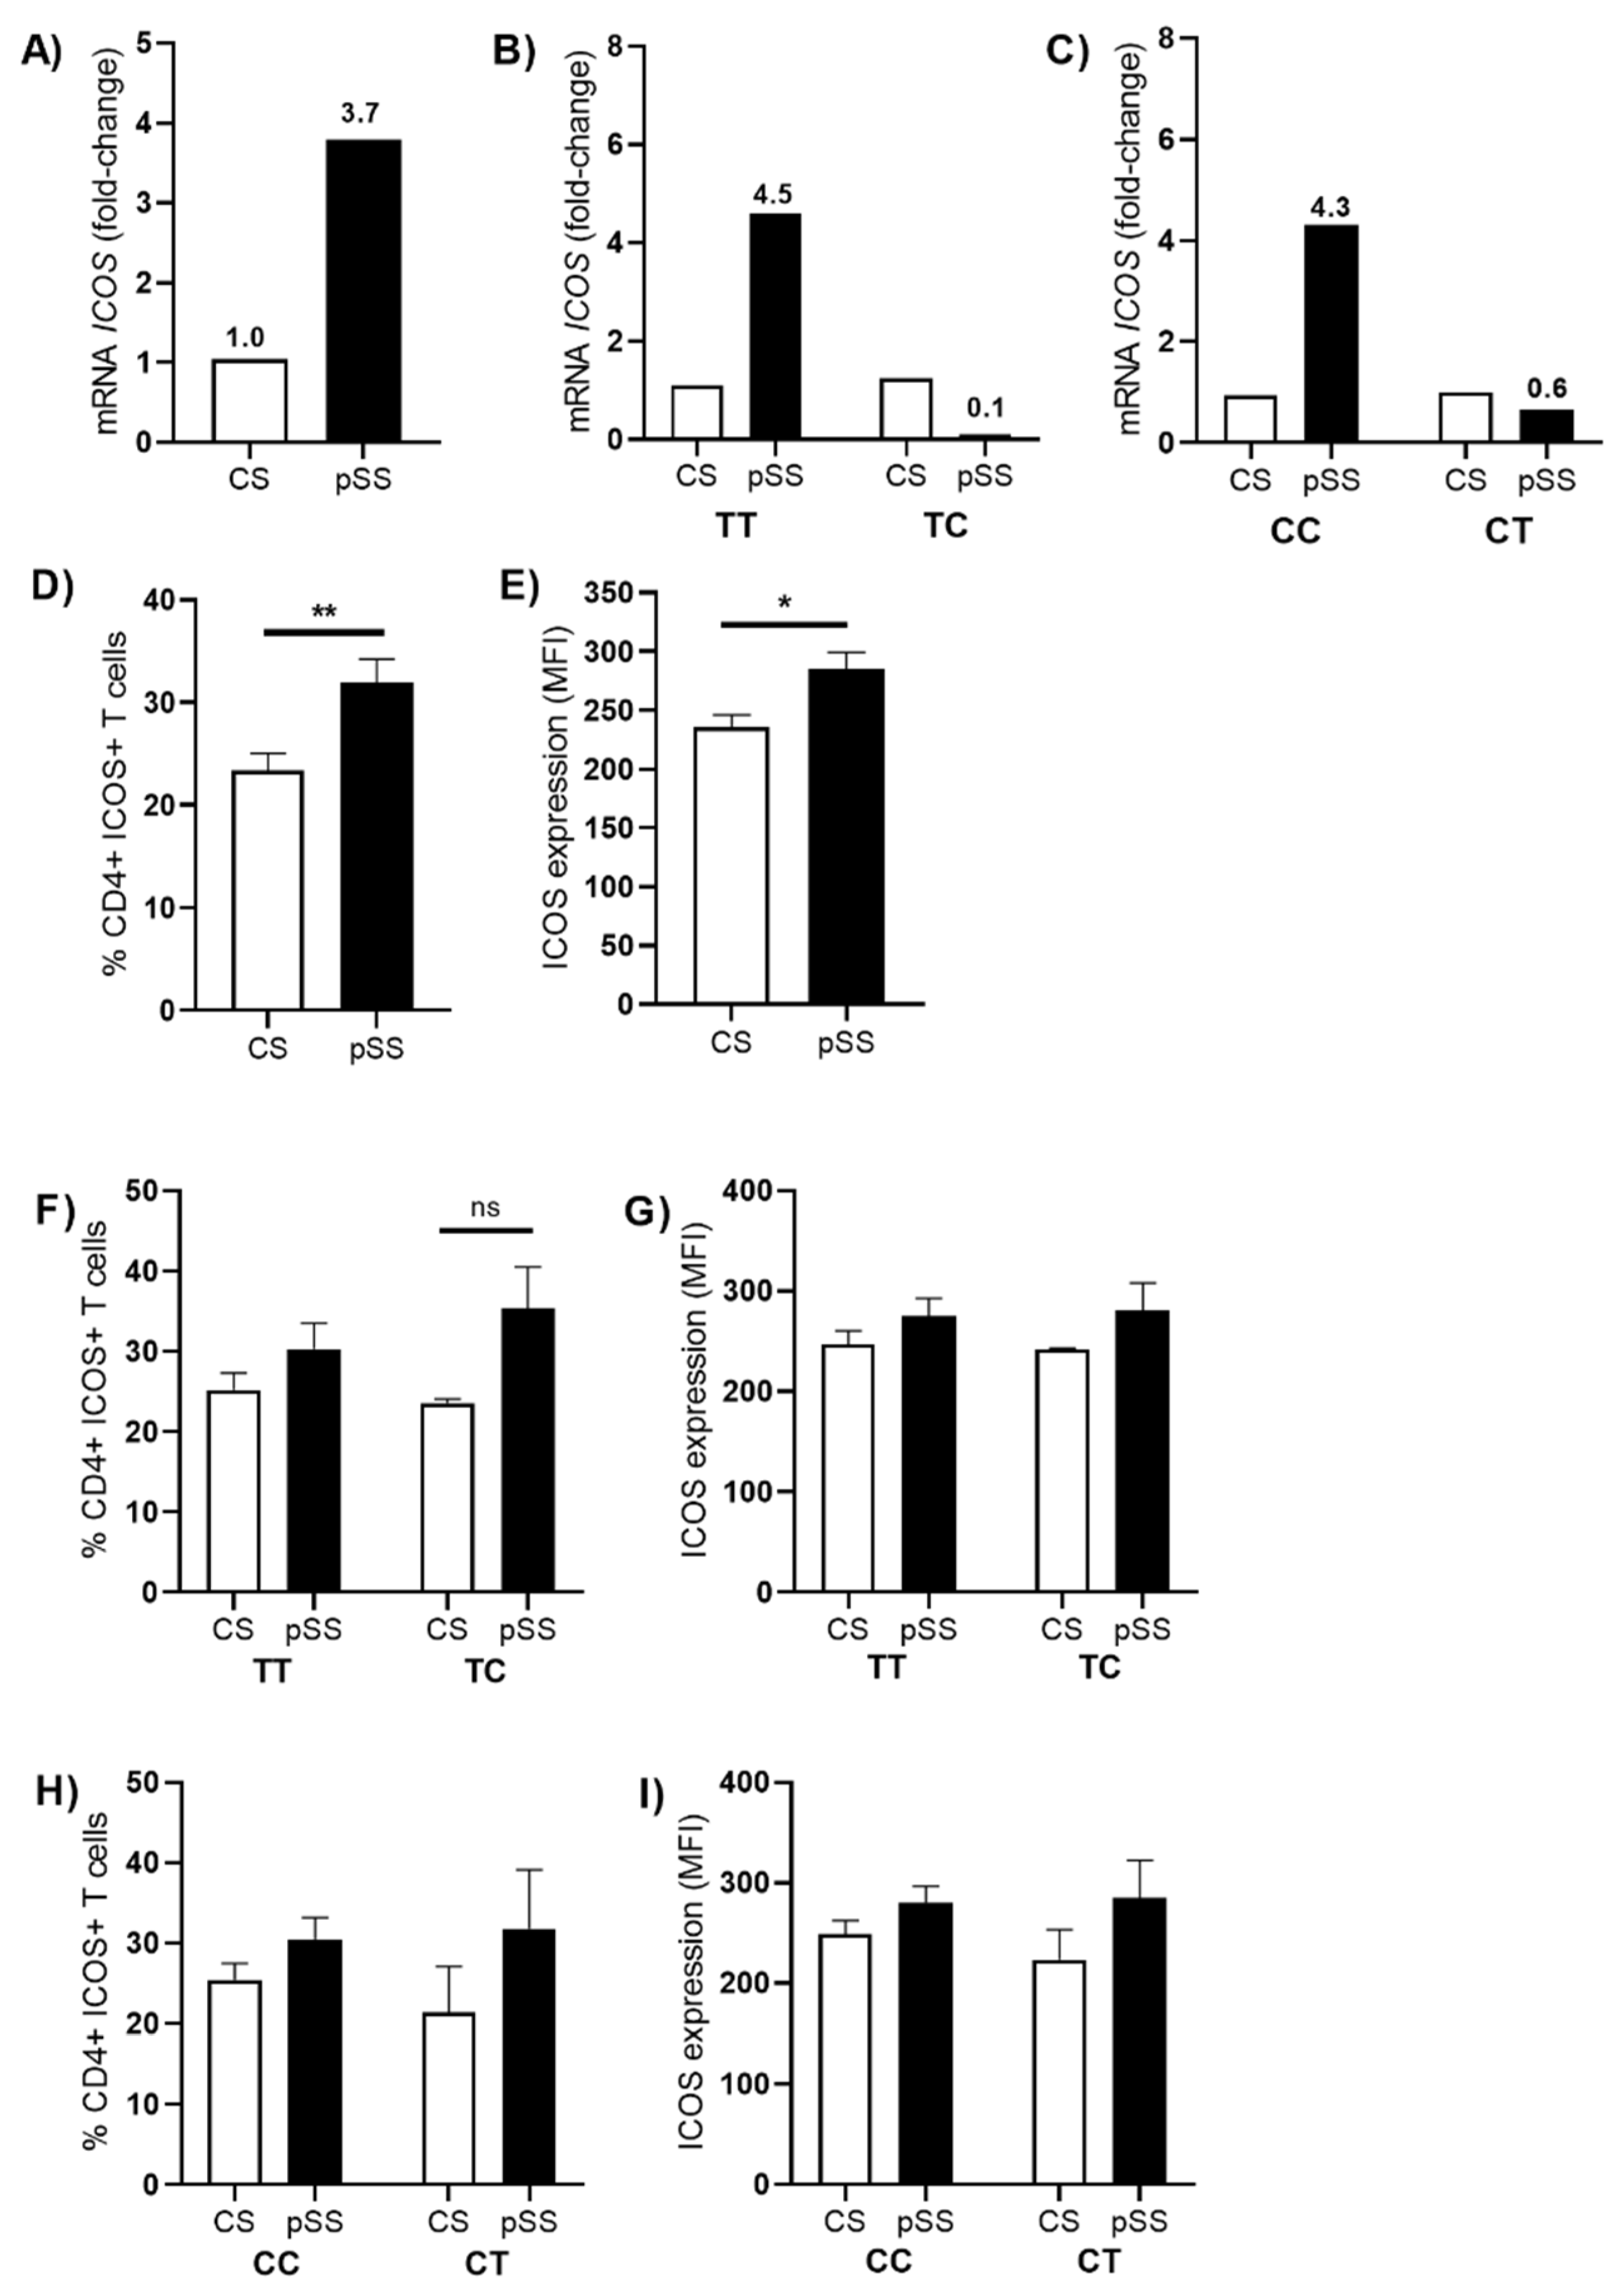
3.3. Association of ICOS Polymorphisms and Cellular Expression
3.4. Association of ICOS Expression with Focus Score and Immunoglobulins
4. Discussion
Author Contributions
Funding
Institutional Review Board Statement
Informed Consent Statement
Data Availability Statement
Conflicts of Interest
References
- Aqrawi, L.A.; Galtung, H.K.; Vestad, B.; Øvstebø, R.; Thiede, B.; Rusthen, S.; Young, A.; Guerreiro, E.M.; Utheim, T.P.; Chen, X.; et al. Identification of potential saliva and tear biomarkers in primary Sjögren′s syndrome, utilising the extraction of extracellular vesicles and proteomics analysis. Arthritis Res. Ther. 2017, 19, 14. [Google Scholar] [CrossRef] [Green Version]
- Nishikawa, A.; Suzuki, K.; Kassai, Y.; Gotou, Y.; Takiguchi, M.; Miyazaki, T.; Yoshimoto, K.; Yasuoka, H.; Yamaoka, K.; Morita, R.; et al. Identification of definitive serum biomarkers associated with disease activity in primary Sjögren′s syndrome. Arthritis Res. Ther. 2016, 18, 106. [Google Scholar] [CrossRef] [PubMed] [Green Version]
- Jonsson, R.; Brokstad, K.A.; Jonsson, M.V.; Delaleu, N.; Skarstein, K. Current concepts on Sjögren’s syndrome—Classification criteria and biomarkers. Eur. J. Oral Sci. 2018, 126, 37–48. [Google Scholar] [CrossRef] [PubMed]
- Björk, A.; Mofors, J.; Wahren-Herlenius, M. Environmental factors in the pathogenesis of primary Sjögren′s syndrome. J. Intern. Med. 2020, 287, 475–492. [Google Scholar] [CrossRef] [PubMed]
- Yao, Y.; Ma, J.-F.; Chang, C.; Xu, T.; Gao, C.-Y.; Gershwin, M.E.; Lian, Z.-X. Immunobiology of T Cells in Sjögren′s Syndrome. Clin. Rev. Allergy Immunol. 2020, 60, 111–131. [Google Scholar] [CrossRef]
- Voulgarelis, M.; Tzioufas, A.G. Pathogenetic mechanisms in the initiation and perpetuation of Sjögren′s syndrome. Nat. Rev. Rheumatol. 2010, 6, 529–537. [Google Scholar] [CrossRef]
- Brito-Zerón, P.; Baldini, C.; Bootsma, H.; Bowman, S.J.; Jonsson, R.; Mariette, X.; Sivils, K.; Theander, E.; Tzioufas, A.; Ramos-Casals, M. Sjögren syndrome. Nat. Rev. Dis. Primer. 2016, 2, 16047. [Google Scholar] [CrossRef]
- Acuto, O.; Michel, F. CD28-mediated co-stimulation: A quantitative support for TCR signalling. Nat. Rev. Immunol. 2003, 3, 939–951. [Google Scholar] [CrossRef]
- Shin, C.; Han, J.-A.; Koh, H.; Choi, B.; Cho, Y.; Jeong, H.; Ra, J.-S.; Sung, P.S.; Shin, E.-C.; Ryu, S.; et al. CD8α− Dendritic Cells Induce Antigen-Specific T Follicular Helper Cells Generating Efficient Humoral Immune Responses. Cell Rep. 2015, 11, 1929–1940. [Google Scholar] [CrossRef]
- Wikenheiser, D.J.; Stumhofer, J.S. ICOS Co-Stimulation: Friend or Foe? Front. Immunol. 2016, 7, 304. [Google Scholar] [CrossRef] [Green Version]
- Zhang, Q.; Vignali, D.A.A. Co-stimulatory and Co-inhibitory Pathways in Autoimmunity. Immunity 2016, 44, 1034–1051. [Google Scholar] [CrossRef] [Green Version]
- Imanishi, T.; Saito, T. T Cell Co-stimulation and Functional Modulation by Innate Signals. Trends Immunol. 2020, 41, 200–212. [Google Scholar] [CrossRef]
- Van, D.V.; Bauer, L.; Kroczek, R.A.; Hutloff, A. ICOS Costimulation Differentially Affects T Cells in Secondary Lymphoid Organs and Inflamed Tissues. Am. J. Respir. Cell Mol. Biol. 2018, 59, 437–447. [Google Scholar] [CrossRef] [PubMed]
- Pontarini, E.; Murray-Brown, W.J.; Croia, C.; Lucchesi, D.; Conway, J.; Rivellese, F.; Fossati-Jimack, L.; Astorri, E.; Prediletto, E.; Corsiero, E.; et al. Unique expansion of IL-21+ Tfh and Tph cells under control of ICOS identifies Sjögren′s syndrome with ectopic germinal centres and MALT lymphoma. Ann. Rheum. Dis. 2020, 79, 1588–1599. [Google Scholar] [CrossRef] [PubMed]
- Ramos-Casals, M.; Font, J. Primary Sjögren′s syndrome: Current and emergent aetiopathogenic concepts. Rheumatology 2005, 44, 1354–1367. [Google Scholar] [CrossRef] [Green Version]
- Haimila, K.; Smedberg, T.; Mustalahti, K.; Mäki, M.; Partanen, J.; Holopainen, P. Genetic association of coeliac disease susceptibility to polymorphisms in the ICOS gene on chromosome 2q33. Genes Immun. 2004, 5, 85–92. [Google Scholar] [CrossRef]
- Narbutt, J.; Lesiak, A.; Klich, I.; Torzecka, J.D.; Sysa-Jedrzejowska, A.; Młynarski, W. ICOS Gene Polymorphism May Be Associated with Pemphigus. J. Cutan. Med. Surg. 2010, 14, 291–297. [Google Scholar] [CrossRef]
- Higuchi, T.; Oka, S.; Furukawa, H.; Nakamura, M.; Komori, A.; Abiru, S.; Nagaoka, S.; Hashimoto, S.; Naganuma, A.; Naeshiro, N.; et al. Association of a single nucleotide polymorphism upstream of ICOS with Japanese autoimmune hepatitis type 1. J. Hum. Genet. 2017, 62, 481–484. [Google Scholar] [CrossRef] [PubMed]
- Luo, J.; Liao, X.; Zhang, L.; Xu, X.; Ying, S.; Yu, M.; Zhu, L.; Lin, S.; Wang, X. Transcriptome Sequencing Reveals Potential Roles of ICOS in Primary Sjögren′s Syndrome. Front. Cell Dev. Biol. 2020, 8, 592490. [Google Scholar] [CrossRef]
- Haimila, K.E.; Partanen, J.A.; Holopainen, P.M. Genetic polymorphism of the human ICOS gene. Immunogenetics 2002, 53, 1028–1032. [Google Scholar] [CrossRef]
- Kaartinen, T.; Lappalainen, J.; Haimila, K.; Autero, M.; Partanen, J. Genetic variation in ICOS regulates mRNA levels of ICOS and splicing isoforms of CTLA4. Mol. Immunol. 2007, 44, 1644–1651. [Google Scholar] [CrossRef] [PubMed]
- Essig, K.; Kronbeck, N.; Guimaraes, J.C.; Lohs, C.; Schlundt, A.; Hoffmann, A.; Behrens, G.; Brenner, S.; Kowalska, J.; Lopez-Rodriguez, C.; et al. Roquin targets mRNAs in a 3′-UTR-specific manner by different modes of regulation. Nat. Commun. 2018, 9, 3810. [Google Scholar] [CrossRef]
- Gonzalez-Quintela, A.; Alende, R.; Gude, F.; Campos, J.; Rey, J.; Meijide, L.M.; Fernandez-Merino, C.; Vidal, C. Serum levels of immunoglobulins (IgG, IgA, IgM) in a general adult population and their relationship with alcohol consumption, smoking and common metabolic abnormalities: Serum immunoglobulin levels in adults. Clin. Exp. Immunol. 2008, 151, 42–50. [Google Scholar] [CrossRef] [PubMed]
- Miller, S.A.; Dykes, D.D.; Polesky, H.F. A simple salting out procedure for extracting DNA from human nucleated cells. Nucleic Acids Res. 1988, 16, 1215. [Google Scholar] [CrossRef] [PubMed] [Green Version]
- Chomzynski, P. Single-Step Method of RNA Isolation by Acid Guanidinium Thiocyanate–Phenol–Chloroform Extraction. Anal. Biochem. 1987, 162, 156–159. [Google Scholar] [CrossRef] [PubMed]
- Rodrigues, A.R.; Soares, R. Inflammation in Sjögren′s syndrome: Cause or consequence? Autoimmunity 2017, 50, 141–150. [Google Scholar] [CrossRef] [PubMed]
- Reksten, T.R.; Jonsson, R. Sjögren syndrome genetics vary according to ancestry. Nat. Rev. Rheumatol. 2017, 13, 202–203. [Google Scholar] [CrossRef]
- Taylor, K.E.; Wong, Q.; Levine, D.M.; McHugh, C.; Laurie, C.; Doheny, K.; Lam, M.Y.; Baer, A.N.; Challacombe, S.; Lanfranchi, H.; et al. Genome—Wide Association Analysis Reveals Genetic Heterogeneity of Sjögren′s Syndrome According to Ancestry. Arthritis Rheumatol. 2017, 69, 1294–1305. [Google Scholar] [CrossRef] [Green Version]
- Odegard, J.M.; Marks, B.R.; DiPlacido, L.D.; Poholek, A.C.; Kono, D.H.; Dong, C.; Flavell, R.A.; Craft, J. ICOS-dependent extrafollicular helper T cells elicit IgG production via IL-21 in systemic autoimmunity. J. Exp. Med. 2008, 205, 2873–2886. [Google Scholar] [CrossRef] [Green Version]
- Simpson, T.R.; Quezada, S.A.; Allison, J.P. Regulation of CD4 T cell activation and effector function by inducible costimulator (ICOS). Curr. Opin. Immunol. 2010, 22, 326–332. [Google Scholar] [CrossRef]
- Hu, H.; Wu, X.; Jin, W.; Chang, M.; Cheng, X.; Sun, S.-C. Noncanonical NF- B regulates inducible costimulator (ICOS) ligand expression and T follicular helper cell development. Proc. Natl. Acad. Sci. USA 2011, 108, 12827–12832. [Google Scholar] [CrossRef] [Green Version]
- Grimbacher, B.; Hutloff, A.; Schlesier, M.; Glocker, E.; Warnatz, K.; Dräger, R.; Eibel, H.; Fischer, B.; Schäffer, A.A.; Mages, H.W.; et al. Homozygous loss of ICOS is associated with adult-onset common variable immunodeficiency. Nat. Immunol. 2003, 4, 261–268. [Google Scholar] [CrossRef]
- Mahajan, S.; Cervera, A.; MacLeod, M.; Fillatreau, S.; Perona-Wright, G.; Meek, S.; Smith, A.; MacDonald, A.; Gray, D. The role of ICOS in the development of CD4 T cell help and the reactivation of memory T. cells. Eur. J. Immunol. 2007, 37, 1796–1808. [Google Scholar] [CrossRef] [PubMed] [Green Version]
- Verstappen, G.M.; Meiners, P.M.; Corneth, O.B.J.; Visser, A.; Arends, S.; Abdulahad, W.H.; Hendriks, R.W.; Vissink, A.; Kroese, F.G.M.; Bootsma, H. Attenuation of Follicular Helper T Cell-Dependent B Cell Hyperactivity by Abatacept Treatment in Primary Sjögren′s Syndrome: Abatacept In Primary Sjögren′s Syndrome. Arthritis Rheumatol. 2017, 69, 1850–1861. [Google Scholar] [CrossRef]
- Hu, J.; Li, Q.-L.; Hou, S.-H.; Peng, H.; Guo, J.-J. Association of Inducible T Cell Costimulator Polymorphisms with Susceptibility and Outcome of Hepatitis B Virus Infection in a Chinese Han Population. Scand. J. Immunol. 2015, 82, 275–281. [Google Scholar] [CrossRef] [Green Version]
- Haimila, K.; Turpeinen, H.; Alakulppi, N.S.; Kyllönen, L.E.; Salmela, K.T.; Partanen, J. Association of Genetic Variation in Inducible Costimulator Gene With Outcome of Kidney Transplantation 2009, 87, 393–396. 87. [CrossRef]
- LaBerge, G.S.; Bennett, D.C.; Fain, P.R.; Spritz, R.A. PTPN22 Is Genetically Associated with Risk of Generalized Vitiligo, but CTLA4 Is Not. J. Invest. Dermatol. 2008, 128, 1757–1762. [Google Scholar] [CrossRef] [Green Version]
- Rangel-Villalobos, H.; Muñoz-Valle, J.F.; González-Martín, A.; Gorostiza, A.; Magaña, M.T.; Páez-Riberos, L.A. Genetic admixture, relatedness, and structure patterns among Mexican populations revealed by the Y-chromosome. Am. J. Phys. Anthropol. 2008, 135, 448–461. [Google Scholar] [CrossRef] [PubMed]
- Hasegawa, M.; Fujimoto, M.; Matsushita, T.; Hamaguchi, Y.; Takehara, K. Augmented ICOS expression in patients with early diffuse cutaneous systemic sclerosis. Rheumatology 2013, 52, 242–251. [Google Scholar] [CrossRef] [PubMed] [Green Version]
- Yang, J.-H.; Zhang, J.; Cai, Q.; Zhao, D.-B.; Wang, J.; Guo, P.-E.; Liu, L.; Han, X.-H.; Shen, Q. Expression and function of inducible costimulator on peripheral blood T cells in patients with systemic lupus erythematosus. Rheumatology 2005, 44, 1245–1254. [Google Scholar] [CrossRef] [Green Version]
- Pratama, A.; Srivastava, M.; Williams, N.J.; Papa, I.; Lee, S.K.; Dinh, X.T.; Hutloff, A.; Jordan, M.A.; Zhao, J.L.; Casellas, R.; et al. MicroRNA-146a regulates ICOS–ICOSL signalling to limit accumulation of T follicular helper cells and germinal centres. Nat. Commun. 2015, 6, 6436. [Google Scholar] [CrossRef]
- Fan, X.; Wang, J.; Qin, T.; Zhang, Y.; Liu, W.; Jiang, K.; Huang, D. Exosome miR—27a—3p secreted from adipocytes targets ICOS to promote antitumor immunity in lung adenocarcinoma. Thorac. Cancer. 2020, 11, 1453–1464. [Google Scholar] [CrossRef]
- Sharma, D.; Zagore, L.L.; Brister, M.M.; Ye, X.; Crespo-Hernández, C.E.; Licatalosi, D.D.; Jankowsky, E. The kinetic landscape of an RNA-binding protein in cells. Nature 2021, 591, 152–156. [Google Scholar] [CrossRef] [PubMed]
- Moriyama, M.; Hayashida, J.; Toyoshima, T.; Ohyama, Y.; Shinozaki, S.; Tanaka, A.; Maehara, T.; Nakamura, S. Cytokine/chemokine profiles contribute to understanding the pathogenesis and diagnosis of primary Sjögren′s syndrome. Clin. Exp. Immunol. 2012, 169, 17–26. [Google Scholar] [CrossRef] [PubMed] [Green Version]
- Jin, L.; Yu, D.; Li, X.; Yu, N.; Li, X.; Wang, Y.; Wang, Y. CD4+CXCR5+ follicular helper T cells in salivary gland promote B cells maturation in patients with primary Sjogren′s syndrome. Int. J. Clin. Exp. Pathol. 2014, 7, 1988–1996. [Google Scholar]
- Löhning, M.; Hutloff, A.; Kallinich, T.; Mages, H.W.; Bonhagen, K.; Radbruch, A.; Hamelmann, E.; Kroczek, R.A. Expression of ICOS In Vivo Defines CD4+ Effector T Cells with High Inflammatory Potential and a Strong Bias for Secretion of Interleukin 10. J. Exp. Med. 2003, 197, 181–193. [Google Scholar] [CrossRef] [PubMed] [Green Version]
- Coyle, A.J.; Lehar, S.; Lloyd, C.; Tian, J.; Delaney, T.; Manning, S.; Nguyen, T.; Burwell, T.; Schneider, H.; Gonzalo, J.A.; et al. The CD28-Related Molecule ICOS Is Required for Effective T Cell–Dependent Immune Responses. Immunity 2000, 13, 95–105. [Google Scholar] [CrossRef] [Green Version]
- Risselada, A.P.; Kruize, A.A.; Goldschmeding, R.; Lafeber, F.P.J.G.; Bijlsma, J.W.J.; van Roon, J.A.G. The prognostic value of routinely performed minor salivary gland assessments in primary Sjögren′s syndrome. Ann. Rheum. Dis. 2014, 73, 1537–1540. [Google Scholar] [CrossRef] [Green Version]
- Paulos, C.M.; Carpenito, C.; Plesa, G.; Suhoski, M.M.; Varela-Rohena, A.; Golovina, T.N.; Carroll, R.G.; Riley, J.L.; June, C.H. The Inducible Costimulator (ICOS) Is Critical for the Development of Human TH17 Cells. Sci. Transl. Med. 2010, 2, 55ra78. [Google Scholar] [CrossRef]
- Kroczek, R.A.; Mages, H.W.; Hutloff, A. Emerging paradigms of T-cell co-stimulation. Curr. Opin. Immunol. 2004, 16, 321–327. [Google Scholar] [CrossRef]
- Ceeraz, S.; Hall, C.; Choy, E.H.; Spencer, J.; Corrigall, V.M. Defective CD8+CD28− regulatory T cell suppressor function in rheumatoid arthritis is restored by tumour necrosis factor inhibitor therapy. Clin. Exp. Immunol. 2013, 174, 18–26. [Google Scholar] [CrossRef]
- Bortone, F.; Scandiffio, L.; Marcuzzo, S.; Bonanno, S.; Frangiamore, R.; Motta, T.; Antozzi, C.; Mantegazza, R.; Cavalcante, P.; Bernasconi, P. miR-146a in Myasthenia Gravis Thymus Bridges Innate Immunity With Autoimmunity and Is Linked to Therapeutic Effects of Corticosteroids. Front. Immunol. 2020, 11, 142. [Google Scholar] [CrossRef] [PubMed]
- Wang, X.; Li, T.; Si, R.; Chen, J.; Qu, Z.; Jiang, Y. Increased frequency of PD-1hiCXCR5- T cells and B cells in patients with newly diagnosed IgA nephropathy. Sci. Rep. 2020, 10, 492. [Google Scholar] [CrossRef] [PubMed] [Green Version]


| Sjögren’s Syndrome Patients (pSS) | |
|---|---|
| Features | pSS (n = 134) |
| Demographics | |
| Age, years (range) | 55 (29–83) |
| Sex (F/M) | 133/1 |
| Disease duration (years) | 5.62 ± 4.51 |
| Inflammation markers | |
| CRP (mg/L) | 3.73 ± 3.02 (0.20–24.40) |
| ESR (mm/h) | 26.89 ± 15.10 (0–76) |
| Clinical parameters | |
| Schirmer ≤ 5 mm/5 min | 3.14 ± 2.12 (0–17) |
| Foci number ≥ 1 focus/4 mm2 | 2.42 ± 1.28 (0.5–8.0) |
| SSDAI score (Min–Max) | 2.12 ± 1.63 (0–6) |
| SSDDI score (Min–Max) | 1.35 ± 1.05 (0–5) |
| ESSDAI score (Min–Max) | 3.15 ± 3.89 (0–19) |
| Anti-Ro UI/mL (%) | 32.24 ± 58.96 (31.34) |
| Anti-La UI/mL (%) | 12.42 ± 25.09 (12.68) |
| ANA, n (%) | 64 (47.76) |
| FR positive UI/mL (%) | 32.06 ± 34.55 (53.73) |
| Treatment * | |
| Prednisone, n (%) | 15 (11.19) |
| Hydroxychloroquine, n (%) | 75 (55.97) |
| Azathioprine, n (%) | 26 (19.40) |
| Methotrexate, n (%) | 29 (21.64) |
| IVS1 + 173 T/C and c.1624 C/T Genotypic and Allelic Frequencies | |||||
|---|---|---|---|---|---|
| Genotype | CS (n = 134)% (n) Controls | pSS (n = 134)% (n) Cases | p Value | OR (CI 95%); p | |
| IVS1 + 173 T>C (rs10932029) | |||||
| Codominant | TT TC CC | 69.40 (93) 29.11 (39) 1.49 (2) | 73.88 (99) 25.37 (34) 1.74 (1) | 0.499 | 1 0.819 (0.477–1.405); 0.468 0.70 (0.042–5.267); 0.530 |
| Dominant | TT TC + CC | 60.40 (93) 30.59 (41) | 73.88 (99) 26.11 (35) | 0.416 | 1 0.802 (0.471–1.366); 0.416 |
| Recessive | TT + TC CC | 98.50 (132) 1.49 (2) | 99.25 (133) 0.75 (1) | 0.561 | 1 0.496 (0.044–5.539); 0.561 |
| Alleles | T C | 83.95(225) 16.04 (43) | 86.56 (232) 13.43 (36) | 0.393 | 1 0.812 (0.503–1.311); 0.393 |
| c.1624 C>T (rs10932037) | |||||
| Codominant | CC CT TT | 70.89 (95) 28.35 (38) 0.74 (1) | 85.32 (113) 14.92 (20) 0.74 (1) | 0.455 | 1 0.442 (0.241–0.811); 0.007 0.841 (0.052–13.62); 0.902 |
| Dominant | CC CT + TT | 70.89 (95) 29.10 (39) | 84.32 (113) 15.67 (21) | 0.008 | 1 0.453 (0.249–0.822); 0.008 |
| Recessive | CC + CT TT | 99.25 (133) 0.75 (1) | 99.25 (133) 0.75 (1) | 1.00 | 1 1.0 (0.062–16.155); 1.000 |
| Alleles | C T | 85.07 (228) 14.92 (40) | 91.79 (246) 8.20 (22) | 0.015 | 1 0.510 (0.294–0.884); 0.015 |
Publisher’s Note: MDPI stays neutral with regard to jurisdictional claims in published maps and institutional affiliations. |
© 2022 by the authors. Licensee MDPI, Basel, Switzerland. This article is an open access article distributed under the terms and conditions of the Creative Commons Attribution (CC BY) license (https://creativecommons.org/licenses/by/4.0/).
Share and Cite
García-Espinoza, J.A.; Muñoz-Valle, J.F.; García-Chagollán, M.; Hernández-Bello, J.; Palafox-Sánchez, C.A.; López-Villalobos, E.F.; Sánchez-Zuno, G.A.; Martínez-Bonilla, G.E.; Cerpa-Cruz, S.; Carrillo-Ballesteros, F.J.; et al. ICOS Gene Polymorphisms (IVS1 + 173 T/C and c. 1624 C/T) in Primary Sjögren’s Syndrome Patients: Analysis of ICOS Expression. Curr. Issues Mol. Biol. 2022, 44, 764-776. https://doi.org/10.3390/cimb44020053
García-Espinoza JA, Muñoz-Valle JF, García-Chagollán M, Hernández-Bello J, Palafox-Sánchez CA, López-Villalobos EF, Sánchez-Zuno GA, Martínez-Bonilla GE, Cerpa-Cruz S, Carrillo-Ballesteros FJ, et al. ICOS Gene Polymorphisms (IVS1 + 173 T/C and c. 1624 C/T) in Primary Sjögren’s Syndrome Patients: Analysis of ICOS Expression. Current Issues in Molecular Biology. 2022; 44(2):764-776. https://doi.org/10.3390/cimb44020053
Chicago/Turabian StyleGarcía-Espinoza, José Antonio, José Francisco Muñoz-Valle, Mariel García-Chagollán, Jorge Hernández-Bello, Claudia Azucena Palafox-Sánchez, Erika Fabiola López-Villalobos, Gabriela Athziri Sánchez-Zuno, Gloria Esther Martínez-Bonilla, Sergio Cerpa-Cruz, Francisco Josue Carrillo-Ballesteros, and et al. 2022. "ICOS Gene Polymorphisms (IVS1 + 173 T/C and c. 1624 C/T) in Primary Sjögren’s Syndrome Patients: Analysis of ICOS Expression" Current Issues in Molecular Biology 44, no. 2: 764-776. https://doi.org/10.3390/cimb44020053