
N-Terminus-Mediated Solution Structure of Dimerization Domain of PRC1


Abstract
:Simple Summary
Abstract
1. Introduction
2. Materials and Methods
2.1. Protein-Template Construction
- DNA fragments encoding PRC1 1-486 and PRC1-DD were amplified by polymerase chain reaction (PCR) with primer sequences shown in Table S3.
- The PCR products and the circular pET-21a vector were digested by restriction enzymes Nde I and Xho I (NEB), respectively, to obtain target gene insertion fragments with sticky ends and the corresponding linear plasmids.
- The insertion fragments of the target gene were incorporated into the linear plasmid vector by T4 ligase and the product was transferred to E. coli competent cell TOP10. The positive strain was screened by ampicillin resistance, and PCR confirmation and DNA fragment sequencing were carried out.
- The recombinant plasmids with correct sequencing were obtained using a plasmid extraction kit (Invitrogen).
2.2. Mutant-Plasmid Generation
- Mutant proteins of PRC1 1-486 and PRC1-DD were generated using a QuickChange Mutagenesis kit (Agilent) with the following reaction system: 200 ng of forward primer, 200 ng of reverse primer (provided in Table S3), 1 L of 5 *reaction buffer, 10 L of 2. 5 mM dNTPs, 4 L of Pfu DNA polymerase and 1 L of Nuclease-free water, for a total of 50 L.
- We set the PCR reaction conditions according to the instructions of the Pfu DNA polymerase for 30 cycles.
- We added DPN1 restriction endonuclease to the reaction system and incubated it at 37° for 1 h.
- We tested the products by electrophoresis and selected the DNA band with the correct length and used a DNA gel Recovery Kit (Zymo Research) to obtain the target plasmid; then, we used 100 ng of the product for transformation into E. coli competent cell TOP10. Antibiotic agar plates for positive-strain selection were used.
- Single colonies were picked and sent for sequencing. The correct plasmids were used for mutant protein expression.
2.3. Protein Expression
- The recombinant plasmids encoding the PRC1 target proteins were transformed into E. coli competent cells (both BL21 (DE3) and Rosseta); the plates were coated with agar containing ampicillin and incubated at 37 C.
- Single colonies were selected and inoculated into 40 mL of Luria Bertani (LB) medium containing ampicillin, then incubated overnight at 35 C.
- We transferred the bacterial solution into 1 L of fresh LB medium containing ampicillin and cultured it at 35 C to OD 600; then, we added 0.05 g of IPTG to induce the expression of the target protein at 18 C for 6–20 h.
- After continuous culturing for 6 h, we centrifuged the bacterial solution at 7000 rpm for 15 min, poured out the supernatant and resuspended the bacteria with 30 mL of liquid buffer containing 50 mM Sodium Phosphate monobasic/dibasic and 300 mM NaCl, pH 8.0; then, we froze it at −80 C.
2.4. Protein Purification
- E. coli cells were harvested by centrifugation, resuspended in lysis buffer (50 mM Sodium Phosphate, 300 mM NaCl, 5% glycerol and 25 mM imidazole, pH 8.0), supplemented with protease inhibitor cocktail (Roche, Indianapolis, IN, USA) and then sonicated.
- After separation of supernatant and pellet by centrifugation, the supernatant was loaded onto a His-Trap HP column (Tiagen, Beijing, China). We pooled the His-tagged proteins by applying a linear imidazole gradient (20–300 mM).
- The proteins were then further purified by size-exclusion chromatography on a Superdex 75 or Superdex 200 column (GE Healthcare Life Sciences, Piscataway, NJ, USA) equilibrated at 50 mM Sodium phosphate and 150 mM NaCl, pH 7.0. Fractions corresponding to the target proteins, as confirmed by SDS-PAGE, were pooled, concentrated and stored at −80 C. The purity of all protein preparations was greater than 95% based on polyacrylamide gel electrophoresis in the presence of DTT.
2.5. Labeled-Protein Preparation
2.6. High-Performance Chromatography
2.7. Chemical Cross-Linking
2.8. NMR Sample Preparation
2.9. Resonance Assignments
2.10. Structure Calculations
2.11. Fluorescence-Based Thermal Shift Assay (FTSA)
2.12. Static Light Scattering and SEC-MALS
2.13. Statistical Analysis
3. Results
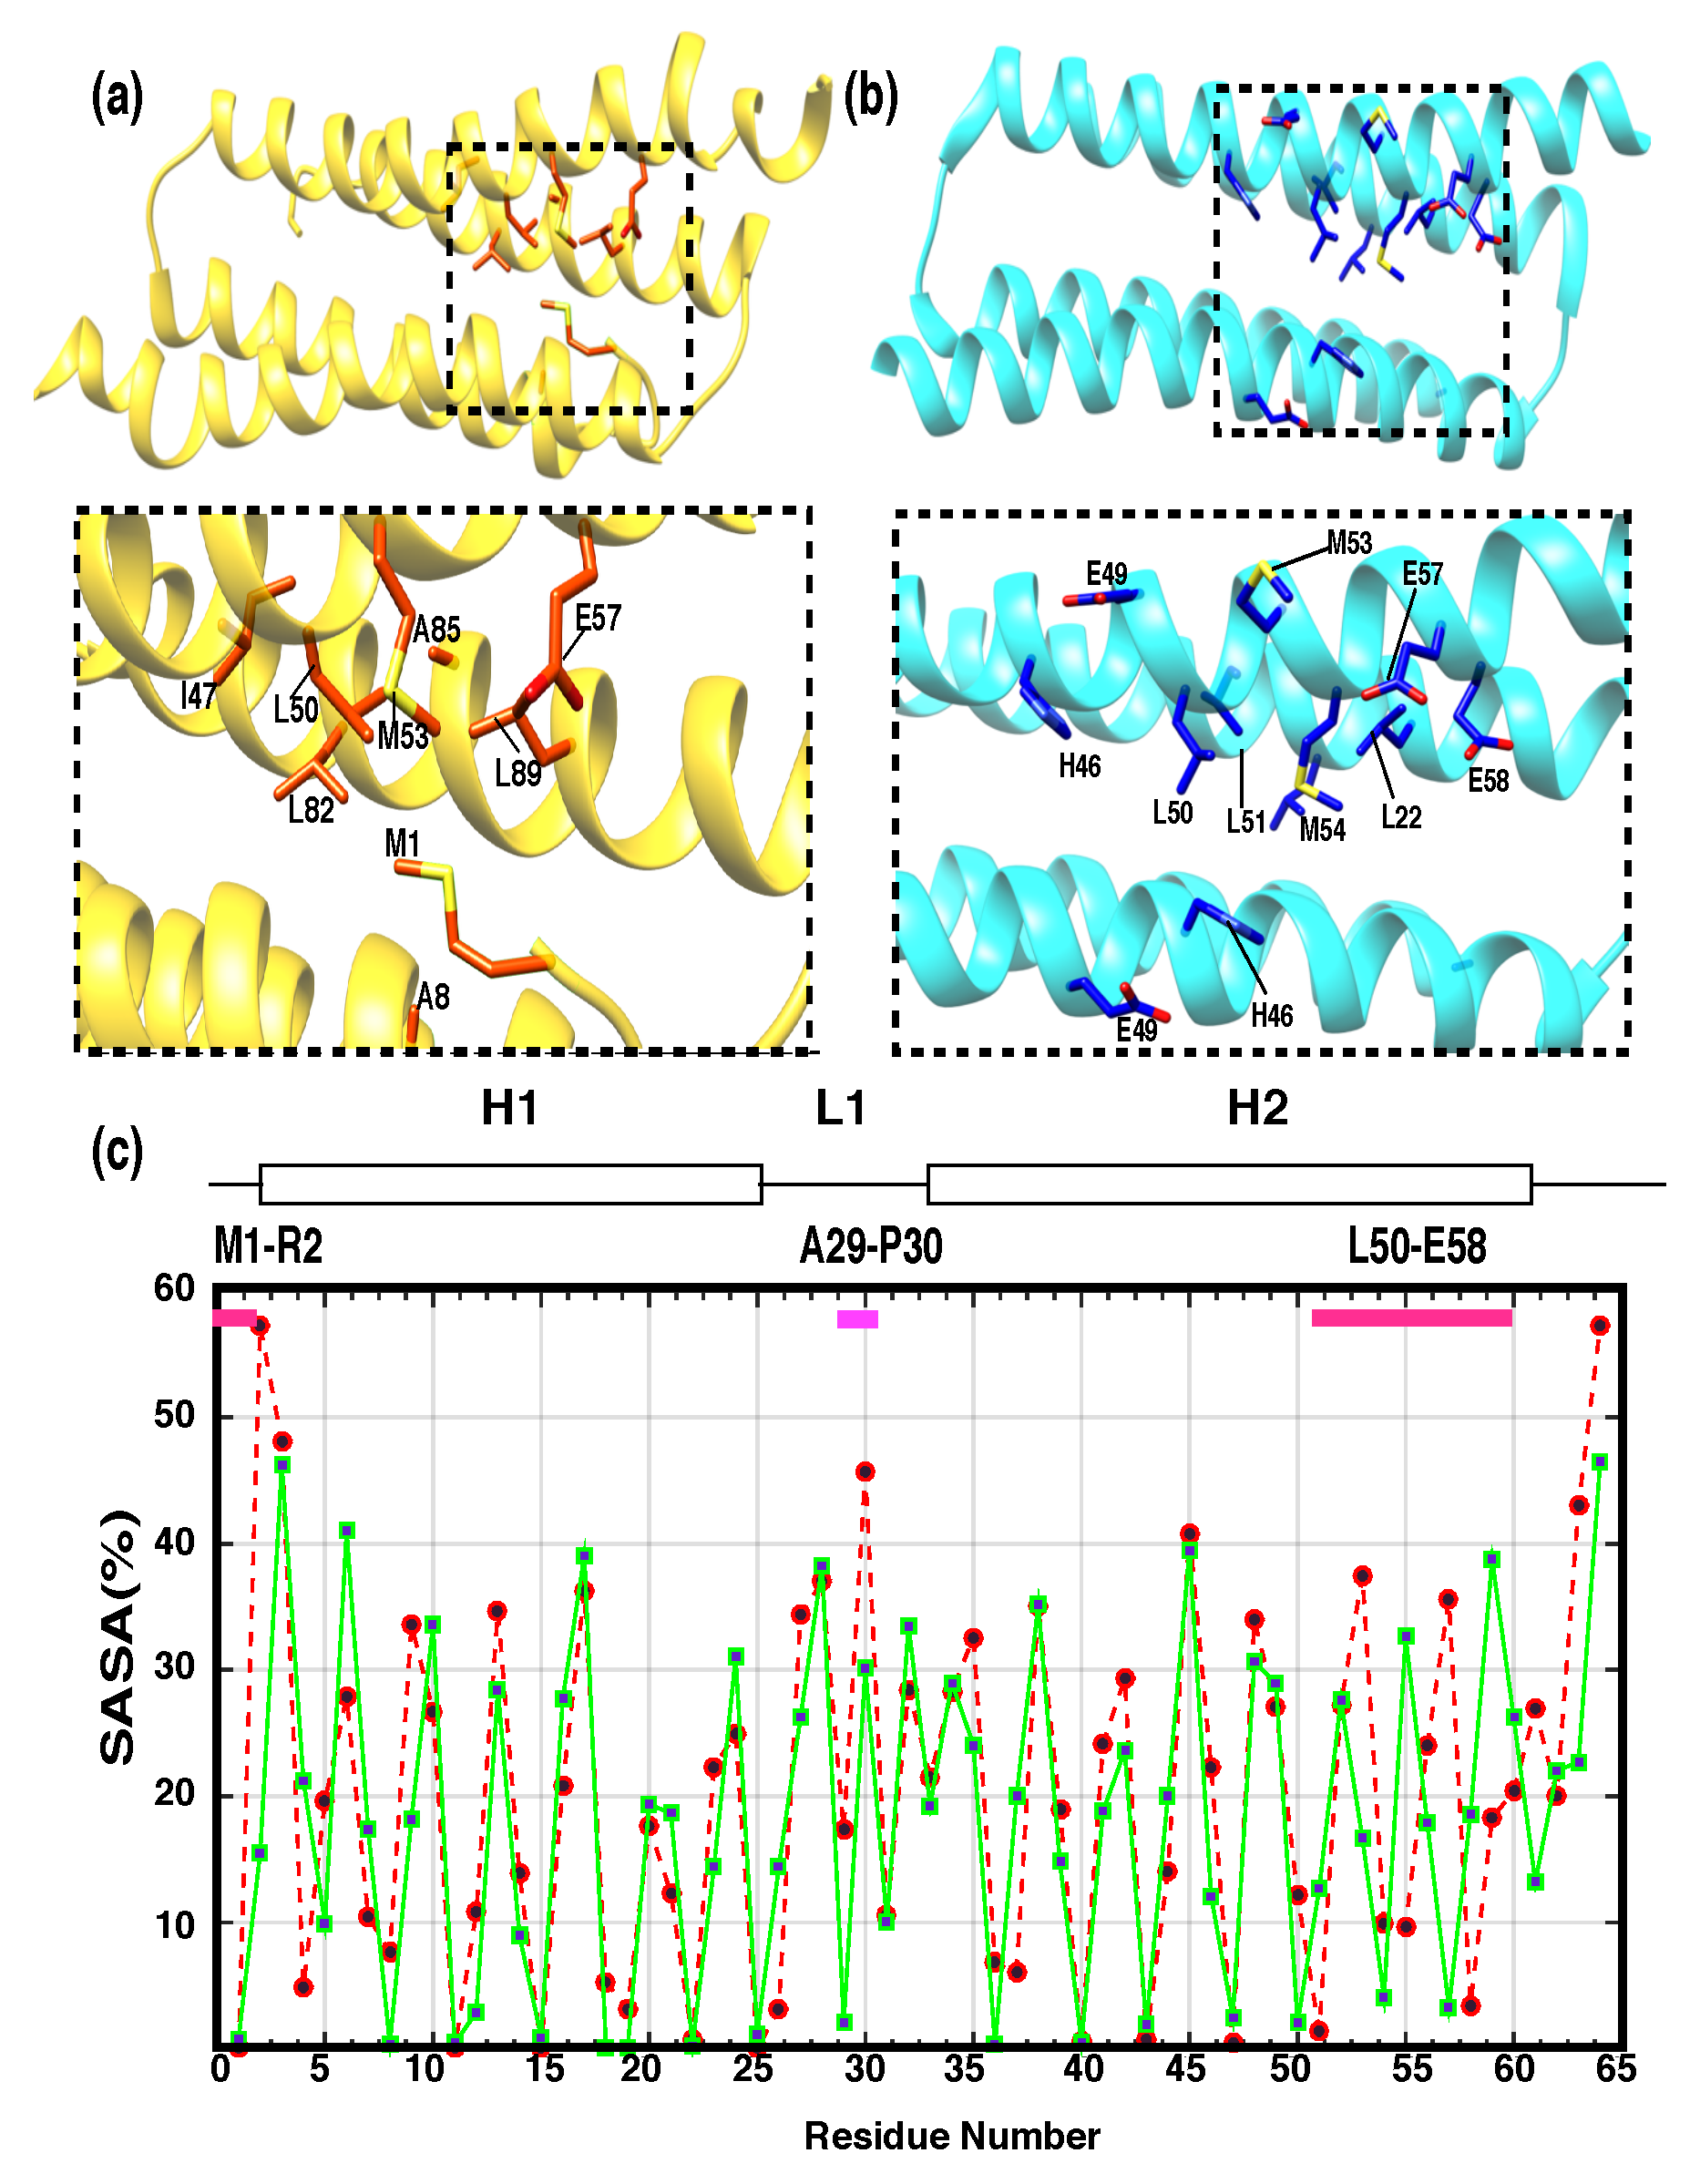
3.1. Three-Dimensional Structure of PRC1-DD
3.2. Comparison between Solution Structure and Crystal Structure
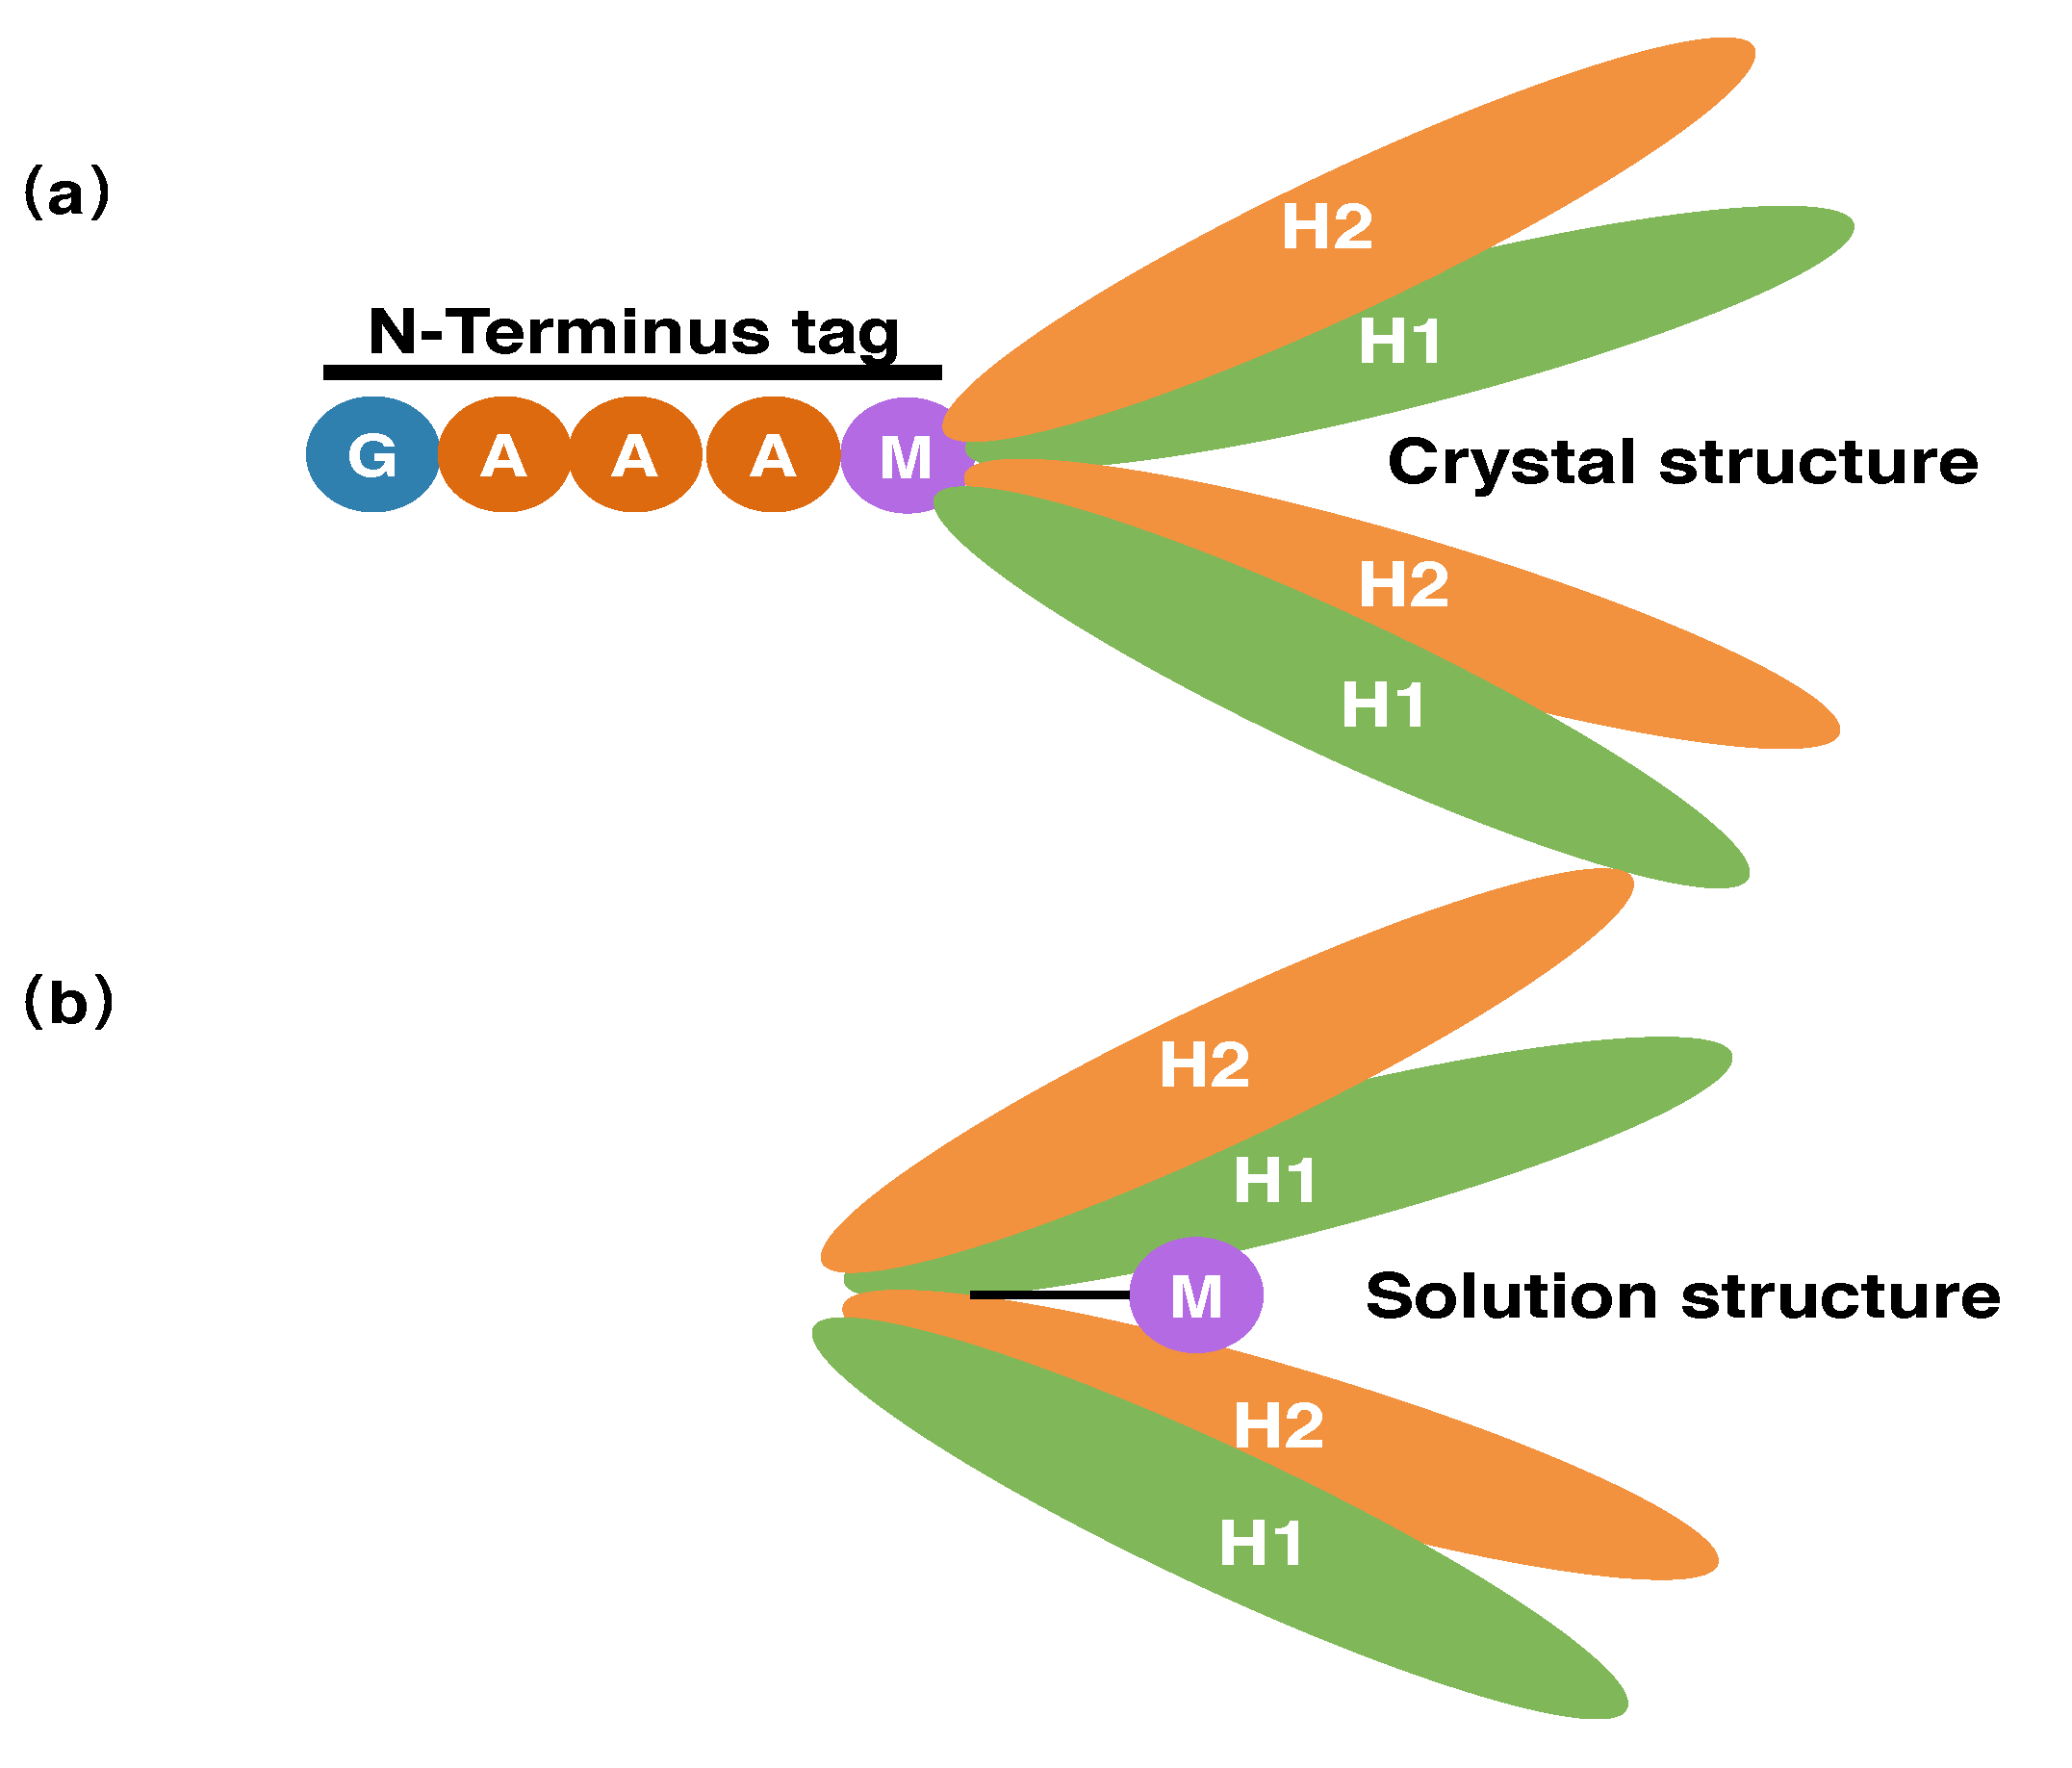
3.3. The N-Terminal Extension of PRC1 Crystal Structure
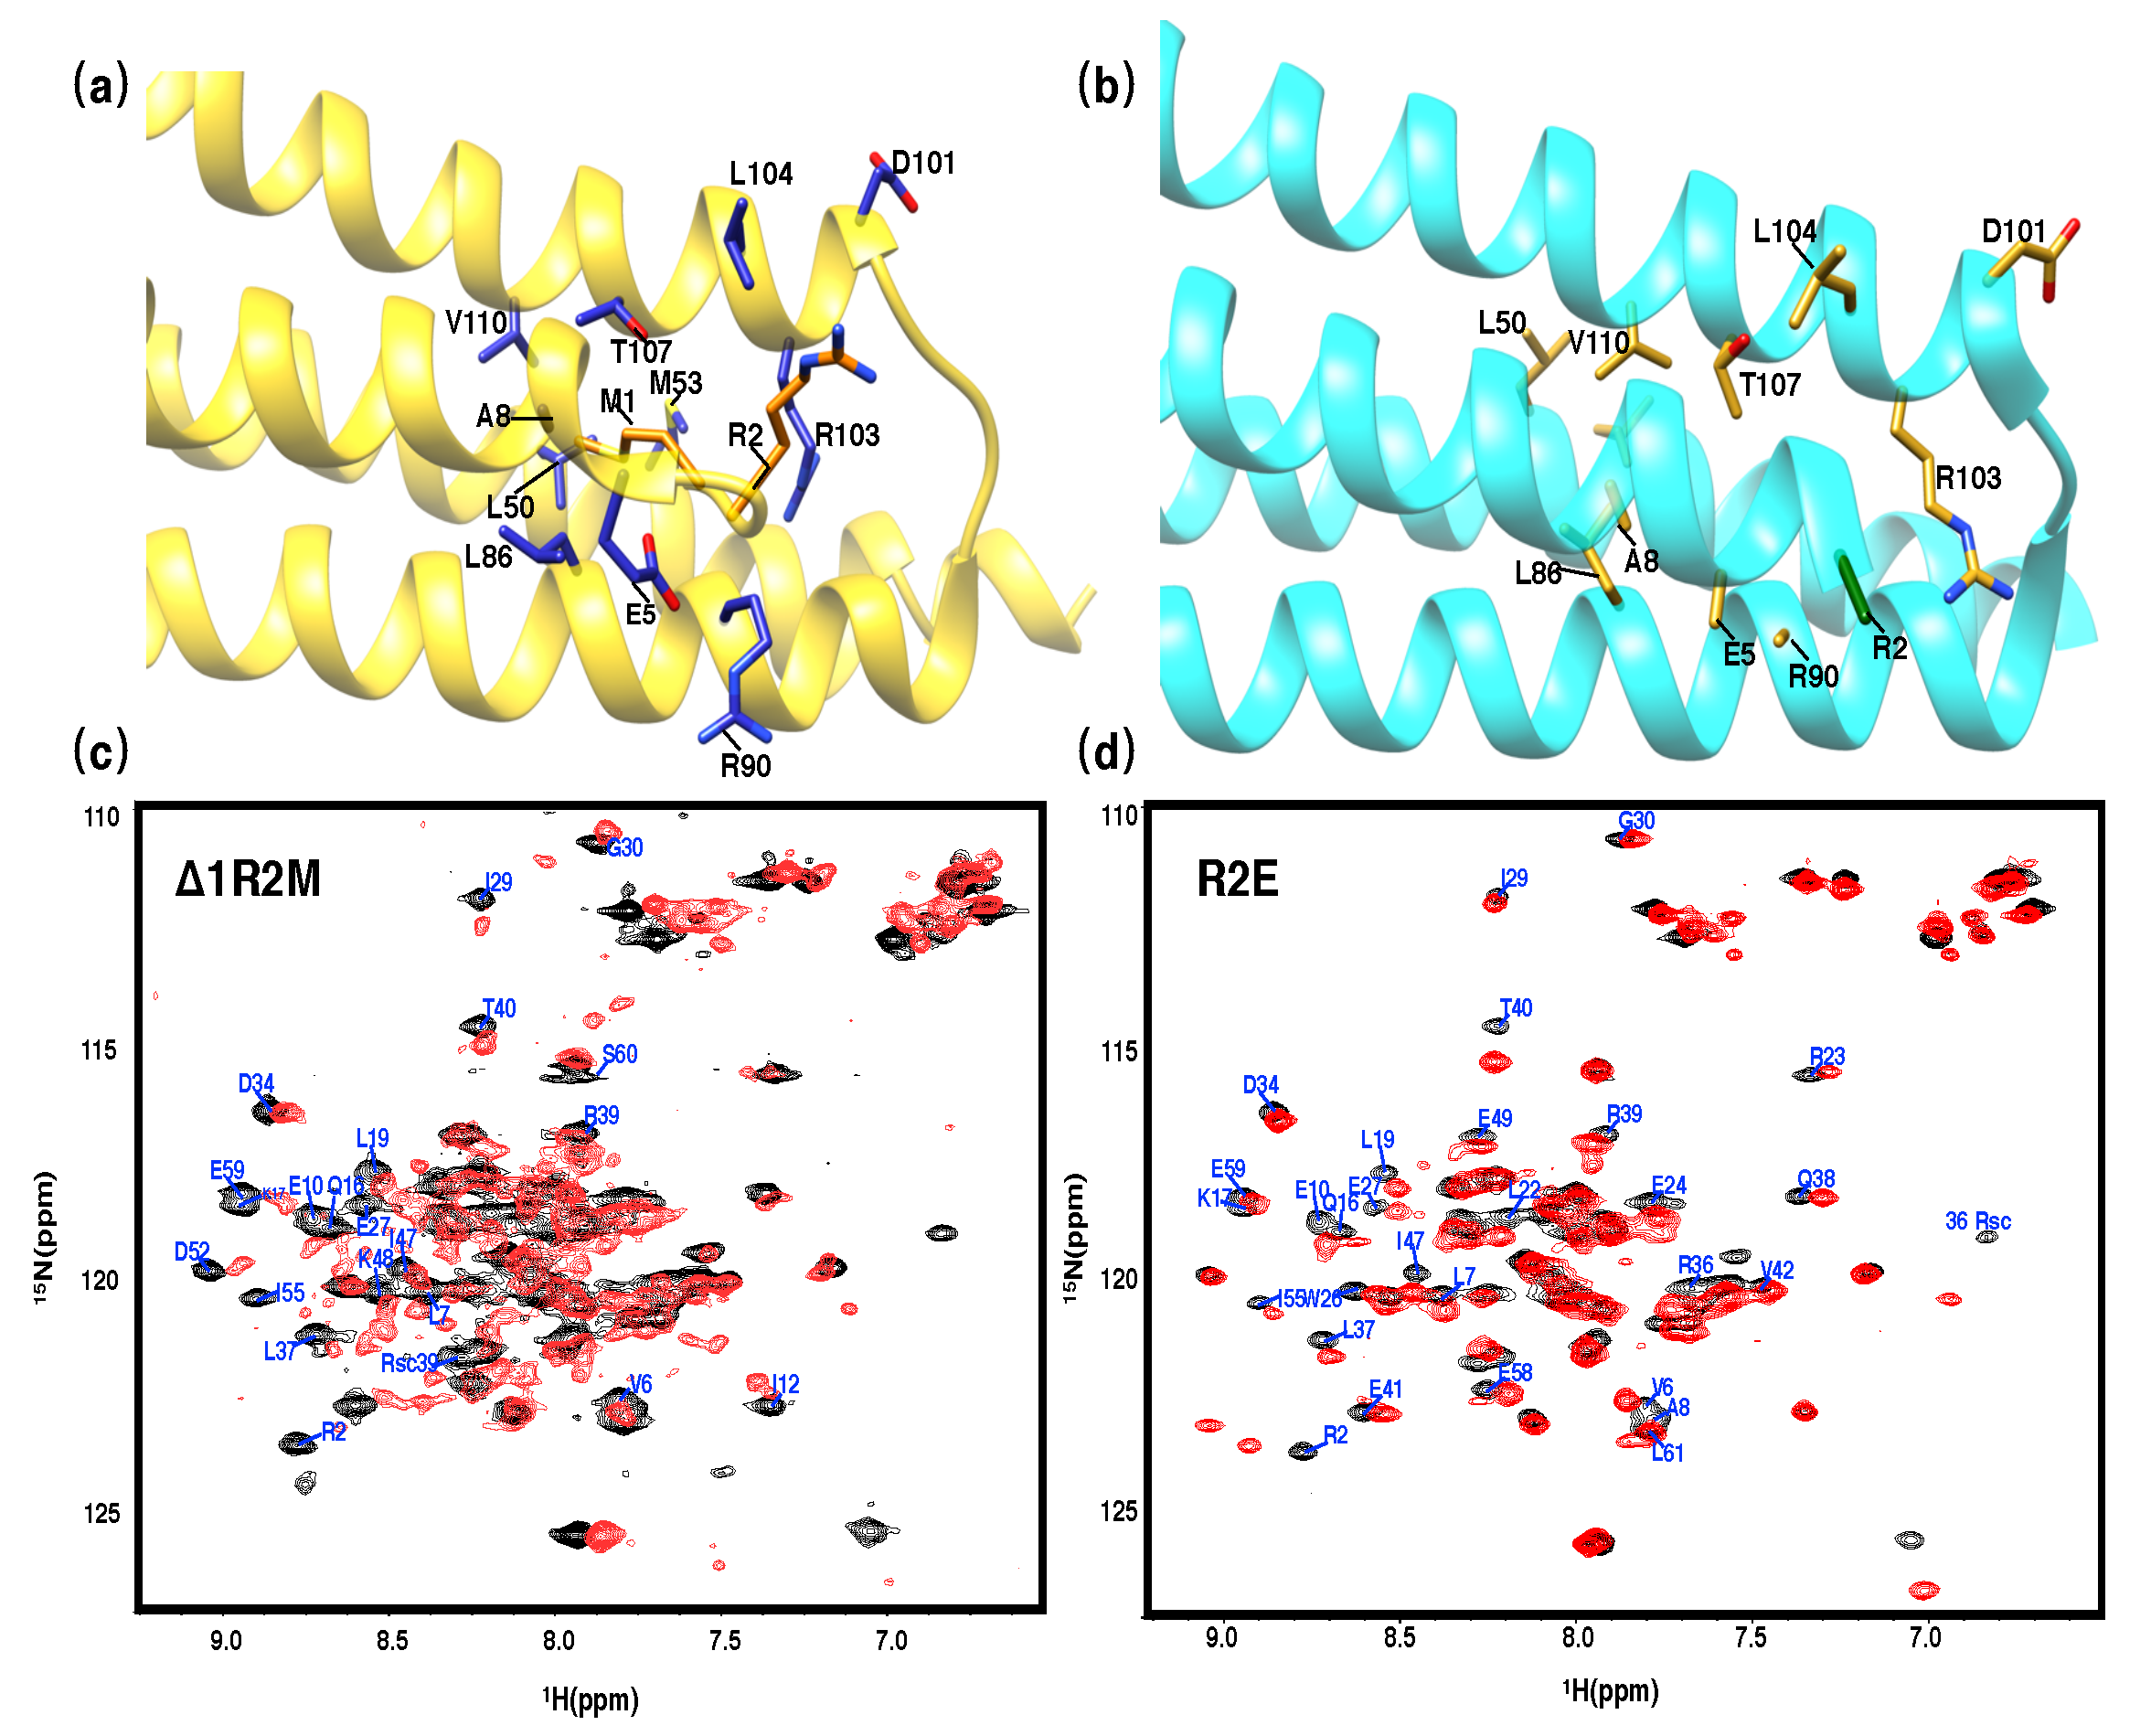
3.4. Structural and Thermodynamical Significance of N Terminus of PRC1-DD
3.5. Assessing N-Terminal Conformation of Full-Length PRC1
4. Discussion
5. Conclusions
Supplementary Materials
Author Contributions
Funding
Institutional Review Board Statement
Informed Consent Statement
Data Availability Statement
Acknowledgments
Conflicts of Interest
Abbreviations
| MAP | Microtubule-associated protein |
| PRC1-DD | 65 N-terminal residues of PRC1 |
| SASA | Solvent-accessible surface area |
| RMSD | Root-mean-square deviation |
| FTSA | Fluorescence thermal shift assay |
| EM | Electron microscopy |
| Tm | Mid-denaturation temperature |
| HDX | Hydrogen–deuterium exchange experiment |
| SI | Supplementary Information |
References
- Bechstedt, S.; Brouhard, G.J. Motors and MAPs collaborate to size up microtubules. Dev. Cell 2013, 26, 118–120. [Google Scholar] [CrossRef] [Green Version]
- She, Z.Y.; Wei, Y.L.; Lin, Y.; Li, Y.L.; Lu, M.H. Mechanisms of the Ase1/PRC1/MAP65 family in central spindle assembly. Biol. Rev. Camb. Philos. Soc. 2019, 94, 2033–2048. [Google Scholar] [CrossRef]
- Gaska, I.; Armstrong, M.E.; Alfieri, A.; Forth, S. The Mitotic Crosslinking Protein PRC1 Acts Like a Mechanical Dashpot to Resist Microtubule Sliding. Dev. Cell 2020, 54, 367–378.e5. [Google Scholar] [CrossRef]
- Jiang, W.; Gretchen, J.; Wells, J.; Hope, T.J.; Wahl, G.M.; Hunter, T.; Fukunaga, R. PRC1: A Human Mitotic Spindle–Associated CDK Substrate Protein Required for Cytokinesis. Mol. Cell 1998, 2, 877–885. [Google Scholar] [CrossRef]
- Vukusic, K.; Ponjavic, I.; Buda, R.; Risteski, P.; Tolic, I.M. Microtubule-sliding modules based on kinesins EG5 and PRC1-dependent KIF4A drive human spindle elongation. Dev. Cell 2021, 56, 1253–1267.e10. [Google Scholar] [CrossRef]
- Zhu, C.; Jiang, W. Cell cycle-dependent translocation of PRC1 on the spindle by Kif4 is essential for midzone formation and cytokinesis. Proc. Natl. Acad. Sci. USA 2005, 102, 343–348. [Google Scholar] [CrossRef] [Green Version]
- Li, X.H.; Ju, J.Q.; Pan, Z.N.; Wang, H.H.; Wan, X.; Pan, M.H.; Xu, Y.; Sun, M.H.; Sun, S.C. PRC1 is a critical regulator for anaphase spindle midzone assembly and cytokinesis in mouse oocyte meiosis. FEBS J. 2021, 288, 3055–3067. [Google Scholar] [CrossRef]
- Yoshida, S.; Nishiyama, S.; Lister, L.; Hashimoto, S.; Mishina, T.; Courtois, A.; Kyogoku, H.; Abe, T.; Shiraishi, A.; Choudhary, M.; et al. Prc1-rich kinetochores are required for error-free acentrosomal spindle bipolarization during meiosis I in mouse oocytes. Nat. Commun. 2020, 11, 2652. [Google Scholar] [CrossRef]
- Nishiyama, S.; Yoshida, S.; Kitajima, T.S. Cdk1 negatively regulates the spindle localization of Prc1 in mouse oocytes. Genes Cells 2020, 25, 685–694. [Google Scholar] [CrossRef]
- Kurasawa, Y.; Earnshaw, W.C.; Mochizuki, Y.; Dohmae, N.; Todokoro, K. Essential roles of KIF4 and its binding partner PRC1 in organized central spindle midzone formation. EMBO J. 2004, 23, 3237–3248. [Google Scholar] [CrossRef] [Green Version]
- Liang, Z.; Li, X.; Chen, J.; Cai, H.; Zhang, L.; Li, C.; Tong, J.; Hu, W. PRC1 promotes cell proliferation and cell cycle progression by regulating p21/p27-pRB family molecules and FAK-paxillin pathway in non-small cell lung cancer. Transl. Cancer Res. 2019, 8, 2059–2072. [Google Scholar] [CrossRef]
- Alfieri, A.; Gaska, I.; Forth, S. Two modes of PRC1-mediated mechanical resistance to kinesin-driven microtubule network disruption. Curr. Biol. 2021, 31, 2495–2506.e4. [Google Scholar] [CrossRef]
- Subramanian, R.; Ti, S.C.; Tan, L.; Darst, S.A.; Kapoor, T.M. Marking and measuring single microtubules by PRC1 and kinesin-4. Cell 2013, 154, 377–390. [Google Scholar] [CrossRef] [Green Version]
- Kellogg, E.H.; Howes, S.; Ti, S.C.; Ramirez-Aportela, E.; Kapoor, T.M.; Chacon, P.; Nogales, E. Near-atomic cryo-EM structure of PRC1 bound to the microtubule. Proc. Natl. Acad. Sci. USA 2016, 113, 9430–9439. [Google Scholar] [CrossRef] [Green Version]
- Subramanian, R.; Wilson-Kubalek, E.M.; Arthur, C.P.; Bick, M.J.; Campbell, E.A.; Darst, S.A.; Milligan, R.A.; Kapoor, T.M. Insights into antiparallel microtubule crosslinking by PRC1, a conserved nonmotor microtubule binding protein. Cell 2010, 142, 433–443. [Google Scholar] [CrossRef] [Green Version]
- Fu, C.; Ward, J.J.; Loiodice, I.; Velve-Casquillas, G.; Nedelec, F.J.; Tran, P.T. Phospho-regulated interaction between kinesin-6 Klp9p and microtubule bundler Ase1p promotes spindle elongation. Dev. Cell 2009, 17, 257–267. [Google Scholar] [CrossRef] [Green Version]
- Zhong, N.; Zhang, S.; Zou, P.; Chen, J.; Kang, X.; Li, Z.; Liang, C.; Jin, C.; Xia, B. Without Its N-Finger, the Main Protease of Severe Acute Respiratory Syndrome Coronavirus Can Form a Novel Dimer through Its C-Terminal Domain. J. Virol. 2008, 82, 4227–4234. [Google Scholar] [CrossRef] [Green Version]
- Xue, X.; Yang, H.; Shen, W.; Zhao, Q.; Li, J.; Yang, K.; Chen, C.; Jin, Y.; Bartlam, M.; Rao, Z. Production of authentic SARS-CoV M(pro) with enhanced activity: Application as a novel tag-cleavage endopeptidase for protein overproduction. J. Mol. Biol. 2007, 366, 965–975. [Google Scholar] [CrossRef]
- Bhardwaj, A.; Leelavathi, S.; Mazumdar-Leighton, S.; Ghosh, A.; Ramakumar, S.; Reddy, V.S. The critical role of partially exposed N-terminal valine residue in stabilizing GH10 xylanase from Bacillus sp.NG-27 under poly-extreme conditions. PLoS ONE 2008, 3, e3063. [Google Scholar] [CrossRef] [Green Version]
- Xue, H.; Zhou, J.; You, C.; Huang, Q.; Lu, H. Amino acid substitutions in the N-terminus, cord and alpha-helix domains improved the thermostability of a family 11 xylanase XynR8. J. Ind. Microbiol. Biotechnol. 2012, 39, 1279–1288. [Google Scholar] [CrossRef]
- Marshall, D.; Schneemann, A. Specific packaging of nodaviral RNA2 requires the N-terminus of the capsid protein. Virology 2001, 285, 165–175. [Google Scholar] [CrossRef] [PubMed]
- Mo, X.; Li, X.; Yin, B.; Deng, J.; Tian, K.; Yuan, A. Structural roles of PCV2 capsid protein N-terminus in PCV2 particle assembly and identification of PCV2 type-specific neutralizing epitope. PLoS Pathog. 2019, 15, e1007562. [Google Scholar] [CrossRef] [PubMed] [Green Version]
- Bartels, T.; Ahlstrom, L.S.; Leftin, A.; Kamp, F.; Haass, C.; Brown, M.F.; Beyer, K. The N-terminus of the intrinsically disordered protein alpha-synuclein triggers membrane binding and helix folding. Biophys. J. 2010, 99, 2116–2124. [Google Scholar] [CrossRef] [PubMed] [Green Version]
- Harshad, P. Protein Dynamics by NMR. Thesis. 2011, pp. 1–36. Available online: https://www.researchgate.net/project/Protein-Dynamics-by-NMR (accessed on 1 March 2022).
- Fleisher, R.C.; Michael, N.; Gonzalez, R.L., Jr. Mechanistic studies of non-canonical amino acid mutagenesis. Methods Enzym. 2021, 656, 375–428. [Google Scholar] [CrossRef]
- Branchini, B.R.; Fontaine, D.M.; Southworth, T.L.; Huta, B.P.; Racela, A.; Patel, K.D.; Gulick, A.M. Mutagenesis and Structural Studies Reveal the Basis for the Activity and Stability Properties That Distinguish the Photinus Luciferases scintillans and pyralis. Biochemistry 2019, 58, 4293–4303. [Google Scholar] [CrossRef] [PubMed]
- Kovalchuk, S.N.; Buinovskaya, N.S.; Likhatskaya, G.N.; Rasskazov, V.A.; Son, O.M.; Tekutyeva, L.A.; Balabanova, L.A. Mutagenesis Studies and Structure-function Relationships for GalNAc/Gal-Specific Lectin from the Sea Mussel Crenomytilus grayanus. Mar. Drugs 2018, 16, 471. [Google Scholar] [CrossRef] [PubMed] [Green Version]
- Castaneda-Garcia, A.; Martin-Blecua, I.; Cebrian-Sastre, E.; Chiner-Oms, A.; Torres-Puente, M.; Comas, I.; Blazquez, J. Specificity and mutagenesis bias of the mycobacterial alternative mismatch repair analyzed by mutation accumulation studies. Sci. Adv. 2020, 6, eaay4453. [Google Scholar] [CrossRef] [Green Version]
- Choi, K.A.; Yang, L.; Lee, K.M.; Yu, C.W.; Banfield, D.K.; Ito, K.; Uchiumi, T.; Wong, K.B. Structural and Mutagenesis Studies Evince the Role of the Extended Protuberant Domain of Ribosomal Protein uL10 in Protein Translation. Biochemistry 2019, 58, 3744–3754. [Google Scholar] [CrossRef]
- Poongavanam, V.; Corona, A.; Steinmann, C.; Scipione, L.; Grandi, N.; Pandolfi, F.; Di Santo, R.; Costi, R.; Esposito, F.; Tramontano, E.; et al. Structure-guided approach identifies a novel class of HIV-1 ribonuclease H inhibitors: Binding mode insights through magnesium complexation and site-directed mutagenesis studies. Medchemcomm 2018, 9, 562–575. [Google Scholar] [CrossRef] [Green Version]
- Marley, J.; Lu, M.; Bracken, C. A method for efficient isotopic labeling of recombinant proteins. J. Biomol. NMR 2001, 20, 71–75. [Google Scholar] [CrossRef]
- Giepmans, B.N.; Adams, S.R.; Ellisman, M.H.; Tsien, R.Y. The fluorescent toolbox for assessing protein location and function. Science 2006, 312, 217–224. [Google Scholar] [CrossRef] [PubMed] [Green Version]
- Delaglio, F.; Grzesiek, S.; Vuister, G.W.; Zhu, G.; Pfeifer, J.; Bax, A. NMRPipe: A multidimensional spectral processing system based on UNIX pipes. J. Biomol. NMR 1995, 6, 277–293. [Google Scholar] [CrossRef] [PubMed]
- Norris, M.; Fetler, B.; Marchant, J.; Johnson, B.A. NMRFx Processor: A cross-platform NMR data processing program. J. Biomol. NMR 2016, 65, 205–216. [Google Scholar] [CrossRef] [PubMed] [Green Version]
- Bax, A.D.; Clore, G.M..; Driscoll, P.C.; Gronenborn, A.M.; Ikura, M.; Kay, L.E. PracticalAspectsofProton-Carbon-Carbon-Proton Three- DimensionalCorrelation Spectroscopyof 13C-LabeledProteins. J. Magn. Reson. 1990, 87, 620–627. [Google Scholar]
- Kay, L.E. Pulsed-field gradient-enhanced three-dimensional NMR experiment for correlating 13C.alpha./.beta., 13C’, and 1H.alpha. chemical shifts in uniformly carbon-13-labeled proteins dissolved in water. J. Am. Chem. Soc. 1993, 115, 2055–2057. [Google Scholar] [CrossRef]
- Bax, A.; Ikura, M. An efficient 3D NMR technique for correlating the proton and 15N backbone amide resonances with the alpha-carbon of the preceding residue in uniformly 15N/13C enriched proteins. J. Biomol. NMR 1991, 1, 99–104. [Google Scholar] [CrossRef]
- Lewis, E.K.; Mitsuhiko, I.; Ad, B. Proton-Proton Correlation via Carbon-Carbon Couplings- AThree-DimensionalNMRApproachfor the Assignment of Aliphatic Resonances in Proteins Labeled with Carbon-13. J. Am. Chem. Soc. 1990, 112, 72. [Google Scholar]
- Bax, A.; Clore, G.; Gronenborn, A.M. H-H correlation via isotropic mixing of 13C magnetization, a new three-dimensional approach for assigning 1H and 13C spectra of 13C-enriched proteins. J. Magn. Reson. 1990, 88, 425–431. [Google Scholar] [CrossRef]
- Olejniczak, T.E.; Xu, X.R.; Fesik, W.S. A 4D HCCH-TOCSY experiment for assigning the side chain 1H and 13C resonances of proteins. J. Biomol. NMR 1992, 2, 655–659. [Google Scholar] [CrossRef]
- Grzesiekt, S.; Bax, A. Correlating Backbone Amide and Side Chain Resonances in Larger Proteins by Multiple Relayed Triple Resonance NMR. J. Am. Chem. Soc. 1992, 114, 4659–4667. [Google Scholar]
- Marion, D.; Driscoll, P.C.; Wingfield, P.T.; Bax, A.; Gronenborn, A.M.; Clore, G.M. Overcoming the Overlap Problem in the Assignment of ’H NMR Spectra of Larger Proteins by Use of Three-Dimensional Heteronuclear lH-15N Hartmann-Hahn-Multiple Quantum Coherence and Nuclear Overhauser-Multiple Quantum Coherence Spectroscopy. Biochemistry 1989, 28, 6150–6156. [Google Scholar]
- Dominique, M.; Lewis, E.K.; Steven, W.S.; Dennis A, T.; Ad, B. Three-DimensionalHeteronuclear NMR of 15N-Labeled Proteins. J. Am. Chem. Soc. 1989, 111, 1515–1517. [Google Scholar]
- Zuiderweg, E.R.; Fesik, S.W. Heteronuclear three-dimensional NMR spectroscopy of the inflammatory protein C5a. Biochemistry 1989, 28, 2387–2391. [Google Scholar] [CrossRef] [PubMed]
- Herrmann, T.; Guntert, P.; Wuthrich, K. Protein NMR Structure Determination with Automated NOE Assignment Using the New Software CANDID and the Torsion Angle Dynamics Algorithm DYANA. J. Mol. Biol. 2002, 319, 209–227. [Google Scholar] [CrossRef] [Green Version]
- Case, D.A.; Aktulga, H.M.; Belfon, K.; Ben-Shalom, I.Y.; Brozell, S.R.; Cerutti, D.S.; Cheatham, T.E., III; Cisneros, G.A.; Cruzeiro, V.W.D. Amber. Available online: https://ambermd.org/CiteAmber.php (accessed on 1 March 2022).
- Cornilescu, G.; Delaglio, F.; Bax, A. Protein backbone angle restraints from searching a database for chemical shift and sequence homology. J. Biomol. NMR 1999, 13, 289–302. [Google Scholar] [CrossRef] [PubMed]
- Brendan M, D.; Glen B, L.; Jane, D.; Peter E, W. Structure Assisted NOE Evaluation)- An automated model-based approach for NOE assignment. J. Biomol. NMR 2001, 19, 321–329. [Google Scholar]
- Laskowski, R.A.; Rullmannn, J.A.; MacArthur, M.W.; Kaptein, R.; Thornton, J.M. AQUA and PROCHECK-NMR: Programs for checking the quality of protein structures solved by NMR. J. Biomol. NMR 1996, 8, 477–486. [Google Scholar] [CrossRef]
- Laskowski, R.A.; MacArthur, M.W.; Moss, D.S.; Thornton, J.M. PROCHECK: A program to check the stereochemical quality of protein structures. J. Appl. Crystallogr. 1993, 26, 283–291. [Google Scholar] [CrossRef]
- Krishna, S.N.; Luan, C.H.; Mishra, R.K.; Xu, L.; Scheidt, K.A.; Anderson, W.F.; Bergan, R.C. A fluorescence-based thermal shift assay identifies inhibitors of mitogen activated protein kinase kinase 4. PLoS ONE 2013, 8, e81504. [Google Scholar] [CrossRef]
- Nishiya, Y.; Nakano, S. Screening of enzyme stabilizers using thermal shift assays on the basis of structural informations. Int. J. Anal. Bio-Sci. 2014, 2, 58–63. [Google Scholar]
- Bai, Y.; Milne, J.S.; Mayne, L.; Englander, S.W. Protein stability parameters measured by hydrogen exchange. Proteins 1994, 20, 4–14. [Google Scholar] [CrossRef]
- Huyghues-Despointes, B.M.; Pace, C.N.; Englander, S.W.; Scholtz, J.M. Measuring the conformational stability of a protein by hydrogen exchange. Methods Mol. Biol. 2001, 168, 69–92. [Google Scholar] [CrossRef] [PubMed] [Green Version]
- Butterwick, J.A.; MacKinnon, R. Solution structure and phospholipid interactions of the isolated voltage-sensor domain from KvAP. J. Mol. Biol. 2010, 403, 591–606. [Google Scholar] [CrossRef] [PubMed] [Green Version]
- Nowakowski, M.; Jaremko, L.; Jaremko, M.; Zhukov, I.; Belczyk, A.; Bierzynski, A.; Ejchart, A. Solution NMR structure and dynamics of human apo-S100A1 protein. J. Struct. Biol. 2011, 174, 391–399. [Google Scholar] [CrossRef] [PubMed]
- Barthe, P.; Chiche, L.; D’eclerck, N.; D’elsuc, M.A. Refined solution structure and backbone dynamics of 15N-labeled C12A-p8MTCP1 studied by NMR relaxation. J. Biomol. NMR 1999, 15, 271–288. [Google Scholar] [CrossRef]
- Xu, Y.; Zheng, Y.; Fan, J.S.; Yang, D. A new strategy for structure determination of large proteins in solution without deuteration. Nat. Methods 2006, 3, 931–937. [Google Scholar] [CrossRef]
- Billeter, M.; Vendrell, J.; Wider, G.; Aviles, F.X.; Coll, M.; Guasch, A.; Huber, R.; Wuthrich, K. Comparison of the NMR solution structure with the X-ray crystal structure of the activation domain from procarboxypeptidase B. J. Biomol. NMR 1992, 2, 1–10. [Google Scholar] [CrossRef] [PubMed]
- Shen, B.W.; Spiegel, P.C.; Chang, C.H.; Huh, J.W.; Lee, J.S.; Kim, J.; Kim, Y.H.; Stoddard, B.L. The tertiary structure and domain organization of coagulation factor VIII. Blood 2008, 111, 1240–1247. [Google Scholar] [CrossRef]
- Pulavarti, S.V.; Jain, A.; Pathak, P.P.; Mahmood, A.; Arora, A. Solution structure and dynamics of peptidyl-tRNA hydrolase from Mycobacterium tuberculosis H37Rv. J. Mol. Biol. 2008, 378, 165–177. [Google Scholar] [CrossRef]


| NMR Restraints | |
|---|---|
| Distance Restraints (NOE) | |
| Intraresidue (i = j) | 674 |
| Medium range (|i − j| < 5) | 880 |
| Long range (|i − j| > 5) | 646 |
| Ambiguous | 1517 |
| Strictly intermolecular | 120 |
| Total | 3837 |
| Dihedral restraints (TALOS) | |
| 128 | |
| 128 | |
| Total | 256 |
| Structure Statistics | |
| Ensemble RMSD | |
| Backbone heavy atoms (Å) | 0.37 |
| All heavy atoms | 0.55 |
| All atoms (Å) | 0.98 |
| NOE Violations | |
| 0.3 Å | 0 |
| 0.2 Å | 5 |
| AMBER Energy | |
| Mean AMBER energy | −5060 |
| Ramachandran1 | |
| Most favorable (%) | 92.4 |
| Additionally (%) | 7.1 |
| Generously Allowed (%) | 0.5 |
| Disallowed (%) | 0 |
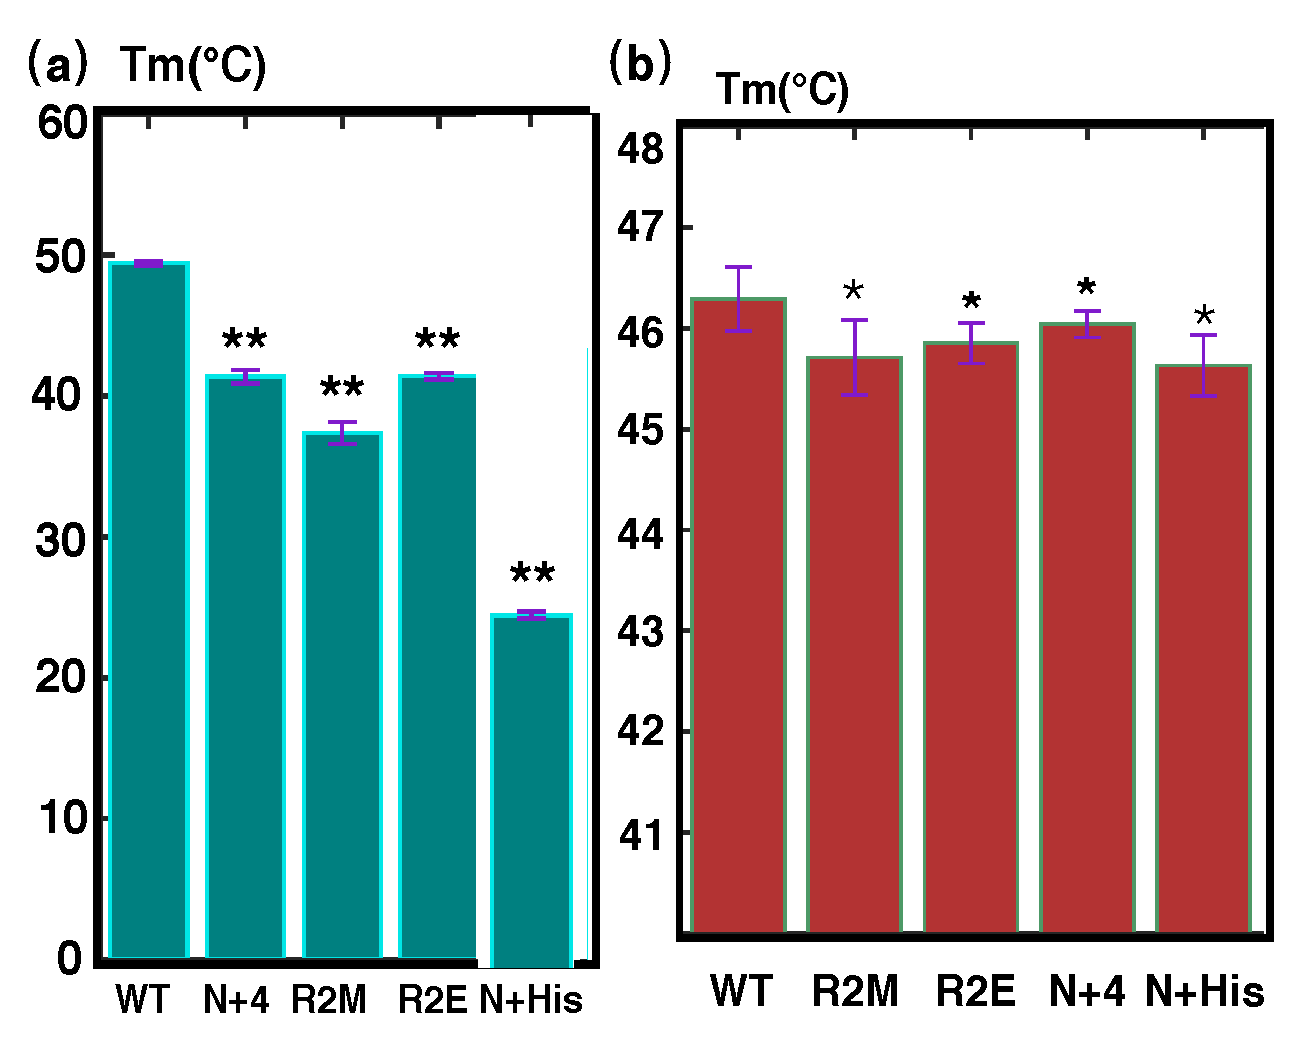
| Construct | Tm (1) | Tm (2) | Tm (3) | Tm (4) | Average Tm | Stdev |
|---|---|---|---|---|---|---|
| 1_64 WT | 49.42 | 49.23 | 49.48 | 49.62 | 49.44 | 0.16 |
| 1_64 N+4 | 41.20 | 41.60 | 40.80 | 41.90 | 41.38 | 0.48 |
| 1_64 1R2M | 36.36 | 37.14 | 37.81 | 38.13 | 37.36 | 0.78 |
| 1_64 N+His | <25 | <25 | <25 | <25 | <25 | 0.00 |
| 1_64 R2E | 41.20 | 41.60 | 41.20 | 41.60 | 41.40 | 0.23 |
| Construct | Tm (1) | Tm (2) | Tm (3) | Tm (4) | Average Tm | Stdev |
|---|---|---|---|---|---|---|
| 1_486 WT | 46.29 | 46.51 | 46.75 | 47.03 | 46.65 | 0.32 |
| 1_486 1R2M | 45.71 | 44.95 | 45.07 | 44.91 | 45.16 | 0.37 |
| 1_486 R2E | 44.96 | 45.46 | 45.46 | 45.69 | 45.39 | 0.31 |
| 1_486 N+4 | 46.04 | 45.82 | 46.12 | 45.92 | 45.98 | 0.13 |
| 1_486 N-His | 45.63 | 45.96 | 45.42 | 45.26 | 45.57 | 0.30 |
Publisher’s Note: MDPI stays neutral with regard to jurisdictional claims in published maps and institutional affiliations. |
© 2022 by the authors. Licensee MDPI, Basel, Switzerland. This article is an open access article distributed under the terms and conditions of the Creative Commons Attribution (CC BY) license (https://creativecommons.org/licenses/by/4.0/).
Share and Cite
Tan, F.; Xu, J. N-Terminus-Mediated Solution Structure of Dimerization Domain of PRC1. Curr. Issues Mol. Biol. 2022, 44, 1626-1645. https://doi.org/10.3390/cimb44040111
Tan F, Xu J. N-Terminus-Mediated Solution Structure of Dimerization Domain of PRC1. Current Issues in Molecular Biology. 2022; 44(4):1626-1645. https://doi.org/10.3390/cimb44040111
Chicago/Turabian StyleTan, Fei, and Jin Xu. 2022. "N-Terminus-Mediated Solution Structure of Dimerization Domain of PRC1" Current Issues in Molecular Biology 44, no. 4: 1626-1645. https://doi.org/10.3390/cimb44040111