Article

EST-SSR Markers’ Development Based on RNA-Sequencing and Their Application in Population Genetic Structure and Diversity Analysis of Eleusine indica in China

1
State Key Laboratory for Biology of Plant Diseases and Insect Pests, Institute of Plant Protection, Chinese Academy of Agricultural Sciences, Beijing 100193, China
2
Environment and Plant Protection Institute, Chinese Academy of Tropical Agricultural Sciences, Haikou 571101, China
3
Institute of Cotton Research, Chinese Academy of Agricultural Sciences, Anyang 455000, China
*
Authors to whom correspondence should be addressed.
Curr. Issues Mol. Biol. 2023, 45(1), 141-150; https://doi.org/10.3390/cimb45010011
Submission received: 11 November 2022 / Revised: 8 December 2022 / Accepted: 22 December 2022 / Published: 26 December 2022
(This article belongs to the Section Molecular Plant Sciences)

Abstract

:
Goosegrass (Eleusine indica) is one of the worst agricultural weeds in China. Molecular markers were developed for genetic diversity and population structure analyses. In this study, we identified 8391 expressed sequence tag-simple sequence repeat (EST-SSR) markers from the de novo assembled unigenes of E. indica. Mononucleotides were the most abundant type of repeats (3591, 42.79%), followed by trinucleotides (3162, 37.68%). The most dominant mononucleotide and trinucleotide repeat motifs were A/T (3406, 40.59%) and AAT/ATT (103, 1.5%), respectively. Fourteen pairs of EST-SSR primers were verified and used to analyze the genetic diversity and population structure of 59 goosegrass populations. A total of 49 alleles were amplified, with the number of alleles (Na) ranging from two to eleven per locus, and the effective number of alleles (Ne) ranged from 1.07 to 4.53. The average polymorphic information content (PIC) was 0.36. Genetic structure analysis (K = 2) and principal coordinate analysis divided 59 E. indica populations into two groups in a manner similar to the unweighted pair-group method (Dice genetic similarity coefficient = 0.700). This study developed a set of EST-SSR markers in E. indica and successfully analyzed the diversity and population genetic structures of 59 E. indica populations in China.

1. Introduction

Goosegrass (Eleusine indica), an annual weedy grass, is widely distributed in tropical and subtropical regions and has been reported to affect 46 crops which compete for nutrients, water, and light in 60 countries. This troublesome C4, self-fertilization weed has a 5–20 cm tall tufted stem, 2–3 columns of compound spike, and an ability to produce up to 140,000 seeds per plant [1]. Seedling emergence of goosegrass can reach up to 95% and germination was tolerant of abiotic stress such as salinity (up to 50 mM NaCl), temperature (up to 100 °C), and pH (5 to 10) [2]. These traits make it a strong competitor in infested areas which can lead to yield reductions of 20–50% for crops [3]. Moreover, this weed has recently been documented to occur in dry-seeded rice fields in 20 countries and in wet-seeded rice fields in another two countries [4]. Considering the ability of goosegrass to grow in such varied environments, there is a need for a better understanding of the genetic diversity of the various ecotypes to design effective practical tools and methods for goosegrass management.
Genetic diversity and population structure analyses have been used to assess potential evolutionary adaptations to changing environmental conditions in weeds [5]. They are important methods used to design long-term management strategies for weed infestations. Simple sequence repeats (SSRs) are widely used molecular markers for genetic diversity studies because they are co-dominant, highly polymorphic, reproducible, and highly accessible [6]. SSR markers are also employed to assess cultivar identification, DNA fingerprints, quantitative trait locus (QTL) mapping, and molecular-assisted selection (MAS), as they are cost-effective [7]. Transcriptome sequencing is an economical method and provides good resources for research related to gene expression, single nucleotide polymorphisms (SNPs), and SSRs [8].
Twenty-three SSR markers and twenty-four morphological traits were selected, and the phylogenetic relationships between 77 Echinochloa populations were successfully classified [9]. Likewise, 12 SSR markers were used to assess the genetic variation in 46 Commelina communis populations [10]. The development of de novo transcriptome sequencing technology was followed by the development of expressed sequence tag (EST)-SSR, which originates from the coding segment of DNA and provides new methods for analyzing population genetic structure and diversity [11]. Through RNA-seq technology, EST-SSRs have been utilized and developed in a variety of plant species, such as Pinus koraiensis, Curcuma alismatifolia, and Crataegus pinnatifida [12,13,14].
In China, goosegrass is widely distributed in orchards and vegetable gardens and among some general field crops such as corn (Zea mays L.), soybeans (Glycine max (L.) Merr.), and cotton (Gossypium hirsutum L.) [15,16]. The chemical control was the main strategy for goosegrass management, such as ACCase inhibitors, EPSPS inhibitors, and GS inhibitors [17]. However, the intense use of herbicide to control goosegrass results in the evolved resistance of the population [18]. The excessive use of synthetic herbicide for goosegrass control also leads to the problem of damaging soil microecology and environmental pollution [19]. The flexible growing potential of goosegrass makes it essential for us to gain a better understanding of the genetic diversity of various ecotypes. This study is part of an effort to (1) explore the EST-SSR markers for goosegrass based on published data obtained from RNA-seq in our previous study, (2) screen SSR markers with high polymorphism for goosegrass, and (3) analyze the genetic diversity of 59 goosegrass populations collected from 10 provinces in China using EST-SSRs. Moreover, our results indicate that the genetic diversity of goosegrass populations in these 10 provinces is relatively lower, and that next-generation sequencing techniques are powerful tools for SSR development and genetic analysis.

2. Materials and Methods

2.1. Transcriptome Data of E. indica

The transcriptome data on E. indica used in this study were obtained from our previous study, in which they were used to analyze differentially expressed genes [20]. Clean transcriptome data for E. indica have been uploaded to the Sequence Read Archive (SRA) public database (No. PRJNA323986).

2.2. Plant Culture and DNA Extraction

Seeds of 59 different goosegrass populations were collected from 10 provinces in China, and at least 50 individuals were selected and mixed thoroughly for each population (Figure 1, Table S1). To break dormancy, the seeds of different populations were soaked in a gibberellin solution (1000 mg·L−1) for 24 h and then sown in plastic pots (7.0 cm in diameter) that were filled with sand and soil (3:1 [v/v]), with no other seeds present. The plants were cultured in greenhouses under (20 ± 3) °C/(15 ± 3) °C day/night conditions until they reached the three-leaf stage. The seedlings were then collected, snap-frozen in liquid nitrogen, and stored at −80 °C [21]. Genomic DNA was extracted from ten individuals for each population using the Plant Genomic DNA Kit (TIANGEN Biotech (Beijing) Co., Ltd., Beijing, China), following the manufacturer instructions. The integrity and concentration of the DNA were determined using 1% agarose 1× Tris-Acetate-EDTA (TAE) gels stained with ethidium bromide [22]. The qualified total DNA obtained from each sample was diluted to the desired working concentration (25 ng μL−1) and stored at −20 °C until use.

2.3. EST-SSR Locus Screening and Primer Design

The Perl script MIcroSAtellite identification tool (MISA, http://pgrc.ipk-gatersleben.de/misa/misa.html (accessed on 10 February 2022)) was utilized to detect potential SSRs in assembled unigenes from E. indica [23]. Similar to other studies, the identification standards for the SSR motif contained minimum repeats of ten mononucleotides, six dinucleotides, and five tri-, tetra-, penta-, and hexanucleotide motif repeats [12]. Different primer pairs for each SSR locus were designed using Primer3 software (http://primer3.sourceforge.net/releases.php (accessed on 10 February 2022)) [24]. At least three primer pairs were selected for each SSR locus using the following criteria: primer length ranging from 18 bp to 22 bp (20 bp was the optimum length), melting temperature (Tm) between 55 °C and 65 °C (60 °C was the optimum annealing temperature), and PCR product size between 100 and 500 bp.

2.4. Primer Selection and Validation

To select high-quality primer pairs, they were designed from sequences containing tri-, tetra-, and penta-motif repeats. The sizes of the primers ranged from 19 to 21 bp, with similar guanine–cytosine contents (40–60%) and identical annealing temperatures (60 °C). PCR was performed using the designed primer pairs in a total volume of 20 μL, which included 1 μL of template DNA, 10 μL 2 × Taq PCR MasterMix (with green dye) (TIANGEN Biotech (Beijing) Co., Ltd., Beijing, China), 1 μL of primer (10 μM per type), and 7 μL double-distilled water [12]. The PCR amplification conditions included an initialization step at 94 °C that lasted for 3 min, followed by 30 cycles of heating to 94 °C for 30 s. Then, the reaction was heated to 60 °C for 30 s and then to 72 °C for 20 s. A final extension occurred over the course of 10 min at 72 °C. The products for all the primers were examined on a 2% agarose gel, and primers that displayed obvious bands of expected sizes were selected for subsequent analysis.

2.5. PCR Amplification and Capillary Electrophoresis

After all the selected primers were designed, an M13 tail was added to the 5′ end of forward primers. The M13 universal primer randomly labeled with different fluorescent dyes (TAMRA [yellow], HEX [green], ROX [red], and FAM [blue]) was added for multiplexed PCR, which was conducted in a 20 μL reaction [14]. This included 10 μL 2 × Taq PCR MasterMix (TIANGEN Biotech (Beijing) Co., Ltd., Beijing, China), 2 μL template DNA, 0.2 μL M13-tailed forward primer, 0.2 μL of reverse primer, 0.4 μL of fluorescently labeled M13 primer, and 7.2 μL double-distilled water. The PCR amplification conditions were as follows: heating to 94 °C for 3 min, 15 heating cycles at 94 °C for 40 s, then at 60 °C for 30 s, and, finally, at 72 °C for 1 min. This was followed by 25 cycles of heating at 94 °C for 40 s, then at 53 °C for 30 s, and, finally, at 72 °C for 1 min. The last extension occurred at 72 °C over the course of 10 min [25]. Amplified PCR products were detected using an ABI PRISM 3730XL DNA Analyzer (Applied Biosystems, Foster, CA, USA). Allelic sizes were recorded automatically using individual GeneScan files. Sizes and peaks were calibrated automatically against the ROX-500 size standards.

2.6. Statistical Analyses

The degree of polymorphism for each primer pair was determined by their polymorphism information content (PIC) values, which were calculated using MicroSatellite tools (MS tools). The POPGENE32 (version 1.31) was selected to calculate the parameters of population genetics for each primer pair, including the number of alleles per locus (Na), observed heterozygosity (Ho), expected heterozygosity (He), and the effective number of alleles (Ne) [10,14]. NTsys-pc software (version 2.10s) was used to calculate the Dice genetic similarity coefficient values via the unweighted pair-group method, with arithmetic averaging (UPGMA) cluster analysis [10]. GeneAlEx (version 6.5) was applied to estimate the molecular variance (AMOVA) in populations, in populations within groups, and among groups. Additionally, principal component analysis (PCA) was performed using GeneALEX (version 6.5). The population genetic structures of 59 E. indica populations were analyzed using STRUCTURE software (version 2.3.4), and 20 independent runs were performed for each K value. There were 100,000 burn-in period iterations and 500,000 Markov chain Monte Carlo repetitions per run (K ranged from 1 to 10) [14].

3. Results

3.1. Frequency and Distribution of EST-SSRs

In total, 8391 EST-SSR loci were detected among the 14,364 examined unigenes (Table 1). Among the detected EST-SSRs, the mononucleotide was the most abundant type of repeat (3591, 42.79%).
This was followed by the trinucleotide (3162, 37.68%), the dinucleotide (1520, 18.11%), the tetranucleotide (84, 1.00%), the pentanucleotide (17, 0.20%), and, finally, the hexanucleotide (7, 0.08%). The frequencies of EST-SSRs for different tandem repeats were detected, and results showed that the largest number of tandem repeats was 5 (2188, 26.08%), followed by 10 (2085, 24.85%), 6 (1268, 15.11%), and 11 (779, 9.28%) (Table 2).
Additionally, A/T was the most abundant motif (3406, 40.59%), followed by CCG/CGG (1241, 14.79%) and AG/CT (1053, 12.55%), which accounted for 67.93% of the total number of SSRs (Table 2).

3.2. Polymorphism Analysis of Selected SSR Markers

The 14 EST-SSR markers selected by PCR were successfully amplified across all 59 samples and showed high polymorphism. In total, 35 alleles were detected using these markers. The number of alleles per sample (Na) ranged from two to eleven, with an average of 3.50, and the effective number of alleles per sample (Ne) varied from 1.07 to 4.53, with a mean value of 1.94 (Table 3). Shannon’s information index (I) ranged from 0.17 to 1.78. The observed heterozygosity (Ho) ranged from 0.33 to 0.98. The gene diversity (expected heterozygosity [He]) ranged from 0.07 to 0.78, and the lowest and highest values of polymorphism information content (PIC) were 0.05 and 0.56, respectively, with an average value of 0.36 (Table 3).

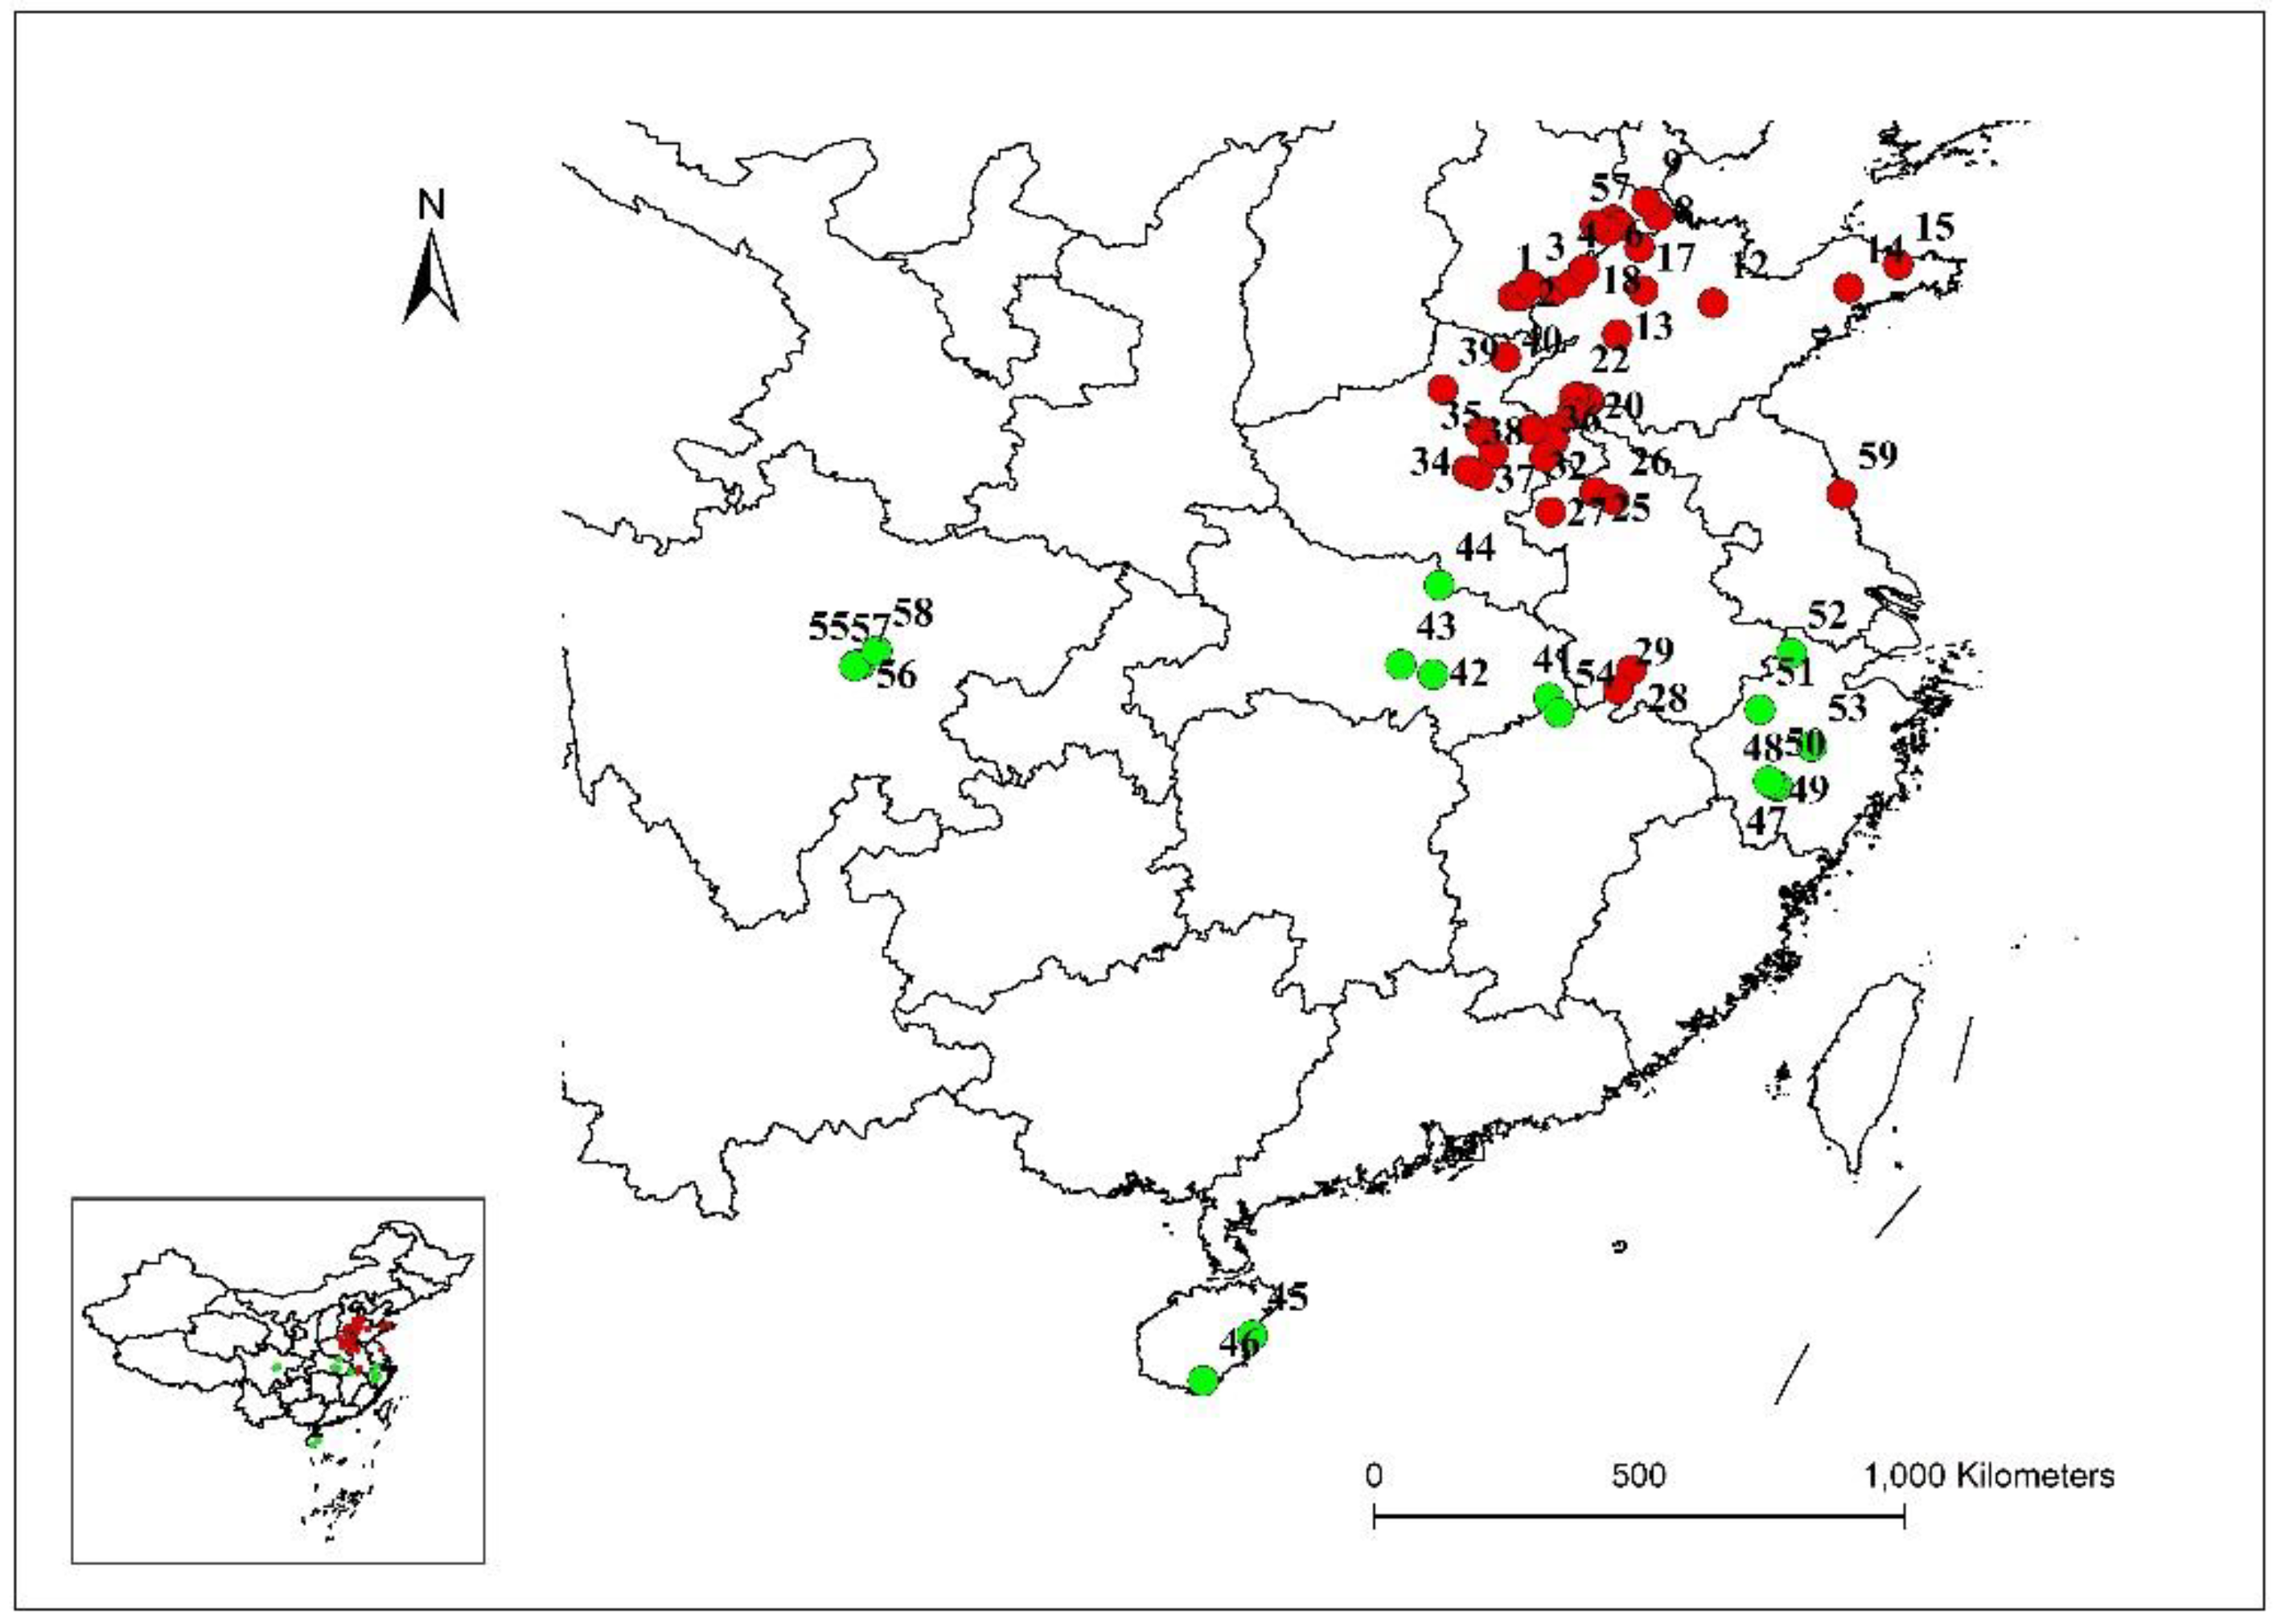
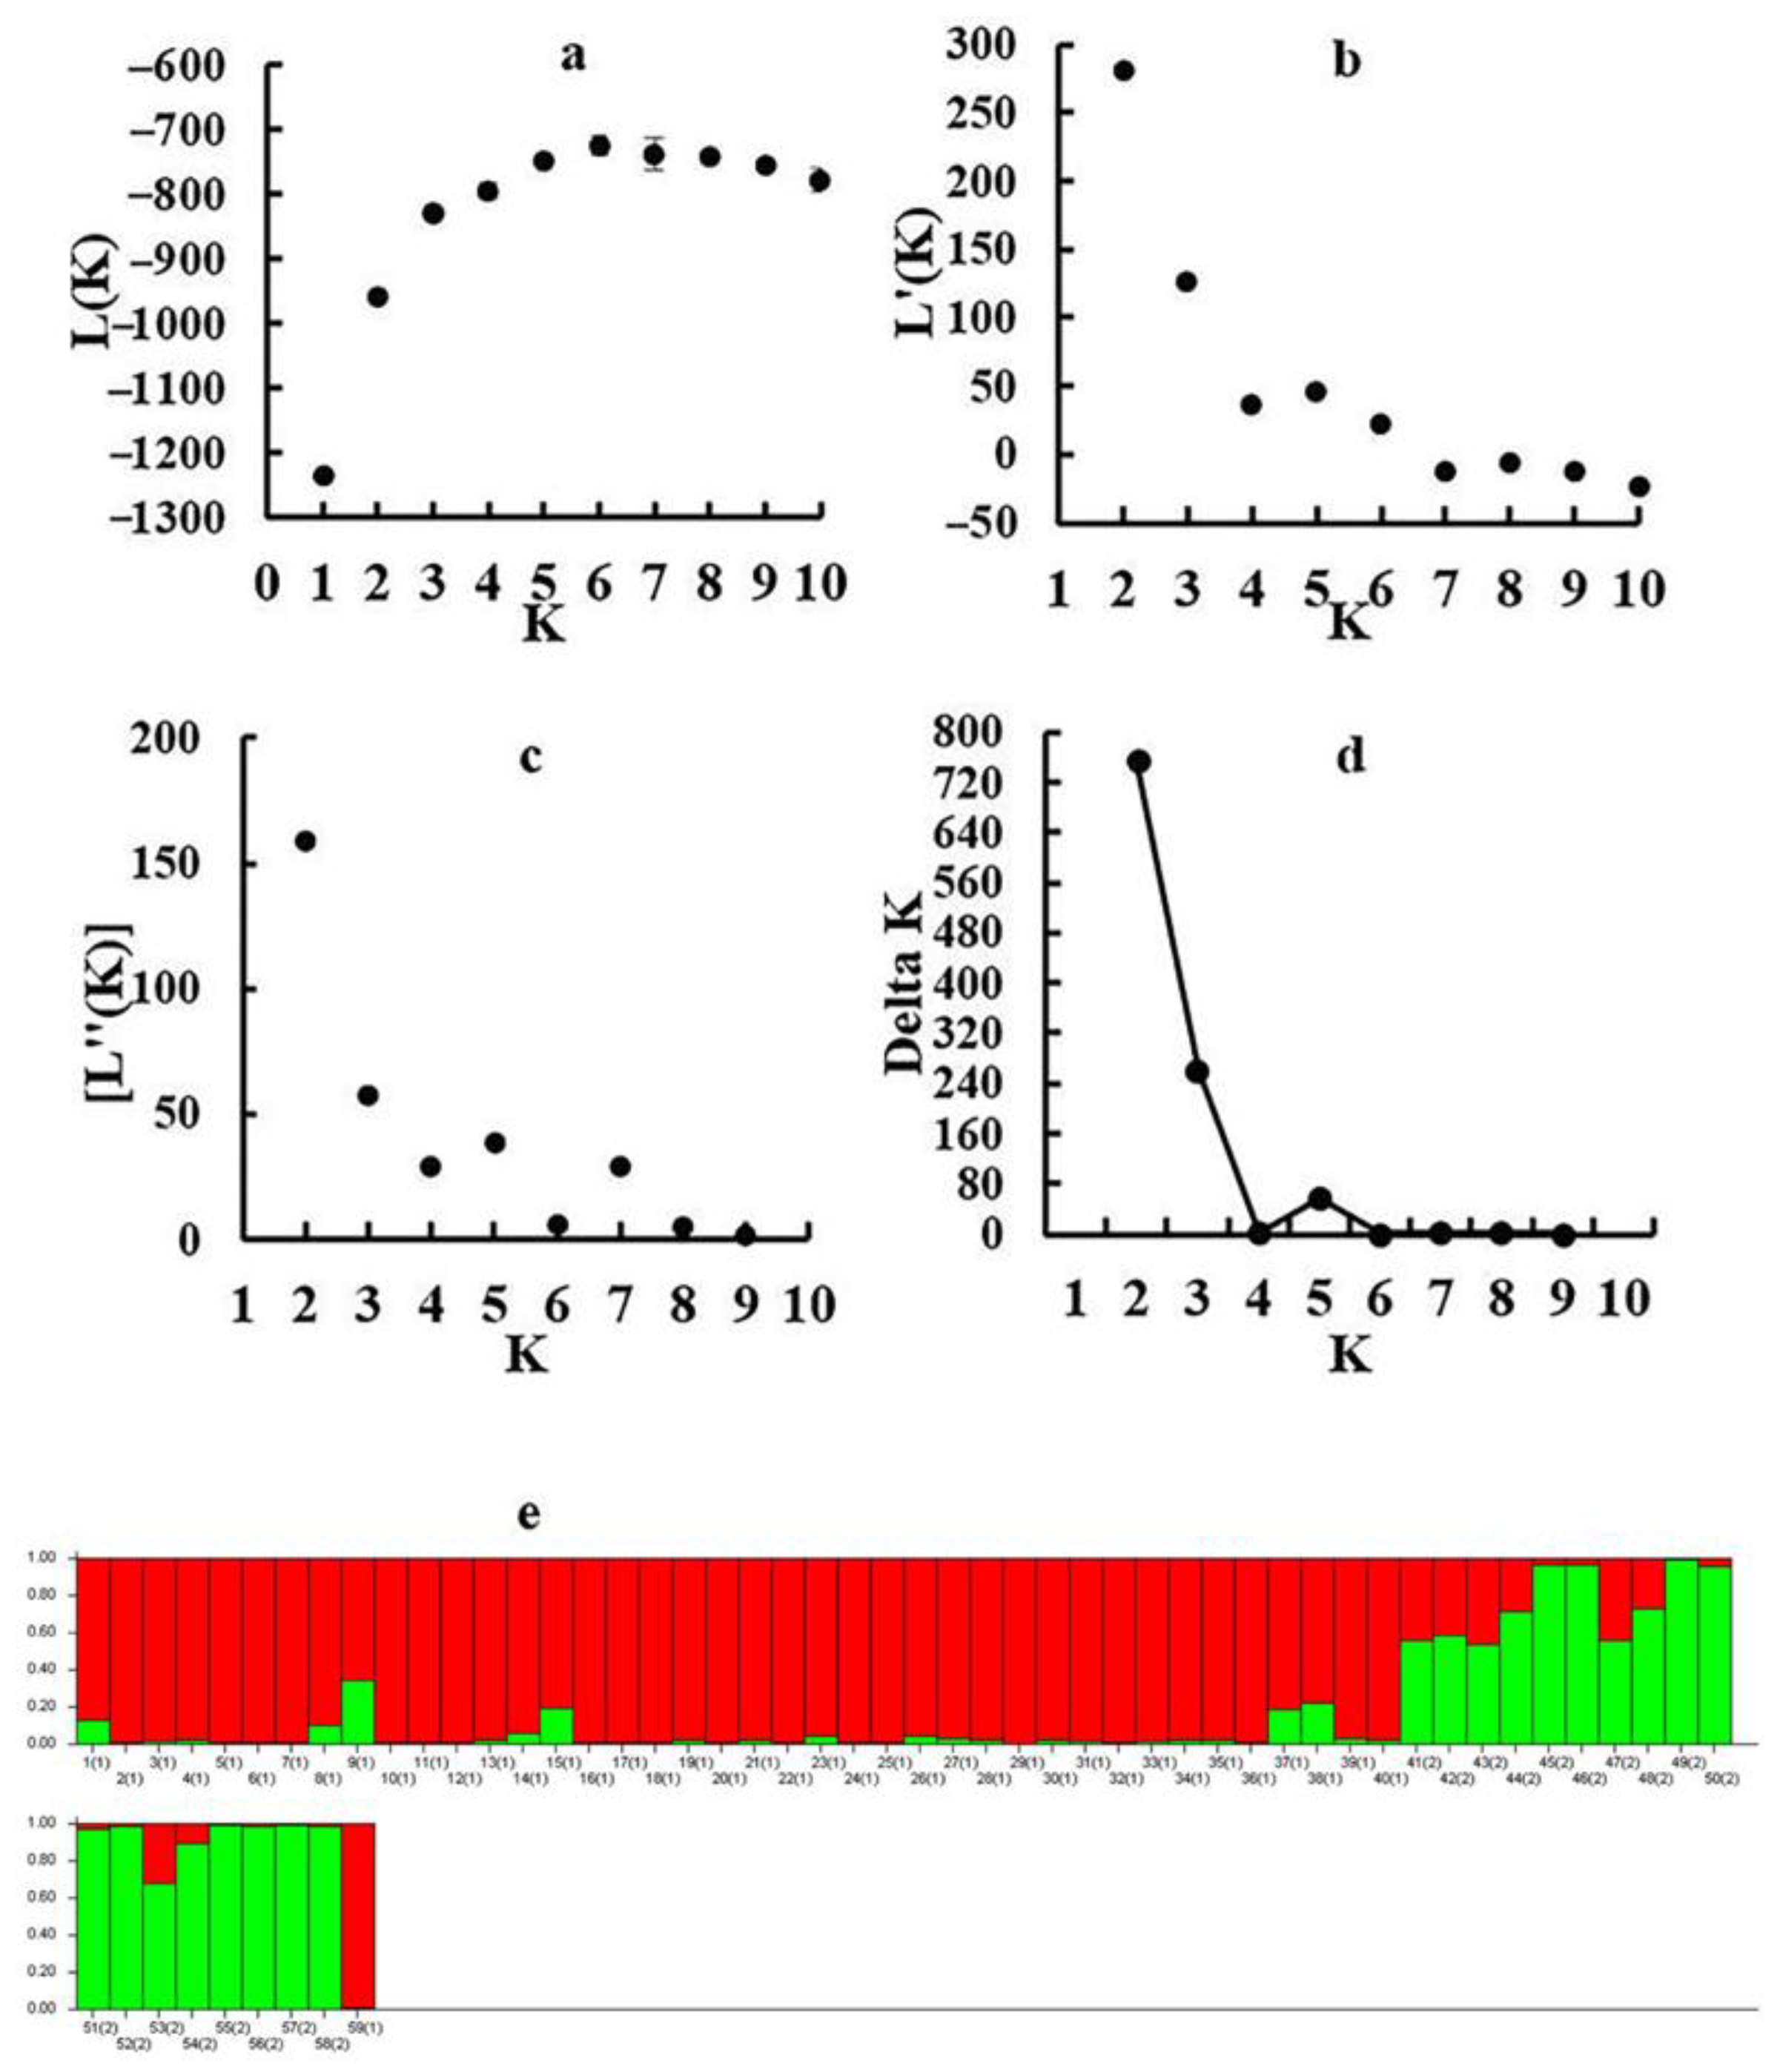
3.3. Genetic Structure and Principal Component Analysis

The population genetic structures of detected individuals from 59 populations were analyzed using STRUCTURE 2.3.4. In this study, the number of clusters was set from 1 to 10, with 20 repetitions per run. The results showed that the optimal K value was observed at K = 2, using the maximum Delta k value. All collected individuals were then further divided into two groups. Group I contained 41 sites from five provinces (Hebei, Shandong, Henan, Anhui, and Jiangsu), and Group II contained 18 sites from five provinces (Zhejiang, Sichuan, Hainan, Hubei, and Jiangxi) (Figure 2). Population genetic structure analysis was conducted using PCA, and the individuals were grouped into two groups based on the first two principal coordinates. Coordinate 1 explained 33.80% of the total variation and Coordinate 2 explained 15.53% of the total variation (Figure 3).

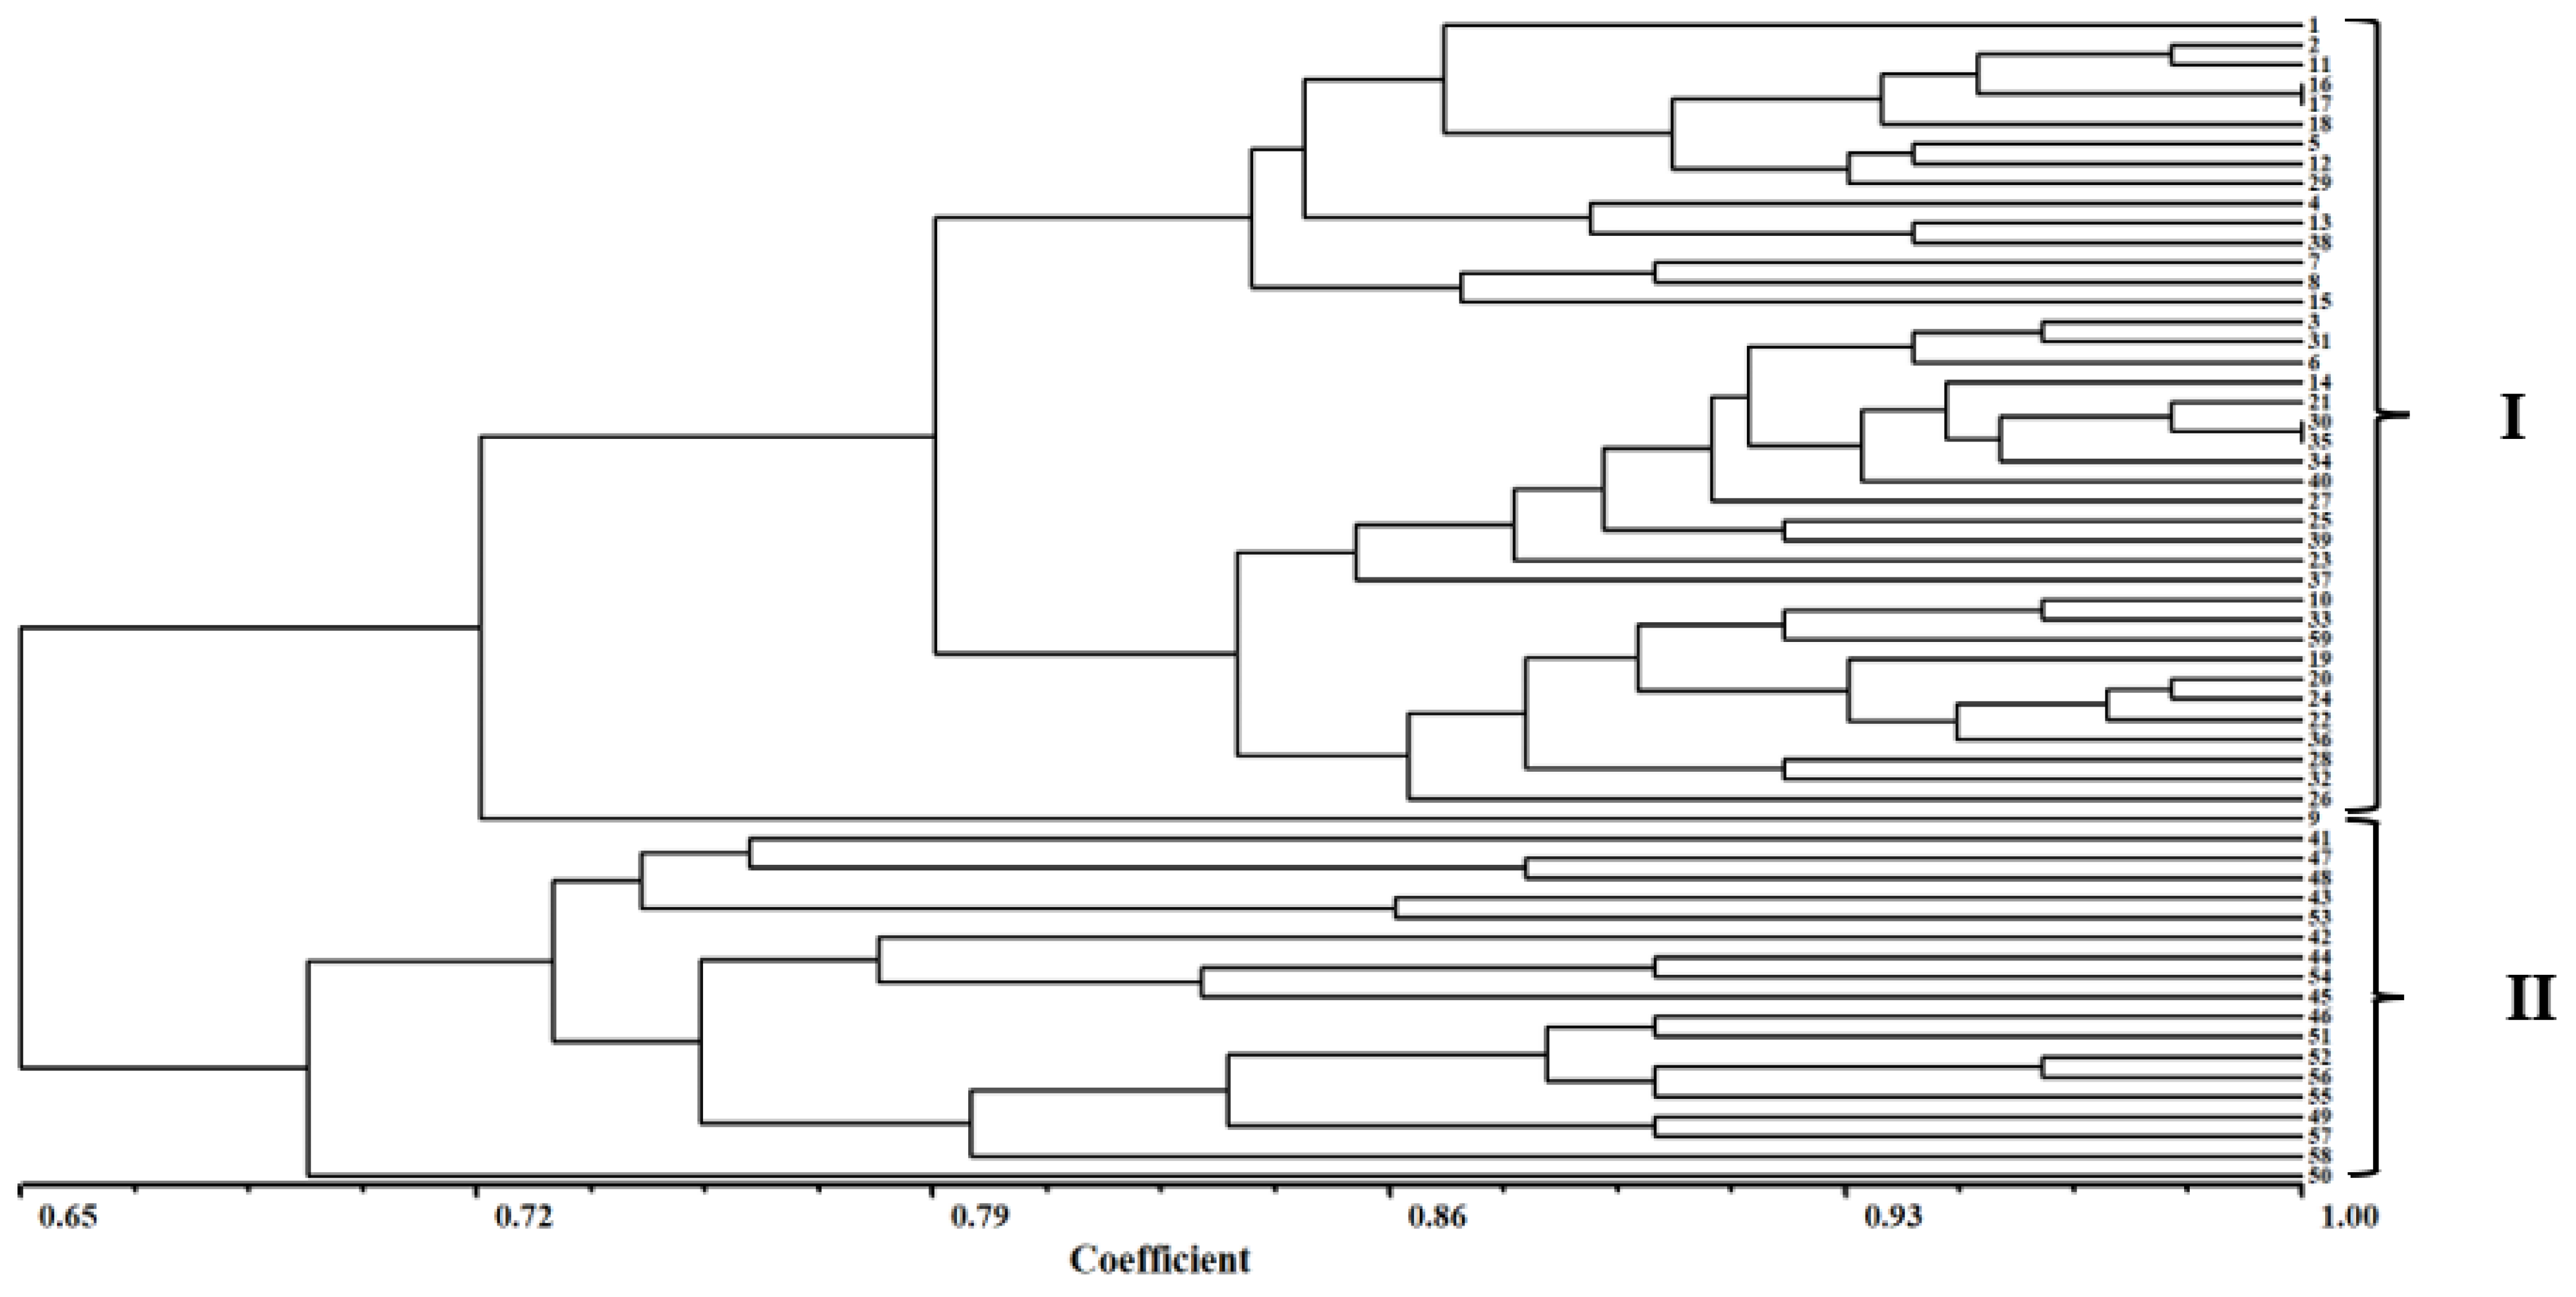
3.4. Cluster Analysis

The genetic similarity coefficient ranged from 0.70 to 1.00 and was based on the Dice similarity coefficient (which was analyzed by NTsys-pc software). Genetic relationships were elucidated using a dendrogram based on SSR data. Based on the cluster analysis, the 59 E. indica populations could be divided into two major groups (I–II) when the Dice genetic similarity coefficient was 0.70. Group I clustered 41 populations from five provinces (Hebei, Shandong, Henan, Anhui, and Jiangsu), and Group II clustered 18 populations from five provinces (Zhejiang, Sichuan, Hainan, Hubei, and Jiangxi) (Figure 4).
AMOVA values showed that a large portion of the variation is attributed to “among populations”. It was shown that 40% of the total variation came from groups clustered using the UPGMA method. A total of 42% of the total variation was due to differences between populations; nevertheless, 18% was attributed to differences between the individuals within the populations (Table 4).

4. Discussion

A limited number of EST sequences are available for use with goosegrass, although screening genic SSR markers utilized in genetic diversity studies via RNA-seq technology has become one of the most efficient methods [26,27]. In this study, 6849 out of 48,852 unigenes contained SSRs, representing approximately 14.02% of the transcriptomic sequences for goosegrass. This frequency was significantly higher than that of Torreya grandis (2.7%) [28] but lower than that of Posidonia oceanica (17.5%) [29]. The SSR frequency varies widely between different species and may be affected by SSR search criteria, unique species properties, and the size of the unigene assembly dataset [30]. In our study, six different repeat motifs were identified, and mononucleotides repeats were the most frequent repeats (42.79%), followed by trinucleotides (37.68%). In contrast, tetr- (1.00%), penta- (0.20%), and hexanucleotide repeats (0.08%) were shown to be less frequent. Most studies have found that mono-, di-, and trinucleotide repeats occur at relatively high frequencies, while other types of nucleotide repeats are rare [10,31,32]. As shown in Table 2, similar to most plant species, A/T repeats in goosegrass were significantly more abundant than G/C repeats [33,34]. The two most abundant trinucleotide repeat motifs in this study were CCG/CGG (14.79%) and AGG/CCT (6.79%). Consistent with our results, many studies have revealed that the CCG/CGG type is the most abundant trinucleotide repeat in monocots but is rarely found in dicotyledonous plants [30,31].
In this study, the degrees of the polymorphism of different loci for 59 goosegrass populations were measured based on PIC values, which can be used to assess our ability to detect molecular marker polymorphisms. The results showed that locus SSR216 had the highest genetic diversity, with He and PIC values of 0.78 and 0.48, respectively. The average PIC value for all loci was 0.36, and ten had values greater than 0.35. The high repeat number in the dinucleotide locus of SSR216, which was higher than that for the trinucleotide repeats, may be one of the reasons for the greatest diversity, according to a previous assumption [35]. These results indicated the presence of a moderate level of genetic diversity of most loci within their populations, with the SSR224 locus being known to have high polymorphism when its PIC value became greater than 0.56. Yang et al. found that the PIC values for developed markers in C. communis did not exceed 0.50, which is similar to our findings. The PIC value was often higher than 0.50 in some industrial crops, such as Pinus koraiensis, Crataegus pinnatifida, and Curcuma alismatifolia [12,13,14]. Goosegrass is a self-pollinated weed species, a trait that affects the level of genetic diversity within the species as a whole, and when the self-crossing rate increases, population genetic diversity tends to decrease [12].
The population genetic structure was analyzed according to the structure that was divided by the 59 populations into two groups. The PCA results were consistent with the results of the genetic structural analysis performed using the same EST-SSR markers and individuals. Gene flow is an important factor affecting the genetic structure of plant population structure. Based on the structure result, most of the populations in group I were from north China to the Yangtze River, while most populations in group II were from south China to the Yangtze River. A similar result was also found in C. communis, from which 46 populations were divided into three major groups using 12 SSR markers [10]. Our data further suggested that geographical location might play a more important role than other factors in these populations.

5. Conclusions

In this study, we developed and analyzed a set of EST-SSR markers derived from the E. indica transcriptome. A total of 14 EST-SSR primer markers were verified, and the population genetic structure and diversity of 59 E. indica populations, which were divided into two groups, were successfully analyzed. These results indicate that next-generation sequencing techniques are powerful tools for SSR development and genetic analysis.

Supplementary Materials

The following supporting information can be downloaded at: https://www.mdpi.com/article/10.3390/cimb45010011/s1, Table S1: The information for the populations of E. indica.

Author Contributions

Conceptualization, J.C. and X.L.; methodology, J.C.; software, H.Y.; validation, J.C. and X.M.; formal analysis, J.C.; investigation, J.C.; resources, Y.M., X.M., S.W., H.H. and Y.L.; data curation, J.C.; writing—original draft preparation, J.C.; writing—review and editing, J.C., H.C., X.L. and X.M.; visualization, J.C.; supervision, J.C.; project administration, J.C., X.L.; funding acquisition, J.C. All authors have read and agreed to the published version of the manuscript.

Funding

This research was funded by Beijing Natural Science Foundation (6222051); Nanfan special project, CAAS (SWAQ03); China Agriculture Research System (CARS-25).

Institutional Review Board Statement

No applicable.

Informed Consent Statement

Not applicable.

Data Availability Statement

Clean transcriptome data for E. indica can be uploaded to the Sequence Read Archive (SRA) public database (No. PRJNA323986) in NCBI.

Acknowledgments

We thank Yang Zhang and Jietian Su for their help with the experiments.

Conflicts of Interest

The authors declare no conflict of interest.

References

  1. Holm, L.G.; Plucknett, D.L.; Pancho, J.V.; Herberger, J.P. The World’s Worst Weeds: Distribution and Biology; University Press of Hawaii: Honolulu, HI, USA, 1977; pp. 47–53. [Google Scholar]
  2. Chauhan, B.S.; Johnson, D.E. Germination ecology of goosegrass (Eleusine indica): An important grass weed of rainfed rice. Weed Sci. 2008, 56, 699–706. [Google Scholar] [CrossRef]
  3. Ma, X.; Wu, H.; Jiang, W.; Ma, Y. Goosegrass (Eleusine indica) density effects on cotton (Gossypium hirsutum). J. Integr. Agr. 2015, 14, 1778–1785. [Google Scholar] [CrossRef] [Green Version]
  4. Rao, A.; Johnson, D.; Sivaprasad, B.; Ladha, J.; Mortimer, A. Weed management in direct-seeded rice. Adv. Agron. 2007, 93, 153–255. [Google Scholar]
  5. Kong, H.; Wang, Z.; Guo, J.; Xia, Q.; Zhao, H.; Zhang, Y.; Guo, A.; Lu, B. Increases in genetic diversity of weedy rice associated with ambient temperatures and limited gene flow. Biology 2021, 10, 71. [Google Scholar] [CrossRef]
  6. Selkoe, K.A.; Toonen, R.J. Microsatellites for ecologists: A practical guide to using and evaluating microsatellite markers. Ecol. Lett. 2006, 9, 615–629. [Google Scholar] [CrossRef]
  7. Vieira, M.L.C.; Santini, L.; Diniz, A.L.; Munhoz, C.d.F. Microsatellite markers: What they mean and why they are so useful. Genet. Mol. Biol. 2016, 39, 312–328. [Google Scholar] [CrossRef] [Green Version]
  8. Wei, Z.; Sun, Z.; Cui, B.; Zhang, Q.; Xiong, M.; Wang, X.; Zhou, D. Transcriptome analysis of colored calla lily (Zantedeschia rehmannii Engl.) by Illumina sequencing: De novo assembly, annotation and EST-SSR marker development. PeerJ 2016, 4, e2378. [Google Scholar] [CrossRef] [Green Version]
  9. Lee, E.-J.; Nah, G.; Yook, M.-J.; Lim, S.-H.; Park, T.-S.; Lee, D.; Kim, D.-S. Phylogenetic relationship of Echinochloa species based on simple sequence repeat and phenotypic marker analyses. Weed Sci. 2016, 64, 441–454. [Google Scholar] [CrossRef]
  10. Yang, J.; Yu, H.; Li, X.; Dong, J. Genetic diversity and population structure of Commelina communis in China based on simple sequence repeat markers. J. Integr. Agr. 2018, 17, 2292–2301. [Google Scholar] [CrossRef] [Green Version]
  11. Csencsics, D.; Brodbeck, S.; Holderegger, R. Cost-effective, species-specific microsatellite development for the endangered dwarf bulrush (Typha minima) using next-generation sequencing technology. J. Hered. 2010, 101, 789–793. [Google Scholar] [CrossRef] [Green Version]
  12. Li, X.; Liu, X.; Wei, J.; Li, Y.; Tigabu, M.; Zhao, X. Development and transferability of EST-SSR markers for from cold-stressed transcriptome through Illumina sequencing. Genes 2020, 11, 500. [Google Scholar] [CrossRef] [PubMed]
  13. Taheri, S.; Abdullah, T.L.; Rafii, M.; Harikrishna, J.A.; Werbrouck, S.; Teo, C.H.; Sahebi, M.; Azizi, P. De novo assembly of transcriptomes, mining, and development of novel EST-SSR markers in Curcuma alismatifolia (Zingiberaceae family) through Illumina sequencing. Sci. Rep. 2019, 9, 3047. [Google Scholar] [CrossRef] [PubMed]
  14. Suliya, M.; Wenxuan, D.; Tong, L.; Yingmin, L. An RNA sequencing transcriptome analysis and development of EST-SSR markers in Chinese hawthorn through Illumina sequencing. Forests 2019, 10, 82. [Google Scholar]
  15. Yang, C.; Tian, X.; Feng, L.; Yue, M. Resistance of Eleusine indica Gaertn to glyphosate. Sci. Agric. Sin. 2012, 45, 2093–2098. [Google Scholar]
  16. Zhang, Z. Development of chemical weed control and integrated weed management in China. Weed Biol. Manag. 2003, 3, 197–203. [Google Scholar] [CrossRef]
  17. Takano, H.; Oliveira, R., Jr.; Constantin, J.; Silva, V.; Mendes, R. Chemical control of glyphosate-resistant goosegrass. Planta Daninha 2018, 36, e018176124. [Google Scholar] [CrossRef]
  18. The International Survey of Herbicide Resistant Weeds. Available online: www.weedscience.org (accessed on 11 November 2022).
  19. Silin Liu, Z.M.; Zhang, Y.; Chen, Z.; Du, X.; Mu, Y. Astragalus sinicus incorporated as green manure for weed control in corn. Front. Plant Sci. 2022, 13, 829421. [Google Scholar]
  20. Chen, J.; Huang, H.; Wei, S.; Huang, Z.; Xu, W.; Zhang, C. Investigating the mechanisms of glyphosate resistance in goosegrass (Eleusine indica (L.) Gaertn.) by RNA sequencing technology. Plant J. 2017, 89, 407–415. [Google Scholar] [CrossRef] [Green Version]
  21. Chen, J.; Huang, H.; Wei, S.; Zhang, C.; Huang, Z. Characterization of glyphosate-resistant goosegrass (Eleusine indica) populations in China. J. Integr. Agric. 2015, 14, 919–925. [Google Scholar] [CrossRef] [Green Version]
  22. Chen, J.; Jiang, C.; Huang, H.; Wei, S.; Huang, Z.; Wang, H.; Zhao, D.; Zhang, C. Characterization of Eleusine indica with gene mutation or amplification in EPSPS to glyphosate. Pestic. Biochem. Phys. 2017, 143, 201–206. [Google Scholar] [CrossRef]
  23. Beier, S.; Thiel, T.; Münch, T.; Scholz, U.; Mascher, M. MISA-web: A web server for microsatellite prediction. Bioinformatics 2017, 33, 2583–2585. [Google Scholar] [CrossRef] [PubMed] [Green Version]
  24. Untergasser, A.; Cutcutache, I.; Koressaar, T.; Ye, J.; Faircloth, B.C.; Remm, M.; Rozen, S.G. Primer3—New capabilities and interfaces. Nucleic Acids Res. 2012, 40, e115. [Google Scholar] [CrossRef] [PubMed] [Green Version]
  25. Chen, C.; Chu, Y.; Ding, C.; Su, X.; Huang, Q. Genetic diversity and population structure of black cottonwood (Populus deltoides) revealed using simple sequence repeat markers. BMC Genet. 2020, 21, 2. [Google Scholar] [CrossRef] [PubMed] [Green Version]
  26. Mei, L.; Xiaoming, Y.; Hang, L.; Shiying, S.; Hualin, Y.; Lijun, C.; Xiuxin, D. De novo transcriptome assembly of pummelo and molecular marker development. PLoS ONE 2015, 10, e0120615. [Google Scholar]
  27. Zhang, X.; Ye, Z.; Wang, T.; Xiong, H.; Yuan, X.; Zhang, Z.; Yuan, Y.; Liu, Z. Characterization of the global transcriptome for cotton (Gossypium hirsutum L.) anther and development of SSR marker. Genes 2014, 551, 206–213. [Google Scholar] [CrossRef] [PubMed]
  28. Zeng, J.; Chen, J.; Kou, Y.; Wang, Y. Application of EST-SSR markers developed from the transcriptome of (Taxaceae), a threatened nut-yielding conifer tree. PeerJ 2018, 6, e5606. [Google Scholar] [CrossRef] [PubMed] [Green Version]
  29. D’esposito, D.; Orrù, L.; Dattolo, E.; Bernardo, L.; Lamontara, A.; Orsini, L.; Serra, I.A.; Mazzuca, S.; Procaccini, G. Transcriptome characterisation and simple sequence repeat marker discovery in the seagrass Posidonia oceanica. Sci. Data 2016, 3, 160115. [Google Scholar] [CrossRef] [PubMed]
  30. Varshney, R.K.; Thiel, T.; Stein, N.; Langridge, P.; Graner, A. In silico analysis on frequency and distribution of microsatellites in ESTs of some cereal species. Cell Mol. Biol. Lett. 2002, 7, 537–546. [Google Scholar] [PubMed]
  31. Cai, K.; Zhu, L.; Zhang, K.; Li, L.; Zhao, Z.; Zeng, W.; Lin, X. Development and characterization of EST-SSR markers from RNA-Seq data in Phyllostachys violascens. Front. Plant Sci. 2019, 10, 50. [Google Scholar] [CrossRef] [Green Version]
  32. Emami, A.; Shabanian, N.; Rahmani, M.-S.; Khadivi, A.; Mohammad-Panah, N. Genetic characterization of the Crataegus genus: Implications for in situ conservation. Sci. Hortic. 2018, 231, 56–65. [Google Scholar] [CrossRef]
  33. Yue, H.; Wang, L.; Liu, H.; Yue, W.; Du, X.; Song, W.; Nie, X. De novo assembly and characterization of the transcriptome of broomcorn millet (Panicum miliaceum L.) for gene discovery and marker development. Front. Plant Sci. 2016, 7, 1083. [Google Scholar] [CrossRef] [PubMed] [Green Version]
  34. Gao, Z.; Wu, J.; Liu, Z.A.; Wang, L.; Ren, H.; Shu, Q. Rapid microsatellite development for tree peony and its implications. BMC Genom. 2013, 14, 886. [Google Scholar] [CrossRef] [PubMed] [Green Version]
  35. Weber, J.L. Informativeness of human (dC-dA) n·(dG-dT) n polymorphisms. Genomics 1990, 7, 524–530. [Google Scholar] [CrossRef] [PubMed]
Figure 1. Distribution of the E. indica populations which collected seeds from 10 provinces in China. Each population was numbered and the color of the circle according to the results of different analysis in this research.
Cimb 45 00011 g001
Figure 2. Results of STRUCTURE analysis for 59 populations using 14 EST-SSR markers: (a) Plot mean likelihood L(K) and variance per K value. (b) Plot of mean rate of change of the likelihood distribution L’(K) per K value. (c) Plot of absolute value of the second order rate of the change of the likelihood distribution |L’’(K)| per K value. (d) Estimation of population using Delta K value with cluster K ranging from 1 to 10. (e) Estimation of population structure based on STRUCTURE analysis.
Cimb 45 00011 g002
Figure 3. Principal component analysis based on 14 EST-SSR markers in E. indica. Coordinate 1 explained 33.80% of the total variation and Coordinate 2 explained 15.53% of the total variation.
Cimb 45 00011 g003
Figure 4. UPGMA analysis of 59 populations of E. indica by the Sequential Agglomerative Hierarchical and Nested Clustering (SAHN) module of the NTSYS-pc. The FIND module was used to identify all trees that could result from different choices of tied similarity or dissimilarity values.
Cimb 45 00011 g004
Table 1. Summary of analyses of expressed sequence tag-simple repeat (EST-SSRs) in E. indica.
ItemParametersNumber
EST-SSRTotal number of sequences examined48852
Total size of examined sequences (bp)41400899
Total number of identified SSRs8391
Number of SSR containing sequences6849
Number of sequences containing more than 1 SSR1206
Number of SSRs present in compound formation451
Table 2. Frequencies of different repeat motifs in SSRs in E. indica.
Repeats5678910111213141516+TotalPercentage
A/T-----179163228519011063335340640.59
C/G-----43382691414411852.20
AC/GT-9336392322243---12412.87
AG/CT-283174149147214805---1105312.55
AT/AT-702220101452---01431.70
CG/CG-7364-------0830.99
AAC/GTT5229132-------0961.14
AAG/CTT14354366-------02392.89
AAT/ATT219123------10460.55
ACC/GGT14057272-------02262.69
ACG/CGT1364194-------01902.26
ACT/AGT2135 -------1300.36
AGC/CTG25796272-------03824.55
AGG/CCT334151786---1---05706.79
ATC/ATG9030193-------01421.69
CCG/CGG896264765-------0124114.79
Others981511010000111181.41
Total218812685412461802085779322199124793808391100
Table 3. Characteristics of 14 selected EST-SSR markers in E. indica.
Primer NameRepeatPrimer Sequence (5′-3′)TM
(°C)
NaNeHoHeIPIC
SSR10(TTTG)5AACCAGTTCTTCCTCTGCCG
GCCAGCACACCACTCATTTG
602.001.680.950.400.590.44
SSR12(ATCC)5TCCTCCTCCTCTGCCCTTTT
GCATCCCACCGAACACACTA
603.001.820.970.450.750.42
SSR27(CGAT)5GGCTGCTGATGCTTAAACGG
TCTAGCTGAGGCAGGACAGT
602.001.830.950.450.650.40
SSR104(GAG)5GGGCTCTAGGGACTACACCA
GGCTTTCAGAAGGGCTGCTA
603.001.070.980.070.170.07
SSR105(CCG)5CGACCACGAGTTCTGCTTCT
CCCGCCCTCCAATTTCTCTT
603.001.230.860.190.400.05
SSR137(ATGT)5CTGTCTCTGCCCTCCAACAG
GGTAGCGTCCAGGATCATGC
602.002.000.950.500.690.45
SSR138(TATC)5TAACAGCGACCGCATCTACC
AACCTCGCCGTTGTTCAGAG
603.001.760.920.430.690.35
SSR142(TTTC)5ACACTCACTCCCTGATCCCT
CGGAGGCCCACGTTTCTTAT
602.001.590.950.370.560.32
SSR154(ATTT)5CGCGCGCATTTTCATCAGAT
CTTGGGATGCTCGTAGCCAT
602.001.960.950.490.680.44
SSR186(ATGT)5CTGTCTCTGCCCTCCAACAG
GGTAGCGTCCAGGATCATGC
602.002.000.930.500.690.43
SSR202(GAG)12CTCCACCATCTCCTTCCTCG
CACAAGAAGATCCCCGTGCT
604.001.380.920.280.510.19
SSR204(TCTCTT)10GCAGCAAGCCCATGATCTTG
TCAGCAGCTGAGCTTACTCC
605.002.190.880.541.030.47
SSR216(AT)12CGGTGCGTGACAGTCAAAAG
GCCTCCCTGATCCGTTCATC
6011.004.530.330.781.780.48
SSR224(TCAG)15TGGCTTACCAACAGGCACAA
AACAAACAACGCGTCTTGGC
605.002.200.970.551.090.56
Mean 3.501.940.890.430.740.36
St. Dev 2.410.820.170.170.380.15
Note: Na: Observed number of alleles; Ne: effective number of alleles; Ho: observed heterozygosity; He: expected heterozygosity; I: Shannon’s information index; PIC: polymorphism information content.
Table 4. Analysis of molecular variance (AMOVA) among E. indica populations and clustered groups.
Source of Variationd.f.MSSS%TotalEst. Var.
Among groups182.42782.427401.568
Among populations573.987227.276421.638
Total58 351.703823.205
d.f., degree of freedom; MS, mean squared deviations; SS, sum of squares; Est. Var., estimate variance; Prob, the significance of the variance components after 999 random permutations. Values among groups, among populations and within populations are considered highly significant (p < 0.001).
Disclaimer/Publisher’s Note: The statements, opinions and data contained in all publications are solely those of the individual author(s) and contributor(s) and not of MDPI and/or the editor(s). MDPI and/or the editor(s) disclaim responsibility for any injury to people or property resulting from any ideas, methods, instructions or products referred to in the content.

