Article

Characterization of a Cancer-Induced Bone Pain Model for Use as a Model of Cancer Cachexia

1
Department of Pharmacology, Faculty of Pharmacy, Niigata University of Pharmacy and Medical and Life Sciences, 265-1 Higashijima, Akiha-ku, Niigata 956-8603, Japan
2
Department of Bio-Analytical Chemistry, Faculty of Pharmacy, Niigata University of Pharmacy and Medical and Life Sciences, 265-1 Higashijima, Akiha-ku, Niigata 956-8603, Japan
3
Laboratory of Health Chemistry, Faculty of Pharmacy, Niigata University of Pharmacy and Medical and Life Sciences, 265-1 Higashijima, Akiha-ku, Niigata 956-8603, Japan
*
Authors to whom correspondence should be addressed.
Curr. Issues Mol. Biol. 2024, 46(12), 13364-13382; https://doi.org/10.3390/cimb46120797
Submission received: 23 October 2024 / Revised: 16 November 2024 / Accepted: 21 November 2024 / Published: 23 November 2024
(This article belongs to the Section Molecular Medicine)

Abstract

:
Cancer cachexia is a debilitating syndrome characterized by progressive weight loss, muscle wasting, and systemic inflammation. Despite the prevalence and severe consequences of cancer cachexia, effective treatments for this syndrome remain elusive. Therefore, there is a greater need for well-characterized animal models to identify novel therapeutic targets. Certain manifestations of cachexia, such as pain and depression, have been extensively studied using animal models of cancer-induced bone pain (CIBP). In contrast, other aspects of cachexia have received less attention in these models. To address this issue, we established the CIBP model by injecting Lewis lung carcinoma into the intramedullary cavity of the femur, observed cachexia-related symptoms, and demonstrated the utility of this model as a preclinical platform to study cancer cachexia. This model accurately recapitulates key features of cancer cachexia, including weight loss, muscle atrophy, adipose tissue depletion, CIBP, and anxiety. These findings suggest that psychological factors, in addition to physiological and metabolic factors, play significant roles in cancer cachexia development. Our model offers a valuable resource for investigating the underlying mechanisms of cancer cachexia and for developing innovative therapeutic strategies that target physical and psychological components.

1. Introduction

Cancer cachexia is a progressive metabolic syndrome characterized by systemic metabolic alterations, involuntary loss of skeletal muscle and adipose tissue, and functional decline of multiple organs [1,2,3,4]. Conventional nutritional support is insufficient to correct these symptoms completely. Cancer cachexia impairs the efficacy of anticancer therapy and radiotherapy and increases the risk of surgical complications and treatment-related toxicity [2,5]. The incidence of cancer cachexia in patients with advanced cancer ranges from 50% to 80% and is associated with mortality in more than 20% of patients with cancer [6,7].
Cancer cachexia results from a complex interplay between various factors, including increased systemic inflammation, elevated energy expenditure, reduced energy intake, enhanced catabolism, and biological pathways [8,9,10,11,12]. However, its exact etiology remains elusive. International guidelines for managing cachexia–anorexia recommend a multidisciplinary approach incorporating nutritional, physiological, and pharmacological interventions to enhance quality of life (QOL) for affected patients [13]. Corticosteroids, nonsteroidal anti-inflammatory drugs, eicosapentaenoic acid, and progesterone-based agents have shown promise in managing cancer cachexia [14,15]. However, their clinical use remains limited. Oral anamorelin, a ghrelin receptor agonist, was approved in Japan in 2021 as a novel therapeutic option for patients with cancer cachexia. This agent stimulates growth hormone secretion by activating the growth hormone secretagogue receptor type 1a (GHS-R1a), thereby increasing appetite [16]. Clinical studies have demonstrated the efficacy of anamorelin in increasing weight and improving quality of life in patients with non-small cell lung cancer. However, although anamorelin increases the lean body mass of patients with cancer cachexia, it fails to improve physical function [17,18,19]. Furthermore, its administration is contraindicated in conjunction with CYP3A4 inhibitors and in patients with hepatic or cardiac impairment [20,21]. Consequently, elucidating the complex etiopathogenesis of cancer cachexia remains imperative to identify novel therapeutic targets and develop effective treatment options.
The development of effective countermeasures for cancer cachexia relies heavily on the use of appropriate animal models. Various such models have been established, with most involving the subcutaneous implantation of tumor cells into rodents. Common tumor cell lines employed include murine colon adenocarcinoma (Colon-26) [22], Lewis lung carcinoma (LLC) [23], and B16F10 melanoma [24], as well as human gastric adenocarcinoma (85As2) [25] and rat hepatocellular carcinoma (Yoshida AH-130) [26]. Additionally, genetically engineered mouse models, such as Apc Min/+ [27], inhibin alpha subunit knockout model [28], and KPP (Ptf1aCre-ERTM; KrasLSL-G12D; Ptenflox) model [29], have contributed significantly to this field. While animal models have significantly advanced our understanding of cancer cachexia, no single model fully recapitulates its multifaceted nature, including tumor heterogeneity, complex host–tumor interactions, therapeutic interventions, psychological factors, and comorbidities. Therefore, novel preclinical models that recapitulate key clinical features of cancer cachexia must be developed.
Bone metastases are common in prostate, breast, and lung cancer and are found in about 85% of patients dying from these cancers [30]. Therefore, 75–90% of patients with metastatic or advanced cancer experience significant cancer-related pain [31,32]. Pain can occur at any stage of the disease but typically increases with time. It has been suggested that cancer pain is an important predictor of the severity of cachexia and may lead to reduced QOL [33]. Some symptoms of cachexia, such as pain and depression, have been the subject of extensive study in animal models of cancer-induced bone pain (CIBP). However, other aspects of cachexia have only been the focus of limited investigation in these models [34,35].
Therefore, in this study, we created a CIBP model by injecting LLC into the intramedullary cavity of the mouse femur and investigated the characteristics of cachexia in this model. This model recapitulates key features of cancer-associated cachexia, including progressive muscle and adipose tissue depletion, anorexia, cancer-induced bone pain, and anxiety-like behavior. This study aims to characterize this model as a suitable preclinical platform for investigating the pathogenesis of cancer cachexia.

2. Materials and Methods

2.1. Cell Culture

LLC cells were obtained from AntiCancer Japan and cultured in high-glucose Dulbecco’s Modified Eagle’s Medium (Sigma-Aldrich, Burlington, MA, USA) supplemented with 50 U/mL penicillin, 0.05 mg/mL streptomycin (Thermo Fisher Scientific, Waltham, MA, USA), and 10% fetal bovine serum (FBS; JRH Biosciences, Lenexa, KS, USA). The cells were maintained at 37 °C in a humidified atmosphere containing 5% CO2. Cells were passaged every 4 days using 0.25% trypsin/EDTA (Thermo Fisher Scientific) and reseeded onto collagen-coated culture plates (AGC TECHNO GLASS, Haibara, Shizuoka, Japan).

2.2. Animals

Male C57BL/6J mice (6–8 weeks old) were obtained from SLC (Hamamatsu, Shizuoka, Japan). The mice were housed in a specific pathogen-free environment at 23 ± 1 °C with a 12 h light/12 h dark cycle and provided with a standard chow diet. One hundred and five C57BL/6 mice were randomly assigned to either a tumor-implanted group (n = 68) or a control group (n = 37) and housed four per cage. All animal procedures were approved by the Animal Care and Use Committee of Niigata University of Pharmacy and Medical and Life Sciences and were conducted in accordance with the institution’s guidelines for the care and use of laboratory animals (permit number 21-7). Euthanasia was performed according to humane endpoints (The experiment was terminated when the animals lost more than 20% of their body weight within a week).

2.3. LLC Cell Inoculation

LLC cells were dissociated into a single-cell suspension using 0.25% trypsin/EDTA and resuspended in 5% FBS in phosphate-buffered saline (PBS) at a concentration of 1 × 10⁴ cells/μL. The mice were anesthetized with a combination of ketamine (37.5 mg/kg) and medetomidine (0.25 mg/kg), and a small hole was made in the right femur using a 26-gauge needle. A total of 5 × 10⁴ LLC cells in 5 μL of the cell suspension were injected into the femoral bone marrow cavity using a 26-gauge Hamilton syringe. Sham mice received an equivalent volume of 5% FBS in PBS. Anesthesia was reversed with atipamezole (2.5 mg/kg).

2.4. Dissections

Dissections were performed 4 weeks after LLC transplantation. The mice were anesthetized with a combination of ketamine (70 mg/kg) and medetomidine (0.5 mg/kg). Blood samples were collected from the inferior vena cava of the mice. Various tissues, including the tibialis anterior (TA), extensor digitorum longus (EDL), gastrocnemius (GAS), soleus (SOL), epididymal white adipose tissue (eWAT), heart, and liver, were meticulously dissected and then weighed on an electronic balance. Tissue from the tumor-free side was utilized for subsequent analyses.

2.5. Quantitative Real-Time Polymerase Chain Reaction (PCR)

Total RNA was extracted using the RNAiso reagent (Takara Bio, Kusatsu, Shiga, Japan), and 500 ng was reverse transcribed to cDNA using the PrimeScript™ RT reagent kit (Perfect Real Time; Takara Bio). Quantitative real-time PCR was conducted using GoTaq® qPCR Master Mix (Promega, Madison, WI, USA) on a MiniOpticon RT-PCR system (Bio-Rad, Hercules, CA, USA). The following cycle parameters were employed: denaturation at 95 °C for 30 s, annealing at 58 °C for 30 s, and elongation at 72 °C for 30 s. Relative expression was calculated with normalization to glyceraldehyde-3-phosphate dehydrogenase (Gapdh) values using the ΔΔCt method. The sense and antisense primers utilized are listed in Table 1.

2.6. Skeletal Muscle Histology

TA samples were frozen in isopentane and cooled with liquid nitrogen for later histochemical analyses. Serial sections (10 μm) were cut transversely through the TA muscle using a refrigerated (−20 °C) cryostat microtome (OSK 97LF509; Ogawa Seiki Co., Ltd., Nakaku, Hiroshima, Japan). The sections were stained with hematoxylin and eosin (H&E) to determine the general muscle architecture and measure the mean myofiber cross-sectional area (CSA). Digital images were captured using an Olympus BX43 microscope (Olympus Corporation, Hachioji, Tokyo, Japan) equipped with an Olympus DP74 digital camera system. Image analysis and quantification were performed using ImageJ software (Ver.1.54g). For each frozen sample (n = 6), the CSA of at least 150 skeletal muscle fibers was measured.

2.7. Grip Strength Test

Grip strength was assessed using a GPM-101B grip strength meter (Melquest, Toyama, Japan) in accordance with standard protocols [36]. The mice held onto a wire grid, and the highest force exerted during tail traction was measured in grams using a digital force transducer. This measurement represents the maximum grip force exerted by the animal prior to releasing the wire grid. This procedure was repeated five times with a 1 min interval between trials. Data are presented as the mean of five measurements per mouse (n = 5). Analyses were conducted independently by multiple blinded experimenters.

2.8. Adipose Tissue Histology

The mice were deeply anesthetized with a combination of ketamine and medetomidine before undergoing intracardiac perfusion with 25 mL of PBS followed by 4% paraformaldehyde in PBS. Epididymal adipose tissue was subsequently removed and post-fixed in 4% paraformaldehyde/PBS for 48 h. Subsequently, the samples were cryoprotected by immersion in a graded sucrose (10%, 20%, and 30%, 24 h each), embedded in OCT compound (Sakura Finetek, Tokyo, Japan), and then flash-frozen in liquid nitrogen. Cryostat sections (10 μm) were cut using an OSK 97LF509 cryostat at −25 °C and then stained with H&E. Images were captured using an upright microscope equipped with a digital camera and analyzed using ImageJ software (Ver.1.54g). The CSA of at least 150 cells was measured for each frozen sample (n = 6).

2.9. Determinations of Tumor Necrosis Factor (TNF)-α and Interleukin (IL)-6 Concentrations in Plasma

Blood samples were centrifuged at 2500× g for 10 min at 4 °C using heparinized tubes. Isolated plasma was stored at −80 °C until subsequent analyses. Plasma TNF-α and IL-6 levels were quantified using a ProQuantum Immunoassay Kit (Thermo Fisher Scientific) in accordance with the manufacturer’s protocol.

2.10. Forced Swim Test (FST)

A cylindrical chamber (30 cm height × 20 cm diameter) was filled with water to a depth of 15 cm and maintained at 25 °C. On the preceding day, the mice were acclimated to the apparatus for 10 min. On the test day, the mice were subjected to a 5 min FST. Immobility time, defined as the duration of floating without active struggling, was recorded as a measure of depressive-like behavior [37]. Analyses were conducted independently by multiple blinded experimenters.

2.11. Tail Suspension Test (TST)

The mice were suspended by their tails using adhesive tape attached to a horizontal rod positioned 20 cm above the ground. The duration of the test was 6 min, during which immobility time, defined as the absence of escape-oriented behaviors, was recorded [38]. Analyses were conducted independently by multiple blinded experimenters.

2.12. Elevated Plus Maze (EPM) Test

The elevated plus maze (EPM) apparatus consisted of two opposite open arms (50 cm × 12 cm) and two enclosed arms of identical dimensions surrounded by 50 cm high walls. The central platform, facilitating movement between arms, measured 12 cm × 12 cm. The entire maze was elevated 50 cm above the ground. For the EPM test, the mice were individually placed in the central area facing a closed arm and allowed to explore for 5 min. The number of entries into and time spent in open and closed arms were recorded. Reduced time spent and decreased entries into the open arms are indicative of anxiety-like behavior [39,40]. Entry rate in the open arms (%) was determined using the following formula: (open arm crossing/total arm crossing) × 100. Analyses were conducted independently by multiple blinded experimenters.

2.13. Weight-Bearing Test

Animals were acclimatized to the testing environment for a minimum of 30 min prior to pain assessment on days 7, 14, and 21 post-inoculation. Hindlimb weight distribution was assessed using an incapacitance meter tester (Model 600M, IITC Life Science, Woodland Hills, CA, USA). The weight borne by each hindlimb was recorded in grams over a 5 s interval [36]. The mean of three measurements was calculated for each animal. The weight-bearing ratio (%) of the weight of the tumor-bearing hindlimb was determined using the following formula: (weight on the tumor-bearing hindlimb/weight on the contralateral hindlimb) × 100. Analyses were conducted independently by multiple blinded experimenters.

2.14. Statistical Analysis

Data are presented as mean ± standard error of the mean (SEM). Statistical analysis was performed using Prism 9 (GraphPad Software, Boston, MA, USA). The unpaired Student’s t-test and Mann–Whitney U test were used for normally distributed and non-normally distributed data, respectively. Differences were considered statistically significant at * p < 0.05, ** p < 0.01, *** p < 0.001, and **** p < 0.0001.

3. Results

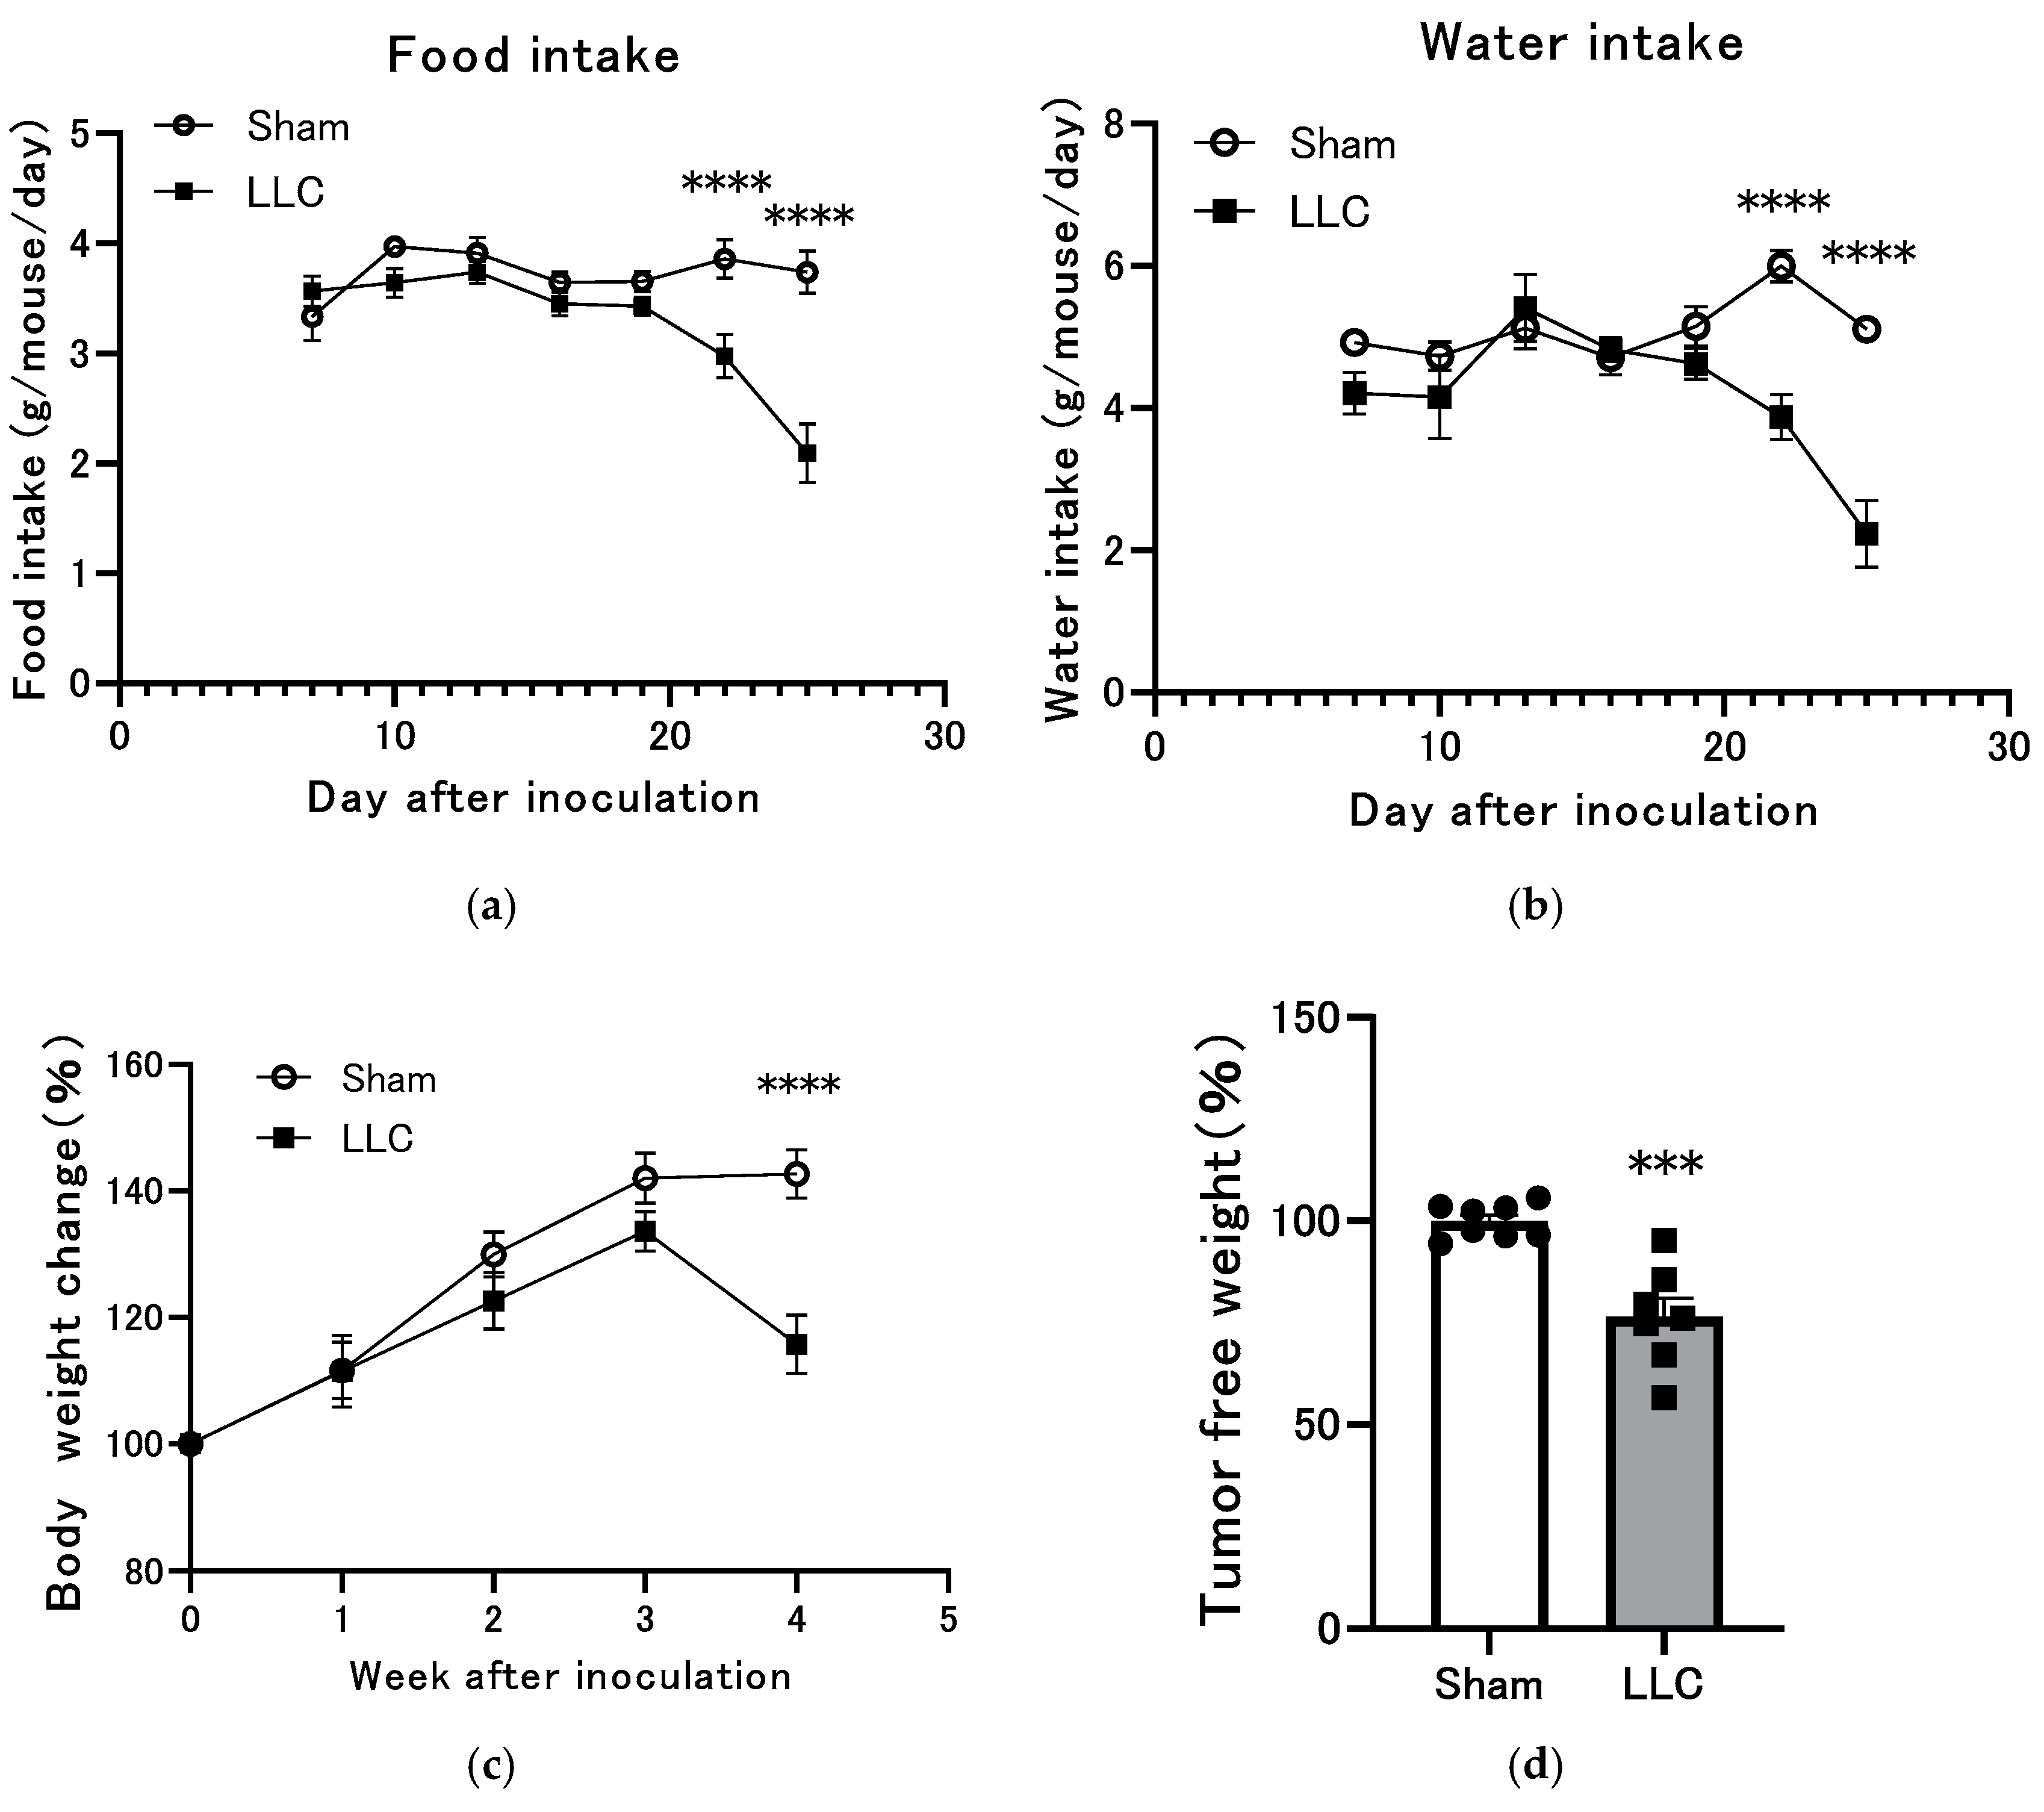
3.1. Changes in Body Weight, Food Intake, and Water Intake of Mice Implanted with LLC Tumors in the Femoral Intramedullary Space

The mice in the LLC group received a transplant of LLC cells into the femoral bone marrow cavity of the right hind limb. To evaluate the development of cachexia, food and water intake were monitored every 3 days. Both food and water intake gradually decreased in the LLC group from day 21 onward (Figure 1a,b). The mice in the LLC group exhibited significantly lower weight gain than those in the sham group from days 21 to 28 (Figure 1c). At the experimental endpoint, the mice in the LLC group displayed significantly lower body weight than those in the control group (Figure 1d). These findings collectively indicate that femoral LLC implantation induces weight loss and anorexia, which are hallmarks of cancer cachexia.

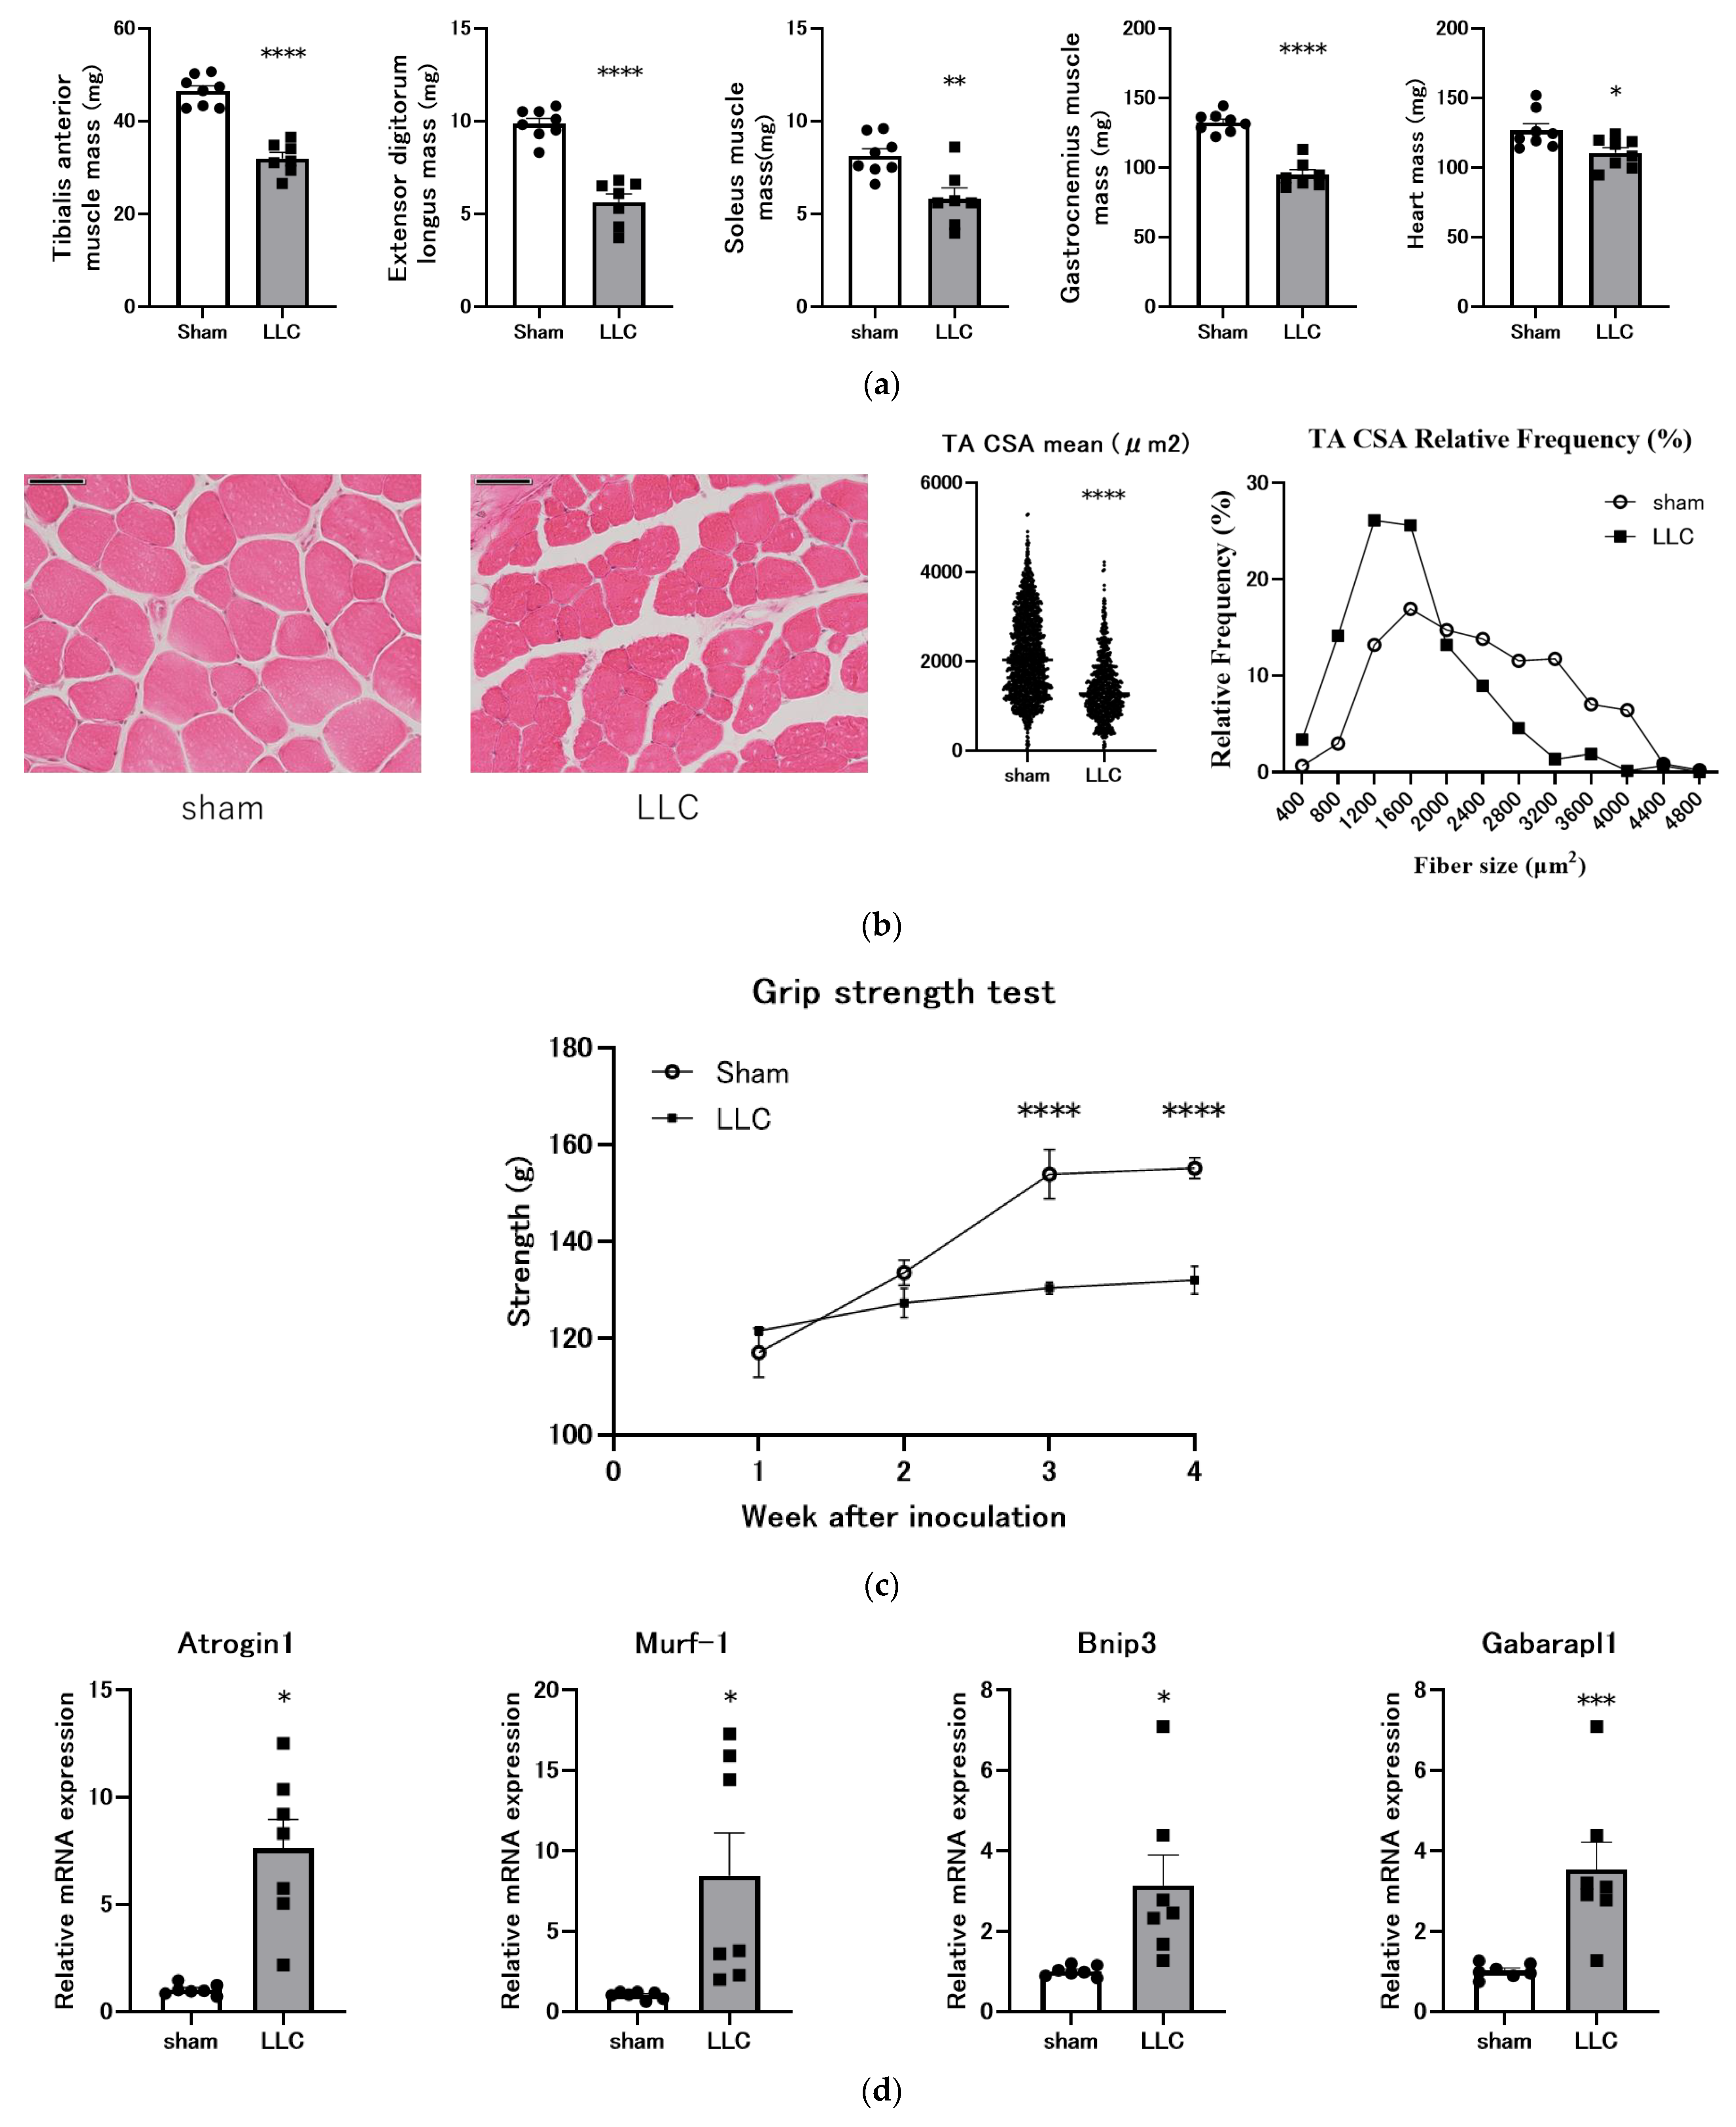
3.2. Femoral Implantation of LLC Cells Induces Progressive Skeletal Muscle Atrophy

Compared with the mice in the sham control group, the mice in the LLC group exhibited significantly lower mass of the EDL, TA, GAS, and soleus (Figure 2a). The mice in the LLC group also had significantly lower heart weights than those in the sham control group (Figure 2a). Histological analysis of the TA revealed that the myofiber CSA was significantly smaller in the LLC group than in the sham control group (Figure 2b). Additionally, grip strength was significantly lower in the LLC group than in the sham control group from 3 weeks post-implantation (Figure 2c). The mRNA expression levels of the atrophy-related genes Atrogin-1 [41], MuRF-1 [41], Bnip3 [42,43], and Gabarapl1 [42,43] were quantified in the TA to explore the potential mechanisms underlying muscle atrophy. The expression of these genes was significantly upregulated in the LLC group compared with the sham control group (Figure 2d). These findings collectively demonstrate that femoral LLC implantation induces skeletal muscle atrophy, characterized by muscle mass loss, myofiber atrophy, and increased expression of atrophy-related genes, which are consistent with the phenotype of cancer cachexia.

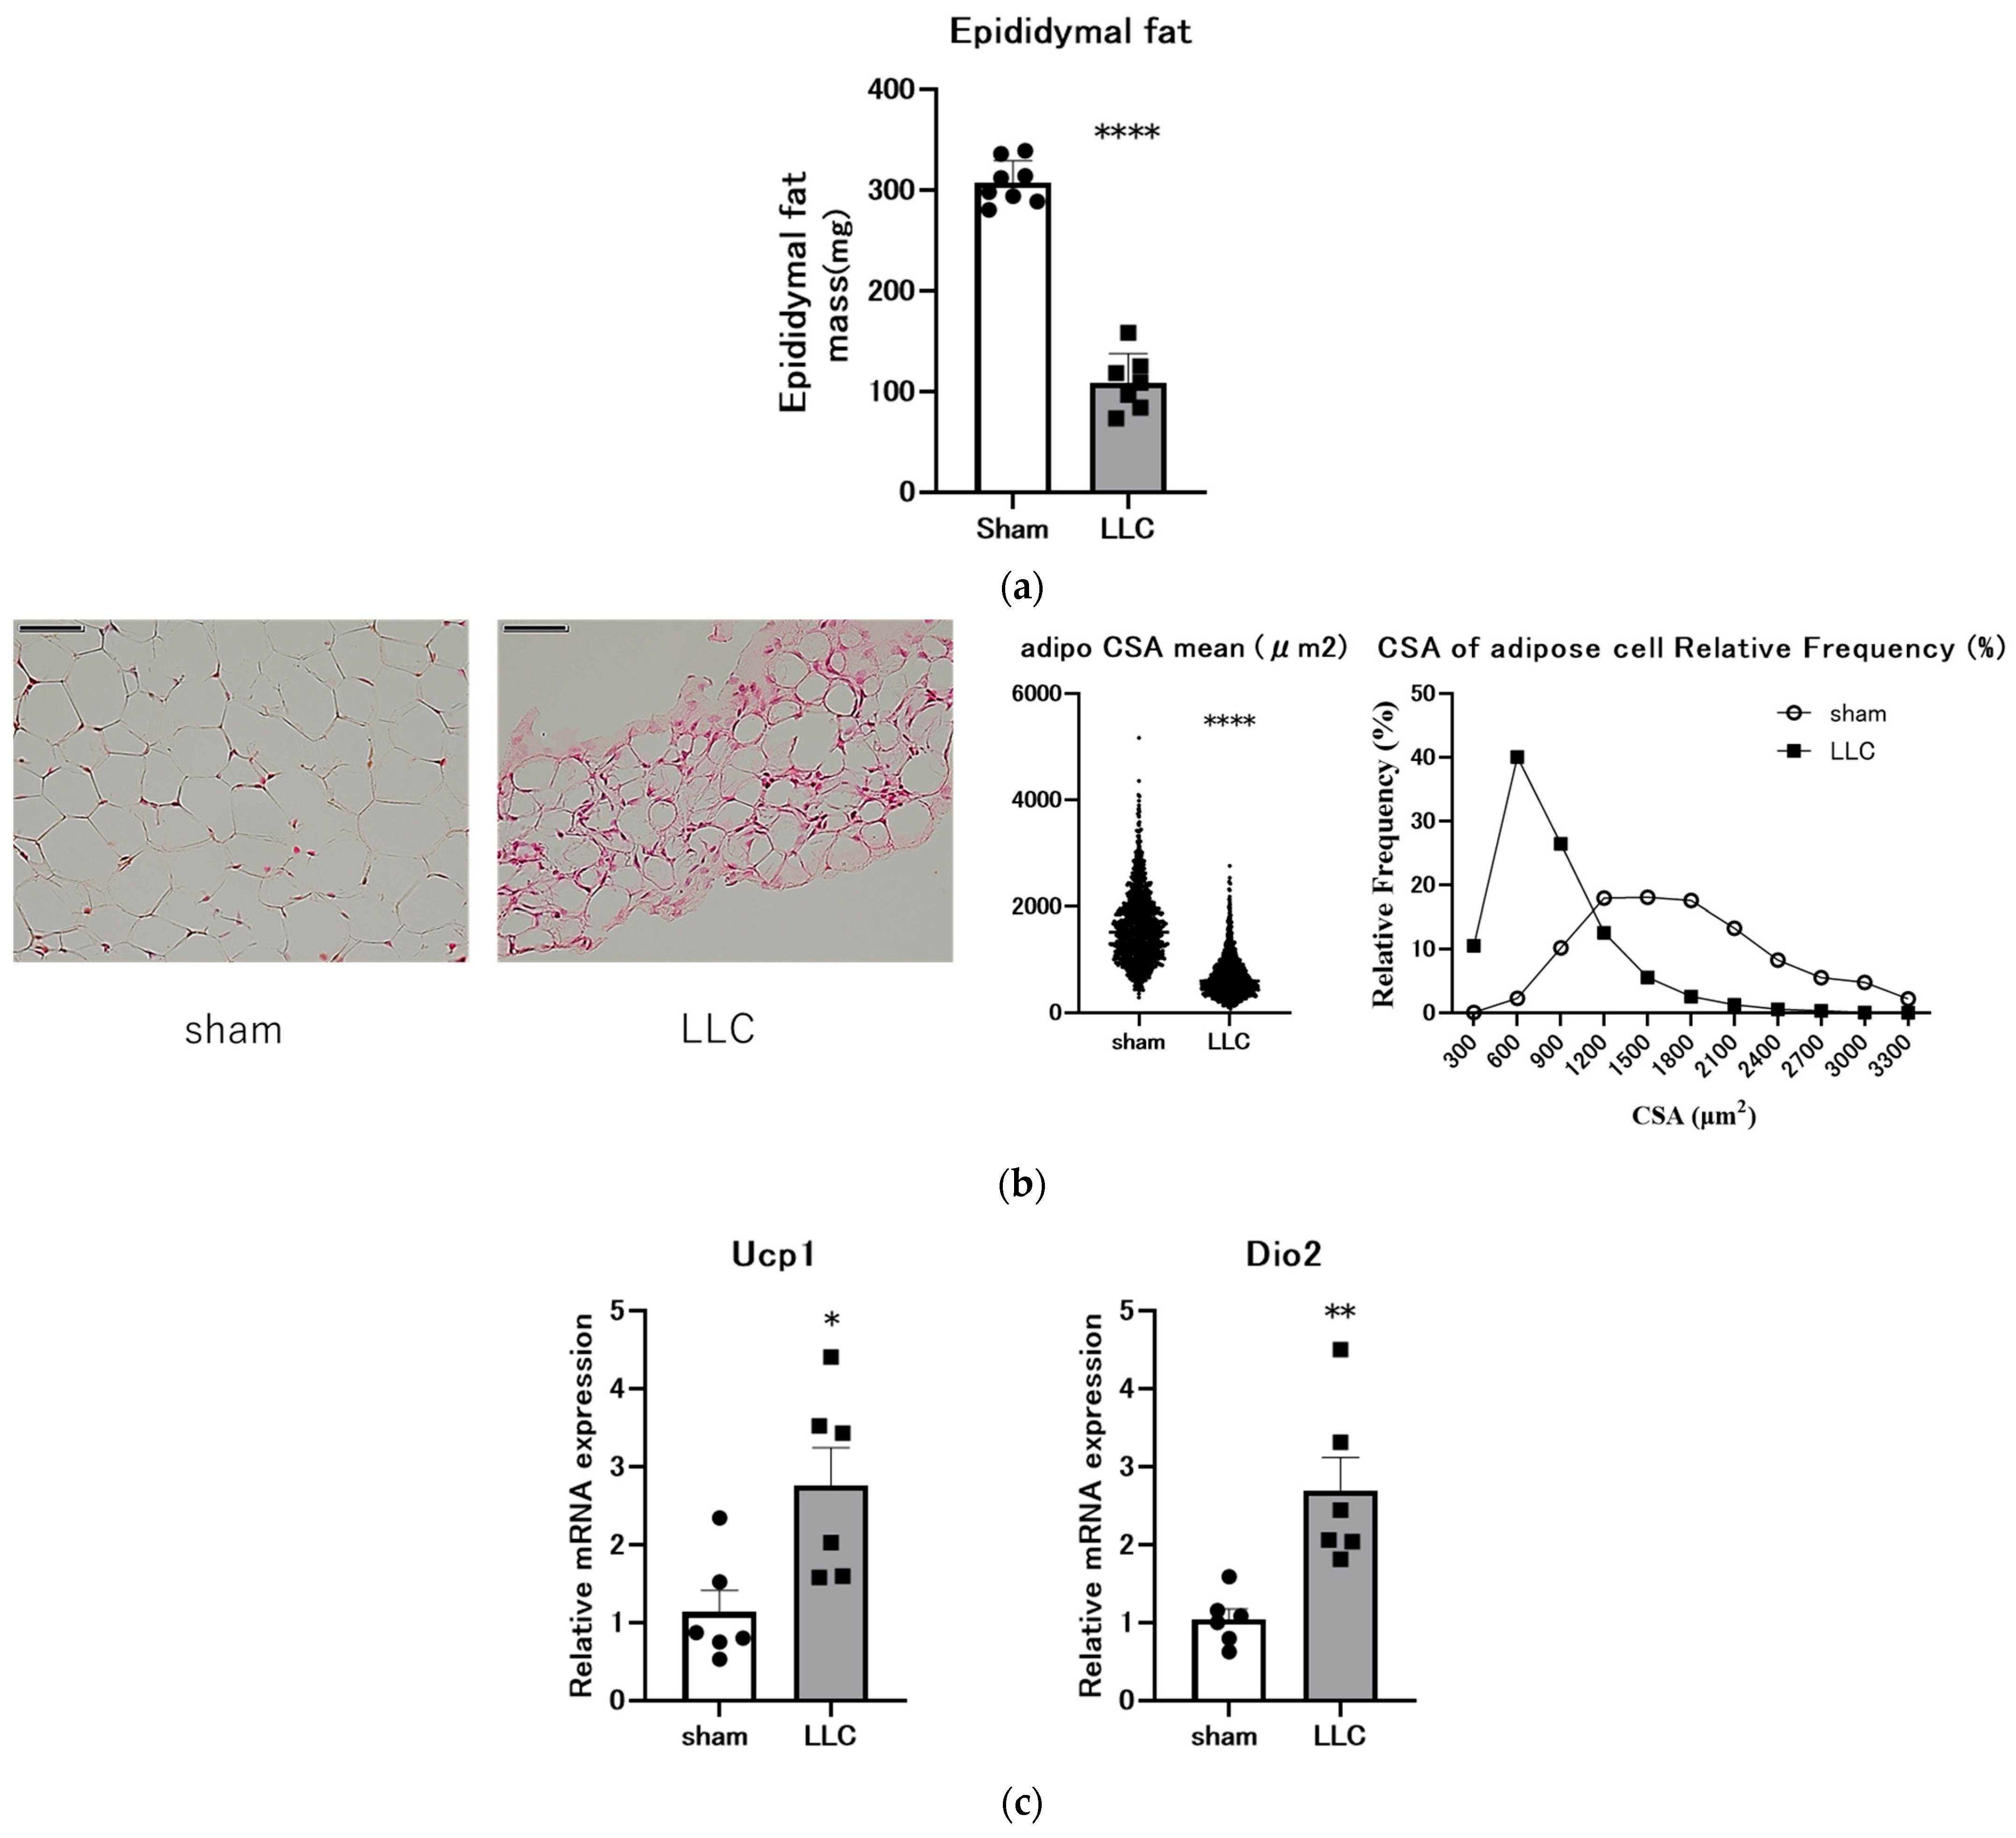
3.3. Femoral Implantation of LLC Cells Induces Adipose Tissue Loss

eWAT mass and morphology were assessed to investigate changes in adipose tissue. The mice bearing LLC exhibited a significant 67% reduction in eWAT mass compared with the sham control mice (Figure 3a). Consistent with this finding, eWAT adipocyte CSA was markedly decreased in the LLC group (Figure 3b). Moreover, the mRNA expression of the lipolytic genes Ucp1 [44,45] and Dio2 [45] was significantly upregulated in the LLC group compared with the sham control group (Figure 3c).

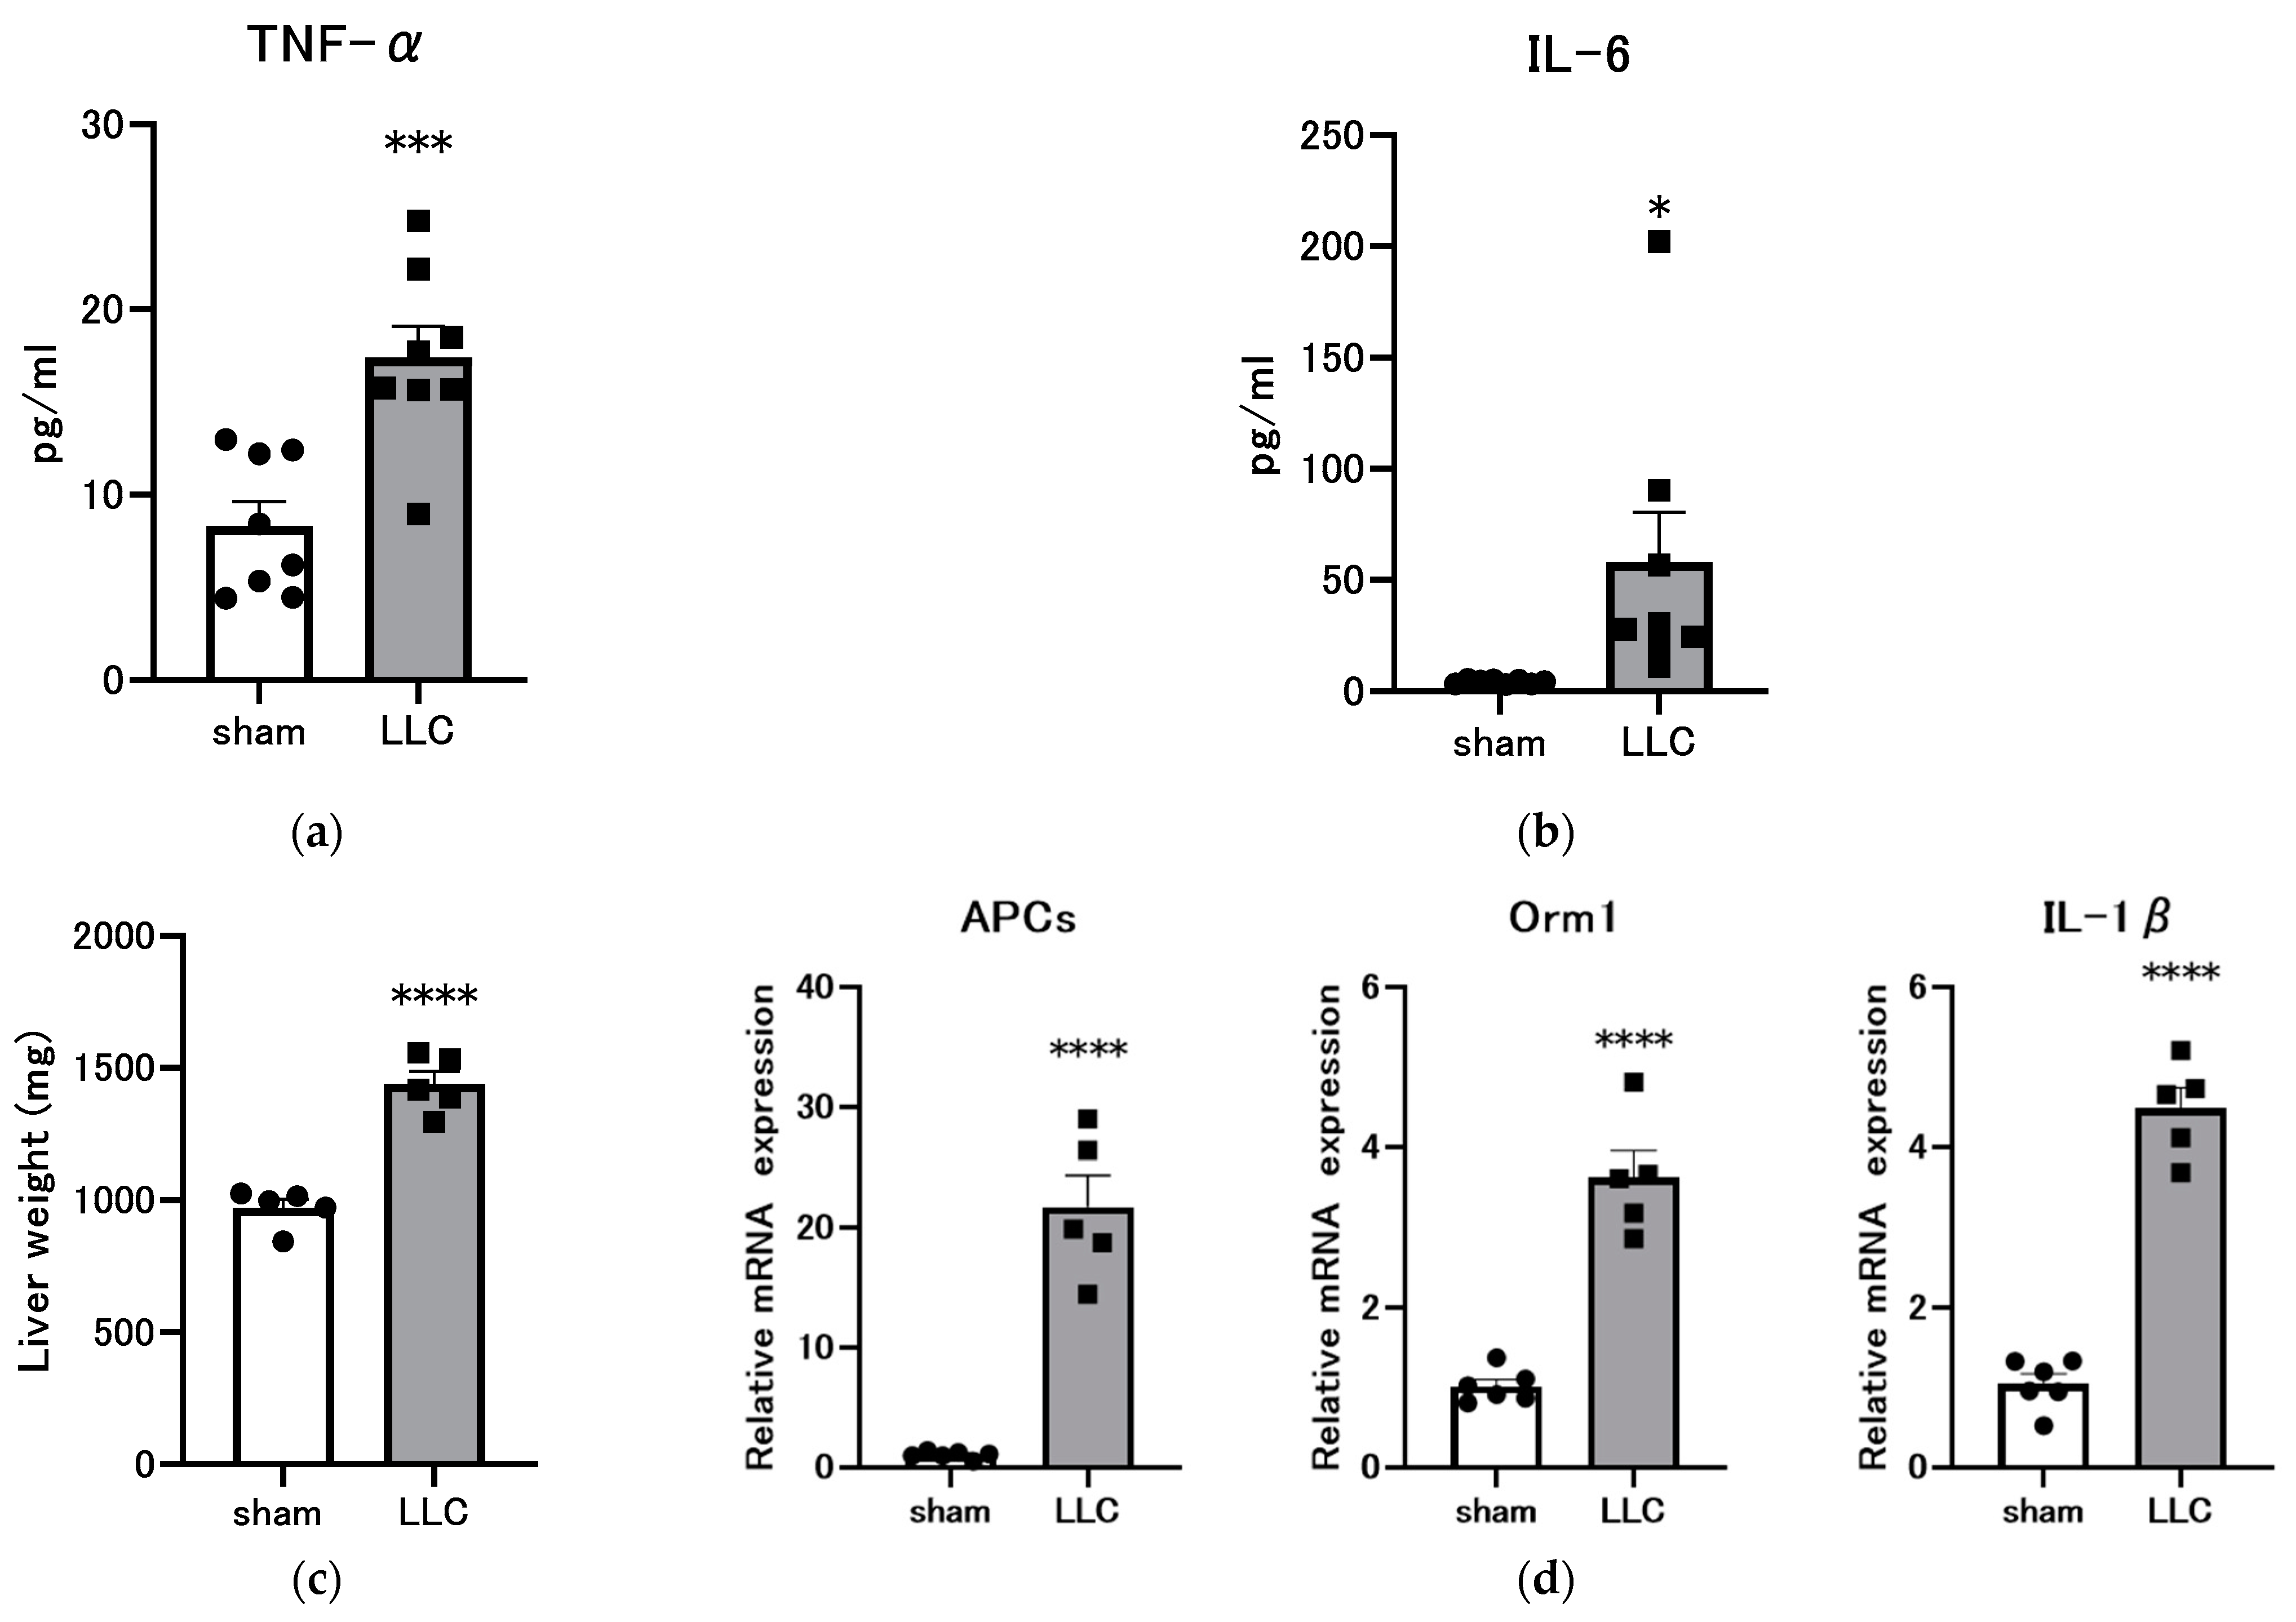
3.4. Femoral Implantation of LLC Induces a Systemic Inflammatory Response

Inflammation is a critical component of cancer cachexia, contributing to disease progression. The plasma concentrations of TNF-α and IL-6 were measured to assess inflammatory status. Results revealed that these concentrations significantly increased in the LLC group compared with the sham control group (Figure 4a,b). The liver plays a pivotal role in the pathogenesis of systemic inflammation, responding to acute and chronic inflammatory stimuli. Liver weight was significantly elevated in the LLC group compared with the sham control group (Figure 4c). The inflammatory response plays a role in the pathogenesis of cachexia by contributing to the production of proinflammatory cytokines and acute-phase proteins [46,47]. The present study focused on the acute-phase proteins pentraxin 2/APCS, homologous to human and mouse C-reactive protein, and Orm1, a recently identified appetite suppressant [46,47,48,49]. Hepatic Apcs and Orm1 levels were significantly elevated in the LLC group compared with the sham control group (Figure 4d). Additionally, hepatic IL-1β levels were markedly increased in the LLC group compared with the sham control group (Figure 4d).

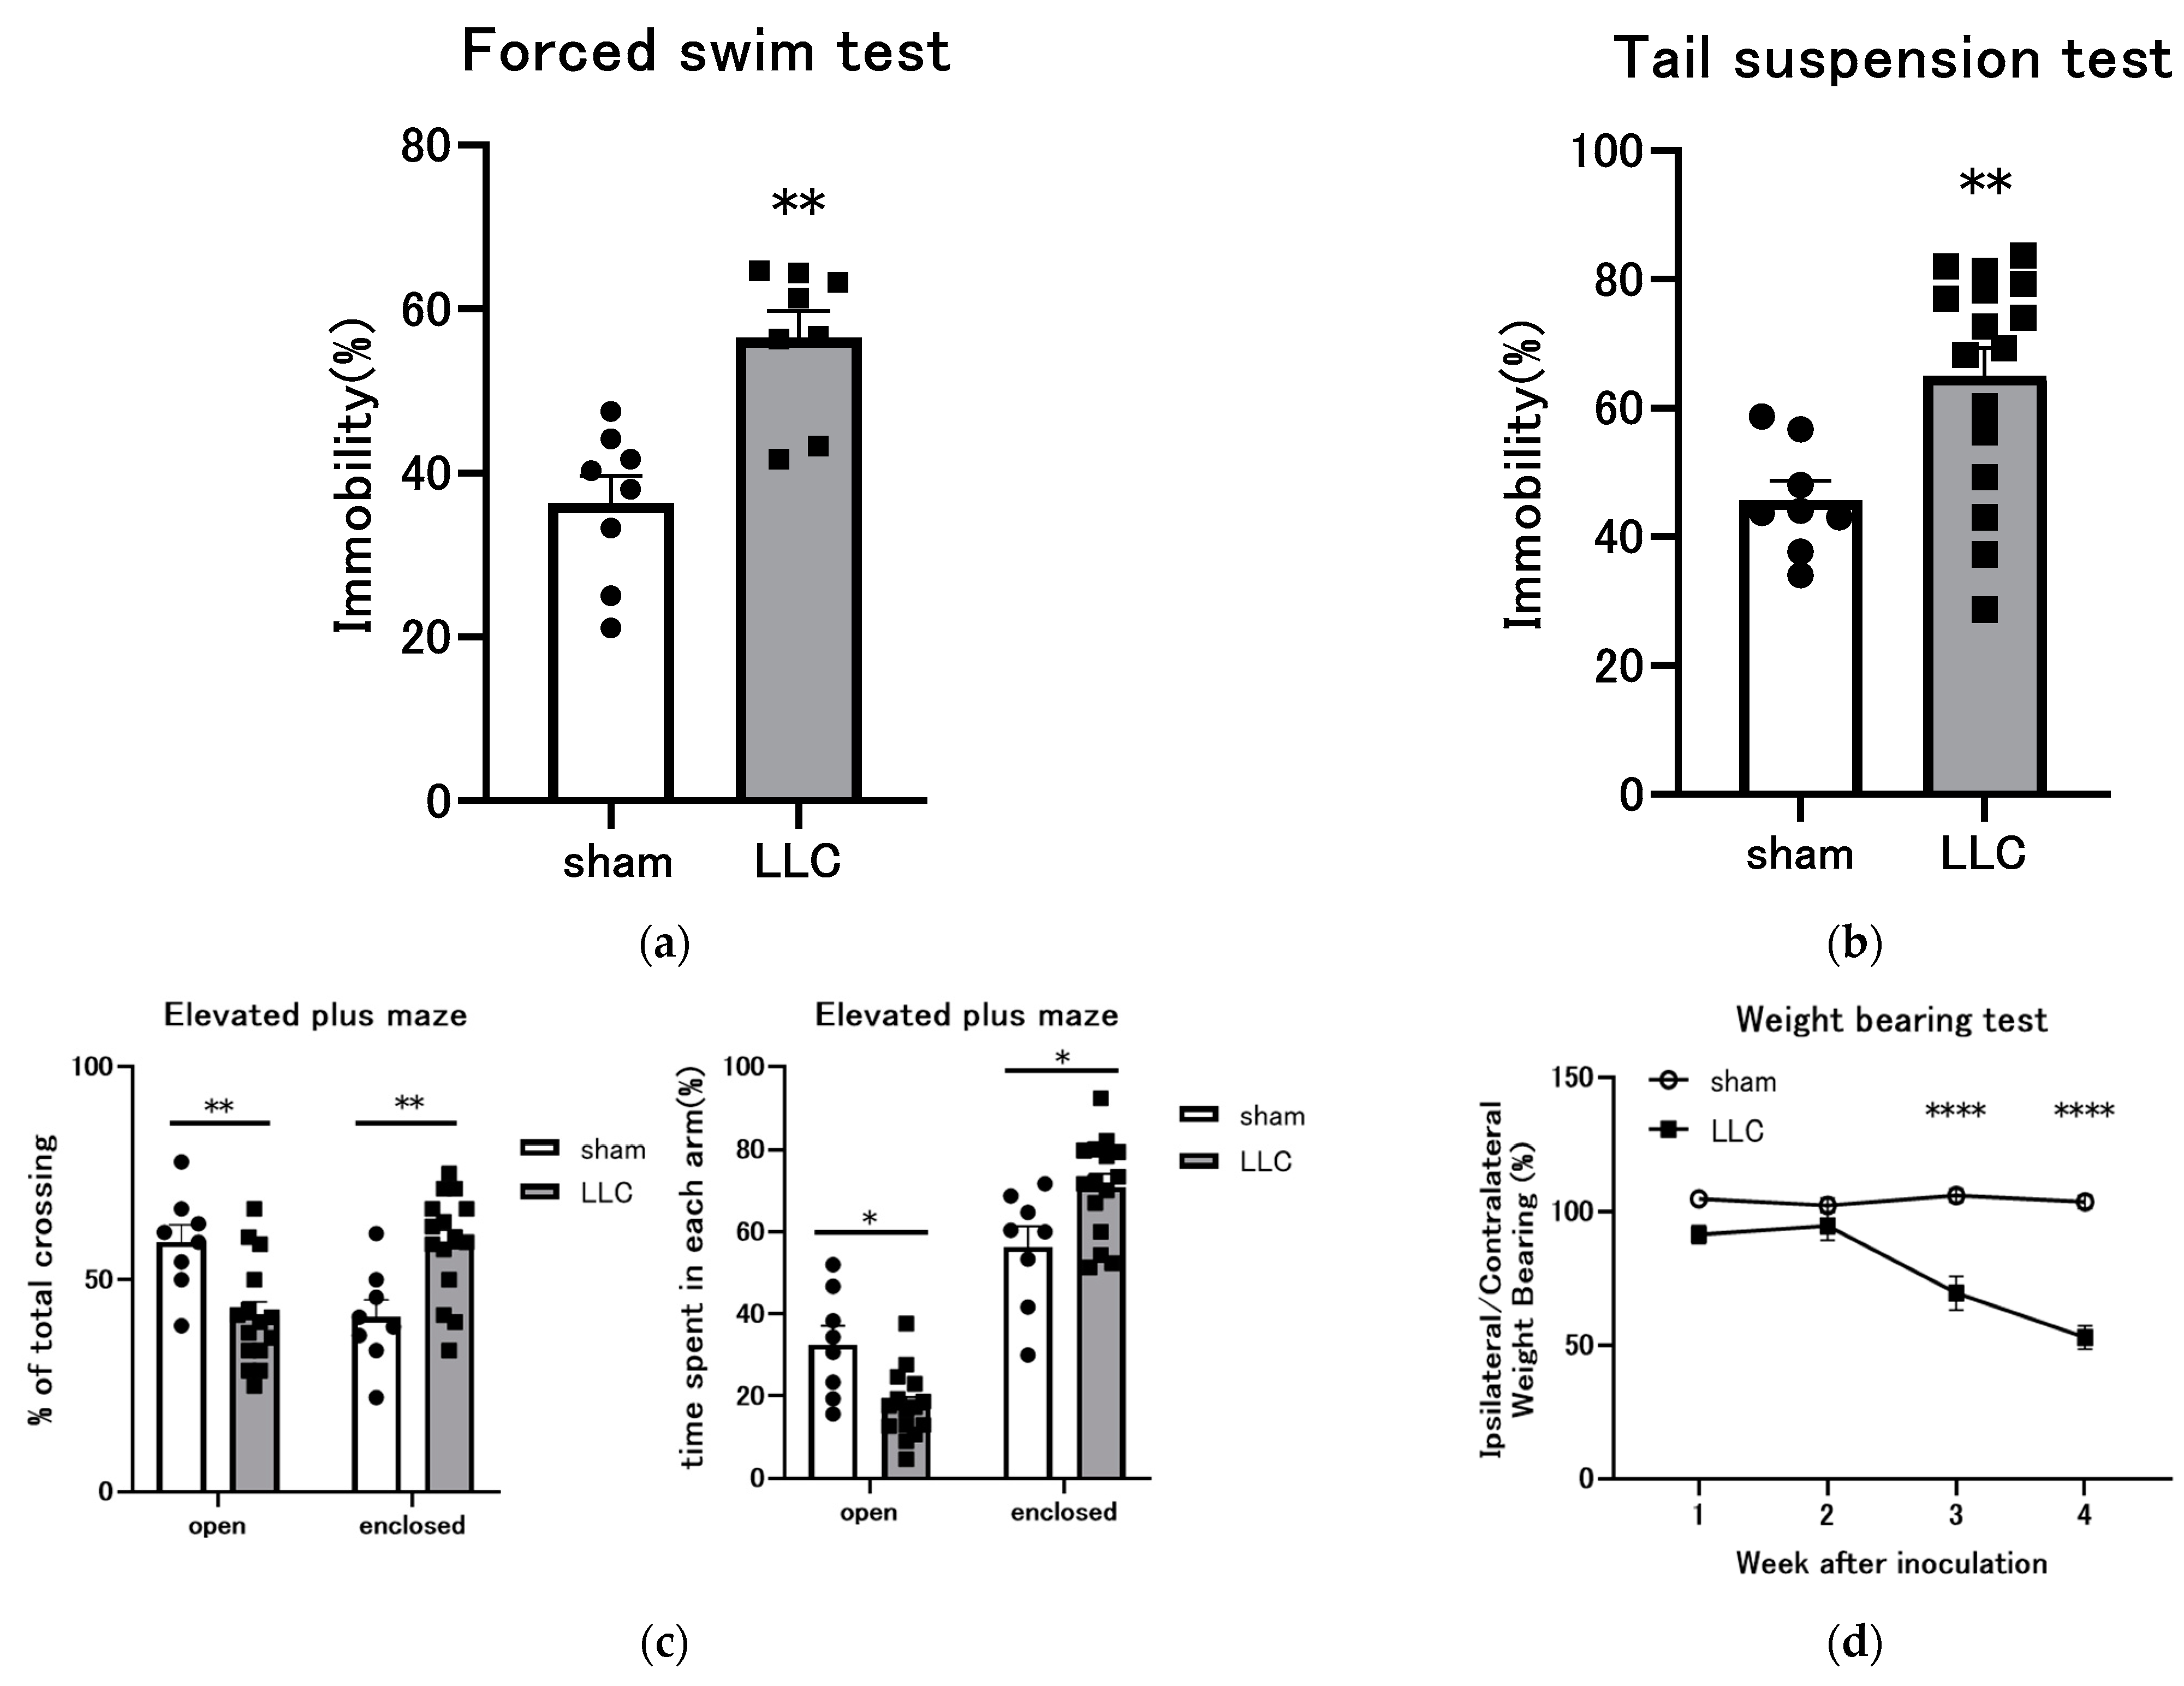
3.5. Behavioral Experiments Were Conducted on Mice with LLC Cells Implanted in the Femoral Bone Marrow Cavity

Behavioral experiments were conducted on mice with LLC cells implanted in the femoral bone marrow cavity to assess the development of psychiatric symptoms associated with cachexia. FST and TST are well-established behavioral paradigms in rodents commonly used to assess depression-like behaviors [37,38]. FST and TST results showed that the immobility time was significantly longer in the LLC group than in the sham group (Figure 5a,b). Prolonged immobility time is indicative of an increase in depression-like symptoms. The EPM is a commonly utilized animal test in neuroscience to assess anxiety-related behaviors [39,40]. As shown in Figure 5c, shortened open-arm exploration time and reduced entries into the open arms of the EPM indicate increased anxiety-like behavior. Effects on weight-bearing distribution in the LLC model were analyzed using an incapacitance meter tester. In this test, the assessment of static hindlimb weight-bearing asymmetry serves as an indirect measure of pain. Unilateral femoral intramedullary injection of LLC cells resulted in progressive weight-bearing reduction on the ipsilateral hindlimb. A significant decrease in weight-bearing was observed on the ipsilateral hindlimb 3 weeks post-inoculation in the LLC group compared with the sham group, suggesting increased discomfort associated with limb weight-bearing in the LLC group (Figure 5d).

4. Discussion

Recent advancements in understanding the pathophysiology of cancer cachexia have identified potential therapeutic targets, including tumor-derived mediators such as leukemia inhibitory factor (LIF) [50], zinc alpha glycoprotein (ZAG) [51,52], activin A [53], and growth differentiation factor 15 (GDF-15) [54,55]. In addition to targeting tumor-derived factors, anti-inflammatory agents, beta-blockers [14,15,56,57], and compounds such as enobosarm [14,58] and anamorelin [16,17,18,59] have shown promise in preclinical models. However, they have limited clinical applications for mitigating cachexia symptoms. Despite recent advances, current therapeutic strategies have limited efficacy in fully reversing cancer cachexia. This is primarily due to an incomplete understanding of the underlying pathophysiological mechanisms. Preclinical models are essential for elucidating the complexities of cachexia and identifying novel therapeutic targets. Therefore, preclinical research must be intensified to identify compounds with translational potential. In this study, we developed a CIBP model by injecting LLC cells into the intramedullary cavity of the femur and evaluated the manifestation of cachexia-related symptoms in this model.
Compared with the sham operation, transplantation of LLC cells into the femur led to significant weight loss and decreased consumption of food and water (Figure 1a–d). The results demonstrate the significant impact of LLC transplantation to the femoral bone marrow cavity on body weight and food intake, highlighting the importance of this model in studying cachexia-related outcomes. Cancer-related anorexia is a prevalent complication in advanced cancer, affecting a substantial proportion of patients [60,61]. This condition contributes significantly to weight loss and the development of cachexia and sarcopenia [59]. Anorexia in patients with cancer is multifaceted, with contributing factors including nausea, altered taste, constipation, fatigue, pain, and depression [1]. Anorexia and associated weight loss are independently associated with poor prognosis and accelerated disease progression [62]. Moreover, a multi-institutional study has linked weight loss, decreased grip strength, anorexia, and fatigue to diminished quality of life in patients with advanced cancer [63]. In the present study, the LLC group exhibited a temporal progression of symptoms, with pain and decreased grip strength emerging at 3 weeks after transplantation, followed by changes in mental status at 4 weeks after transplantation. These combined factors may have contributed to the decline in food and water consumption after day 21 (Figure 1a,b, Figure 2c, and Figure 5a–d).
Skeletal muscle loss is a key feature of cancer cachexia. Consistent with various animal models of cachexia [22,25,26,27,29] and cancer cachexia in patients with cancer [5,64], the model established in the present study showed a significant reduction in muscle mass (Figure 2a,b). Assessment of sarcopenia by measuring grip strength or skeletal muscle mass is critical for the clinical evaluation of cachexia. Notably, skeletal muscle mass is a prognostic indicator of mortality in cancer cachexia [5,65,66]. Cardiac muscles are also affected by cancer cachexia. Patients with cancer cachexia exhibit reduced cardiac mass and impaired left ventricular systolic function, often presenting with dyspnea, decreased exercise tolerance, and fatigue [67]. Preclinical studies have reported reduced heart size and wall thickness in cachectic animal models, supporting these clinical observations [68,69]. In the present study, the mice in the LLC group exhibited a lower mass of various skeletal muscles and the heart than those in the sham control group (Figure 2a). The quantification of TA myofiber CSA by H&E staining demonstrated that the mean myofiber CSA was diminished in the LLC group relative to the sham group (Figure 2b). Moreover, the muscle mass loss was functionally reflected by decreased grip strength (Figure 2c). Metabolic dysfunction of skeletal muscle represents a significant contributing factor to skeletal atrophy, which is characterized by increased protein degradation [70]. These processes are primarily mediated by the ubiquitin–proteasome and autophagy–lysosome pathways. Upregulation of E3 ubiquitin ligases, including MuRF1 and Atrogin-1, is a hallmark of muscle atrophy [71]. Additionally, autophagy, an intracellular degradation process, is activated in muscle-wasting conditions and is associated with increased expression of autophagy markers such as BNIP3 and LC3B in patients with cancer [42,43]. Examining TA muscles for the expression of muscle atrophy-related genes revealed higher expression levels in the LLC group compared with the sham group (Figure 2d). These findings underscore the complex interplay among muscle mass, grip strength, and muscle atrophy-related gene expression in this model.
In addition to skeletal muscle wasting, adipose tissue atrophy represents a pivotal element of weight loss in cancer cachexia. Browning of white adipose tissue is a systemic feature of cachexia, contributing to increased thermogenic energy expenditure and negative energy balance. Patients with cancer cachexia exhibit a high prevalence of beige adipocytes, and increased brown adipose mass is associated with poor prognosis [71,72]. WAT browning, characterized by increased beige adipocyte number and UCP1 expression, accelerates energy expenditure and exacerbates cachexia progression [44,45]. In the present study, eWAT mass and CSA were significantly decreased in the LLC group compared with the sham group (Figure 3a,b). Furthermore, the mRNA expression of the lipolysis-related genes Ucp1 and Dio2 was elevated in the LLC group compared with the sham group (Figure 3c). These results indicate that tumor growth on the femur significantly alters eWAT properties and upregulates lipolysis-related gene expression in this model.
Chronic inflammation is characterized by elevated levels of proinflammatory cytokines. Proinflammatory cytokines, including C-reactive protein (CRP), TNF-α, and IL-6, contribute to muscle wasting and adversely affect patient survival [73,74,75]. Additionally, these proinflammatory cytokines are instrumental in the emergence of secondary nutritional impact symptoms (s-NIS), including early satiety, pain, constipation, depression, and nausea [76]. Femoral bone marrow cavity implantation of LLC cells induced a systemic inflammatory response characterized by elevated circulating levels of inflammatory cytokines, including TNF-α and IL-6 (Figure 4a,b). Hepatomegaly was observed in the LLC-bearing mice (Figure 4c). The liver plays a role in the development of the systemic inflammatory phenotype of cachexia. This is achieved through the production of acute-phase proteins and proinflammatory cytokines [46,47]. We observed significant increases in the levels of acute-phase proteins mRNA (Apcs and Orm1) and IL-1β in the LLC group (Figure 4d). APCS, the murine homolog of human C-reactive protein, is a major acute-phase reactant primarily induced by IL-6 [47,48,77]. Another acute-phase protein, ORM1, is a potential contributor to anorexia through its role in the excessive activation of hypothalamic leptin receptor signaling [48,49]. In the present study, both Apcs and Orm1 were induced, suggesting the activation of systemic inflammatory and anorexia-inducing pathways. Furthermore, hepatic IL-1β induction supports the role of the liver as a central inflammatory site in this model.
Patients with cancer cachexia frequently present with a constellation of symptoms that have a detrimental impact on appetite. Nutritional symptoms that may be affected by the disease process include unrelieved pain, early satiety, chronic nausea, anxiety, depression, and asthenia [13,78,79]. Psychological symptoms (s-NIS) have been well characterized in previous studies using the CIBP model [34,35]. Therefore, a series of behavioral experiments were conducted to assess whether these symptoms also occur in this model. TST and FST results showed that the mice with LLC implanted in the femoral bone marrow cavity showed prolonged immobility time, suggesting depression-like behavior (Figure 5a,b). Additionally, the mice exhibited a diminished tendency to explore the open arms of the EPM, which is indicative of elevated anxiety (Figure 5c). Finally, weight-bearing asymmetry was present in the hind limbs of the mice treated with LLC. This result indicates that the pain experienced by the mice altered the weight applied to the limb, resulting in increased discomfort (Figure 5d). The results of these experiments demonstrate that this CIBP model also exhibits complex behavioral phenotypes characterized by depression, anxiety, and pain-like behaviors. Several studies suggest that the presence of pain is associated with depression, reduced energy intake, reduced physical activity, fatigue, and muscle weakness, all of which may contribute to cachexia [80,81,82]. Given the heterogeneous nature of cancer and the multifaceted pathophysiology of cachexia, a comprehensive understanding of the underlying mechanisms may require the evaluation and validation of pathomechanisms in multiple models rather than relying on a standardized paradigm (Table 2). The CIBP model could serve as a novel tool for cachexia research and may help elucidate the mechanisms underlying basic cachexia symptoms, s-NIS, and cachexia symptoms associated with cancer-related pain. Considering the multifactorial nature of cancer cachexia, investigators must understand the characteristics of available models to select the appropriate one for hypothesis formation. In conclusion, the present study has demonstrated whether the CIBP mouse model, which recapitulates s-NIS (pain, depression, and anxiety), exhibits various features of cachexia. The model offers a valuable platform for advancing cancer cachexia research, facilitating a deeper understanding of the etiology of cachexia and the development and evaluation of novel intervention strategies.

Author Contributions

T.H. and T.M. conceived and designed the experiments. T.M., K.K., and Y.A. performed the experiments. T.H. and K.S. analyzed the data. T.H., K.K., K.S., and T.M. contributed reagents/materials/analysis tools. T.H., K.K., K.S., and T.M. wrote the paper. All authors have read and agreed to the published version of the manuscript.

Funding

This research was funded by JSPS KAKENHI Grant Number 19K16964.

Institutional Review Board Statement

The animal study protocol was approved by the Animal Care and Use Committee of Niigata University of Pharmacy and Medical and Life Sciences and was conducted in accordance with the institution’s guidelines for the care and use of laboratory animals (permit number 21-7). Euthanasia was performed according to humane endpoints.

Informed Consent Statement

Not applicable.

Data Availability Statement

All study data are included in the main text.

Conflicts of Interest

The authors declare no conflicts of interest. The funders had no role in the design of the study; in the collection, analyses, or interpretation of data; in the writing of the manuscript; or in the decision to publish the results.

References

  1. Peixoto da Silva, S.; Santos, J.M.O.; Costa, E.; Silva, M.P.; da Costa, R.M.G.; Medeiros, R. Cancer cachexia and its pathophysiology: Links with sarcopenia, anorexia and asthenia. J. Cachexia Sarcopenia Muscle 2020, 11, 619–635. [Google Scholar] [CrossRef] [PubMed]
  2. Ni, J.; Zhang, L. Cancer Cachexia: Definition, Staging, and Emerging Treatments. CMAR 2020, 12, 5597–5605. [Google Scholar] [CrossRef] [PubMed]
  3. Ferrer, M.; Anthony, T.G.; Ayres, J.S.; Biffi, G.; Brown, J.C.; Caan, B.J.; Feliciano, E.M.; Coll, A.P.; Dunne, R.F.; Goncalves, M.D.; et al. Cachexia: A systemic consequence of progressive, unresolved disease. Cell 2023, 186, 1824–1845. [Google Scholar] [CrossRef]
  4. Myrianthefs, P.M.; Batistaki, C. Cancer cachexia and immunomodulation. J. BUON 2005, 10, 181–188. [Google Scholar] [PubMed]
  5. Fearon, K.; Strasser, F.; Anker, S.D.; Bosaeus, I.; Bruera, E.; Fainsinger, R.L.; Jatoi, A.; Loprinzi, C.; MacDonald, N.; Mantovani, G.; et al. Definition and classification of cancer cachexia: An international consensus. Lancet Oncol. 2011, 12, 489–495. [Google Scholar] [CrossRef]
  6. Lim, S.; Brown, J.L.; Washington, T.A.; Greene, N.P. Development and Progression of Cancer Cachexia: Perspectives from Bench to Bedside. Sports Med. Health Sci. 2020, 2, 177–185. [Google Scholar] [CrossRef] [PubMed]
  7. Jafri, S.H.R.; Previgliano, C.; Khandelwal, K.; Shi, R. Cachexia Index in Advanced Non-Small-Cell Lung Cancer Patients. Clin. Med. Insights Oncol. 2015, 6, 107–115. [Google Scholar] [CrossRef]
  8. Setiawan, T.; Sari, I.N.; Wijaya, Y.T.; Julianto, N.M.; Muhammad, J.A.; Lee, H.; Chae, J.H.; Kwon, H.Y. Cancer Cachexia: Molecular Mechanisms and Treatment Strategies. J. Hematol. Oncol. 2023, 16, 54. [Google Scholar] [CrossRef]
  9. Law, M.L. Cancer cachexia: Pathophysiology and association with cancer-related pain. Front. Pain Res. 2022, 3, 971295. [Google Scholar] [CrossRef]
  10. Vaughan, V.C.; Martin, P.; Lewandowski, P.A. Cancer cachexia: Impact, mechanisms and emerging treatments. J. Cachexia Sarcopenia Muscle 2013, 4, 95–109. [Google Scholar] [CrossRef]
  11. Tisdale, M.J. Pathogenesis of cancer cachexia. J. Support. Oncol. 2003, 1, 159–168. [Google Scholar] [PubMed]
  12. Shyh-Chang, N. Metabolic changes during cancer cachexia pathogenesis. In Translational Research in Breast Cancer: Biomarker Diagnosis, Targeted Therapies and Approaches to Precision Medicine; Springer: Singapore, 2017; pp. 233–249. [Google Scholar]
  13. Arends, J.; Strasser, F.; Gonella, S.; Solheim, T.S.; Madeddu, C.; Ravasco, P.; Buonaccorso, L.; de van der Schueren, M.A.E.; Baldwin, C.; Chasen, M.; et al. Cancer cachexia in adult patients: ESMO Clinical Practice Guidelines. ESMO Open 2021, 6, 100092. [Google Scholar] [CrossRef] [PubMed]
  14. Advani, S.M.; Advani, P.G.; VonVille, H.M.; Jafri, S.H. Pharmacological management of cachexia in adult cancer patients: A systematic review of clinical trials. BMC Cancer 2018, 18, 1174. [Google Scholar] [CrossRef] [PubMed]
  15. Pandey, S.; Bradley, L.; Del Fabbro, E. Updates in Cancer Cachexia: Clinical Management and Pharmacologic Interventions. Cancers 2024, 16, 1696. [Google Scholar] [CrossRef] [PubMed]
  16. Wakabayashi, H.; Arai, H.; Inui, A. The regulatory approval of anamorelin for treatment of cachexia in patients with non-small cell lung cancer, gastric cancer, pancreatic cancer, and colorectal cancer in Japan: Facts and numbers. J. Cachexia Sarcopenia Muscle 2021, 12, 14–16. [Google Scholar] [CrossRef]
  17. Takayama, K.; Katakami, N.; Yokoyama, T.; Atagi, S.; Yoshimori, K.; Kagamu, H.; Saito, H.; Takiguchi, Y.; Aoe, K.; Koyama, A.; et al. Anamorelin (ONO-7643) in Japanese patients with non-small cell lung cancer and cachexia: Results of a randomized phase 2 trial. Support. Care Cancer Off. J. Multinatl. Assoc. Support. Care Cancer 2016, 24, 3495–3505. [Google Scholar] [CrossRef]
  18. Katakami, N.; Uchino, J.; Yokoyama, T.; Naito, T.; Kondo, M.; Yamada, K.; Kitajima, H.; Yoshimori, K.; Sato, K.; Saito, H.; et al. Anamorelin (ONO-7643) for the treatment of patients with non-small cell lung cancer and cachexia: Results from a randomized, double-blind, placebo-controlled, multicenter study of Japanese patients (ONO-7643-04). Cancer 2017, 124, 606–616. [Google Scholar] [CrossRef] [PubMed]
  19. European Medicine Agency. Assessment Report–Aldumiz. Available online: https://www.ema.europa.eu/en/documents/assessment-report/adlumiz-epar-refusal-public-assessment-report_en.pdf (accessed on 19 August 2024).
  20. Kojima, K.; Furukawa, S.; Ishikawa, T.; Inoue, S. First case report of anamorelin-induced fatal arrhythmia complicated by sinus arrest and refractory ventricular tachycardia. Heart Case Rep. 2023, 9, 185–189. [Google Scholar] [CrossRef]
  21. Hamauchi, S.; Furuse, J.; Takano, T.; Munemoto, Y.; Furuya, K.; Baba, H.; Takeuchi, M.; Choda, Y.; Higashiguchi, T.; Naito, T.; et al. A multicenter, open-label, single-arm study of anamorelin (ONO-7643) in advanced gastrointestinal cancer patients with cancer cachexia. Cancer 2019, 125, 4294–4302. [Google Scholar] [CrossRef]
  22. Aulino, P.; Berardi, E.; Cardillo, V.M.; Rizzuto, E.; Perniconi, B.; Ramina, C.; Padula, F.; Spugnini, E.P.; Baldi, A.; Faiola, F.; et al. Molecular, cellular and physiological characterization of the cancer cachexia-inducing C26 colon carcinoma in mouse. BMC Cancer 2010, 10, 363. [Google Scholar] [CrossRef]
  23. Matthys, P.; Heremans, H.; Opdenakker, G.; Billiau, A. Anti-interferon-gamma antibody treatment, growth of Lewis lung tumours in mice and tumour-associated cachexia. Eur. J. Cancer 1991, 27, 182–187. [Google Scholar] [CrossRef] [PubMed]
  24. Voltarelli, F.A.; Frajacomo, F.T.; Padilha, C.d.S.; Testa, M.T.J.; Cella, P.S.; Ribeiro, D.F.; de Oliveira, D.X.; Veronez, L.C.; Bisson, G.S.; Moura, F.A.; et al. Syngeneic B16F10 Melanoma Causes Cachexia and Impaired Skeletal Muscle Strength and Locomotor Activity in Mice. Front. Physiol. 2017, 8, 715. [Google Scholar] [CrossRef] [PubMed]
  25. Terawaki, K.; Sawada, Y.; Kashiwase, Y.; Hashimoto, H.; Yoshimura, M.; Suzuki, M.; Miyano, K.; Sudo, Y.; Shiraishi, S.; Higami, Y.; et al. New cancer cachexia rat model generated by implantation of a peritoneal dissemination-derived human stomach cancer cell line. Am. J. Physiol. Endocrinol. Metab. 2014, 306, E373–E387. [Google Scholar] [CrossRef]
  26. Costelli, P.; Llovera, M.; Carbo, N.; Garcia-Martinez, C.; Lopez-Sorianoq, F.J.; Argiles, J.M. Interleukin-1 receptor antagonist (IL-1ra) is unable to reverse cachexia in rats bearing an ascites hepatoma (Yoshida AH-130). Cancer Lett. 1995, 95, 33–38. [Google Scholar] [CrossRef] [PubMed]
  27. Baltgalvis, K.A.; Berger, F.G.; Peña, M.M.; Mark Davis, J.; White, J.P.; Carson, J.A. Activity level, apoptosis, and development of cachexia in Apc(Min/+) mice. J. Appl. Physiol. 2010, 109, 1155–1161. [Google Scholar] [CrossRef]
  28. Coerver, K.A.; Woodruff, T.K.; Finegold, M.J.; Mather, J.; Bradley, A.; Matzuk, M.M. Activin signaling through activin receptor type II causes the cachexia-like symptoms in inhibin-deficient mice. Mol. Endocrinol. 1996, 10, 534–543. [Google Scholar] [PubMed]
  29. Talbert, E.E.; Cuitino, M.C.; Ladner, K.J.; Rajasekerea, P.V.; Siebert, M.; Shakya, R.; Leone, G.W.; Ostrowski, M.C.; Paleo, B.; Weisleder, N.; et al. Modeling Human Cancer-induced Cachexia. Cell Rep. 2019, 28, 1612–1622. [Google Scholar] [CrossRef] [PubMed]
  30. Nielsen, O.S.; Munro, A.J.; Tannock, I.F. Bone metastases: Pathophysiology and management policy. J. Clin. Oncol. 1991, 9, 509–524. [Google Scholar]
  31. Costantini, M.; Ripamonti, C.; Beccaro, M.; Montella, M.; Borgia, P.; Casella, C.; Miccinesi, G. Prevalence, distress, management, and relief of pain during the last3 months of cancer patients’ life. Results of an Italian mortality follow-backsurvey. Ann. Oncol. 2009, 20, 729–735. [Google Scholar] [CrossRef]
  32. Van den Beuken-van Everdingen, M.H.J.; De Rijke, J.M.; Kessels, A.G.; Schouten, H.C.; Van Kleef, M.; Patijn, J. Prevalence of pain in patients with cancer: Asystematic review of the past 40 years. Ann. Oncol. 2007, 18, 1437–1449. [Google Scholar] [CrossRef]
  33. Van Moos, R.; Body, J.J.; Egerdie, B.; Stopeck, A.; Brown, J.; Fallowfield, I.; Patrick, D.L.; Cleeland, C.; Damyanov, D.; Palazzo, F.S.; et al. Pain and analgesic use associated with skeletal-related events in patients with advanced cancer and bone metastases. Support. Care Cancer 2016, 24, 1327–1337. [Google Scholar] [CrossRef]
  34. Wu, S.; Chen, X.; Huang, F.; Lin, M.; Chen, P.; Wan, H.; Gao, F.; Zheng, T.; Zheng, X. Transcriptomic Analysis of Long Noncoding RNA and mRNA Expression Profiles in the Amygdala of Rats with Bone Cancer Pain-Depression Comorbidity. Life 2021, 11, 834. [Google Scholar] [CrossRef]
  35. Ji, H.; Jin, X.; Zhang, Q.; Zhou, Y.; Zhu, C.; Yang, Y.; Tang, Z.; Yu, G.; Wang, C. A Mouse Model of Cancer Induced Bone Pain: From Pain to Movement. Front. Behav. Neurosci. 2022, 16, 873750. [Google Scholar] [CrossRef]
  36. Takeshita, H.; Yamamoto, K.; Nozato, S.; Inagaki, T.; Tsuchimochi, H.; Shirai, M.; Yamamoto, R.; Imaizumi, Y.; Hongyo, K.; Yokoyama, S.; et al. Modified forelimb grip strength test detects aging-associated physiological decline in skeletal muscle function in male mice. Sci. Rep. 2017, 7, 42323. [Google Scholar] [CrossRef]
  37. Can, A.; Dao, D.T.; Arad, M.; Terrillion, C.E.; Piantadosi, S.C.; Gould, T.D. The mouse forced swim test. J. Vis. Exp. 2012, 59, 3638. [Google Scholar] [CrossRef]
  38. Can, A.; Dao, D.T.; Terrillion, C.E.; Piantadosi, S.C.; Bhat, S.; Gould, T.D. The tail suspension test. J. Vis. Exp. 2012, 59, 3769. [Google Scholar] [CrossRef]
  39. Pellow, S.; File, S.E. Anxiolytic and anxiogenic drug effects on exploratory activity in an elevated plus-maze: A novel test of anxiety in the rat. Pharmacol. Biochem. Behav. 1986, 24, 525–529. [Google Scholar] [CrossRef]
  40. Walf, A.A.; Frye, C.A. The use of the elevated plus maze as an assay of anxiety-related behavior in rodents. Nat. Protoc. 2007, 2, 322–328. [Google Scholar] [CrossRef]
  41. Rom, O.; Reznick, A.Z. The role of E3 ubiquitin-ligases MuRF-1 and MAFbx in loss of skeletal muscle mass. Free Radic. Biol. Med. 2016, 98, 218–230. [Google Scholar] [CrossRef]
  42. Tardif, N.; Klaude, M.; Lundell, L.; Thorell, A.; Rooyackers, O. Autophagic-lysosomal pathway is the main proteolytic system modified in the skeletal muscle of esophageal cancer patients. Am. J. Clin. Nutr. 2013, 98, 1485–1492. [Google Scholar] [CrossRef]
  43. Boyer-Guittaut, M.; Poillet, L.; Liang, Q.; Bôle-Richard, E.; Ouyang, X.; Benavides, G.A.; Chakrama, F.-Z.; Fraichard, A.; Darley-Usmar, V.M.; Despouy, G.; et al. The role of GABARAPL1/GEC1 in autophagic flux and mitochondrial quality control in MDA-MB-436 breast cancer cells. Autophagy 2014, 10, 986–1003. [Google Scholar] [CrossRef]
  44. Petruzzelli, M.; Schweiger, M.; Schreiber, R.; Campos-Olivas, R.; Tsoli, M.; Allen, J.; Swarbrick, M.; Rose-John, S.; Rincon, M.; Robertson, G.; et al. A switch from white to brown fat increases energy expenditure in cancer-associated cachexia. Cell Metab. 2014, 20, 433–447. [Google Scholar] [CrossRef]
  45. Kir, S.; White, J.P.; Kleiner, S.; Kazak, L.; Cohen, P.; Baracos, V.E.; Spiegelman, B.M. Tumour-derived PTH-related protein triggers adipose tissue browning and cancer cachexia. Nature 2014, 513, 100–104. [Google Scholar] [CrossRef]
  46. Bove, S.E.; Calcaterra, S.L.; Brooker, R.M.; Huber, C.M.; Guzman, R.E.; Juneau, P.L.; Schrier, D.J.; Kilgore, K.S. Weight bearing as a measure of disease progression and efficacy of anti-inflammatory compounds in a model of monosodium iodoacetate-induced osteoarthritis. Osteoarthr. Cartil. 2003, 11, 821–830. [Google Scholar] [CrossRef]
  47. Wyart, E.; Bindels, L.B.; Mina, E.; Menga, A.; Stanga, S.; Porporato, P.E. Cachexia, a Systemic Disease beyond Muscle Atrophy. Int. J. Mol. Sci. 2020, 21, 8592. [Google Scholar] [CrossRef]
  48. Michaelis, K.A.; Zhu, X.; Burfeind, K.G.; Krasnow, S.M.; Levasseur, P.R.; Morgan, T.K.; Marks, D.L. Establishment and characterization of a novel murine model of pancreatic cancer cachexia. J. Cachexia Sarcopenia Muscle 2017, 8, 824–838. [Google Scholar] [CrossRef]
  49. Sun, Y.; Yang, Y.; Qin, Z.; Cai, J.; Guo, X.; Tang, Y.; Wan, J.; Su, D.-F.; Liu, X. The Acute-Phase Protein Orosomucoid Regulates Food Intake and Energy Homeostasis via Leptin Receptor Signaling Pathway. Diabetes 2016, 65, 1630–1641. [Google Scholar] [CrossRef]
  50. Kandarian, S.C.; Nosacka, R.L.; Delitto, A.E.; Judge, A.R.; Judge, S.M.; Ganey, J.D.; Moreira, J.D.; Jackman, R.W. Tumour-derived leukaemia inhibitory factor is a major driver of cancer cachexia and morbidity in C26 tumour-bearing mice. J. Cachexia Sarcopenia Muscle 2018, 9, 1109–1120. [Google Scholar] [CrossRef]
  51. Togashi, Y.; Kogita, A.; Sakamoto, H.; Hayashi, H.; Terashima, M.; de Velasco, M.A.; Sakai, K.; Fujita, Y.; Tomida, S.; Kitano, M.; et al. Activin Signal Promotes Cancer Progression and Is Involved in Cachexia in a Subset of Pancreatic Cancer. Cancer Lett. 2015, 356, 819–827. [Google Scholar] [CrossRef]
  52. Queiroz, A.L.; Dantas, E.; Ramsamooj, S.; Murthy, A.; Ahmed, M.; Zunica, E.R.M.; Liang, R.J.; Murphy, J.; Holman, C.D.; Bare, C.J.; et al. Blocking ActRIIB and Restoring Appetite Reverses Cachexia and Improves Survival in Mice with Lung Cancer. Nat. Commun. 2022, 13, 4633. [Google Scholar] [CrossRef]
  53. Loumaye, A.; de Barsy, M.; Nachit, M.; Lause, P.; Frateur, L.; van Maanen, A.; Trefois, P.; Gruson, D.; Thissen, J.P. Role of Activin A and myostatin in human cancer cachexia. J. Clin. Endocrinol. Metab. 2015, 100, 2030–2038. [Google Scholar] [CrossRef]
  54. Molfino, A.; Amabile, M.I.; Imbimbo, G.; Rizzo, V.; Pediconi, F.; Catalano, C.; Emiliani, A.; Belli, R.; Ramaccini, C.; Parisi, C.; et al. Association between Growth Differentiation Factor-15 (GDF-15) Serum Levels, Anorexia and Low Muscle Mass among Cancer Patients. Cancers 2020, 13, 99. [Google Scholar] [CrossRef] [PubMed]
  55. Xiong, J.; Wu, G.; Ning, J.; Yan, J.; Yang, J.; Kang, J. Neutralizing antibody against GDF15 for treatment of cancer-associated cachexia. PLoS ONE 2024, 19, e0309394. [Google Scholar] [CrossRef]
  56. Reid, J.; Hughes, C.; Murray, L.; Parsons, C.; Cantwell, M. Non-steroidal anti-inflammatory drugs for the treatment of cancer cachexia: A systematic review. Palliat. Med. 2013, 27, 295–303. [Google Scholar] [CrossRef]
  57. Clamon, G.; Byrne, M.M.; Talbert, E.E. Inflammation as a Therapeutic Target in Cancer Cachexia. Cancers 2022, 14, 5262. [Google Scholar] [CrossRef] [PubMed]
  58. Dobs, A.S.; Boccia, R.V.; Croot, C.C.; Gabrail, N.Y.; Dalton, J.T.; Hancock, M.L.; Johnston, M.; Steiner, M.S. Effects of enobosarm on muscle wasting and physical function in patients with cancer: A double-blind, randomised controlled phase 2 trial. Lancet Oncol. 2013, 14, 335–345. [Google Scholar] [CrossRef]
  59. Nishikawa, H.; Goto, M.; Fukunishi, S.; Asai, A.; Nishiguchi, S.; Higuchi, K. Cancer Cachexia: Its Mechanism and Clinical Significance. Int. J. Mol. Sci. 2021, 22, 8491. [Google Scholar] [CrossRef] [PubMed]
  60. Hopkinson, J.B.; Wright, D.N.; McDonald, J.W.; Corner, J.L. The prevalence of concern about weight loss and change in eating habits in people with advanced cancer. J. Pain. Symptom. Manag. 2006, 32, 322–331. [Google Scholar] [CrossRef]
  61. Poole, K.; Froggatt, K. Loss of weight and loss of appetite in advanced cancer: A problem for the patient, the carer, or the health professional? Palliat. Med. 2002, 16, 499–506. [Google Scholar] [CrossRef]
  62. Utech, A.E.; Tadros, E.M.; Hayes, T.G.; Garcia, J.M. Predicting survival in cancer patients: The role of cachexia and hormonal, nutritional and inflammatory markers. J. Cachexia Sarcopenia Muscle 2012, 3, 245–251. [Google Scholar] [CrossRef]
  63. Takayama, K.; Atagi, S.; Imamura, F.; Tanaka, H.; Minato, K.; Harada, T.; Katakami, N.; Yokoyama, T.; Yoshimori, K.; Takiguchi, Y.; et al. Quality of life and survival survey of cancer cachexia in advanced non-small cell lung cancer patients-Japan nutrition and QOL survey in patients with advanced non-small cell lung cancer study. Support. Care Cancer 2016, 24, 3473–3480. [Google Scholar] [CrossRef]
  64. Op den Kamp, C.M.; Langen, R.C.; Snepvangers, F.J.; de Theije, C.C.; Schellekens, J.M.; Laugs, F.; Dingemans, A.M.; Schols, A.M. Nuclear transcription factor kappa B activation and protein turnover adaptations in skeletal muscle of patients with progressive stages of lung cancer cachexia. Am. J. Clin. Nutr. 2013, 98, 738–748. [Google Scholar] [CrossRef] [PubMed]
  65. Prado, C.M.; Lieffers, J.R.; McCargar, L.J.; Reiman, T.; Sawyer, M.B.; Martin, L.; Baracos, V.E. Prevalence and clinical implications of sarcopenic obesity in patients with solid tumours of the respiratory and gastrointestinal tracts: A population-based study. Lancet Oncol. 2008, 9, 629–635. [Google Scholar] [CrossRef] [PubMed]
  66. Li, H.-L.; Au, P.C.-M.; Lee, G.K.-Y.; Li, G.H.-Y.; Chan, M.; Cheung, B.M.-Y.; Wong, I.C.-K.; Lee, V.H.-F.; Mok, J.; Yip, B.H.-K.; et al. Different Definitions of Sarcopenia and Mortality in Cancer: A Meta-Analysis. Osteoporos. Sarcopenia 2021, 7, S34–S38. [Google Scholar] [CrossRef]
  67. Barkhudaryan, A.; Scherbakov, N.; Springer, J.; Doehner, W. Cardiac muscle wasting in individuals with cancer cachexia. ESC Heart Fail. 2017, 4, 458–467. [Google Scholar] [CrossRef]
  68. Springer, J.; Tschirner, A.; Haghikia, A.; von Haehling, S.; Lal, H.; Grzesiak, A.; Kaschina, E.; Palus, S.; Potsch, M.; von Websky, K.; et al. Prevention of liver cancer cachexia-induced cardiac wasting and heart failure. Eur. Heart J. 2014, 35, 932–941. [Google Scholar] [CrossRef]
  69. Tian, M.; Nishijima, Y.; Asp, M.L.; Stout, M.B.; Reiser, P.J.; Belury, M.A. Cardiac alterations in cancer-induced cachexia in mice. Int. J. Oncol. 2010, 37, 347–353. [Google Scholar] [PubMed]
  70. Sandri, M. Protein breakdown in cancer cachexia. Semin. Cell Dev. Biol. 2016, 54, 11–19. [Google Scholar] [CrossRef]
  71. Shellock, F.G.; Riedinger, M.S.; Fishbein, M.C. Brown adipose tissue in cancer patients: Possible cause of cancer-induced cachexia. J. Cancer Res. Clin. Oncol. 1986, 111, 82–85. [Google Scholar] [CrossRef]
  72. Chu, K.; Bos, S.A.; Gill, C.M.; Torriani, M.; Bredella, M.A. Brown adipose tissue and cancer progression. Skelet. Radiol. 2020, 49, 635–639. [Google Scholar] [CrossRef]
  73. Paval, D.R.; Patton, R.; McDonald, J.; Skipworth, R.J.E.; Gallagher, I.J.; Laird, B.J. A systematic review examining the relationship between cytokines and cachexia in incurable cancer. J. Cachexia Sarcopenia Muscle 2022, 13, 824–838. [Google Scholar] [CrossRef]
  74. Malla, J.; Zahra, A.; Venugopal, S.; Selvamani, T.Y.; Shoukrie, S.I.; Selvaraj, R.; Dhanoa, R.K.; Hamouda, R.K.; Mostafa, J. What Role Do Inflammatory Cytokines Play in Cancer Cachexia? Cureus 2022, 14, e26798. [Google Scholar] [CrossRef] [PubMed]
  75. Lerner, L.; Hayes, T.G.; Tao, N.; Krieger, B.; Feng, B.; Wu, Z.; Nicoletti, R.; Isabel Chiu, M.; Gyuris, J.; Garcia, J.M. Plasma Growth Differentiation Factor 15 Is Associated with Weight Loss and Mortality in Cancer Patients. J. Cachexia Sarcopenia Muscle 2015, 6, 317–324. [Google Scholar] [CrossRef] [PubMed]
  76. Dev, R. Measuring cachexia-diagnostic criteria. Ann. Palliat. Med. 2019, 8, 24–32. [Google Scholar] [CrossRef] [PubMed]
  77. Zhang, D.; Sun, M.; Samols, D.; Kushner, I. STAT3 Participates in Transcriptional Activation of the C-reactive Protein Gene by Interleukin-6. J. Boil. Chem. 1996, 271, 9503–9509. [Google Scholar] [CrossRef]
  78. Omlin, A.; Blum, D.; Wierecky, J.; Haile, S.R.; Ottery, F.D.; Strasser, F. Nutrition impact symptoms in advanced cancer patients: Frequency and specific interventions, a case–control study. J. Cachex Sarcopenia Muscle 2013, 4, 55–61. [Google Scholar] [CrossRef]
  79. Khorasanchi, A.; Nemani, S.; Pandey, S.; Del Fabbro, E. Managing Nutrition Impact Symptoms in Cancer Cachexia: A Case Series and Mini Review. Front. Nutr. 2022, 9, 831934. [Google Scholar] [CrossRef]
  80. Schmidt, K.N.; Olson, K.; Kubrak, C.; Parliament, M.; Ghosh, S. Validation of the Head and Neck Patient Symptom Checklist as a nutrition impact symptom assessment tool for head and neck cancer patients. Support. Care Cancer 2012, 21, 27–34. [Google Scholar] [CrossRef]
  81. Minton, O.; Strasser, F.; Radbruch, L.; Stone, P. Identification of factors associated with fatigue in advanced cancer: A subset analysis of the European palliative care research collaborative computerized symptom assessment data set. J. Pain Symptom Manag. 2012, 43, 226–235. [Google Scholar] [CrossRef]
  82. Kilgour, R.D.; Vigano, A.; Trutschnigg, B.; Hornby, L.; Lucar, E.; Bacon, S.L.; Morais, J.A. Cancer-related fatigue: The impact of skeletal muscle mass and strength in patients with advanced cancer. J. Cachexia Sarcopenia Muscle 2010, 1, 177–185. [Google Scholar] [CrossRef]
  83. Betancourt, A.; Busquets, S.; Ponce, M.; Toledo, M.; Guàrdia-Olmos, J.; Peró-Cebollero, M.; López-Soriano, F.J.; Argilés, J.M. The animal cachexia score (ACASCO). Anim. Model. Exp. Med. 2019, 2, 201–209. [Google Scholar] [CrossRef]
  84. Toledo, M.; Penna, F.; Busquets, S.; Lopez-Soriano, F.J.; Argiles, J.M. Distinct behaviour of sorafenib in experimental cachexia-inducing tumours: The role of STAT3. PLoS ONE 2014, 9, e113931. [Google Scholar] [CrossRef] [PubMed]
  85. Uzu, M.; Nonaka, M.; Miyano, K.; Sato, H.; Kurebayashi, N.; Yanagihara, K.; Sakurai, T.; Hisaka, A.; Uezono, Y. A novel strategy for treatment of cancer cachexia targeting xanthine oxidase in the brain. J. Pharmacol. Sci. 2019, 140, 109–112. [Google Scholar] [CrossRef] [PubMed]
  86. Cunningham, P.; Unger, C.A.; Patton, E.A.; Aiken, A.; Browne, A.; James, E.; Aladhami, A.K.; Hope Rd, M.C.; VanderVeen, B.N.; Cardaci, T.D.; et al. Platelet status in cancer cachexia progression in ApcMin/+ mice. Front. Immunol. 2023, 14, 1253587. [Google Scholar] [CrossRef] [PubMed]
  87. Puppa, M.J.; White, J.P.; Sato, S.; Cairns, M.; Baynes, J.W.; Carson, J.A. Gut barrier dysfunction in the apc(min/+) mouse model of colon cancer cachexia. Biochim. Biophys. Acta 2011, 1812, 1601–1606. [Google Scholar] [CrossRef] [PubMed]
  88. Narsale, A.A.; Enos, R.T.; Puppa, M.J.; Chatterjee, S.; Murphy, E.A.; Fayad, R.; Pena, M.O.; Durstine, J.L.; Carson, J.A. Liver Inflammation and Metabolic Signaling in ApcMin/+ Mice: The Role of Cachexia Progression. PLoS ONE 2015, 10, e0119888. [Google Scholar] [CrossRef] [PubMed]
  89. Matzuk, M.M.; Finegold, M.J.; Mather, J.P.; Krummen, L.; Lu, H.; Bradley, A. Development of cancer cachexia-like syndrome and adrenal tumors in inhibin-deficient mice. Proc. Nal. Acad. Sci. USA 1994, 91, 8817–8821. [Google Scholar] [CrossRef]
  90. Zhou, X.; Wang, J.L.; Lu, J.; Song, Y.; Kwak, K.S.; Jiao, Q.; Rosenfeld, R.; Chen, Q.; Boone, T.; Simonet, W.S.; et al. Reversal of cancer cachexia and muscle wasting by ActRIIB antagonism leads to prolonged survival. Cell 2010, 142, 531–543. [Google Scholar] [CrossRef]
  91. Li, Q.; Kumar, R.; Underwood, K.; O’Connor, A.E.; Loveland, K.L.; Seehra, J.S.; Matzuk, M.M. Prevention of cachexia-like syndrome development and reduction of tumor progression in inhibin-deficient mice following administration of a chimeric activin receptor type II-murine Fc protein. Mol. Hum. Reprod. 2007, 13, 675–683. [Google Scholar] [CrossRef]
Figure 1. Changes in body weight, food intake, and fluid intake of mouse model with femoral implanted Lewis lung carcinoma (LLC) cells. (a) Food intake and (b) water intake were recorded every 3 days for 4 weeks. (c) Change in body weight per week. (d) Final body weight (excluding tumor mass) was calculated on the concluding day of the study. Data are expressed as mean ± SEM (n = 7–8). *** p < 0.001, and **** p < 0.0001 compared with the control group.
Cimb 46 00797 g001
Figure 2. Significant muscle wasting occurs in a cancer cachexia model with Lewis lung carcinoma (LLC) implanted in the femoral cavity. (a) Evaluation of relative changes in mass of heart and skeletal muscles (tibialis anterior (TA), extensor digitorum longus (EDL), soleus (SOL), and gastrocnemius (GAS)) 4 weeks after LLC transplantation (n = 7–8). (b) Hematoxylin and eosin-stained sections (scale bar, 50 μm) and cross-sectional area (CSA) of TA muscles (n = 6). (c) Forearm grip strength (grams) over time. (d) Relative mRNA expression levels of Atrogin-1, MuRF-1, Bnip3, and Gabarapl1 (n = 7). Statistical comparisons were performed using a two-tailed unpaired t-test for normally distributed data or Mann–Whitney U test for non-parametric data. Significance levels are indicated as * p < 0.05, ** p < 0.01, *** p < 0.001, and **** p < 0.0001.
Cimb 46 00797 g002
Figure 3. Transplantation of Lewis lung carcinoma (LLC) into the femoral cavity promotes lipolysis. (a) Relative change in epididymal fat mass at the endpoint of the experiment (n = 7–8). (b) Hematoxylin and eosin-stained sections (Scale bar, 50 μm.) and epididymal fat cross-sectional area (CSA) from the LLC and sham groups (n = 6). (c) Relative mRNA expression levels of Ucp1 and Dio2 (n = 6). Comparisons were statistically tested with a two-tailed unpaired t-test for normally distributed data or Mann–Whitney U test for non-parametric data. Significances are shown as * p < 0.05, ** p < 0.01, and **** p < 0.0001.
Cimb 46 00797 g003
Figure 4. Inflammatory markers in a cancer cachexia model with Lewis lung carcinoma (LLC) implanted in the femoral cavity. (a) Plasma concentrations of tumor necrosis factor (TNF)-α and (b) interleukin (IL)-6 were measured using a ProQuantum Immunoassay Kit. Data are presented as mean ± SEM (n = 8). (c) Comparison of liver and weight (n = 5). (d) Comparison of inflammatory markers (APCs, Orm1, and IL-1β) in the liver by quantitative real-time PCR. Data are presented as mean ± SEM (sham n= 6, LLC n= 5). Statistical comparisons were conducted using a two-tailed unpaired t-test for normally distributed data or Mann–Whitney U test for non-parametric data. Significance levels are denoted as * p < 0.05, *** p < 0.001, and **** p < 0.0001 compared with the sham group.
Cimb 46 00797 g004
Figure 5. Behavioral evaluation in a cancer cachexia model with Lewis lung carcinoma (LLC) implanted in the femoral cavity. (ac) Behavioral tests were performed 4 weeks after LLC transplantation. (a) Immobility times were compared between the LLC and sham groups in the forced swim test (FST) 4 weeks post-LLC inoculation (n = 8). (b) Immobility time was measured in the tail suspension test (TST) (sham n= 8, LLC n= 16). (c) Time spent and entry rate in the open arms of the elevated plus maze (EPM) were recorded (sham n = 8, LLC n = 16). (d) Weight-bearing capacity of the hindlimb of mice inoculated with LLC was measured (sham n = 16, LLC n = 14). Statistical comparisons were conducted using a two-tailed unpaired t-test for normally distributed data or Mann–Whitney U test for non-parametric data. Significance levels are denoted as * p < 0.05, ** p < 0.01, and **** p < 0.0001 compared with the sham group.
Cimb 46 00797 g005
Table 1. Primer sequences used for quantitative real-time PCR.
GenePrimer Sequences
(Forward and Reverse, 5′-3′)
Accession No.
GapdhAGGTCGGTGTGAACGGATTTG
TGTAGACCATGTAGTTGAGGTCA
NM_008084
AtroginCTCCAAGCCAAAGTCCTTAGAG
AGGAGCTGTCATTAGGGACATC
NM_026346
MuRF-1TCCTGATGGAAACGCTATGGAG
ATTCGCAGCCTGGAAGATGT
NM_001039048
Bnip3CAGAGCGGGGAGGAGAAC
GAGGCTGGAACGCTGCTC
NM_009760
Gabarapl1GGACCACCCCTTCGAGTATC
CCTCTTATCCAGATCAGGGACC
NM_020590
Ucp1AAGCTGTGCGATGTCCATGT
AAGCCACAAACCCTTTGAAAA
NM_009463
Dio2AAGCTGTGCGATGTCCATGT
AAGCCACAAACCCTTTGAAAA
NM_010050
ApcsAGACAGACCTCAAGAGGAAAGT
AGGTTCGGAAACACAGTGTAAAA
NM_011318
Interleukin 1β (IL-1β)GCAACTGTTCCTGAACTCAACT
ATCTTTTGGGGTCCGTCAACT
NM_008361
Orm1CGAGTACAGGCAGGCAATTCA
ACCTATTGTTTGAGACTCCCGA
NM_008768
Table 2. Characteristics of preclinical cancer cachexia models.
ModelSpeciesCell/Induction MethodInjection Site/Tumor SiteTime to Onset of Cachexia (Body Weight Loss)Report of an Experiment on the Effects of NISCancer Pain CharacteristicsStudy LimitationsReference
Lewis Lung Carcinoma CIBP modelMouse (C57BL/6)Lewis lung cancer injection (5 × 10⁴ cells)Femoral bone marrow cavity3–4 weeks (post-transplantation)Depression: FST, TST
Anxiety: EPM
Pain: Weight bearing, von Frey test, cold plate tests
Cancer-induced bone pain (quantifiable).Rapidly progressive cachexia. Not suitable for long-term studies.In this study, [35]
Lewis Lung Carcinoma modelMouse (C57BL/6)Lewis lung cancer injection (5 × 10⁵~1 × 10⁶ cells)Subcutaneous (flank) or intramuscular1–2 weeks (post-transplantation)Depression: FST, TSTLocalized pain may be caused by the tumor compressing the surrounding tissues (not quantifiable).Rapidly progressive cachexia. Not suitable for long-term studies.[24,29,83,84]
C26 mouse colon cancer modelMouse (BALB/c, CD2F1)Colon-26 injection (5 × 10⁵~1 × 10⁶ cells)Subcutaneous (flank) or intramuscular1–3 weeks (post-transplantation)Depression: FST, TST
Anxiety: EPM
Localized pain may be caused by the tumor compressing the surrounding tissues (not quantifiable).Rapidly progressive cachexia. Not suitable for long-term studies.[22,29,83,84]
B16F10 mouse melanoma modelMouse (C57BL/6)B16F10 injection (5 × 10⁴~1 × 10⁶ cells)Subcutaneous1–3 weeks (post-transplantation)Fatigue: Total locomotion activityLocalized pain may be caused by the tumor compressing the surrounding tissues (not quantifiable).Rapidly progressive cachexia. Not suitable for long-term studies.[24,84]
85As2 human gastric cancer modelImmunodeficient animals (BALB/c nu/nu mice, F344/NJcl-rnu/rnu rats)85As2 injection (1 × 10⁶~1 × 10⁷ cells)Subcutaneous1–2 weeks (post-transplantation)No reportsPotential for localized pain due to tumor compression of surrounding tissues (not quantifiable).Rapidly progressive cachexia. Not suitable for long-term studies.[25,85]
Yoshida AH-130 rat hepatoma cell modelRat (Wistar)Yoshida AH-130 injection (1 × 10⁸ cells)Intraperitoneal1–2 weeks (post-transplantation)Depression: FSTPotential for localized pain due to tumor compression of surrounding tissues (not quantifiable).Rapidly progressive cachexia. Not suitable for long-term studies.[26,83]
Apc Min/+ mouse modelMouse (Genetic mutation)Spontaneous mutation in the Apc geneIntestinal tract (mainly colon)12–20 weeks of ageFatigue: Total locomotion activityMinimal direct pain: however, tumor burden can cause discomfort and a decrease in activity (not quantifiable).Prenatal genetic modification may affect development.[27,86,87,88]
Inhibin alpha subunit knockout modelMouse (Genetically modified)Genetic modification (Inhhibin α (-/-))Gonadal and adrenal6–12 weeks of ageNo reportsMinimal direct pain: however, tumor burden can cause discomfort and a decrease in activity (not quantifiable).Prenatal genetic modification may affect development.[28,89,90,91]
KPP modelMouse (Genetically modified)Genetic modification (Ptf1aCre-ERTM; KrasLSL-G12D; Pten-flox)PancreasBetween 75 and 90 days after tamoxifen administration.
(Initiated with tamoxifen between 24 and 28 days (Tumor formation). Median survival 3.5 months)
Fatigue: Total locomotion activityPancreatic tumor enlargement, nerve invasion, and local tissue compression may cause pain (not quantifiable).Lose normal pancreatic parenchyma.[29]
Disclaimer/Publisher’s Note: The statements, opinions and data contained in all publications are solely those of the individual author(s) and contributor(s) and not of MDPI and/or the editor(s). MDPI and/or the editor(s) disclaim responsibility for any injury to people or property resulting from any ideas, methods, instructions or products referred to in the content.

