Article

Analysis of Intestinal Bacterial Microbiota in Individuals with and without Chronic Low Back Pain

by
Antonio Martins Tieppo
1,*,
Júlia Silva Tieppo
2,* and
Luiz Antonio Rivetti
3
1
Rehabilitation Service, School of Medical Sciences of Santa Casa de São Paulo, São Paulo 01221-020, Brazil
2
Faculty of Medicine, University of São Paulo, São Paulo 01246-903, Brazil
3
Postgraduate Cardiac Surgery Discipline, School of Medical Sciences of Santa Casa de São Paulo, São Paulo 01221-020, Brazil
*
Authors to whom correspondence should be addressed.
Curr. Issues Mol. Biol. 2024, 46(7), 7339-7352; https://doi.org/10.3390/cimb46070435 (registering DOI)
Submission received: 22 May 2024 / Revised: 30 June 2024 / Accepted: 4 July 2024 / Published: 12 July 2024
(This article belongs to the Special Issue Metabolic Interactions between the Gut Microbiome and Organism)

Abstract

:
Low back pain is a health problem that represents the greatest cause of years lived with disability. This research seeks to evaluate the bacterial composition of the intestinal microbiota of two similar groups: one with chronic low back pain (PG) and the control group (CG). Clinical data from 73 participants and bacterial genome sequencing data from stool samples were analyzed. There were 40 individuals in PG and 33 in CG, aged between 20 and 50 years and with a body mass index of up to 30 kg/m2. Thus, the intragroup alpha diversity and intergroup beta diversity were analyzed. The significant results (p < 0.05) showed greater species richness in PG compared to CG. Additionally, a greater abundance of the species Clostridium difficile in PG was found along with 52 species with significantly different average relative abundances between groups (adjusted p < 0.05), with 36 more abundant species in PG and 16 in CG. We are the first to unveil significant differences in the composition of the intestinal bacterial microbiota of individuals with chronic low back pain who are non-elderly, non-obese and without any other serious chronic diseases. It could be a reference for a possible intestinal bacterial microbiota signature in chronic low back pain.

Graphical Abstract

1. Introduction

Low back pain (LBP) is a health problem that represents the greatest cause of years lived with disability [1]. It is estimated that 80% of the population suffers from low back pain at some point in their lives. It is the main factor limiting activity for people under 45 years of age and tends to increase in prevalence in younger people [2]. In many cases, its etiology, progression and chronicity cannot be fully explained [3].
The growing evidence of the presence of high levels of pro-inflammatory cytokines and pro-nociceptive neurotrophins in vertebral tissues (discs, facet joints and even cerebrospinal fluid) [4] may demonstrate the involvement of an overactive innate immune response in the genesis and progression of low back pain [5].
There has been an increase in preclinical and human studies on microbiota and the activity of its genes (microbiome), especially the intestinal microbiota. Correlations have been found in certain conditions such as dysbiosis [6], to the generation of chronic low-grade inflammation [7] associated with the pathogenesis of various diseases [8], including painful pathologies of the lumbar spine [9,10,11]. Yao et al. (2023), found through an experimental rat model of intervertebral disc degeneration (IDD) that the expression of tumor necrosis factor (TNF-α), interleukin (IL)-1β, IL-6, metalloproteinase (MMP)-3, MMP-13, nucleotide-binding oligomerization domain-like-receptor family pyrin domain-containing 3 (NLRP3) and caspase-1 increased in the rats of the IDD group. On the contrary, collagen II and aggrecan levels were downregulated. Additionally, vertebral disc tissue was severely damaged in the IDD group [9]. In their prospective literature review, Li et al. (2022), summarize three potential mechanisms by which the gut microbiota can induce IDD and cause LBP, such as (1) the translocation of bacteria across the gut epithelial barrier and into the IDD, (2) the regulation of the mucosal and systemic immune system, and (3) the regulation of nutrient absorption and metabolite formation at the gut epithelium and its diffusion into the IDD [10]. Rajasekaran et al. (2020) performed an experimental case-control study of genomic DNA from 24 lumbar intervertebral discs (IVDs). Their results showed eight normal, eight discs with herniation (DH) and eight discs with degeneration (DD) types, among all of which the authors found a rich bacterial presence. The varying biodiversity and abundance between healthy and diseased discs were documented, with protective bacteria being abundant in normal discs and putative pathogens abundant in DD and DH [11].
This research aimed to evaluate the bacterial composition of the intestinal microbiota of two groups, one of which is made up of people with chronic LBP, constituting the low back pain group (PG), and the other without, constituting the control group (CG). Moreover, we aim to determine whether there are relevant differences in the metrics of these bacteria. To accomplish these aims, the intra-group microbial alpha diversity and the inter-group beta diversity were assessed. Alpha diversity refers to the richness and abundance of bacterial species found in a sample; richness represents the total number of species. Abundance, in turn, refers to the proportion of each bacterial species in selected samples. Once the alpha diversity of each individual group has been obtained, it is possible to establish the beta diversity between the groups [12], that is, the difference between the total richness of taxa found and the difference in abundance of each species between CG and PG [12].

2. Materials and Methods

This paper presents an original observational case-control study carried out with people from the metropolitan region of the city of São Paulo, Brazil. There are no conflicts of interest to declare and the project was funded by the researcher.

2.1. Participants

This study was based on the collection of clinical data and the analysis of stool samples from 73 participants, subdivided into CG (made up of 33 asymptomatic individuals) and PG (made up of 40 individuals who have had chronic low back pain for at least 2 months). The groups were formed via analytical convenience sampling since anyone from the population of the metropolitan region of the city of São Paulo who met the eligibility criteria could be a participant, as well as due to the high financial cost of sequencing intestinal bacterial microbiota, and the need to focus on participants who were connected to the primary objective (assumption of relevance). The generated data then underwent statistical instrumentation. The selection of participants sought to achieve the greatest possible similarity between the groups in terms of gender, age, BMI and physical activity. All the volunteers included were adults aged between 20 and 50 years old with a body mass index of up to 30 kg/m2, among whom 47.4% and 46.7% had sedentary lifestyles in PG and CG, respectively. Pregnant women or those who had given birth in the last 3 months were not included. Participants with anatomical deformities and reduced spinal mobility detectable on physical examination were excluded. Those who had received antibiotics in the 3 months prior to the collection of the stool sample and who were continuously using non-hormonal anti-inflammatory drugs, glucocorticoids or antidepressants were excluded. People with acute infections, uncontrolled chronic diseases, diabetes, inflammatory bowel diseases or any other serious comorbidity were also excluded. Smokers and heavy drinkers (more than five doses of alcohol per week) were excluded.

2.2. Study Stages

The initial assessment of the participants included the following information: demographic data (age, gender, race, level of education, income); general and specific clinical examination of the spine; characterization of pain in the PG (temporality and application of the visual analog scale (VAS) of pain, graded from 0 to 10, in which 0 represented no pain, 1 very mild pain, 2 mild pain, 3 mild to moderate pain, 4 moderate pain, 5 moderate to severe pain, 6 severe pain, 7 severe to very severe pain, 8 very severe pain, 9 very severe pain to the worst possible pain and 10 the worst possible pain); pattern of nutrition and hydration; number of hours of sleep at night; physical activity; medication in use; route of delivery; and a self-completion of a form on intestinal habit characteristics (format using the Bristol stool scale [13], frequency of bowel movements and presence of symptoms such as oscillation between diarrhea and constipation). All the participants had their stool samples collected according to the Bioma4me* laboratory’s standards for stool metagenomic studies (https://bioma4me.com.br/genetica/processo-de-sequenciamento/, accessed on 1 November 2019). The genetic material contained in each individual sample was analyzed using the DNA amplification technique via PCR (polymerase chain reaction). A subsequent sequencing of the genes expressing the V3 and V4 hypervariable regions of the 16s portion of bacterial ribosomal RNA was conducted using RefSeq, which was made available by Illumina, Inc.’s Basespace (San Diego, CA, USA, https://www.illumina.com). This technique makes it possible to determine microbial composition at the species level. The reports generated provided the taxonomization of the bacterial microbiota through operational taxonomic units [14]. Based on the report issued from the exams, the intra-group alpha diversity and inter-group beta diversity were analyzed.
From this metric perspective, nine continuous numerical variables were analyzed in each group: the abundance of the Firmicutes and Bacteroidetes phyla in relation to the total phyla present in the feces (PhylABD); the Firmicutes and Bacteroidetes ratio (FiBaRAT); the diversity of bacterial genera (GenDIV); the species richness (SpRIC) between PG and CG and the abundance of each of the following species between PG and CG: Akkermansia muciniphila (AM); Faecalibacterium prausnitzii (FP); Bifidobacterium spp. (BS); Bacteroides fragilis (BF) and Clostridium difficile (CD).
In the literature, these variables are used to determine the balance of the intestinal bacterial microbiota and represent universal reference values adopted by the Bioma4me* laboratory (Table 1).

2.3. Statistical Analysis

The Mann–Whitney and Wilcoxon non-parametric tests (R’s Phyloseq package) (https://joey711.github.io/phyloseq/index.html, accessed on 3 July 2024) were used for the data obtained from the Amplicon sequencing of the groups’ fecal samples. Regarding the variables of the demographic and clinical characteristics, the chi-square test was used for qualitative nominal and Mann–Whitney for quantitative ones.
Six diversity indices were analyzed to determine the alpha diversity (species richness and abundance) of each group: Observed, Chao, Shannon, Simpson, ACE and Fisher [24]. The average relative abundance (ar-Ab) of the species present in the participants’ intestinal bacterial microbiota was also assessed. The difference between the abundance of each group (beta diversity) was assessed using the adjusted p-values of the relative frequencies.
To visualize these differences, a compositional circular bar chart was generated with Bray–Curtis ordering (R’s microViz package) (https://www.researchgate.net/figure/Simple-example-of-a-microViz-figure-pairing-an-ordination-plot-of-microbial-samples_fig1_353154579, accessed on 3 July 2024). This graph highlighted the 15 most frequent bacteria with significant differences, allowing for a comparative analysis of the microbiota between PG and CG.
The p-values were adjusted according to the Benjamini–Hochberg procedure [25]. The significance of p-values < 0.05 (5% significance level) was considered.

2.4. Ethical Aspects

The complete research protocol was approved by the Human Research Ethics Committee of the Santa Casa de Misericórdia de São Paulo, under opinion number 4.816.206. All participants signed the Free and Informed Consent Form before the study began.

3. Results

3.1. Sample Description

The demographic and clinical descriptive results were not explored in this study because they were not aligned with the established objectives. However, they present a wealth of material for other researchers seeking correlations between them and the intestinal microbiota sequencing data of the participants, such as the significant differences found in hours of nighttime sleep, amount of vegetable fiber ingested and oscillation between constipation and diarrhea. The p-values for the variables gender, age and BMI attest to the similarity between PG and CG (Table 2).

3.2. Microbial Composition Analysis

3.2.1. Variables SpRIC and CD

In Relation to the Continuous Variables SpRIC and CD (Table 3), Significant Differences Were Found (p < 0.05)
  • Species richness (SpRIC), with PG showing a higher number of taxa compared to CG (p = 0.030);
  • Relative abundance of the Clostridium difficile species (a pathogenic bacterium related to inflammatory conditions of the large intestine), which is higher in PG (p = 0.011).
The ACE, Observed, Chao1 and Fisher alpha diversity index metrics shown in Table 4 confirm the greater microbial diversity in PG, with adjusted p < 0.05, that represents the use of Benjamini-Hochberg method that controls the False Discovery Rate (FDR), using sequential modified Bonferroni correction for multiple hypothesis testing.

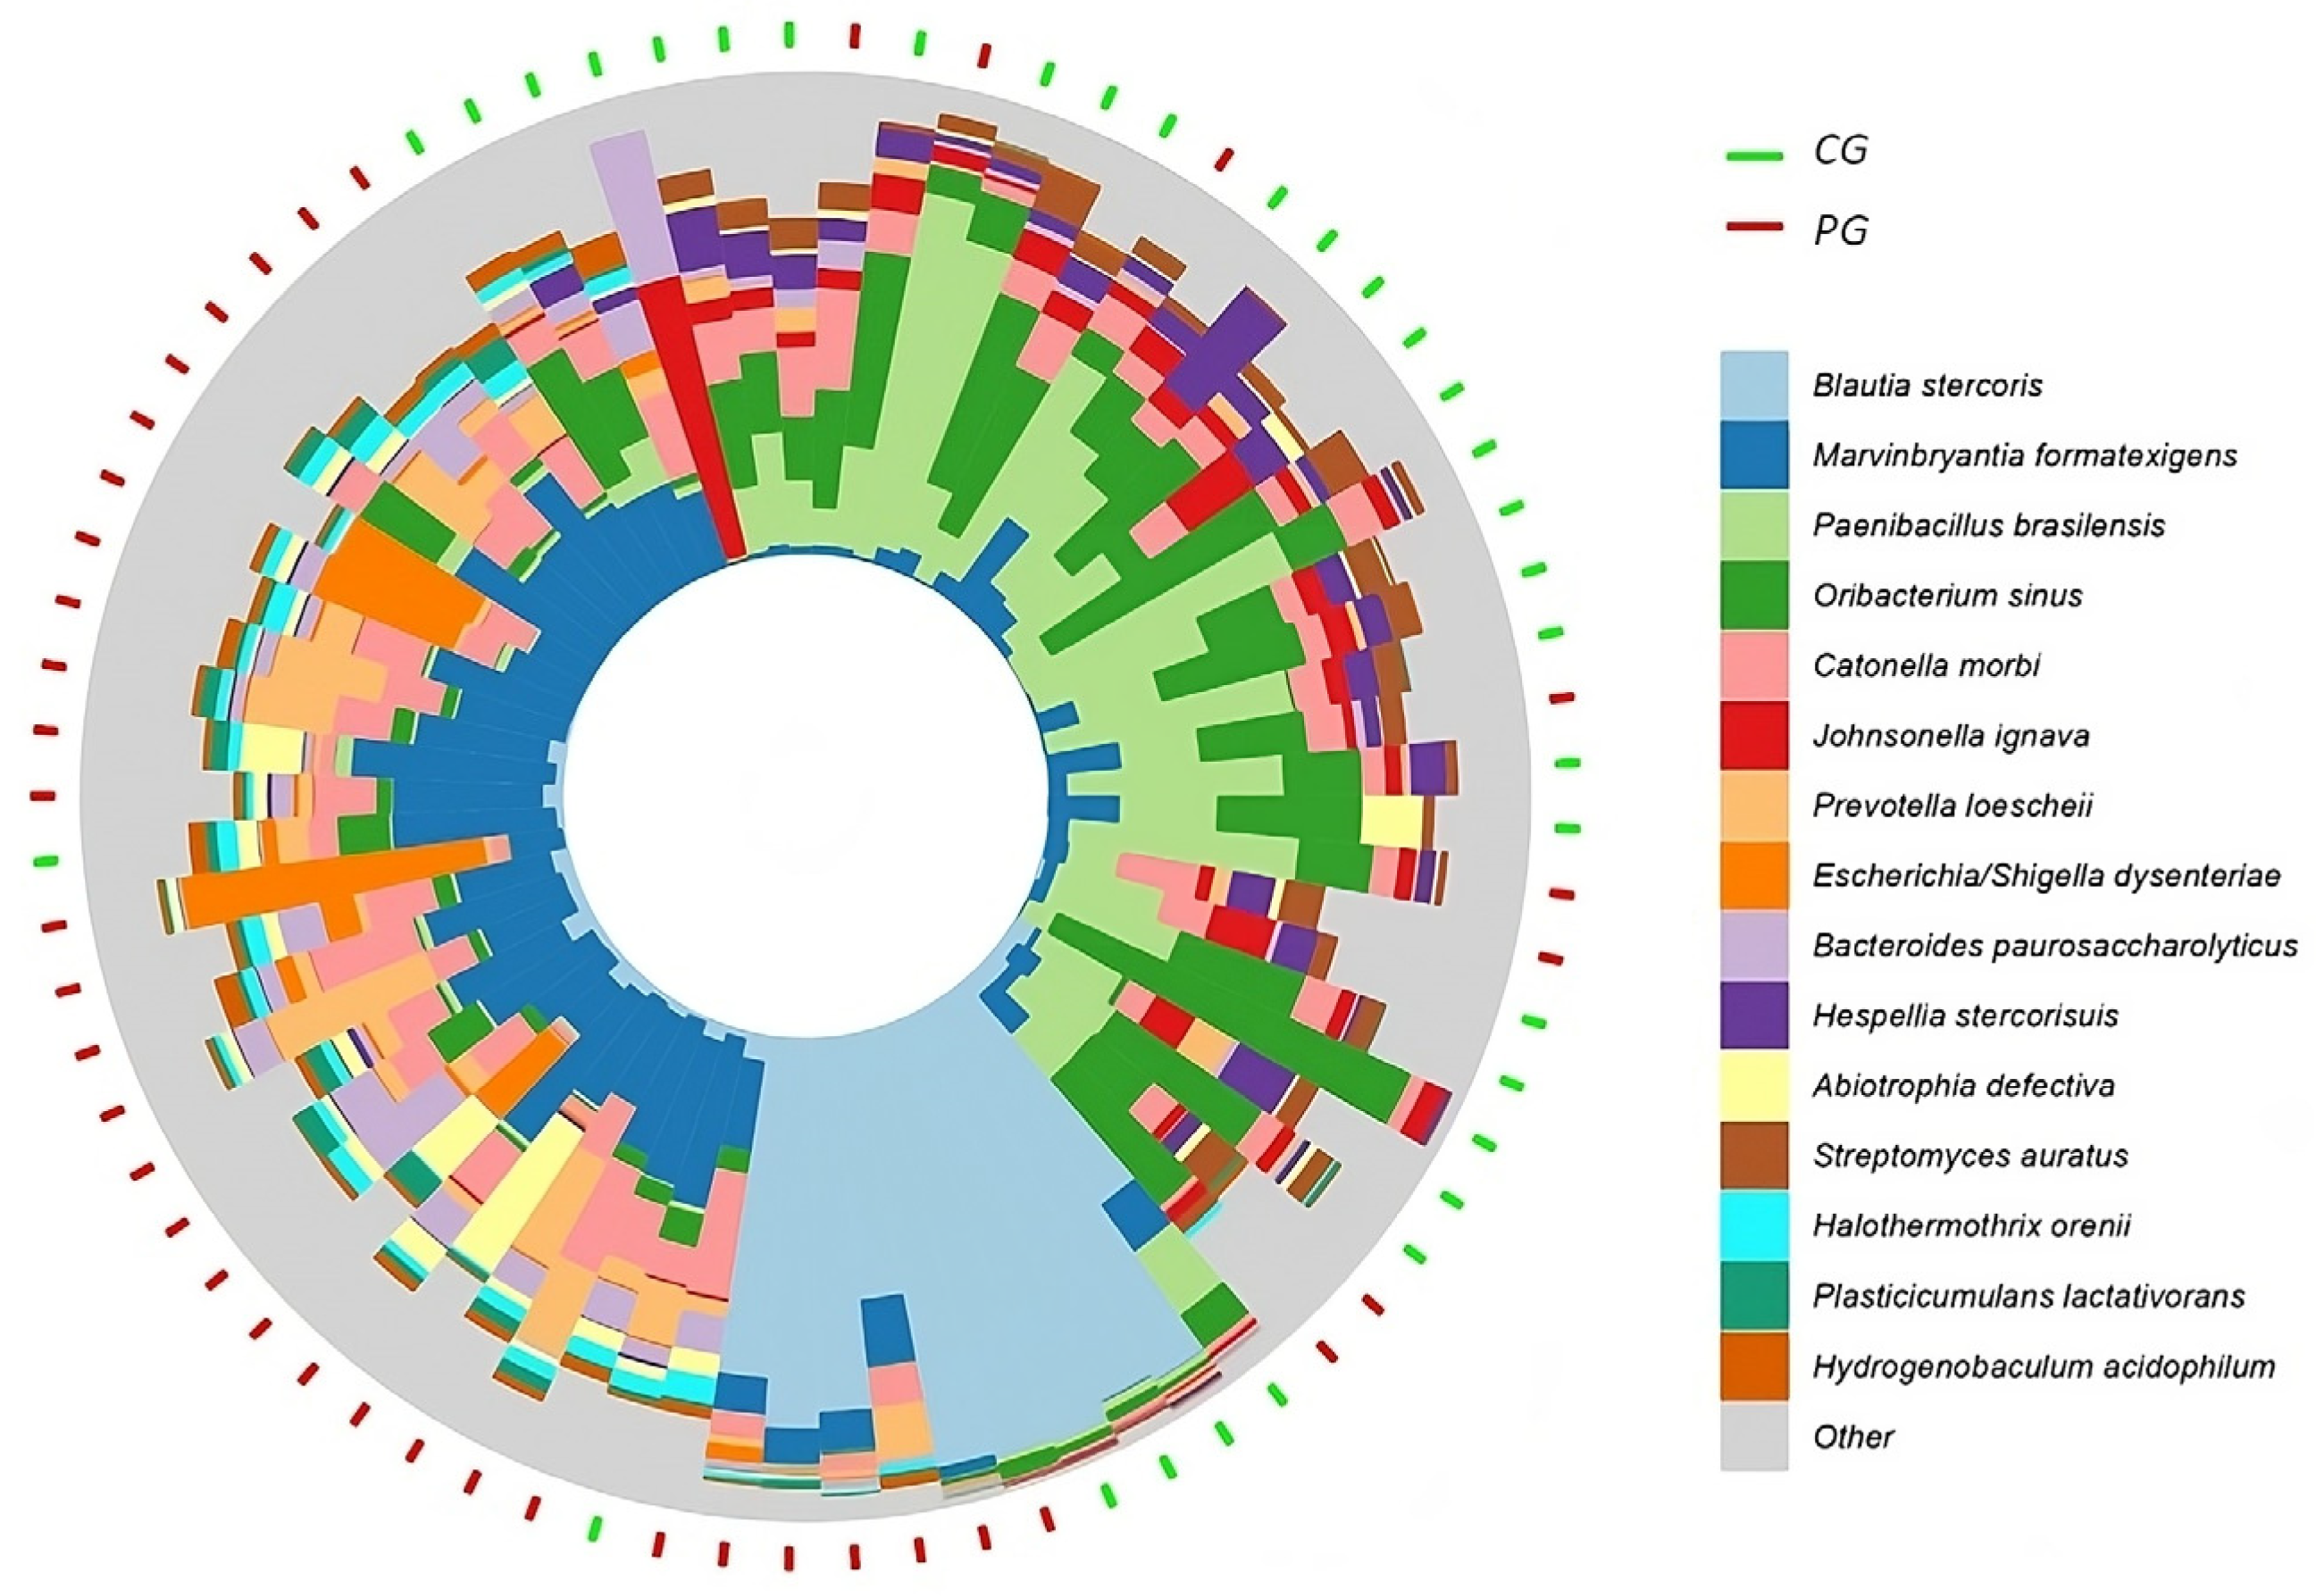
3.2.2. Intestinal Bacterial Microbiota Sequencing of the PG and CG Samples

The Statistical Treatment of the Results of the Intestinal Bacterial Microbiota Sequencing of the PG and CG Samples Revealed 52 Species with Significantly Different Average Relative Abundances (ar-Ab) between the Groups (Adjusted p < 0.05). The following Distribution of Species by Phylum was Found: Firmicutes (27), Bacteroidetes (7), Proteobacteria (7), Actinobacteria (5), Verrucomicrobia (2), Deferribacteres (1), Acidobacteria (1), Fibrobacteres (1) and Aquificae (1), with 36 Species Being More Abundant in PG and 16 in CG (Table 5).

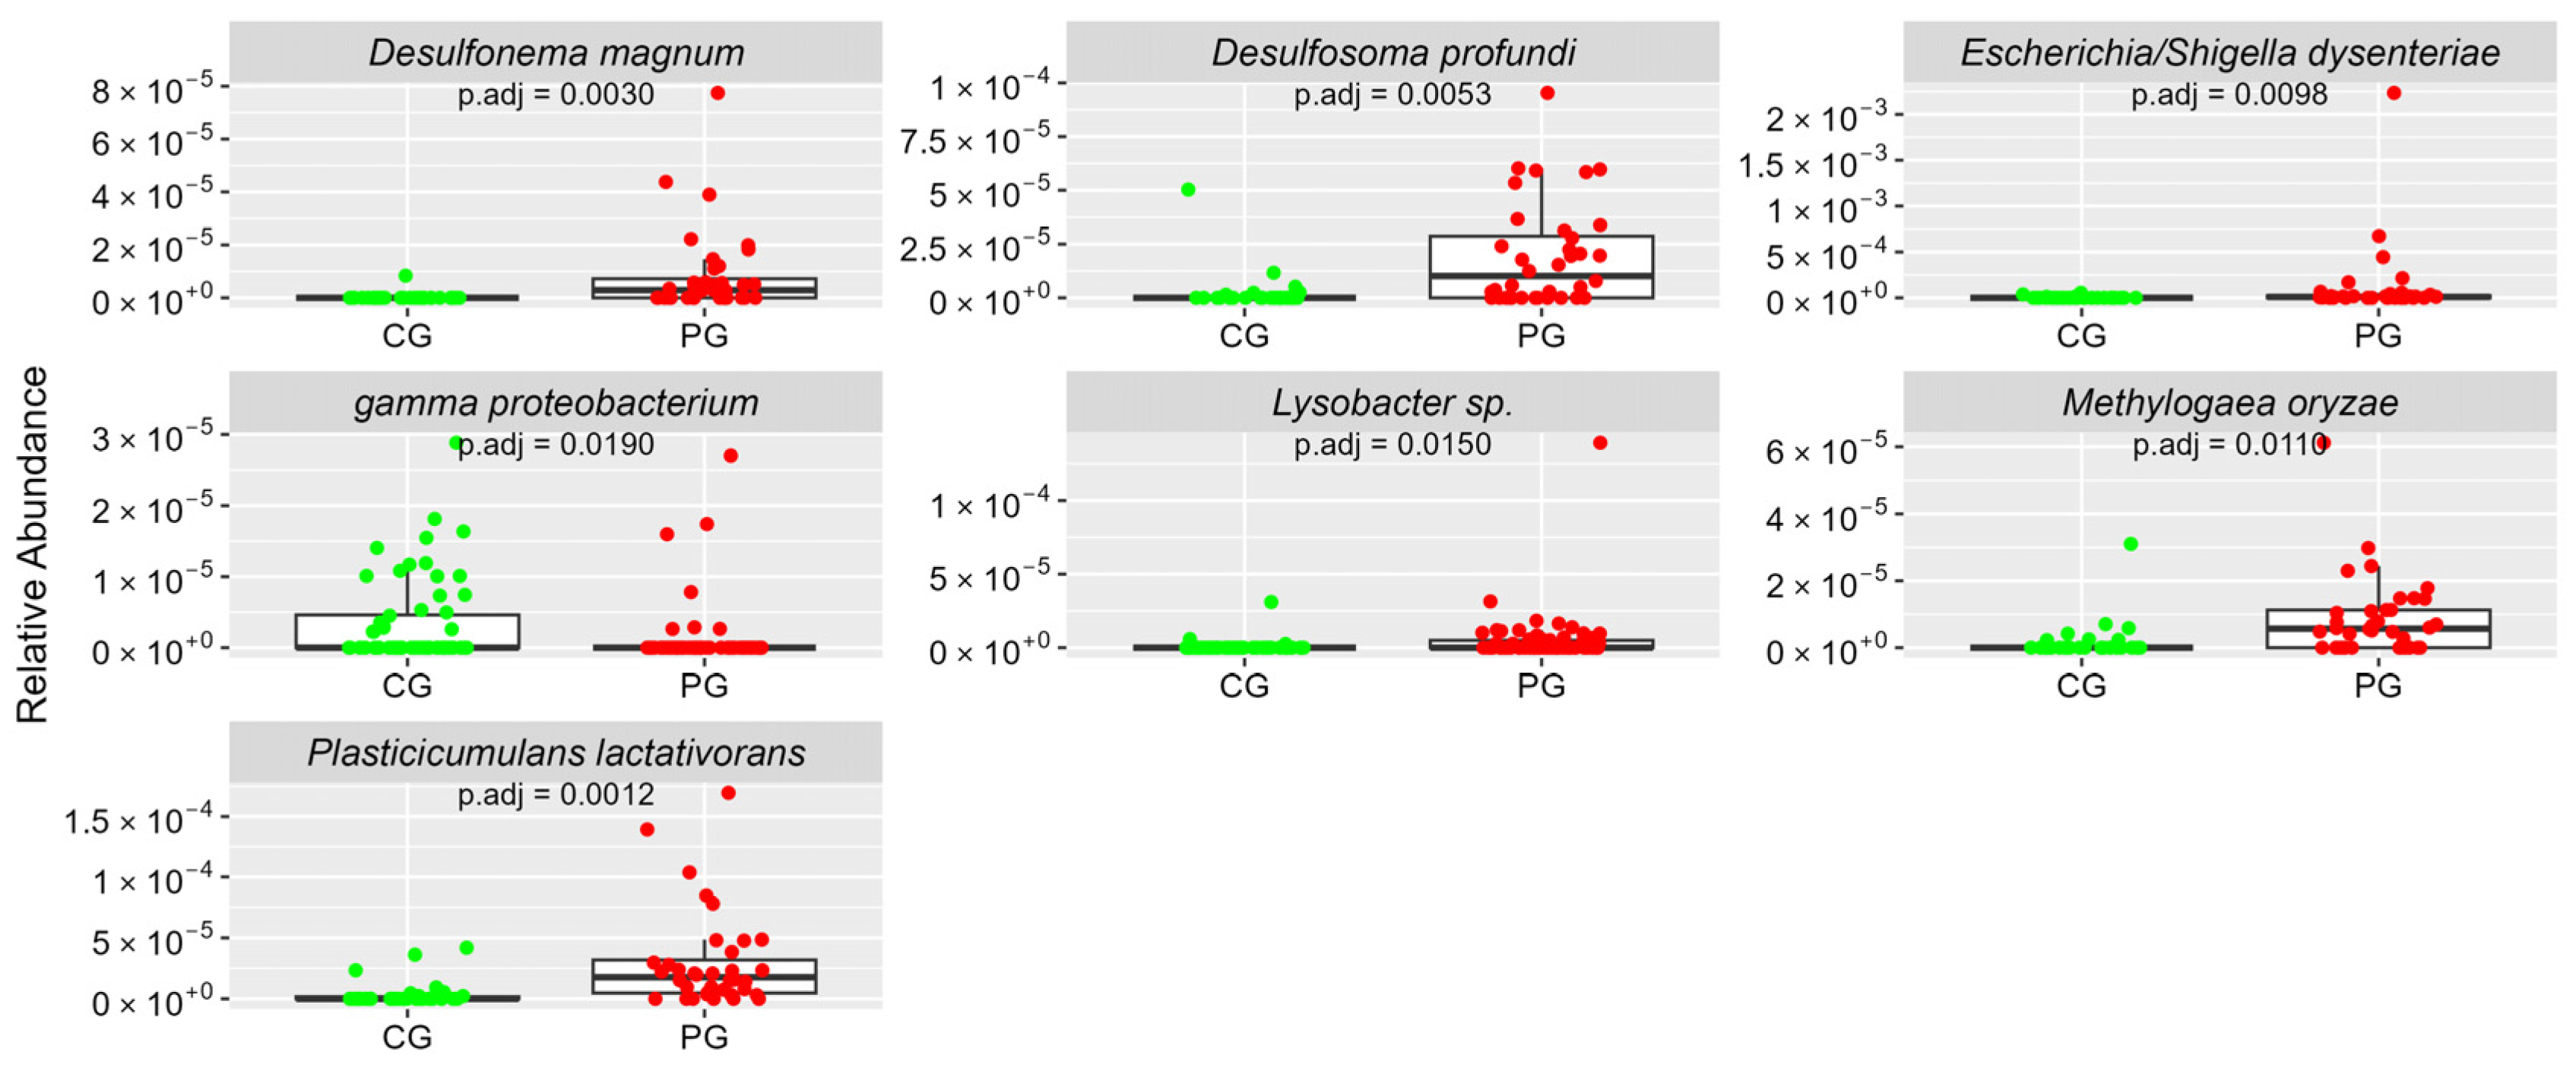
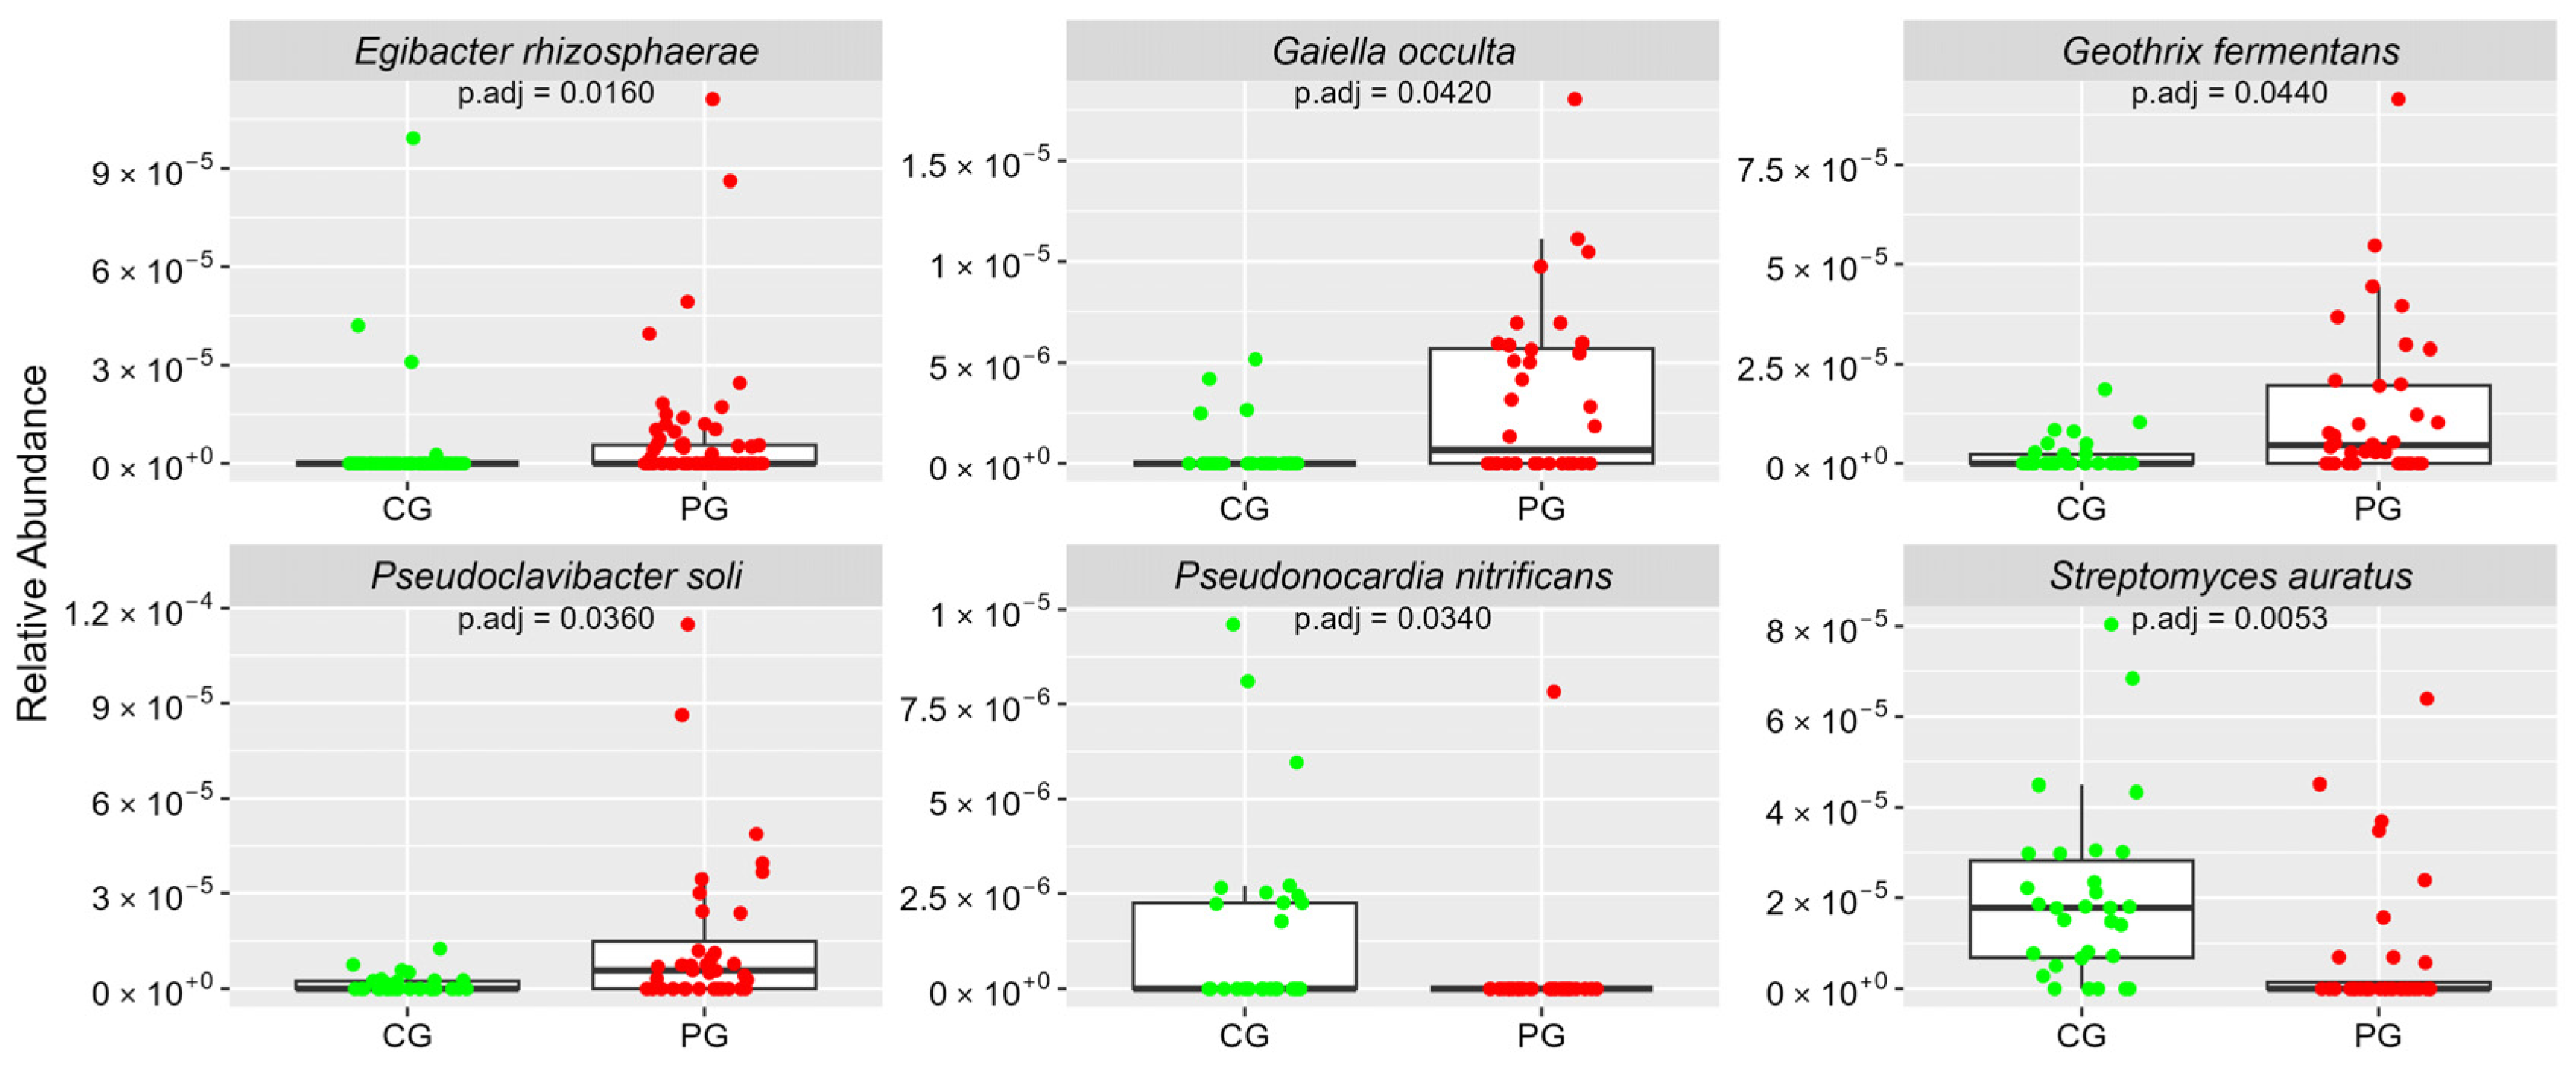
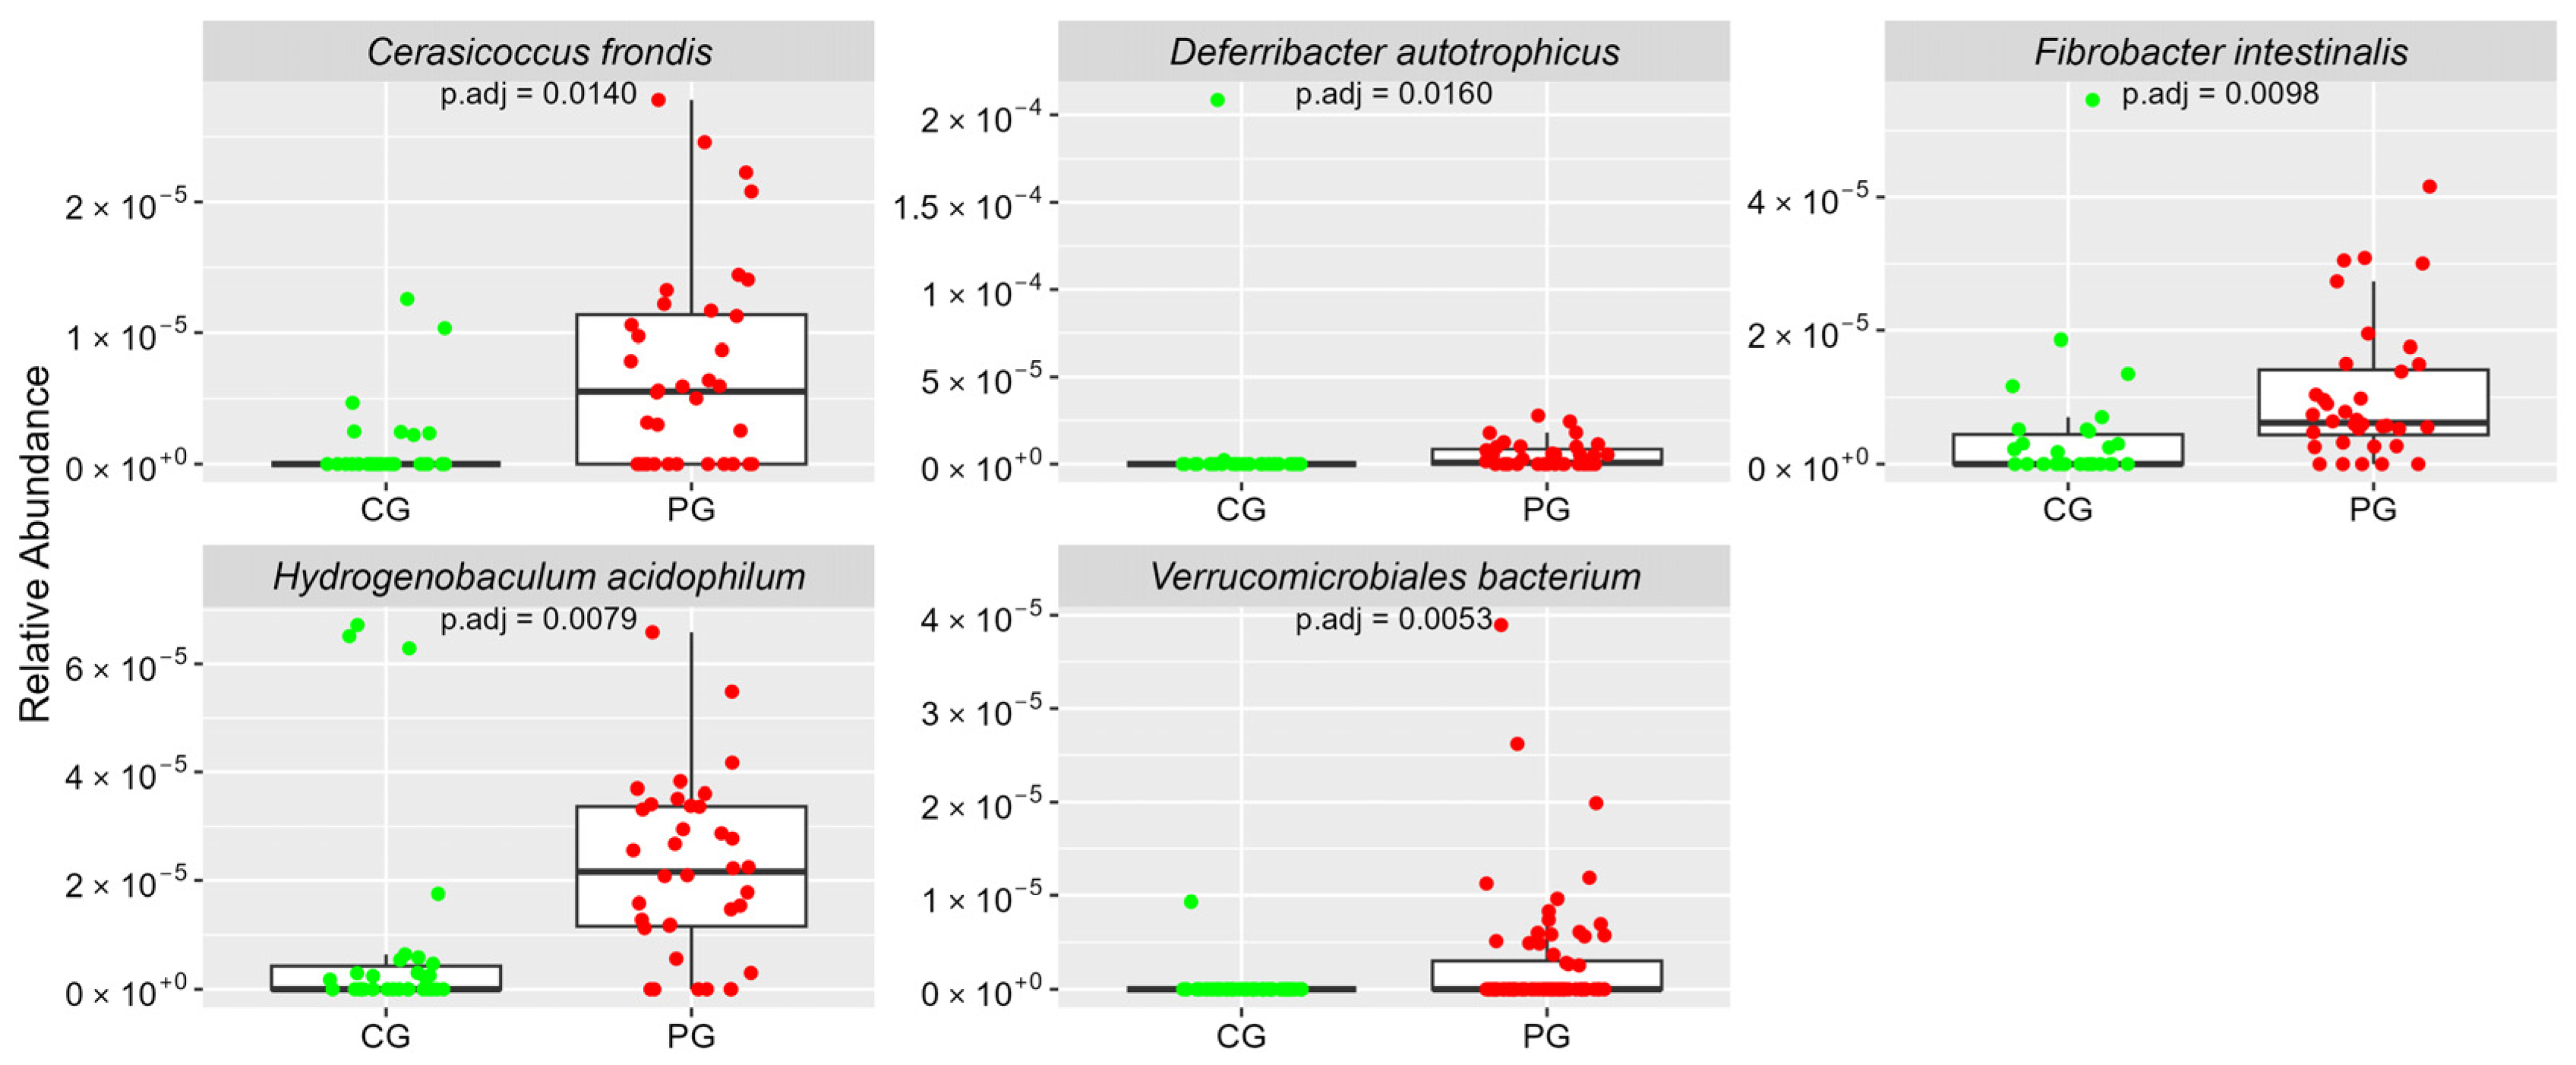
3.2.3. Significant Difference between CG and PG

Figure 1, Figure 2, Figure 3, Figure 4 and Figure 5 Show the Boxplots of the Average Relative Abundance (ar-Ab) of the Bacterial Species with a Significant Difference between CG and PG (Adjusted p < 0.05).
By searching the MEDLINE and SCOPUS health databases, we studied each of the 52 bacterial species with significant differences in ar-Ab between the groups, looking for possible associations with human diseases or health. Intriguingly, we found that six were related to human pathologies and had higher ar-Ab in PG, while three of them were related to health and had higher ar-Ab in CG (see Table 6).
After applying the circular compositional bar chart classified using the Bray–Curtis sorting angle [35] in R’s microViz package; https://www.researchgate.net/figure/Simple-example-of-a-microViz-figure-pairing-an-ordination-plot-of-microbial-samples_fig1_353154579, accessed on 3 July 2024, the distribution pattern of CG and PG (Figure 6) is obtained by analyzing the 15 species with the lowest adjusted p-values out of the 52 species with significant differences between the groups. A higher ar-Ab of the following species was found in PG: Blautia stercoris, Marvinbryantia formatexigens, Catonella morbi, Prevotella loescheii, Escherichia-Shigella dysenteriae, Abiotrophia defectiva, Halothermothrix orenii, Plasticicumulans lactativorans, Bacteroides paurosaccharolyticus, no CG, Paenibacillus brasilensis, Oribacterium sinus, Johnsonella ignava, Hespellia stercorisuis, Streptomyces auratus, and Hydrogenobaculum acidophilum.
No significant differences were found between CG and PG in the variables PhylABD, FiBaRAT, GenDIV, AM, FP, BS and BF (p > 0.05).

4. Discussion

Significant differences were found in some metrics of alpha and beta intestinal bacterial diversity between the groups, which reinforces previous preclinical and clinical studies regarding the importance of the gut lumbar spine axis.
The species richness (SpRIC) was higher in PG than in CG. This finding indicates that the generic increase in the species alpha diversity is not always the most important marker in human health conditions. In this direction, we highlight the higher average relative abundance of Clostridium difficile in relation to inflammatory conditions of the large intestine, which was higher in PG. Furthermore, we found six species related to human pathologies with greater ar-Ab in PG and three related to human health with greater ar-Ab in CG among the 52 species with different values of average relative abundance (ar-Ab). Therefore, these results reinforce the importance of composition, that is, the role of each species, its metabolites and the relationship between them and the host, as the main marker when compared to isolated richness. Furthermore, the lack of data in the literature regarding the 43 species, whose effects on the human body remain poorly understood, points to the importance of more microbiological studies that correlate bacterial species with human physiology.
We could see a distributive pattern from the graphical representation of circular compositional bars classified via the Bray–Curtis ordination angle applied to the 52 species with significant differences in ar-Ab. In summary, the graph demonstrates that the intestinal bacterial composition of people with and without chronic low back pain are different, proving the initial hypothesis of this study that there is an association between the individual intestinal microbiome and the chance of developing low back pain.
This study has some limitations in its development. The participants did not undergo imaging tests. In addition to the focus of the study being pain, the frequent clinical radiological dissociation established in relation to low back pain methodologically underpins this approach [36]. This dissociation is marked by cases of the absence of vertebral structural alterations in individuals with chronic low back pain [37]; additionally, when the alterations are present, the cases tend to be non-specific or involve unequivocal causes of pain [38]. Furthermore, we uncovered the presence of structural alterations, such as disc degeneration, in 37% of asymptomatic individuals between 20 and 30 years old and in 68% between 40 and 50 years old [39]. This finding includes asymptomatic people with vertebral structural alterations who show no alterations on imaging tests when they develop chronic low back pain. Due to technical operational limitations, sequencing was not carried out using the Shotgun technique, which otherwise would have made it possible to know all the microorganisms present in the sample analyzed and identify them precisely at the strain level. Moreover, the analysis of the elements actually transcribed derived from the microbiome or metatranscriptogenomics was not carried out, which could have elucidated the differential expression of genes in specific situations, thereby expanding knowledge regarding the relationship between the microbiome and the host [40,41].

5. Conclusions

The research carried out shows a significant difference (p < 0.05 and adjusted p < 0.05) between PG and CG for some of the taxonomic metrics evaluated and the absence for others. This information could serve as a reference for future similar research aimed at assessing the existence of a possible gut microbiota signature in chronic low back pain. Thus, more studies are needed to confirm possible associative and/or causal correlations and enable a better understanding of the molecular mechanisms that justify it, which could lead to the proposal of more effective and personalized treatments for the leading cause of years lived with disability worldwide.

Author Contributions

Conceptualization, A.M.T. and L.A.R.; methodology, A.M.T. and J.S.T.; formal analysis, A.M.T.; investigation, A.M.T. and J.S.T.; resources, A.M.T.; data curation, A.M.T. and J.S.T.; writing—original draft preparation, A.M.T. and J.S.T.; writing—review and editing A.M.T. and J.S.T.; visualization, A.M.T.; supervision, L.A.R.; project administration, A.M.T.; funding acquisition, A.M.T. All authors have read and agreed to the published version of the manuscript.

Funding

This research received no external funding.

Institutional Review Board Statement

This study was conducted in accordance with the Declaration of Helsinki, and approved by the Human Research Ethics Committee of the Santa Casa de Misericórdia de São Paulo, under opinion number 4.816.206 on 30 June 2021. All participants signed the Free and Informed Consent Statement before it began.

Informed Consent Statement

Informed consent was obtained from all subjects involved in the study.

Data Availability Statement

All complete intestinal microbiota sequencing data will be made available to all research participants upon reasonable request.

Acknowledgments

Sincere thanks to Jhones Lima, a Statistician specialized in microbiology who provided support in the statistical treatment of the generated clinical and laboratory data.

Conflicts of Interest

The authors declare no conflicts of interest.

References

  1. GBD 2021 Low Back Pain Collaborators. Global, regional, and national burden of low back pain, 1990–2020, its attributable risk factors, and projections to 2050: A systematic analysis of the Global Burden of Disease Study 2021. Lancet Rheumatol. 2023, 5, e316–e329. [Google Scholar] [CrossRef] [PubMed] [PubMed Central]
  2. Borenstein, D.G.; Balagué, F. Low Back Pain in Adolescent and Geriatric Populations. Rheum. Dis. Clin. N. Am. 2021, 47, 149–163. [Google Scholar] [CrossRef] [PubMed]
  3. Chenot, J.F.; Greitemann, B.; Kladny, B.; Petzke, F.; Pfingsten, M.; Schorr, S.G. Non-Specific Low Back Pain. Dtsch. Aerzteblatt Int. 2017, 114, 883–890. [Google Scholar] [CrossRef] [PubMed]
  4. Wang, Y.; Cheng, H.; Wang, T.; Zhang, K.; Zhang, Y.; Kang, X. Oxidative stress in intervertebral disc degeneration: Molecular mechanisms, pathogenesis and treatment. Cell Prolif. 2023, 56, e13448. [Google Scholar] [CrossRef]
  5. Francisco, V.; Pino, J.; González-Gay, M.Á.; Lago, F.; Karppinen, J.; Tervonen, O.; Mobasheri, A.; Gualillo, O. A new immunometabolic perspective of intervertebral disc degeneration. Nat. Rev. Rheumatol. 2022, 18, 47–60. [Google Scholar] [CrossRef]
  6. Hou, K.; Wu, Z.X.; Chen, X.Y.; Wang, J.Q.; Zhang, D.; Xiao, C.; Zhu, D.; Koya, J.B.; Wei, L.; Li, J.; et al. Microbiota in health and diseases. Signal Transduct. Target. Ther. 2022, 7, 135. [Google Scholar] [CrossRef]
  7. Rizzetto, L.; Fava, F.; Tuohy, K.M.; Selmi, C. Connecting the immune system, systemic chronic inflammation and the gut microbiome: The role of sex. J. Autoimmun. 2018, 92, 12–34. [Google Scholar] [CrossRef]
  8. Chen, Y.; Zhou, J.; Wang, L. Role and Mechanism of Gut Microbiota in Human Disease. Front. Cell Infect. Microbiol. 2021, 11, 625913. [Google Scholar] [CrossRef] [PubMed]
  9. Yao, B.; Cai, Y.; Wang, W.; Deng, J.; Zhao, L.; Han, Z.; Wan, L. The Effect of Gut Microbiota on the Progression of Intervertebral Disc Degeneration. Orthop. Surg. 2023, 15, 858–867. [Google Scholar] [CrossRef]
  10. Li, W.; Lai, K.; Chopra, N.; Zheng, Z.; Das, A.; Diwan, A.D. Gut-disc axis: A cause of intervertebral disc degeneration and low back pain? Eur. Spine J. 2022, 31, 917–925. [Google Scholar] [CrossRef]
  11. Rajasekaran, S.; Soundararajan, D.C.R.; Tangavel, C.; Muthurajan, R.; Sri Vijay Anand, K.S.; Matchado, M.S.; Nayagam, S.M.; Shetty, A.P.; Kanna, R.M.; Dharmalingam, K. Human intervertebral discs harbour a unique microbiome and dysbiosis determines health and disease. Eur. Spine J. 2020, 29, 1621–1640. [Google Scholar] [CrossRef] [PubMed]
  12. Aroniadis, O.C.; Grinspan, A.M. The Gut Microbiome: A Primer for the Clinician. Am. J. Gastroenterol. 2024, 119, S2–S6. [Google Scholar] [CrossRef] [PubMed]
  13. Blake, M.R.; Raker, J.M.; Whelan, K. Validity and reliability of the Bristol Stool Form Scale in healthy adults and patients with diarrhoea-predominant irritable bowel syndrome. Aliment. Pharmacol. Ther. 2016, 44, 693–703. [Google Scholar] [CrossRef] [PubMed]
  14. Chiarello, M.; McCauley, M.; Villéger, S.; Jackson, C.R. Ranking the biases: The choice of OTUs vs. ASVs in 16S rRNA amplicon data analysis has stronger effects on diversity measures than rarefaction and OTU identity threshold. PLoS ONE 2022, 17, e0264443. [Google Scholar] [CrossRef] [PubMed]
  15. Rinninella, E.; Raoul, P.; Cintoni, M.; Franceschi, F.; Miggiano, G.A.D.; Gasbarrini, A.; Mele, M.C. What is the Healthy Gut Microbiota Composition? A Changing Ecosystem across Age, Environment, Diet, and Diseases. Microorganisms 2019, 7, 14. [Google Scholar] [CrossRef] [PubMed]
  16. Vaiserman, A.; Romanenko, M.; Piven, L.; Moseiko, V.; Lushchak, O.; Kryzhanovska, N.; Guryanov, V.; Koliada, A. Differences in the gut Firmicutes to Bacteroidetes ratio across age groups in healthy Ukrainian population. BMC Microbiol. 2020, 20, 221. [Google Scholar] [CrossRef] [PubMed]
  17. Human Microbiome Project Consortium. Structure, function and diversity of the healthy human microbiome. Nature 2012, 486, 207–214. [Google Scholar] [CrossRef] [PubMed]
  18. Lewandowska-Pietruszka, Z.; Figlerowicz, M.; Mazur-Melewska, K. The History of the Intestinal Microbiota and the Gut-Brain Axis. Pathogens 2022, 11, 1540. [Google Scholar] [CrossRef] [PubMed]
  19. Trastoy, B.; Naegeli, A.; Anso, I.; Sjögren, J.; Guerin, M.E. Structural basis of mammalian mucin processing by the human gut O-glycopeptidase OgpA from Akkermansia muciniphila. Nat. Commun. 2020, 11, 4844. [Google Scholar] [CrossRef] [PubMed]
  20. Martín, R.; Rios-Covian, D.; Huillet, E.; Auger, S.; Khazaal, S.; Bermúdez-Humarán, L.G.; Sokol, H.; Chatel, J.M.; Langella, P. Faecalibacterium: A bacterial genus with promising human health applications. FEMS Microbiol. Rev. 2023, 47, fuad039. [Google Scholar] [CrossRef]
  21. Feng, Y.; Duan, Y.; Xu, Z.; Lyu, N.; Liu, F.; Liang, S.; Zhu, B. An examination of data from the American Gut Project reveals that the dominance of the genus Bifidobacterium is associated with the diversity and robustness of the gut microbiota. Microbiologyopen 2019, 8, e939. [Google Scholar] [CrossRef]
  22. Valguarnera, E.; Wardenburg, J.B. Good Gone Bad: One Toxin Away From Disease for Bacteroides fragilis. J. Mol. Biol. 2020, 432, 765–785. [Google Scholar] [CrossRef] [PubMed]
  23. Kim, J.; Cho, Y.; Seo, M.R.; Bae, M.H.; Kim, B.; Rho, M.; Pai, H. Quantitative characterization of Clostridioides difficile population in the gut microbiome of patients with C. difficile infection and their association with clinical factors. Sci. Rep. 2020, 10, 17608. [Google Scholar] [CrossRef] [PubMed]
  24. Kim, B.R.; Shin, J.; Guevarra, R.; Lee, J.H.; Kim, D.W.; Seol, K.H.; Lee, J.H.; Kim, H.B.; Isaacson, R. Deciphering Diversity Indices for a Better Understanding of Microbial Communities. J. Microbiol. Biotechnol. 2017, 27, 2089–2093. [Google Scholar] [CrossRef] [PubMed]
  25. Abbas, A.; Kong, X.B.; Liu, Z.; Jing, B.Y.; Gao, X. Automatic peak selection by a Benjamini-Hochberg-based algorithm. PLoS ONE 2013, 8, e53112. [Google Scholar] [CrossRef] [PubMed]
  26. Bathini, P.; Foucras, S.; Dupanloup, I.; Imeri, H.; Perna, A.; Berruex, J.L.; Doucey, M.A.; Annoni, J.M.; Auber Alberi, L. Classifying dementia progression using microbial profiling of saliva. Alzheimers Dement. 2020, 12, e12000. [Google Scholar] [CrossRef] [PubMed]
  27. Plugge, C.M.; Balk, M.; Zoetendal, E.G.; Stams, A.J.M. Gelria glutamica gen. nov., sp. nov., a thermophilic, obligately syntrophic, glutamate-degrading anaerobe. Int. J. Syst. Evol. Microbiol. 2002, 52 Pt 2, 401–407. [Google Scholar] [CrossRef]
  28. Wang, Z.; Peters, B.A.; Bryant, M.; Hanna, D.B.; Schwartz, T.; Wang, T.; Sollecito, C.C.; Usyk, M.; Grassi, E.; Wiek, F.; et al. Gut microbiota, circulating inflammatory markers and metabolites, and carotid artery atherosclerosis in HIV infection. Microbiome 2023, 11, 119. [Google Scholar] [CrossRef] [PubMed]
  29. Ordinola-Zapata, R.; Costalonga, M.; Dietz, M.; Lima, B.P.; Staley, C. The root canal microbiome diversity and function. A whole-metagenome shotgun analysis. Int. Endod. J. 2023, 57, 872–884. [Google Scholar] [CrossRef]
  30. Hawkes, C.G.; Hinson, A.N.; Vashishta, A.; Read, C.B.; Carlyon, J.A.; Lamont, R.J.; Uriarte, S.M.; Miller, D.P. Selenomonas sputigena Interactions with Gingival Epithelial Cells That Promote Inflammation. Infect. Immun. 2023, 91, e0031922. [Google Scholar] [CrossRef]
  31. Sasaki, M.; Shimoyama, Y.; Kodama, Y.; Ishikawa, T. Abiotrophia defectiva DnaK Promotes Fibronectin-Mediated Adherence to HUVECs and Induces a Proinflammatory Response. Int. J. Mol. Sci. 2021, 22, 8528. [Google Scholar] [CrossRef]
  32. Diao, J.; Yuan, C.; Tong, P.; Ma, Z.; Sun, X.; Zheng, S. Potential Roles of the Free Salivary Microbiome Dysbiosis in Periodontal Diseases. Front. Cell Infect. Microbiol. 2021, 11, 711282. [Google Scholar] [CrossRef]
  33. Fortes, T.O.; Alviano, D.S.; Tupinambá, G.; Padrón, T.S.; Antoniolli, A.R.; Alviano, C.S.; Seldin, L. Production of an antimicrobial substance against Cryptococcus neoformans by Paenibacillus brasilensis Sa3 isolated from the rhizosphere of Kalanchoe brasiliensis. Microbiol. Res. 2008, 163, 200–207. [Google Scholar] [CrossRef]
  34. Mosadegh, S.; Abtahi, H.; Amani, J.; Karizi, S.Z.; Salmanian, A.H. Protective immunization against Enterohemorrhagic Escherichia coli and Shigella dysenteriae Type 1 by chitosan nanoparticle loaded with recombinant chimeric antigens comprising EIT and STX1B-IpaD. Microb. Pathog. 2023, 184, 106344. [Google Scholar] [CrossRef]
  35. Ricotta, C.; Pavoine, S. A new parametric measure of functional dissimilarity: Bridging the gap between the Bray-Curtis dissimilarity and the Euclidean distance. Ecol. Model. 2022, 466, 109880. [Google Scholar] [CrossRef]
  36. Jarvik, J.G.; Hollingworth, W.; Heagerty, P.J.; Haynor, D.R.; Boyko, E.J.; Deyo, R.A. Three-year incidence of low back pain in an initially asymptomatic cohort: Clinical and imaging risk factors. Spine 2005, 30, 1541–1548, discussion 1549. [Google Scholar] [CrossRef]
  37. Brinjikji, W.; Diehn, F.E.; Jarvik, J.G.; Carr, C.M.; Kallmes, D.F.; Murad, M.H.; Luetmer, P.H. MRI Findings of Disc Degeneration are More Prevalent in Adults with Low Back Pain than in Asymptomatic Controls: A Systematic Review and Meta-Analysis. AJNR Am. J. Neuroradiol. 2015, 36, 2394–2399. [Google Scholar] [CrossRef]
  38. Ahmed, M.; Modic, M.T. Neck and low back pain: Neuroimaging. Neurol. Clin. 2007, 25, 439–471. [Google Scholar] [CrossRef]
  39. Brinjikji, W.; Luetmer, P.H.; Comstock, B.; Bresnahan, B.W.; Chen, L.E.; Deyo, R.A.; Halabi, S.; Turner, J.A.; Avins, A.L.; James, K.; et al. Systematic literature review of imaging features of spinal degeneration in asymptomatic populations. AJNR Am. J. Neuroradiol. 2015, 36, 811–816. [Google Scholar] [CrossRef]
  40. Carragee, E.; Alamin, T.; Cheng, I.; Franklin, T.; Haak, E.v.D.; Hurwitz, E. Are first-time episodes of serious LBP associated with new MRI findings? Spine J. 2006, 6, 624–635. [Google Scholar] [CrossRef]
  41. Knight, R.; Vrbanac, A.; Taylor, B.C.; Aksenov, A.; Callewaert, C.; Debelius, J.; Gonzalez, A.; Kosciolek, T.; McCall, L.I.; McDonald, D.; et al. Best practices for analysing microbiomes. Nat. Rev. Microbiol. 2018, 16, 410–422. [Google Scholar] [CrossRef]
Figure 1. The ar-Ab of bacterial species of the phylum Firmicutes between CG and PG.
Cimb 46 00435 g001
Figure 2. The ar-Ab of bacterial species of the phylum Bacteroidetes between CG and PG.
Cimb 46 00435 g002
Figure 3. The ar-Ab of the bacterial species of the phylum Proteobacteria between CG and PG.
Cimb 46 00435 g003
Figure 4. The ar-Ab of the bacterial species of the phylum Actinobacteria between CG and PG.
Cimb 46 00435 g004
Figure 5. The ar-Ab of bacterial species from other phyla between CG and PG.
Cimb 46 00435 g005
Figure 6. Circular compositional bar chart sorted using the Bray–Curtis sorting angle [35]. This graphic representation of the circle of outer lines shows each participant, with the green rectangles representing CG and the red ones representing PG. In the central projection, the pattern found in the survey is represented according to the color palette, showing 15 more abundant species (6 in CG, 9 in PG) out of the 52 revealed through the diversity indices applied with adjusted p differences < 0.05.
Cimb 46 00435 g006
Table 1. Bioma4me* laboratory reference values for selected indicators. AM, FP and BS are associated with health, while BF and CD are associated with disease.
IndicatorReference
Phylum
Abundance of Firmicutes and Bacteroidetes in relation to other phyla (PhylABD) 85–95% [15]
Firmicutes and Bacteroidetes Ratio (FiBaRAT)0.7–1.0 [16]
Gender
Gender diversity (GenDIV)Greater than 7.0 [17]
Species
Species richness (SpRIC)Greater than 540 [18]
Protective
Akkermansia muciniphila (AM)1–5% [19]
Faecalibacterium prausnitzii (FP)5–12% [20]
Bifidobacterium spp. (BS)1–6% [21]
Pathogenic
Bacteroides fragilis (BF)Less than 0.5% [22]
Clostridium difficilis (CD)0 [23]
Bioma4me*: https://biomagenetics.com.br/quem-somos.html, accessed on 3 July 2024.
Table 2. Descriptive demographic and clinical data of the sample between the control group (CG) and the low back pain group (PG).
VariablesCGPGp
Gender: M/F: n, (%)11/22 (33.3/66.6)16/24
(40/60)
Chi-squared = 0.1181, df = 1
p = 0.7311
Age: mean (SD)39.79 ± 7.7338.58 ± 8.1Mann–Whitney = 720.5,
p = 0.5055
* Ethnicity: W/B/other, n, (%)19, 9, 5 (57.5/27.2/15.1)27, 11, 2
(67.5/27.5/5.0)
Chi-squared = 6.2703, df = 2
p = 0.0435
* Average income (SD)R$ 10,636.70
± 14,660.44
USD 1970.96
± 2716.55
R$ 6161.00
± 6868.45
USD 1141.62
± 1272.71
Mann–Whitney = 637.5
p = 0.2105
* BMI: mean (SD)23.6 ± 2.525.2 ± 2.9Mann–Whitney = 457
p = 0.0248
Hours of sleep at night<6 h: 9
6–7.5 h: 22
>7: 1
<6 h: 18
6–7.5 h: 14
>7: 5
Chi-squared = 7.1195, df = 2
p = 0.0284
*N Meals/day: mean (SD)3.54 ± 0.93.5 ± 1.0Chi-squared = 7.5132, df = 4
p = 0.1111
*N Amount of fiber: R/Po: n, (%)21, 12
(63.6/36.4)
13, 27
(32.5/67.5)
Chi-squared = 5.0875, df = 1
p = 0.0241
*N Liq at mealtimes: Y/N: n, (%)12, 21
(36.7/63.6)
19, 21
(47.5/52.5)
Chi-squared = 0.19136, df = 1
p = 0.6618
*N Larger meal: M/A/E: n, (%)5, 23, 5
(15.1/69.7/15.1)
6, 27, 7
(15.0/67.5/17.5)
Chi-squared = 0.16572, df = 2
p = 0.9205
* Route of birth: V/C/nd: n, (%)22, 9, 2
(66.6/27.3/6.0)
24, 12, 4
(60.0/30.0/10.0)
Chi-squared = 0.5157, df = 2
p = 0.7720
** Bristol stool scale: mode33***
** Stool frequency: means, DP1 (0.7)1 (1.0)Chi-squared = 0.5157, df = 2
p = 0.0308
** D/C oscillation: Y/N: n, (%)4, 29
(12.1/87.9)
27, 13
(67.5/32.5)
Chi-squared = 20.487, df = 1
p = 6.003 × 10⁻⁶
Legend: M/F male/female; SD standard deviation; W/B white/brown; BMI body mass index; R/Po rich/poor; Liq liquid; Y/N yes/no; M/A/E morning/afternoon/evening; V/C/nd vaginal/cesarean section/no data; n number; D/C diarrhea and constipation. * Information obtained from the research clinical form. *N Information obtained from the clinical research form nutrition survey. ** Information obtained from the stool characteristics form. *** No significant differences; 6.003 × 10−6 = 0.000006003.
Table 3. Shows the species richness and relative abundance of Clostridium difficile in CG and PG.
VariablesCGPGp < 0.05
SpRIC n (dp)869.79 (182.520)962.93 (196.400)0.030
CD m-ppm (dp)0.001 (0.002)0.003 (0.003)0.011
n: absolute number; m-ppm: mean in parts per million; dp: standard deviation.
Table 4. Mean (m) and standard deviation (SD) of patient diversity indices between CG and PG (adjusted p < 0.05).
Diversity IndexCG m (dp)PG m (dp)Adjusted p
ACE1192.25 (219.06)1330.47 (252.54)0.0263
Observed844.33 (165.66)951.28 (191.93)0.0272
Chao11188.68 (224.93)1334.59 (253.37)0.0263
Fisher105.31 (24.87)129.58 (29.48)0.0045
m: mean; (dp): standard deviation.
Table 5. The 52 bacterial species with significant differences (adjusted p < 0.05) in terms of average relative abundances (ar-Ab) and mean-standard deviation (sd), with 36 more abundant in PG and 16 in CG.
Taxonomy (Phylum and Species)CGPGAdjusted p
Phylum Firmicutesar-Ab (sd)ar-Ab (sd)
Blautia stercoris4.97 (19.43)7.11 (20.22)0.0034
Paenibacillus brasilensis1.46 (2.02)0.68 (1.65)0.0062
Oribacterium sinus1.39 (1.20)0.49 (0.56)0.0130
Johnsonella ignava0.93 (3.77)0.08 (0.11)0.0012
Marvinbryantia formatexigens0.80 (1.71)2.91 (2.18)0.0006
Catonella morbi0.54 (0.46)1.31 (0.85)0.0056
Hespellia stercorisuis0.36 (0.35)0.10 (0.10)0.0051
Thermodesulfobium narugense0.13 (0.11)0.07 (0.14)0.0370
Selenomonas flueggei0.12 (0.10)0.06 (0.12)0.0250
Abiotrophia defectiva0.08 (0.16)0.57 (1.18)0.0023
Halothermothrix orenii0.07 (0.18)0.28 (0.23)0.0029
Filifactor villosus0.06 (0.06)0.02 (0.04)0.0160
Butyrivibrio proteoclasticus0.06 (0.11)0.01 (0.02)0.0360
Oribacterium asaccharolyticum0.06 (0.06)0.02 (0.04)0.0330
Facklamia ignava0.05 (0.08)0.23 (0.23)0.0007
Sporomusa ovata0.04 (0.14)0.09 (0.09)0.0160
Pseudoramibacter alactolyticus0.03 (0.07)0.09 (0.10)0.0250
Marininema halotolerans0.02 (0.06)0.16 (0.18)0.0021
Clostridium tepidiprofundi0.01 (0.02)0 (0.02)0.0260
Acetobacterium fimetarium0.01 (0.04)0.07 (0.09)0.0330
Mahella australiensis0.01 (0.02)0.04 (0.06)0.0250
Clostridium aminophilum0.01 (0.02)0.03 (0.05)0.0098
Selenomonas sputigena0.01 (0.02)0.07 (0.14)0.0051
Gelria glutamica0.01 (0.03)0.12 (0.11)0.0012
Sporanaerobacter acetigenes0.01 (0.03)0.22 (0.31)0.0058
Shimazuella kribbensis0.01 (0.04)0.10 (0.12)0.0110
Carboxydocella manganica0 (0.01)0.05 (0.06)0.0055
Phylum Bacteroidetesar-Ab (sd)ar-Ab (sd)
Bacteroides paurosaccharolyticus0.49 (1.97)0.51 (0.52)0.0120
Prevotella loescheii0.20 (0.46)0.85 (1.38)0.0360
Bacteroides heparinolyticus0.13 (0.15)0.05 (0.14)0.0340
Sediminitomix flava0.07 (0.16)0.15 (0.15)0.0140
Bacteroides barnesiae0.06 (0.12)0.16 (0.14)0.0058
Prevotella marshii0.05 (0.08)0.01 (0.04)0.0160
Perexilibacter aurantiacus0.02 (0.05)0.07 (0.07)0.0017
Phylum Proteobacteriaar-Ab (sd)ar-Ab (sd)
Escherichia/Shigella dysenteriae0.04 (0.12)1.14 (3.88)0.0098
Plasticicumulans lactativorans0.04 (0.11)0.3 (0.39)0.0012
Gamma proteobacterium0.03 (0.06)0.01 (0.04)0.0190
Desulfosoma profundi0.02 (0.09)0.19 (0.24)0.0053
Methylogaea oryzae0.02 (0.06)0.09 (0.12)0.0110
Lysobacter sp.0.01 (0.04)0.05 (0.17)0.0150
Desulfonema magnum0 (0.02)0.09 (0.16)0.0030
Phylum Actinobacteriaar-Ab (sd)ar-Ab (sd)
Geothrix fermentans0.02 (0.04)0.13 (0.20)0.0440
Streptomyces auratus0.2 (0.19)0.07 (0.15)0.0053
Egibacter rhizosphaerae0.03 (0.14)0.07 (0.18)0.0160
Pseudoclavibacter soli0.02 (0.03)0.15 (0.25)0.0360
Pseudonocardia nitrificans0.01 (0.02)0 (0.01)0.0340
Gaiella occulta0 (0.01)0.03 (0.04)0.0420
Othersar-Ab (sd)ar-Ab (sd)
Hydrogenobaculum acidophilum0.08 (0.20)0.22 (0.16)0.0079
Deferribacter autotrophicus0.07 (0.38)0.05 (0.07)0.0160
Fibrobacter intestinalis0.04 (0.11)0.10 (0.10)0.0098
Cerasicoccus frondis0.01 (0.03)0.07 (0.08)0.0140
Verrucomicrobiales bacterium0 (0.01)0.03 (0.06)0.0053
Average relative abundance (ar-Ab) of bacterial species in parts per million followed by the standard deviation in parentheses (sd), which showed a significant difference between CG and PG (adjusted p < 0.05).
Table 6. The species with significantly different ar-Ab between CG and PG (adjusted p < 0.05) and association with pathology or human health.
Bacterial SpeciesCG ar-AbPG ar-AbpAssociation with Pathology or Health
Filifactor villosus * 0.06 (0.06) 0.02
(0.04)
0.0160 Inversely associated with the severity of Alzheimer’s disease [26]
Gelria glutamica ** 0.01 (0.03) 0.12
(0.11)
0.0012 Glutamate-degrading bacteria [27]
Johnsonella ignava * 0.93 (3.77) 0.08
(0.11)
0.0012 Inversely associated with carotid plaques and inflammatory activation [28]
Pseudoramibacteralactolyticus ** 0.03 (0.07) 0.09
(0.10)
0.0250Associated with endodontic infections [29]
Selenomonas sputigena ** 0.01 (0.02) 0.07 (0.14) 0.0051 Associated with periodontitis [30]
Abiotrophia defectiva ** 0.08 (0.16) 0.57 (1.18) 0.0023 Associated with the pathogenesis of endocarditis [31]
Catonella morbi ** 0.54 (0.46) 1.31 (0.85) 0.0056 Associated with periodontal disease [32]
Paenibacillus brasilensis * 1.46 (2.02) 0.68 (1.65) 0.0062 Produces antimicrobial substance against the pathological species Cryptococcus neoformans [33]
Escherichia/Shigella dysenteriae ** 0.04 (0.12) 1.14 (3.88) 0.0098 Causes inflammation and ulceration of the mucosa of the large intestine [34]
* Species related to human health and with greater ar-Ab in CG. ** Species related to human pathologies and with greater ar-Ab in PG.
Disclaimer/Publisher’s Note: The statements, opinions and data contained in all publications are solely those of the individual author(s) and contributor(s) and not of MDPI and/or the editor(s). MDPI and/or the editor(s) disclaim responsibility for any injury to people or property resulting from any ideas, methods, instructions or products referred to in the content.

