Article

ALA Promotes Sucrose Accumulation in Early Peach Fruit by Regulating SPS Activity

1
Institute of Pomology, Jiangsu Academy of Agricultural Sciences, Jiangsu Key Laboratory of Horticultural Crop Genetic Improvement, 50 Zhongling Street, Nanjing 210014, China
2
College of Horticulture, Nanjing Agricultural University, Nanjing 210095, China
*
Author to whom correspondence should be addressed.
Curr. Issues Mol. Biol. 2024, 46(8), 7944-7954; https://doi.org/10.3390/cimb46080469 (registering DOI)
Submission received: 4 July 2024 / Revised: 22 July 2024 / Accepted: 22 July 2024 / Published: 24 July 2024
(This article belongs to the Section Molecular Plant Sciences)

Abstract

:
5-Aminolevulinic acid (ALA), as a novel plant growth regulator, is a critical precursor for the biosynthesis of porphyrin compounds in all organisms. Many studies have reported that exogenous ALA treatment could improve fruit sweetness. However, the mechanism by which ALA promotes the increase in sugar content in fruit remains unclear. In this study, we found that ALA significantly promoted sucrose accumulation and SPS (sucrose phosphate synthase) activity in peach fruit. At 14, 28, 42, 50 and 60 days after ALA treatment, sucrose content of fruit was increased by 23%, 43%, 37%, 40% and 16%, respectively, compared with control treatment, and SPS enzyme activity was increased by 21%, 28%, 47%, 37% and 29%, respectively. Correlation analysis showed that the sucrose content of peach fruit under ALA treatment was significantly positively correlated with SPS activity. Subsequently, bioinformatics was used to identify SPS gene family members in peach fruit, and it was found that there were four members of the PpSPS gene family, distributed on chromosomes 1, 7 and 8, named PpSPS1, PpSPS2, PpSPS3 and PpSPS4, respectively. The results of qRT-PCR showed that PpSPS2 and PpSPS3 were highly expressed in response to ALA during fruit development, and the expression of PpSPS2 was positively correlated with SPS activity and sucrose accumulation in peach fruit. The results of tobacco subcellular localization showed that PpSPS2 was mainly distributed in the cytoplasm and nucleus, while PpSPS3 was mainly distributed in the nucleus. The results of this study will lay the foundation for further study on the functions of PpSPS and the regulation of sugar metabolism during the development and ripening of peach fruit by ALA.

1. Introduction

The peach (Prunus persica L.) is a small deciduous tree belonging to the peach subgenus of the rose family, and its fruits are popular in domestic and foreign markets. Sugar is one of the important factors in determining the flavor of peach fruit, and the sweet taste of peach fruit is often more favored by consumers. At present, China’s peach cultivation area and output are ranked first in the world. Early, middle and late varieties of planting, enrich the fruit market, which also brings huge income to growers [1]. However, most early-maturing varieties have weak fruit flavor and low quality [2]. The sugar accumulation in peach fruit is determined by the metabolism of photosynthetic products from “source” to “sink” loading, transportation, unloading and carbohydrate transformation in the fruit [3]. The medium- and late-maturing varieties have a longer fruity period and a longer photosynthetic time, so the accumulated soluble sugar content is relatively high. Therefore, efforts to improve the quality of early peaches have become one of the important goals of peach production in China.
In ripe peach fruit, the main sugar is sucrose, followed by reducing sugar, including glucose and fructose, and the sorbitol content is relatively low [4]. Although sorbitol is the main transport form of photosynthetic products in roseaceae, it still plays an important role in sucrose metabolism in fruit [5]. The main enzymes involved in sucrose metabolism in fruit are sucrose invertase, sucrose synthase (sucrose synthase, EC 2.4.1.13, SuS) and sucrose phosphate synthase (SPS, EC 2.4.1.14) [6]. SuS and SPS were related to sucrose synthesis and catalyzed the reversible reaction of uridine diphosphate glucose (UDGP) and fructose-6-phosphate with UDGP and fructose to sucrose production, respectively [7,8]. The changes in sucrose metabolizing enzyme activity in fruit were closely related to the level of sugar accumulation and the composition of fruit sugar [9]. Exogenous hormones, external environmental factors and cultivation measures also have important effects on the sugar content of fruits. It was found that the use of exogenous ABA and GA4+7 at a certain concentration could effectively increase the accumulation of sugar in peach fruit. Moderate water stress can increase the sugar content of fruit, induce an increase in ABA levels in peach fruit and activate sorbitol metabolism, thus promoting sugar accumulation [10,11]. Kumar et al. (2010) pruned peaches to three different degrees: light, medium and heavy. The results showed that moderate and severe pruning could significantly improve the quality, including soluble sugar content [12].
5-Aminolevulinic acid (ALA), as a popular growth regulator, is a key precursor for the biosynthesis of porphyrin compounds in all organisms [13]. It can increase the net photosynthetic rate of leaves, enhance plant stress resistance, promote plant growth, improve yield and quality when promoting chlorophyll synthesis, and have a broad application prospect in agriculture and forestry production [14,15,16]. In terms of improving fruit quality, ALA not only promoted anthocyanin accumulation in apples and other colored fruits, but also promoted sugar accumulation in fruits and reduced titratable acid content [17]. Recent research also showed that ALA improved internal qualities, such as soluble protein content and enhanced fruit flavor and nutrient content [1].
However, the mechanism by which ALA promotes the accumulation of sugar in fruit is still lacking. The results of the determination of sucrose showed that ALA could significantly promote sucrose accumulation in peach fruit. The qRT-PCR results showed that PpSPS2 expression was significantly positively correlated with sucrose content in peach fruit, and ALA could significantly promote SPS activity, suggesting that ALA played an important role in promoting peach sucrose accumulation. Therefore, the study of peach sucrose metabolism and regulation mechanisms is of great significance for improving fruit quality, commodity value and market competitiveness and has been a hot spot in the field of fruit sugar metabolism research.

2. Materials and Methods

2.1. Plant Materials and Chemical Treatments

The experiment was conducted from March 2021 to June 2022 in Nanjing, China, with a subtropical monsoon climate, abundant rainfall, and four distinct seasons. The experimental variety was Prunus persica ‘Zhongyoutao 4’, which were four-year-old nectarine trees, arranged in east–west rows with a plant spacing of 1 m × 4 m and Y-shaped pruning. ‘Zhongyoutao 4’is an early-mature nectarine variety with yellow flesh, a pleasant aroma, and high quality. Two treatments were set up at different growth and development stages of peach fruit, including the control (spraying with clean water) and the ALA treatment (spraying with 10 mg L−1 ALA). The ALA concentration used was referred to by Guo Lei et al. (2013) [18]. The ALA solution was foliar sprayed on 10 April, 20 days after full blooming, when the young fruits were at the cell division stage. An ALA solution of 10 mg L−1 was sprayed at the second rapid expansion period of fruit development (23 May, 60 d after full blooming). Eight peach trees with similar growth potential were selected for each treatment and randomly arranged in a single plot. Unified cultivation and management measures were adopted after treatment.

2.2. The Determination of Physiological and Biochemical Indicators of Peach Fruits

Determination of individual fruit weight: 20 fruit weights were accurately weighed with a balance and averaged. Determination of soluble solids in fruit: The equatorium-symmetric position on the left and right of the suture line of each fruit was selected, measured by a PAL-1 digital display sugar meter, and the reading was recorded. Each treatment was repeated 20 times, and the average value was taken. The content of total soluble sugar in fruit was determined by the anthrone colorimetric method [19]. The content of total soluble protein in fruit was determined by the Coomassie brilliant blue method [19]. The titrable acid content of the fruit was determined by acid-base titration [20]. The content of vitamin C in fruit was determined by the UV-visible light method [21].

2.3. Sucrose Determination

The nectarine fruits of the field experiment were collected after ALA treatment, including 14, 28, 40, 50 and 60 days after treatment. The soluble sugars of nectarine fruits were determined using high-performance liquid chromatography (HPLC). The method of determination of sucrose in peach fruit samples was based on Liang et al. [1]. The chromatographic conditions were as follows: liquid chromatography (Acquity UPLC H-class, Waters, Milford, MA, USA), Prevail carbohydrate ES 5u column (100 mm × 4.6 mm, 5 μm), ELSD detector, column temperature 50 °C, mobile phase: acetonitrile/water = 80/20 (v/v), injection volume 2 μL, and flow rate 1.0 mL min−1. The ELSD2000 evaporative light scattering detector parameters were as follows: nitrogen as the carrier gas, gas flow 1.5 mL min−1 and drift tube temperature 80 °C. The content of sucrose in the fruits was calculated according to the sample peak areas and standard curves of each sugar. At least three biological repetitions were conducted.

2.4. Determination of SPS Activity

Total protein of peach fruit under different treatments was extracted with the plant total protein extraction kit (Nanjing Kangwei Century Biotechnology Co., Ltd., Nanjing, China, item No. CW0885S), and total protein concentration was determined with the BCA protein quantitative kit (Kangwei Century Biotechnology Co., LTD., item No. CW0014S). The total protein concentration of peach fruit under different treatments was diluted to the same concentration before determining the PpSPS activity of peach fruit. A sucrose phosphate synthetase (SPS) activity assay kit (Shanghai Fusheng Industrial Co., Ltd., Shanghai, China, Item No. A112622) and microcoder were used to detect SPS activity. Three biological replicates were taken and averaged.

2.5. Identification of SPS Genes in Peaches and Other Plants

The Hidden Markov Model (HMM) [22] analysis and a Simple Modular Architecture Research Tool (SMART) [23] were used for the search. The HMM profile was downloaded from the Pfam protein family database (http://pfam.xfam.org/) to obtain the Pfam number of the protein sequence. The domain contained in the target protein sequence was detected using the HMM search command in the HMMER package, with an e-value ≤1 × 10⁻³. The results of the HMMER sequence alignment were screened to remove protein sequences that were 45% longer than the length of the HMM model domain while retaining the longest protein sequence in the variable shear. All nonredundant protein sequences were retrieved and further analyzed with SMART (a Simple Modular Architecture Research Tool) (http://smart.embl-heidelberg.de/) to examine the results. The same genes were confirmed as family members. Gene structure analysis: the information about exon-intron structures was acquired from reference genome annotation files. The alignment of the cDNAs with their corresponding genomic DNA sequences. Chromosomal distribution: the location information of the genes and the conserved regions were confirmed by reference genome annotation files and then plotted using the SVG package of the Perl programming language.

2.6. Bioinformatics Analysis

The MEME program (http://alternate.meme-suite.org/tools/meme, accessed on 25 July 2023) was used to identify the motifs in the gene family sequences [24]. The maximum motif search value was set at 15 and an optimum motif width of 10-100 amino acid residues. Other parameters are default. The phylogenetic tree was constructed with the neighbor-joining algorithm in MEGA (version 7.0) [25] with a bootstrapping test of 1000 times. The gene structure and motifs were analyzed using a systematic evolution relationship.

2.7. RNA Isolation and Quantitative Real-Time Fluorescence PCR (qRT-PCR)

After fruit samples were frozen in liquid nitrogen, use kits (Cat. No. 19291ES50; Cat. No. 11121ES60, Yeasen Biotechnology (Shanghai, China) Co., Ltd.) to extract and reverse transcription, respectively, following the manufacturer protocols. Design primers for real-time PCR using Primer 5 software, with PpTEF (translation elongation factor) gene as the internal reference gene. The RT-qPCR was performed as previously described [1]. The primer sequences used are listed in Table S1. The 2−ΔΔCT method was used to calculate the relative expressions of genes [26]. Three independent biological replicates were performed for each experiment.

2.8. Subcellular Localization of PpSPS2 and PpSPS3 in N. benthamiana

The WoLF PSORT (http://www.genscript.com/wolf-psort.html, accessed on 25 July 2023) was performed to predict the subcellular localization of PpSPS2 and PpSPS3. The PpSPS2 and PpSPS3 without the stop codon removed were cloned and constructed into the pCambia1302 vector containing green fluorescent protein (GFP) tag to obtain the recombinant plasmids pcambia1302-PpSPS2-GFP and pCambia1302-PpSPS3-GFP, which were then transformed into GV3101 competent cells (Shanghai Weidi Biotechnology Co., Ltd., Shanghai, China, CAT#: AC1001). The determination of the subcellular location of PpSPS2 and PpSPS3 was performed as previously described [27]. The primer sequences used are listed in Table S1.

2.9. Statistics and Reproducibility

The data are the means of at least three independent biological replications. Statistical analyses are performed using a two-sided Student’s t-test or a one-way ANOVA followed by mean separation with Tukey’s honestly significant difference test or Duncan’s multiple range test.

3. Results

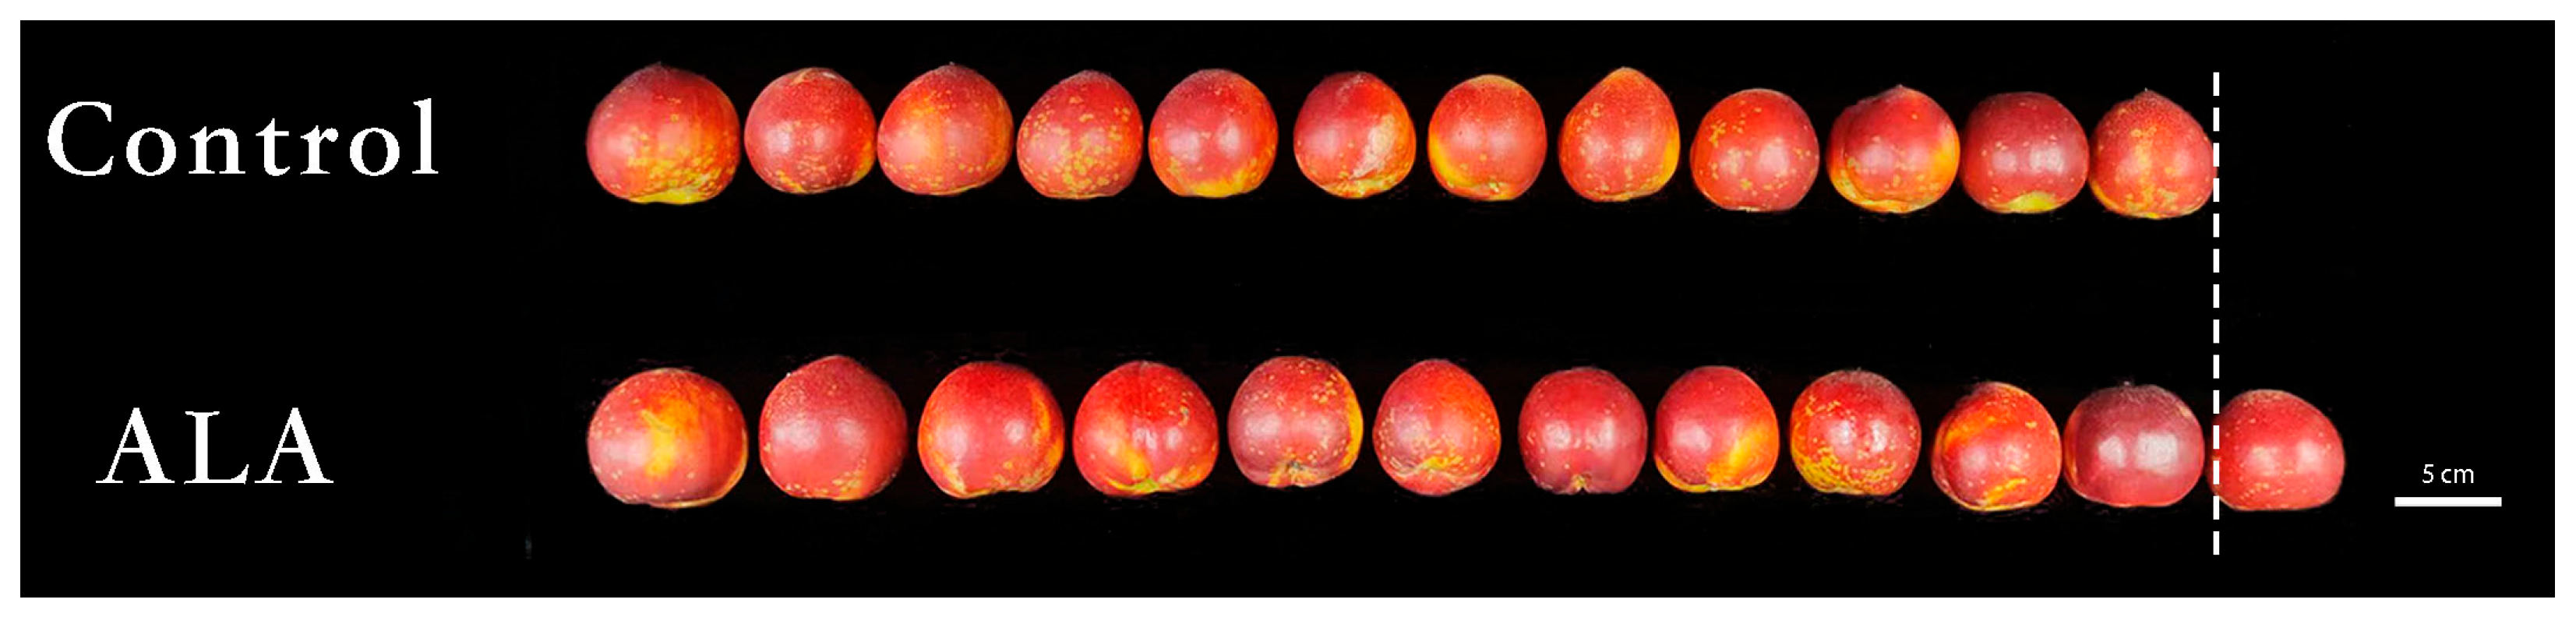
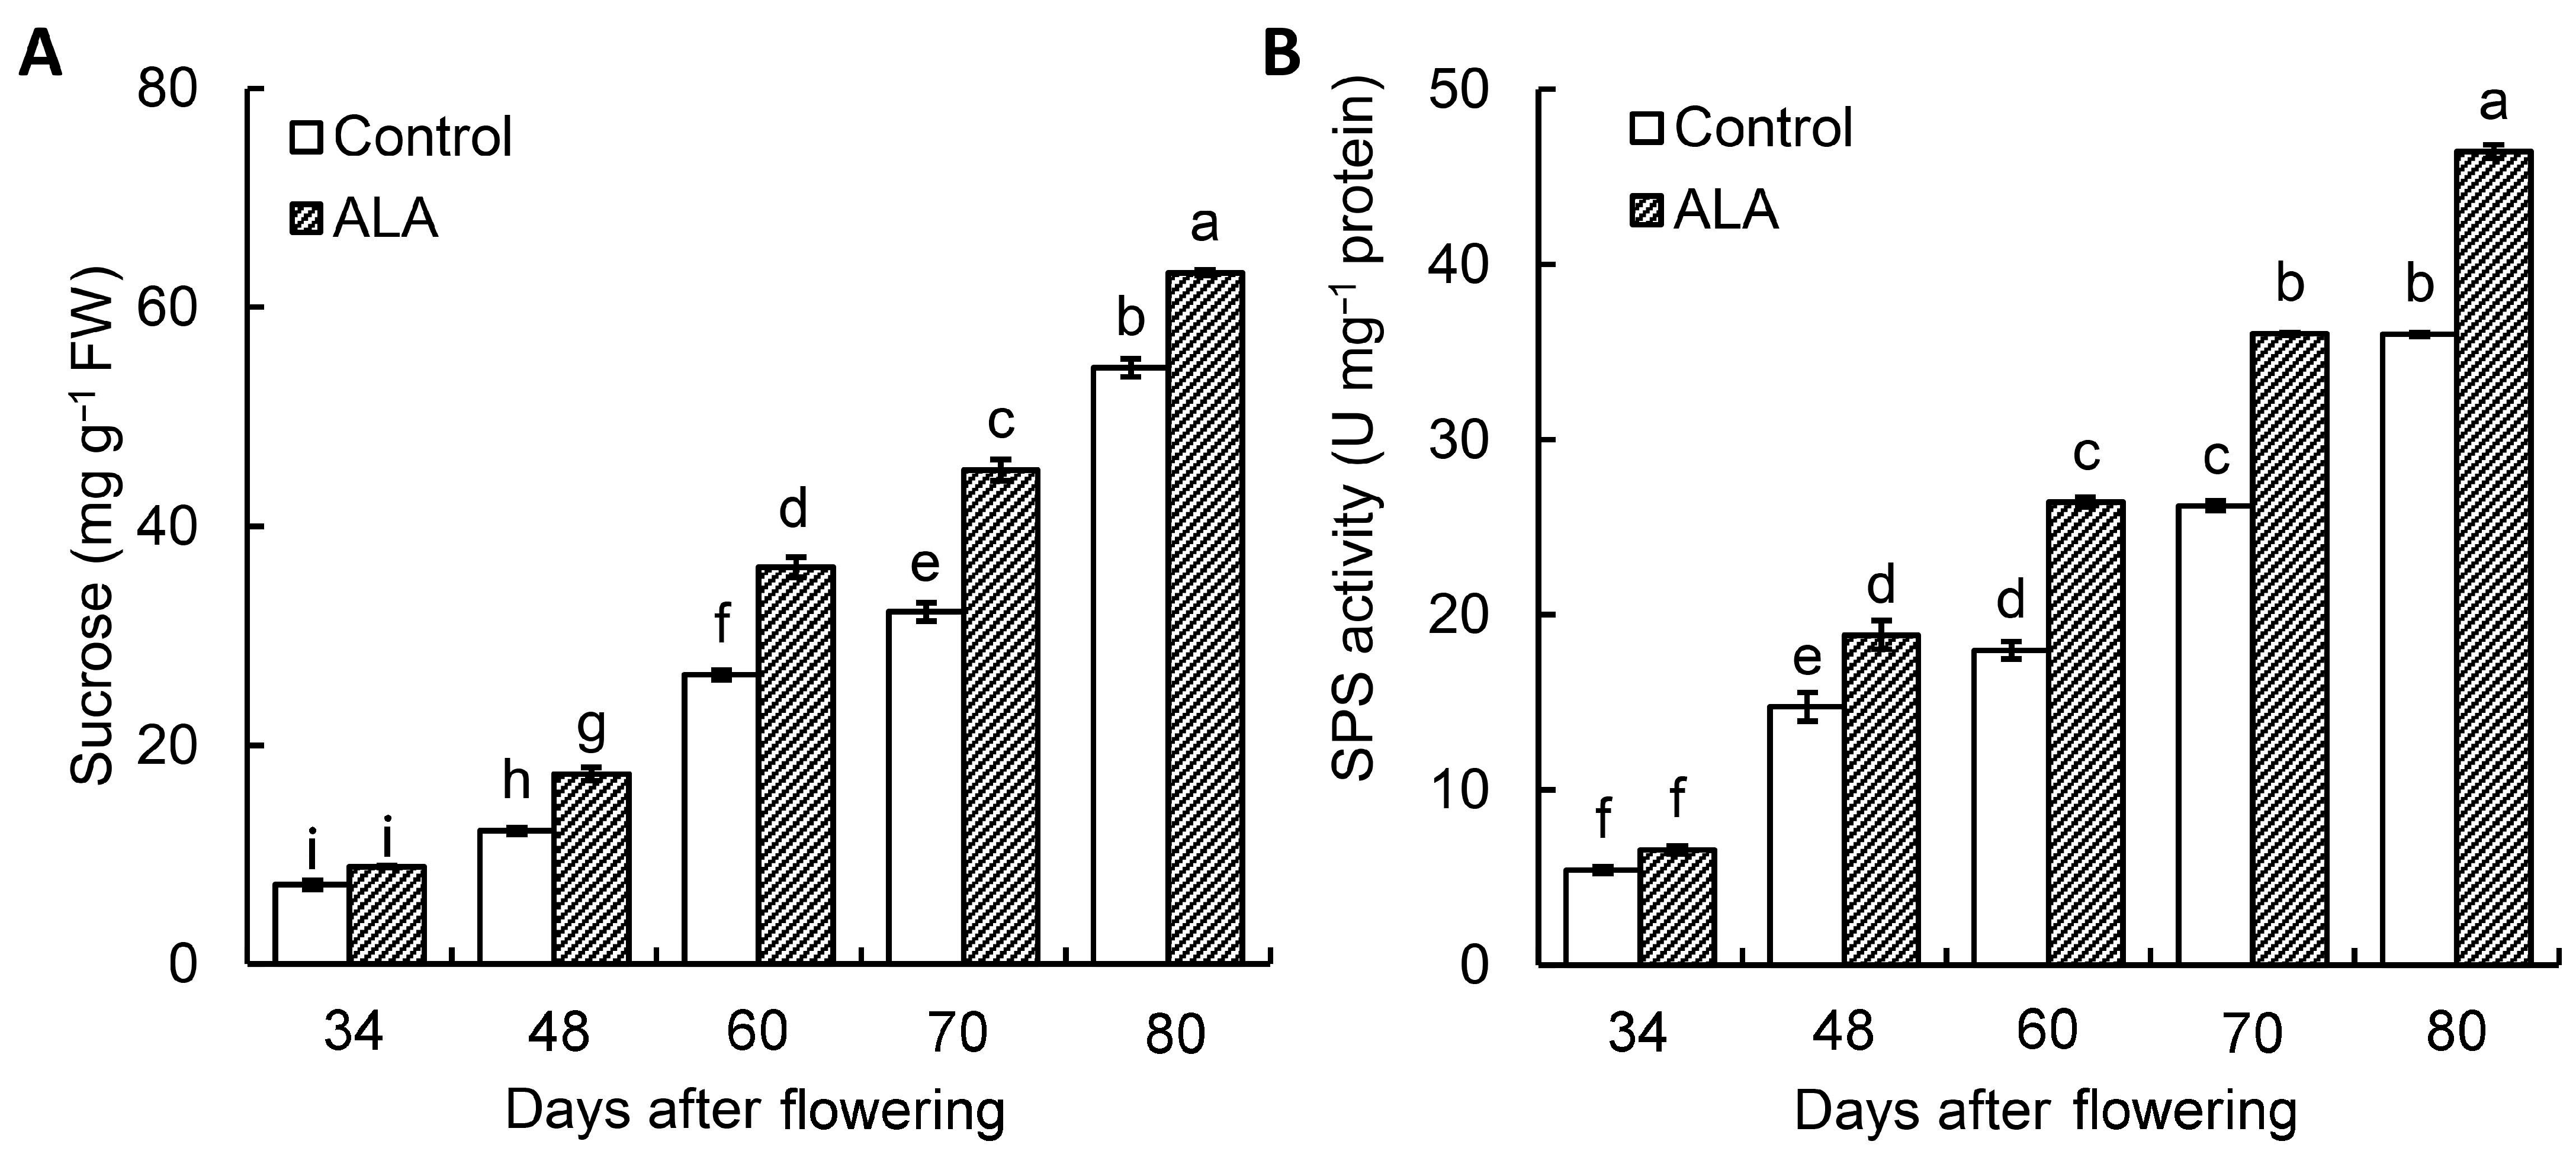
3.1. ALA Promoted the Sucrose Content and SPS Activity of Peach Fruit during Fruit Development

Comparing the same number of peach fruits in different treatment groups under the same sampling standard, the results showed that the peach fruit in the ALA treatment group was significantly larger than that in the control group (Figure 1), and the average fruit weight was significantly higher than that in the control group (Table 1), suggesting that spraying ALA at the fruit expansion stage could promote fruit growth. In addition, ALA treatment could significantly increase the contents of soluble solids, soluble sugar and soluble protein in peach fruit (Table 1).

3.2. ALA Promoted the Sucrose Content and SPS Activity of Peach Fruit during Fruit Development

After 48 days of flowering ALA treatment, we found that the sucrose of the peach was significantly improved (Figure 2A). In addition, we also found that ALA significantly improved the SPS activity of the peach fruits (Figure 2B). Correlation analysis showed that sucrose content in peach fruit was positively correlated with SPS activity (Table S2 and Figure S1).

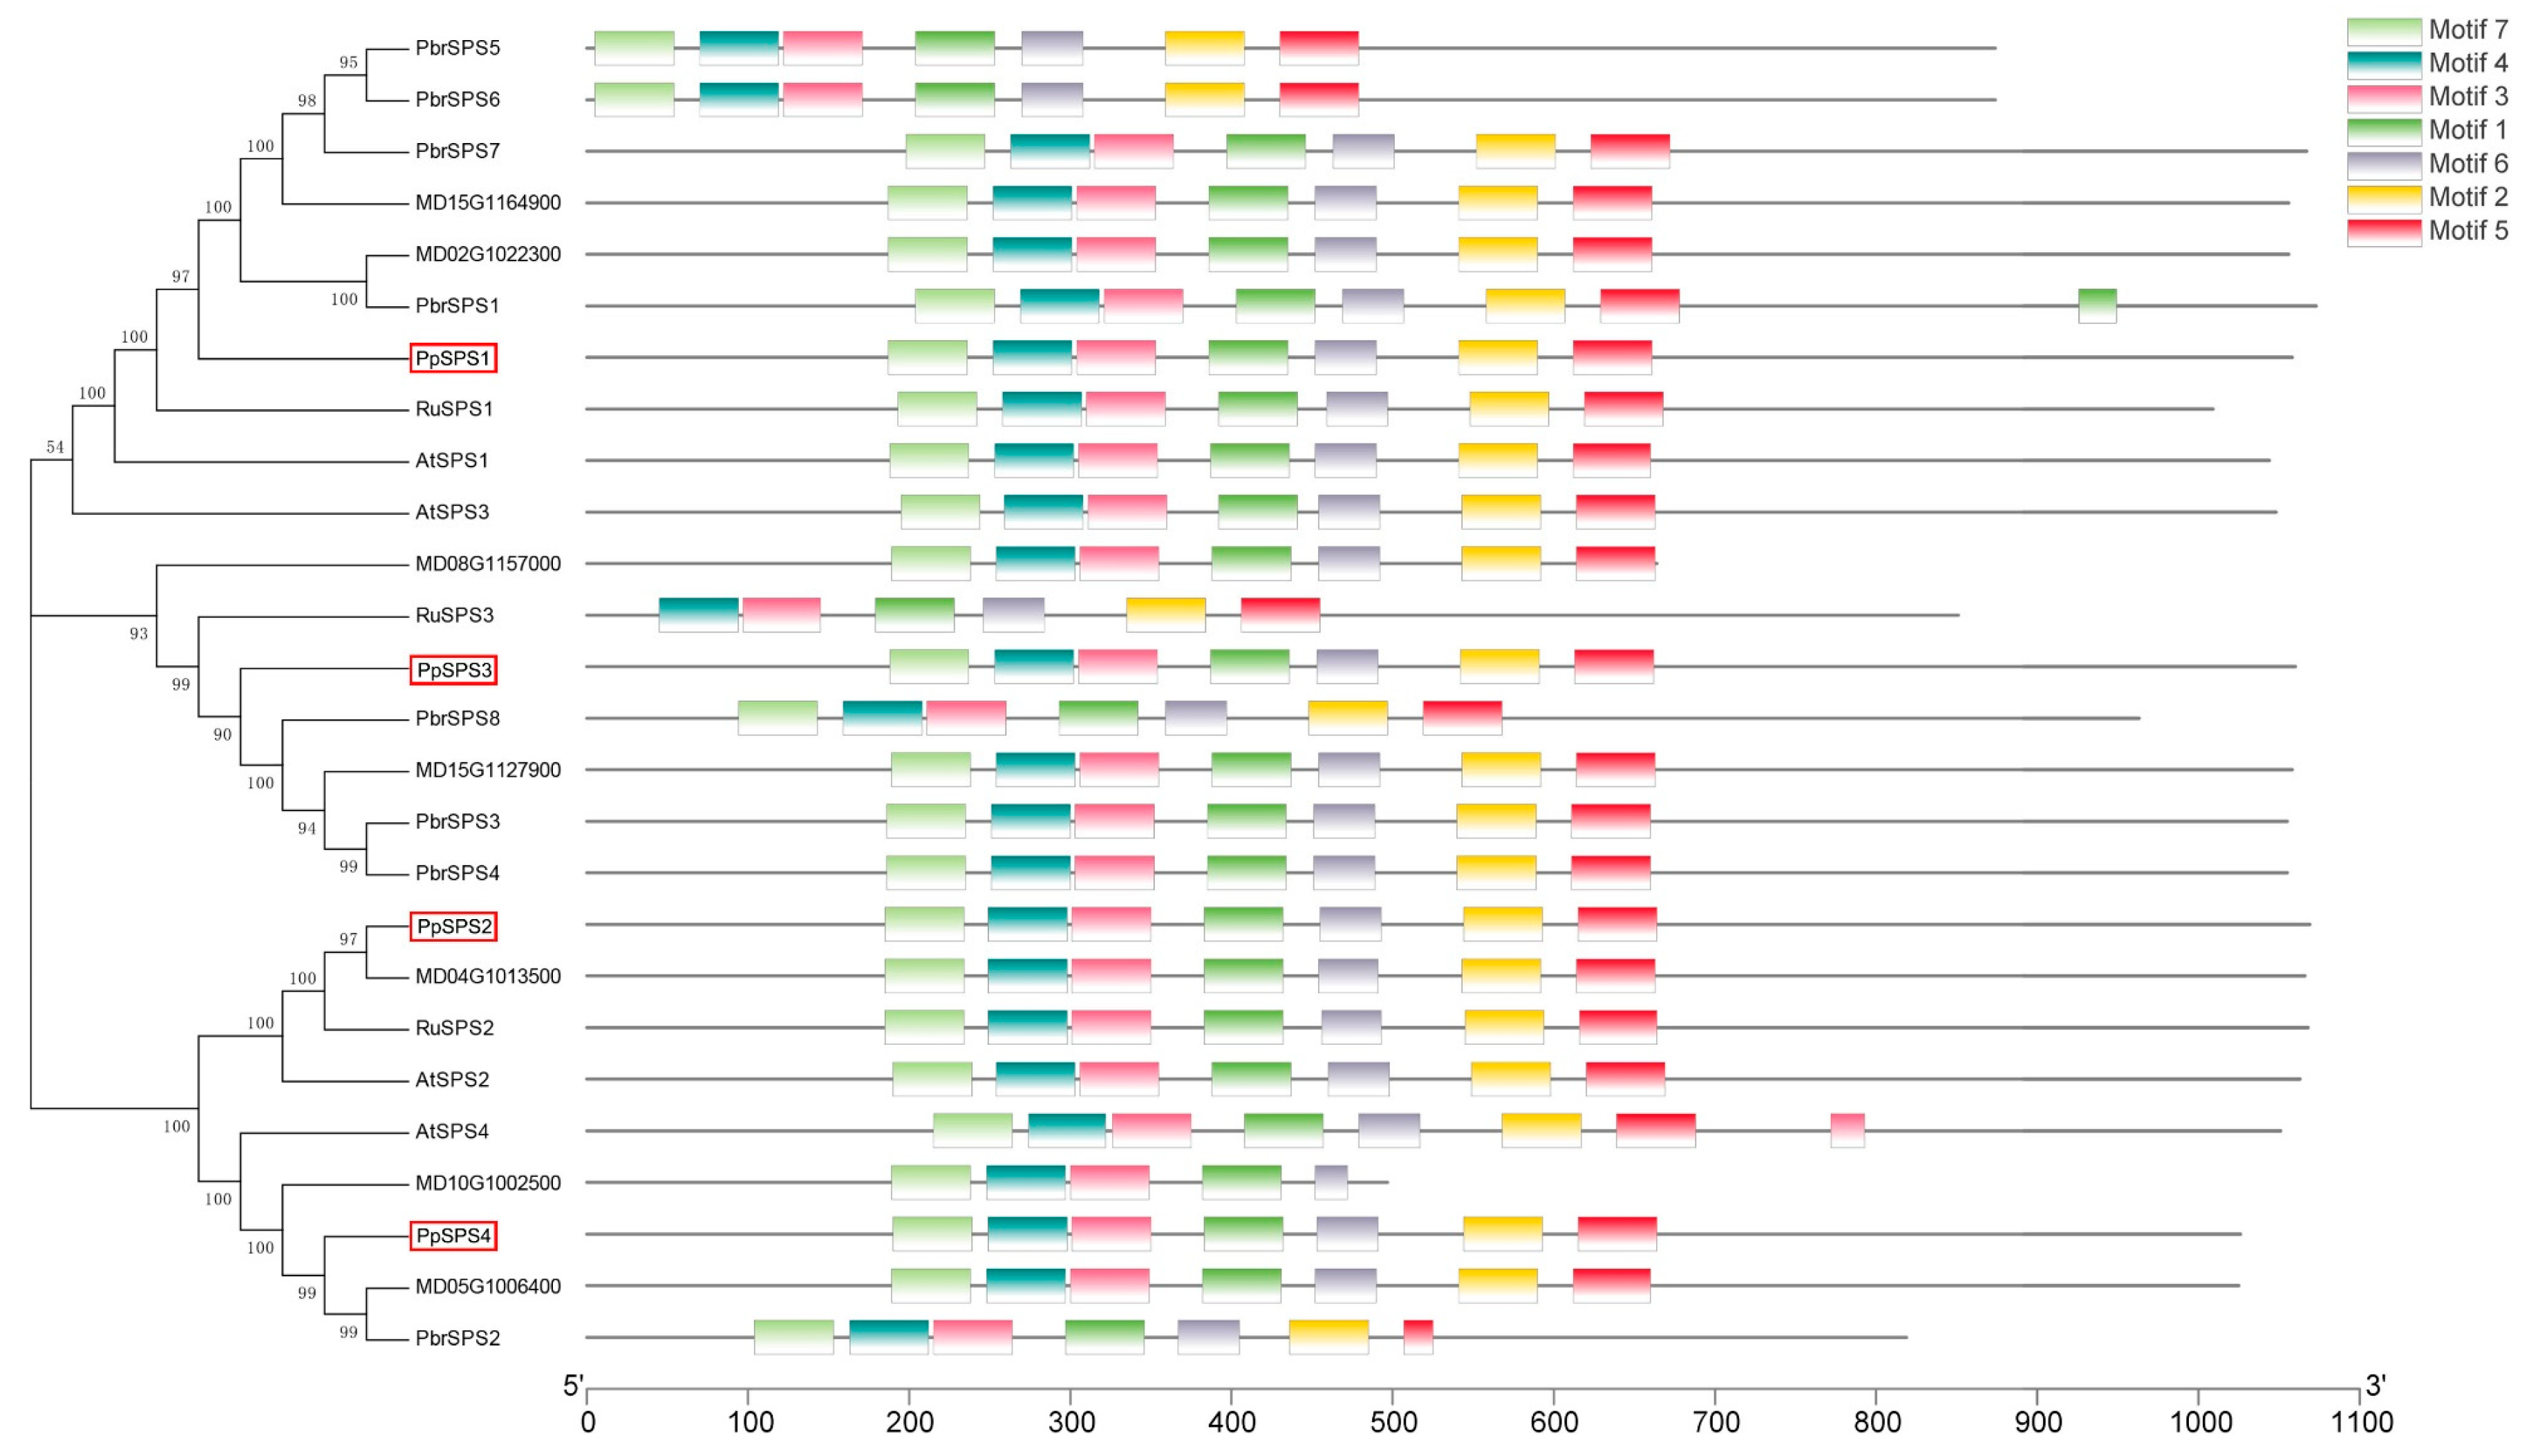
3.3. Identification and Characterization of the PpSPS Gene Family

In order to further study how ALA regulates PpSPS activity, we conducted a bioinformatics analysis of PpSPS. The results showed that there were four members of the PpSPS gene family, namely PpSPS1, PpSPS2, PpSPS3 and PpSPS4 (Table 2), and all genes had seven acting elements (Figure 3).

3.4. Chromosomal Location, Gene Structure and Promoter Analysis of PpSPS Family Genes

Chromosome localization analysis showed that PpSPS2 and PpSPS3 were distributed on chromosome 1, PpSPS1 was distributed on chromosome 7; and PpSPS4 was distributed on chromosome 8 (Figure 4A). The results of gene structure analysis showed that PpSPS1, PpSPS2 and PpSPS3 had 13 exons and 12 introns, while PpSPS4 had 14 exons and 13 introns (Figure 4B). The results of the PpSPS promoter analysis showed that there were 20 types of binding sites in all PpSPS (Figure 4C).

3.5. ALA-Regulated PpSPS-Related Genes

The results of qRT-PCR showed that the expression of PpSPS2 was significantly increased after 34 days after the flowering of ALA treatment (Figure 5B), while the expression of PpSPS3 was significantly increased after 70 days after the flowering of ALA treatment (Figure 5C), and the expressions of PpSPS1 and PpSPS4 were not responsive to ALA (Figure 5A,D). Correlation analysis showed that PpSPS2 gene expression was positively correlated with sucrose accumulation and SPS activity in peach fruit (Table S2 and Figure S1).

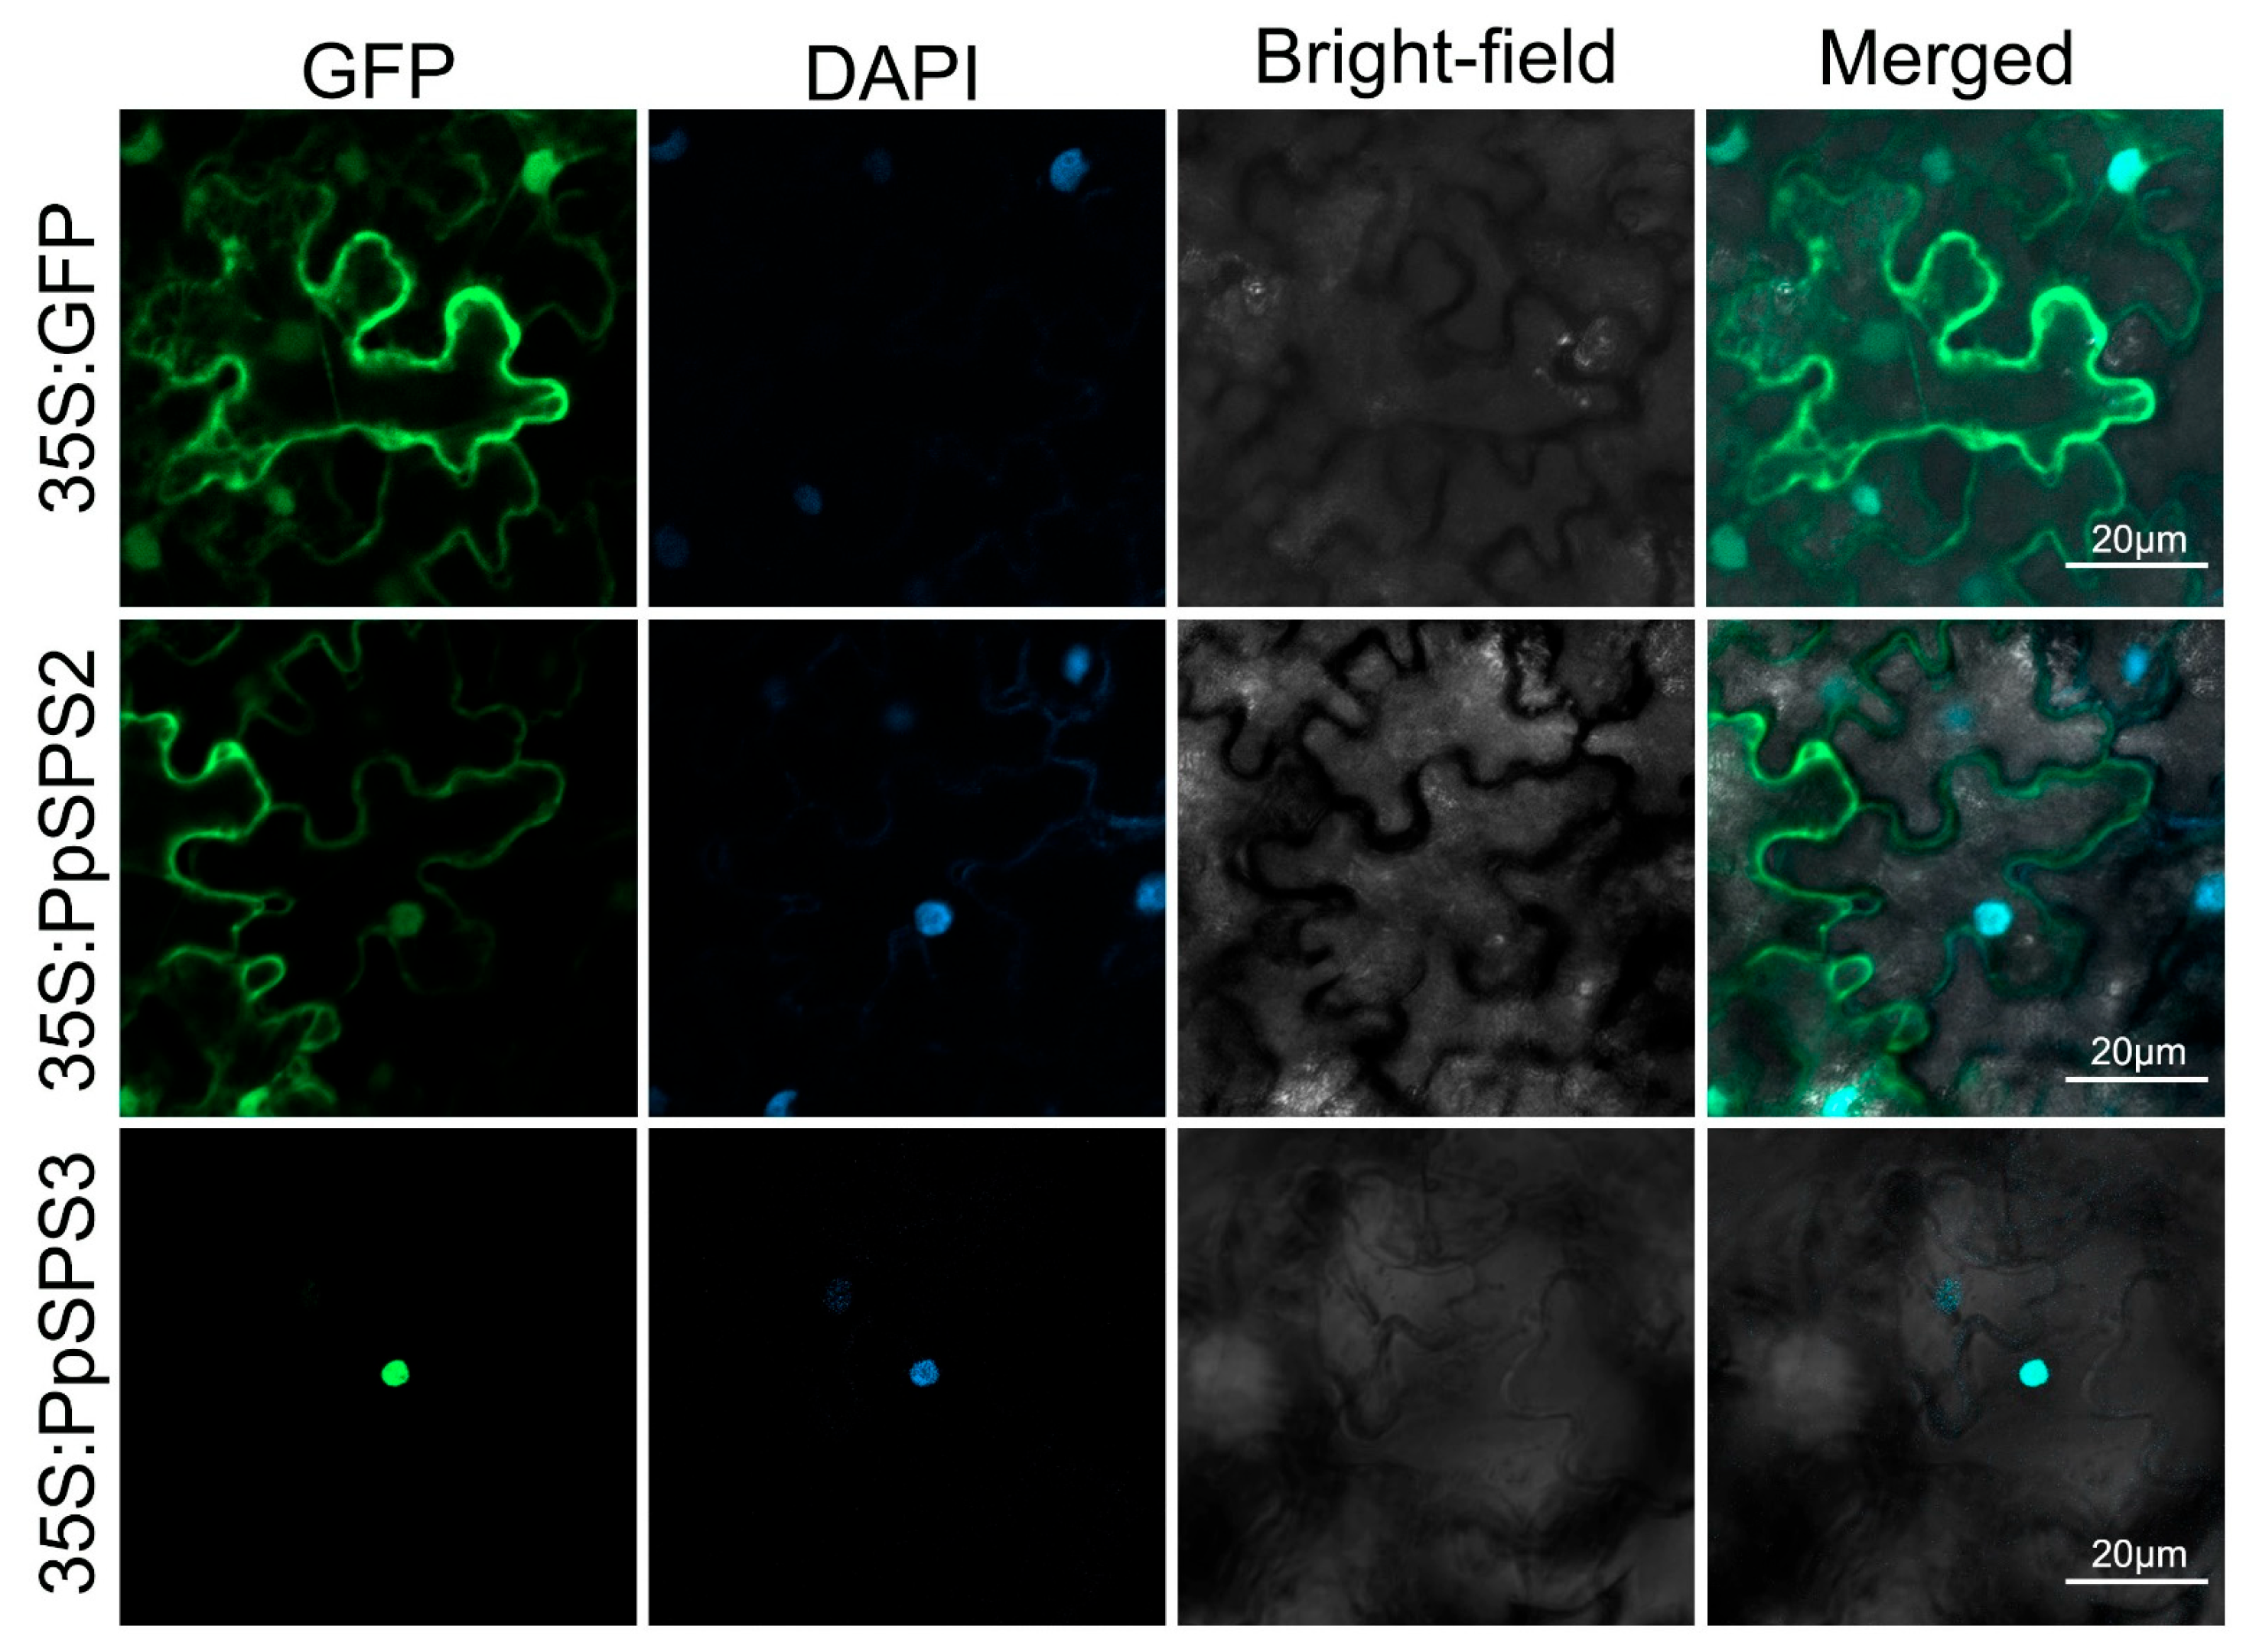
3.6. Subcellular Localization of PpSPS2 and PpSPS3

DAPI is a fluorescent dye that binds to most of the A and T bases in DNA. When DAPI is combined with double-stranded DNA, the maximum absorption wavelength is 358 nm, and the maximum emission wavelength is 461 nm. The emission light of DAPI is blue, and the emission wavelengths of DAPI and GFP overlap slightly, so it is possible to use this property for multiple fluorescence staining on a single sample. After staining, the green fluorescence and nuclear localization signals were observed under ultra-high resolution laser confocal microscopy (LSM800, Zeiss, Oberkochen, Germany). When the DAPI signal overlaps with the GFP signal, it indicates localization in the nucleus. The results of tobacco subcellular localization showed that PpSPS2 was mainly distributed in the cytoplasm and nucleus, while PpSPS3 was mainly distributed in the nucleus (Figure 6).

4. Discussion

Sucrose was found in many organ tissues, such as roots, stems, leaves, flowers and fruits, which indicates that SPS is a multifunctional protein. Studies have shown that SPS participated in and regulated photosynthetic carbon allocation in plants [28,29,30], which affected the partitioning between sucrose and starch [7], seed and pollen germination [31,32], cell differentiation, fiber cell wall synthesis [33], sugar accumulation and ripening of fruit [34]. In addition, it was also in response to abiotic stress, such as osmosis [35], low temperature [36], moisture [37] and drought [38].
Significant differences in SPS activity were found in different plants or at different growth and development stages of the same plant, suggesting the mechanism of regulating SPS activity is also relatively complex. In plants, SPS activity is regulated by their own development and surrounding environment. In peach fruit, the SPS expression in mature peaches was significantly higher than that in immature fruit [4]. SPS responded to various environmental and endogenous signal changes through phosphorylation and dephosphorylation [39]. Studies have shown that at least one PP2A complex protein phosphatase could promote the phosphating of SPS [7,39,40], while there are multiple kinases that could induce SPS phosphorylation [41]. In addition to responding to the abiotic stress mentioned earlier, plant SPS activity was regulated by light, which promoted SPS activity, while darkness did the opposite [42].
In addition, the activity of SPS was also regulated by its inhibitors and activators, including phosphate and sucrose-6-phosphate, and activators fructose-6-phosphate and 1,5-anhydroglucolol-6-phosphate. Although activators and inhibitors of these SPS have been discovered, further research on the activity of other small molecules on SPS is needed. Finally, interaction with proteins also affected SPS activity. There are regions in the plant SPS sequence that bind 14-3-3 proteins, which significantly inhibit SPS activity after binding to SPS [39]. There were few studies on the regulation of SPS activity by protein interaction, which is a scientific problem worthy of further study. In our study, ALA significantly improved PpSPS activity (Figure 2B) and increased the expression of PpSPS2 in the peach fruits (Figure 4B). However, how ALA regulates PpSPS activity warrants further investigation.
Sucrose plays an important role in the transport of carbohydrates and their storage in plants [8]. We found ALA could significantly improve the sucrose of the peach fruits (Figure 2A). In plants, the SPS gene family usually consists of three subfamilies, namely A, B and C [43], and the expression patterns and amounts of different types of SPS subfamily genes in different tissues and organs of different plants are also not the same. This also suggested that different SPS genes were functionally differentiated [35,44,45]. In our study, we found that the PpSPS family consisted of four members: PpSPS1, PpSPS2, PpSPS3 and PpSPS4 (Table 2 and Figure 3).
Clearly, elucidating the interactions between different subunits of SPS and their relationship to SPS activity is of great scientific significance for revealing the role of SPS in sucrose metabolism. The results of tobacco subcellular localization showed that PpSPS2 was mainly distributed in the cytoplasm and nucleus, while PpSPS3 was mainly distributed in the nucleus (Figure 6). Thus, screening the transcription factors or key enzymes that interacted with PpSPS was an urgent task. In leaves, increased SPS activity led to an increase in sucrose content and a decrease in starch content [7]. However, during fruit development, SPS activity and sucrose content are controversial. In most cases, SPS expression and its activity are positively correlated with sucrose accumulation, but there is also a negative correlation [7,8,46]. Studies have shown that MdSPSA2.3 was positively correlated with sucrose content during the development of apple fruits, and silencing of MdSPSA2.3 significantly reduced sucrose accumulation in apple fruits [46]. In contrast, during the maturation of peach fruit, SPS activity was always low and negatively correlated with sucrose accumulation [45].
In summary, most of the current functional studies of SPS still focus on the determination of physiological indicators such as enzyme activity changes, while there are few studies at the biochemical and molecular level, and the specific gene function and molecular genetic mechanism of SPS are not clear. Plant SPS is a large molecular weight enzyme that contains other sequences in addition to the catalytic domain, which indicates that plant SPS must interact with other proteins to regulate their own activity, which is poorly studied. Although studies have shown that at least one PP2A complex protein phosphatase could promote the phosphating of SPS. However, this hypothesis has not yet been tested.

Supplementary Materials

The following supporting information can be downloaded at: https://www.mdpi.com/article/10.3390/cimb46080469/s1, Table S1. Primers used in all the experiments. Table S2. Correlation analysis among sucrose content, PpSPS activity and PpSPS gene expression. Figure S1. Correlation and regression analysis among sucrose content, PpSPS activity and PpSPS gene expression.

Author Contributions

M.Y. made the major contributions to designing the experiments and revising the manuscript. Z.C. performed all the experiments and wrote the manuscript. X.G. and J.D. were responsible for the format modification of the article. All authors have read and agreed to the published version of the manuscript.

Funding

This work was supported by the China Agriculture Research System (CARS-30), the Species Conservation Project of Ministry of Agriculture and Rural Affairs (19210895), the National Crop Germplasm Resources Infrastructure in China (NHGRC2020-NH16), Accurate Identification of Peach and Strawberry Germplasm Resources in Southern China (19230697) and the Species Conservation Project of Crop Germplasm Resources (Peach and Strawberry) in Jiangsu Province (2023-SJ-011).

Institutional Review Board Statement

Not applicable.

Informed Consent Statement

Not applicable.

Data Availability Statement

The data underlying this article are available in this paper. The datasets in this article were derived from sources in the public domain: National Center for biotechnology information (National Center for Biotechnology Information (nih.gov)) and the Arabidopsis information Resource (https://www.arabidopsis.org).

Conflicts of Interest

The authors have no conflicts of interest to declare.

References

  1. Liang, R.L.; Wang, L.J.; Wang, X.Q.; Zhang, J.T.; Gan, X. Effects of Exogenous ALA on Leaf Photosynthesis, Photosynthate Transport, and Sugar Accumulation in Prunus persica L. Forests 2023, 14, 723. [Google Scholar] [CrossRef]
  2. Lei, R.L.; Qu, W.G.; Fan, Y.J. Problems and countermeasures of nectarine industry development. Fruit Grow. Friend 2016, 1, 38–39. [Google Scholar]
  3. Wang, C.; Fang, J.G.; Wang, T.; Tan, H.H. The sugar metabolism in fruits. Acta Agric. Zhejiangensis 2009, 21, 529–534. [Google Scholar]
  4. Vimolmangkang, S.; Zheng, H.; Peng, Q.; Jiang, Q.; Wang, H.; Fang, T.; Liao, L.; Wang, L.; He, H.; Han, Y. Assessment of Sugar Components and Genes Involved in the Regulation of Sucrose Accumulation in Peach Fruit. J. Agric. Food Chem. 2016, 64, 6723–6729. [Google Scholar] [CrossRef] [PubMed]
  5. Cirilli, M.; Bassi, D.; Ciacciulli, A. Sugars in peach fruit: A breeding perspective. Hortic. Res. 2016, 3, 15067. [Google Scholar] [CrossRef] [PubMed]
  6. Stein, O.; Granot, D. An overview of sucrose synthases in plants. Front. Plant Sci. 2019, 10, 95. [Google Scholar] [CrossRef] [PubMed]
  7. Huber, S.C.; Huber, J.L. Role and regulation of sucrose-phosphate synthase in higher plants. Annu. Rev. Plant Physiol. Plant Mol. Biol. 1996, 47, 431–444. [Google Scholar] [CrossRef] [PubMed]
  8. Zhang, C.H.; Shen, Z.J.; Zhang, Y.P.; Han, J.; Ma, R.J.; Korir, N.K.; Yu, M.L. Cloning and expression of genes related to the sucrose-metabolizing enzymes and carbohydrate changes in peach. Acta Physiol. Plant. 2013, 35, 589–602. [Google Scholar] [CrossRef]
  9. Zhang, C.H.; Yu, M.L.; Ma, R.J.; Shen, Z.J.; Zhang, B.B.; Korir, N.K. Structure, expression profile, and evolution of the sucrose synthase gene family in peach (Prunus persica). Acta Physiol. Plant. 2015, 37, 1–15. [Google Scholar] [CrossRef]
  10. Kobashi, K.; Sugaya, S.; Gemma, H.; Iwahori, S. Effect of abscisic acid (ABA) on sugar accumulation in the flesh tissue of peach fruit at the start of the maturation stage. Plant Growth Regul. 2001, 35, 215–223. [Google Scholar] [CrossRef]
  11. Li, X.; Liu, P.; Zhou, J.; Su, M.; Ma, Y.; Jia, H.; Du, J.; Gao, Z.; Ye, Z. Effects of exogenous application of GA4+7 and NAA on sugar accumulation and related gene expression in peach fruits during developing and ripening stages. J. Plant Growth Regul. 2021, 40, 962–973. [Google Scholar] [CrossRef]
  12. Kumar, M.; Rawat, V.; Rawat, J.M.S.; Tomar, Y.K. Effect of pruning intensity on peach yield and fruit quality. Sci. Hortic. 2010, 125, 218–221. [Google Scholar] [CrossRef]
  13. Akram, N.A.; Ashraf, M. Regulation in Plant Stress Tolerance by a Potential Plant Growth Regulator, 5-Aminolevulinic Acid. J. Plant Growth Regul. 2013, 32, 663–679. [Google Scholar] [CrossRef]
  14. Wu, W.; He, S.; An, Y.; Cao, R.; Sun, Y.; Tang, Q.; Wang, L. Hydrogen peroxide as a mediator of 5-aminolevulinic acid-induced Na+ retention in roots for improving salt tolerance of strawberries. Physiol. Plant. 2019, 167, 5–20. [Google Scholar] [CrossRef] [PubMed]
  15. Cai, C.Y.; He, S.S.; An, Y.Y.; Wang, L.J. Exogenous 5-aminolevulinic acid improves strawberry tolerance to osmotic stress and its possible mechanisms. Physiol. Plant. 2020, 168, 948–962. [Google Scholar] [CrossRef] [PubMed]
  16. Chen, Z.; Lou, Y.R.; Wang, L.J. MdDGK3-like as a Negative Regulator Participates in ALA-Induced PP2AC to Promote Stomatal Opening in Apple leaves. Hortic. Plant J. 2023, 9, 898–908. [Google Scholar] [CrossRef]
  17. Fang, X.; Zhang, L.Z.; Wang, L.J. The Transcription Factor MdERF78 Is Involved in ALA-Induced Anthocyanin Accumulation in Apples. Front. Plant Sci. 2022, 13, 915197. [Google Scholar] [CrossRef] [PubMed]
  18. Guo, L.; Cai, Z.X.; Zhang, B.B.; Xu, J.L.; Song, H.F.; Ma, R.J. The Mechanism Analysis of Anthocyanin Accumulation in Peach Accelerated by ALA. Acta Hortic. Sin. 2013, 40, 1043–1050. [Google Scholar]
  19. Li, H.S. Principles and Techniques of Plant Physiological and Biochemical Experiments; Higher Education Press: Beijing, China, 2000; pp. 190–202. [Google Scholar]
  20. Zhang, Z.L.; Zhai, W.J.; Li, X.F. Experimental guidance of Plant Physiology; Higher Education Press: Beijing, China, 2009; pp. 244–246. [Google Scholar]
  21. Luo, Z.H.; Chen, L.N.; Chen, G.D.; Wei, Q.; Li, N. A novel UV-visible method for the detection of vitamin C in Shatian pumelo. J. Food Saf. Qual. 2018, 9, 2321–2325. [Google Scholar]
  22. Mistry, J.; Chuguransky, S.; Williams, L.; Qureshi, M.; Salazar, G.A.; Sonnhammer, E.L.L.; Tosatto, S.C.E.; Paladin, L.; Raj, S.; Richardson, L.J.; et al. Pfam: The protein families database in 2021. Nucleic Acids Res. 2021, 49, D412–D419. [Google Scholar] [CrossRef]
  23. Schultz, J.; Milpetz, F.; Bork, P.; Ponting, C.P. SMART, a simple modular architecture research tool: Identification of signaling domains. Proc. Natl. Acad. Sci. 1998, 95, 5857–5864. [Google Scholar] [CrossRef] [PubMed]
  24. Bailey, T.L.; Johnson, J.; Grant, C.E.; Noble, W.S. The MEME suite. Nucleic Acids Res. 2015, 43, W39–W49. [Google Scholar] [CrossRef] [PubMed]
  25. Kumar, S.; Stecher, G.; Tamura, K. MEGA7: Molecular evolutionary genetics analysis version 7.0 for bigger datasets. Mol. Biol. Evol. 2016, 33, 1870–1874. [Google Scholar] [CrossRef]
  26. Livak, K.J.; Schmittgen, T.D. Analysis of relative gene expression data using real-time quantitative PCR and the 2−ΔΔCT method. Methods 2010, 25, 402–408. [Google Scholar] [CrossRef]
  27. Chen, Z.; An, Y.Y.; Wang, L.J. ALA reverses ABA-induced stomatal closure by modulating PP2AC and SnRK2.6 activity in apple leaves. Hortic. Res. 2023, 10, uhad067. [Google Scholar] [CrossRef] [PubMed]
  28. Galtier, N.; Foyer, C.H.; Huber, J.; Voelker, T.A.; Huber, S.C. Effects of Elevated Sucrose-Phosphate Synthase Activity on Photosynthesis, Assimilate Partitioning, and Growth in Tomato (Lycopersicon esculentum var UC82B). Plant Physiol. 1993, 101, 535–543. [Google Scholar] [CrossRef]
  29. Ma, M.Y.; Zhu, T.; Cheng, X.Y.; Li, M.Y.; Yuan, G.L.; Li, C.B.; Zhang, A.H.; Lu, C.M.; Fang, Y.; Zhang, Y. Sucrose phosphate synthase 8 is required for the remobilization of carbon reserves in rice stems during grain filling. J. Exp. Bot. 2023, 75, erad375. [Google Scholar] [CrossRef]
  30. Hirose, T.; Hashida, Y.; Aoki, N.; Okamura, M.; Yonekura, M.; Ohto, C.; Terao, T.; Ohsugi, R. Analysis of gene-disruption mutants of a sucrose phosphate synthase gene in rice, OsSPS1, shows the importance of sucrose synthesis in pollen germination. Plant Sci. 2014, 225, 102–106. [Google Scholar] [CrossRef] [PubMed]
  31. Bahaji, A.; Baroja-Fernández, E.; Ricarte-Bermejo, A.; Sánchez-López, Á.M.; Muñoz, F.J.; Romero, J.M.; Ruiz, M.T.; Baslam, M.; Almagro, G.; Sesma, M.T.; et al. Characterization of multiple SPS knockout mutants reveals redundant functions of the four Arabidopsis sucrose phosphate synthase isoforms in plant viability, and strongly indicates that enhanced respiration and accelerated starch turnover can alleviate the blockage of sucrose biosynthesis. Plant Sci. 2015, 238, 135–147. [Google Scholar]
  32. Haigler, C.H.; Singh, B.; Zhang, D.; Hwang, S.; Wu, C.; Cai, W.X.; Hozain, M.; Kang, W.; Kiedaisch, B.; Strauss, R.E.; et al. Transgenic cotton over-producing spinach sucrose phosphate synthase showed enhanced leaf sucrose synthesis and improved fiber quality under controlled environmental conditions. Plant Mol. Biol. 2007, 63, 815–832. [Google Scholar] [CrossRef]
  33. Wen, X.X.; Zhang, W.Q.; Feng, Y.Q.; Yu, X.Y. Cloning and characterization of a sucrose synthase-encoding gene from muskmelon. Mol. Biol. Rep. 2010, 37, 695–702. [Google Scholar] [CrossRef] [PubMed]
  34. Solís-Guzmán, M.G.; Argüello-Astorga, G.; López-Bucio, J.; Ruiz-Herrera, L.F.; López-Meza, J.E.; Sánchez-Calderón, L.; Carreón-Abud, Y.; Martínez-Trujillo, M. Arabidopsis thaliana sucrose phosphate synthase (sps) genes are expressed differentially in organs and tissues, and their transcription is regulated by osmotic stress. Gene Expr. Patterns 2017, 25–26, 92–101. [Google Scholar] [CrossRef] [PubMed]
  35. Zhang, W.J.; Wang, J.Q.; Huang, Z.L.; Mi, L.; Xu, K.F.; Wu, J.J.; Fan, Y.H.; Ma, S.Y.; Jiang, D.G. Effects of Low Temperature at Booting Stage on Sucrose Metabolism and Endogenous Hormone Contents in Winter Wheat Spikelet. Front. Plant Sci. 2019, 10, 498. [Google Scholar] [CrossRef] [PubMed]
  36. Geigenberger, P.; Reimholz, R.; Deiting, U.; Sonnewald, U.; Stitt, M. Decreased expression of sucrose phosphate synthase strongly inhibits the water stress-induced synthesis of sucrose in growing potato tubers. Plant J. 1999, 19, 119–129. [Google Scholar] [CrossRef] [PubMed]
  37. Nemati, F.; Ghanati, F.; Gavlighi, H.A.; Sharifi, M. Comparison of sucrose metabolism in wheat seedlings during drought stress and subsequent recovery. Biol. Plant. 2018, 62, 595–599. [Google Scholar] [CrossRef]
  38. Winter, H.; Huber, S.C. Regulation of sucrose metabolism in higher plants: Localization and regulation of activity of key enzymes. Crit. Rev. Biochem. Mol. Biol. 2000, 35, 253–289. [Google Scholar] [CrossRef]
  39. Huber, S.C.; Huber, J.L. Activation of sucrose-phosphate synthase from darkened spinach leaves by an endogenous protein phosphatase. Arch. Biochem. Biophys. 1990, 282, 421–426. [Google Scholar] [CrossRef] [PubMed]
  40. McMichael, R.W., Jr.; Bachmann, M.; Huber, S.C. Spinach Leaf Sucrose-Phosphate Synthase and Nitrate Reductase Are Phosphorylated/Inactivated by Multiple Protein Kinases in Vitro. Plant Physiol. 1995, 108, 1077–1082. [Google Scholar] [CrossRef] [PubMed]
  41. Wu, X.N.; Sklodowski, K.; Encke, B.; Schulze, W.X. A kinase-phosphatase signaling module with BSK8 and BSL2 involved in regulation of sucrose-phosphate synthase. J. Proteome Res. 2014, 13, 3397–3409. [Google Scholar] [CrossRef]
  42. Lutfiyya, L.L.; Xu, N.; D’Ordine, R.L.; Morrell, J.A.; Miller, P.W.; Duff, S.M. Phylogenetic and expression analysis of sucrose phosphate synthase isozymes in plants. J. Plant Physiol. 2007, 164, 923–933. [Google Scholar] [CrossRef]
  43. Okamura, M.; Aoki, N.; Hirose, T.; Yonekura, M.; Ohto, C.; Ohsugi, R. Tissue specificity and diurnal change in gene expression of the sucrose phosphate synthase gene family in rice. Plant Sci. 2011, 181, 159–166. [Google Scholar] [CrossRef] [PubMed]
  44. Wang, D.; Zhao, J.; Hu, B.; Li, J.; Qin, Y.; Chen, L.; Qin, Y.; Hu, G. Identification and expression profile analysis of the sucrose phosphate synthase gene family in Litchi chinensis Sonn. PeerJ 2018, 6, e4379. [Google Scholar] [CrossRef] [PubMed]
  45. Moriguchi, T.; Sanada, T.; Yamaki, S. Seasonal Fluctuations of Some Enzymes Relating to Sucrose and Sorbitol Metabolism in Peach Fruit. J. Am. Soc. Hortic. Sci. 1990, 115, 278–281. [Google Scholar] [CrossRef]
  46. Zhang, L.H.; Zhu, L.C.; Xu, Y.; LÜ, L.; Li, X.G.; Li, W.H.; Liu, W.D.; Ma, F.W.; Li, M.J.; Han, D.G. Genome-wide identification and function analysis of the sucrose phosphate synthase MdSPS gene family in apple. J. Integr. Agric. 2023, 22, 2080–2093. [Google Scholar] [CrossRef]
Figure 1. Effects of exogenous ALA treatment at different stages of fruit development on the apparent quality of ‘Zhongyoutao 4’ nectarine ripe fruit (12 fruits per treatment are shown here).
Cimb 46 00469 g001
Figure 2. The effects of ALA on sucrose content (A) and SPS activity (B) of peach fruit during fruit development. The values are the means ± SE from three biological replicates. The same letters above the bars in each enzyme indicate no significant differences at p = 0.05 level.
Cimb 46 00469 g002
Figure 3. Bioinformatics analysis of SPS. The red boxes are identified members of the PpSPS gene family.
Cimb 46 00469 g003
Figure 4. Chromosomal location (A), gene structure (B) and promoter analysis (C) of PpSPS family genes.
Cimb 46 00469 g004
Figure 5. PpSPS gene expression in peach fruit after ALA treatment. (A): SPS1 relative expression. (B): SPS2 relative expression. (C): SPS3 relative expression. (D): SPS3 relative expression. The values are the means ± SE from three biological replicates. The same letters above the bars in each enzyme indicate no significant differences at p = 0.05 level.
Cimb 46 00469 g005
Figure 6. Subcellular localization of PpSPS2 and PpSPS3. GFP: green fluorescent protein. DAPI: 4′, 6-diamidino-2-phenylindole, a nuclear dye.
Cimb 46 00469 g006
Table 1. Effects of exogenous ALA treatment at different stages of fruit development on the quality of ‘Zhongyoutao 4’ nectarine.
TreatmentFruit Weight (g)Soluble Solid (%)Soluble Sugar (%)Titratable Acid (‰)Soluble Protein (mg/g)Vitamin C (mg/100 g)
Control86.89 ± 2.26 b15.85 ± 0.29 b10.18 ± 0.30 b3.48 ± 0.04 a6.03 ± 0.18b4.20 ± 0.31ab
ALA98.79 ± 3.01 a17.06 ± 0.45 a11.64 ± 0.13 a3.29 ± 0.04 b7.25 ± 0.24 a4.67 ± 0.16 a
Note: The same letter in a column indicates no significant difference at p = 0.05 level. The data on fruit weight, soluble solids and firmness are the means ± standard error of twenty biological replicates. Other data are the means ± standard error of four biological replicates.
Table 2. Detailed information on the SPS gene families in Prunus persica.
Gene NameGene IDGenome LocationCDS Length (bp)Protein Length (aa)Mw (KDa)Subcellular Localization
PpSPS1Prupe.7G249900Chr07: 21151882-21157785 (−)31741057118.17Cytoplasmic
PpSPS2Prupe.1G159700Chr01:12702147-12709381 (−)32071068119.69Cytoplasmic; Nuclear
PpSPS3Prupe.1G483200Chr01:40288494-40295210 (−)31801059118.26Nuclear
PpSPS4Prupe.8G003700Chr08: 302873-308259 (−)30781025115.41Cytoplasmic
Disclaimer/Publisher’s Note: The statements, opinions and data contained in all publications are solely those of the individual author(s) and contributor(s) and not of MDPI and/or the editor(s). MDPI and/or the editor(s) disclaim responsibility for any injury to people or property resulting from any ideas, methods, instructions or products referred to in the content.

