
Transcriptomic Approach for Investigation of Solanum spp. Resistance upon Early-Stage Broomrape Parasitism

 , ,
, ,
Abstract
:1. Introduction
2. Materials and Methods
2.1. Plant Material and Treatment
2.2. Total RNA Extraction and Transcriptome Sequencing
2.3. Transcriptomic Analysis
2.3.1. Quality Control and Pre-Processing
2.3.2. Genomic Alignment and Quantification
- (i)
- Slyc_subset, which contains multiple alignments (i.e., “NH” SAM tag > 1) on both S. lycopersicum and S. pennellii presenting the highest alignment score (“AS” tag in SAM) within S. lycopersicum and multiple alignments solely within S. lycopersicum, as well as unique alignments in S. lycopersicum (a median value of 85.2% of transcriptome-aligned reads across all datasets).
- (ii)
- Penn_subset, which contains multiple alignments (i.e., “NH” SAM tag > 1) on both S. lycopersicum and S. pennellii presenting the highest alignment score within S. pennellii and multiple alignments solely within S. pennellii, as well as unique alignments in S. pennellii (a median value of 6.6% of transcriptome-aligned reads across all datasets).
- (iii)
- Ambi_subset, which contains multiple alignments on both S. lycopersicum and S. pennellii presenting equally high alignment scores (i.e., ties) in both species (a median value of 8.1% of transcriptome-aligned reads across all datasets). Entries on S. pennellii were retained for these ambiguous alignments for downstream analysis.
2.4. Differential Expression Analysis
2.5. Functional Enrichment Analysis
2.6. Visualizations
2.7. Gene Expression Analysis Validation by qRT-PCR
3. Results
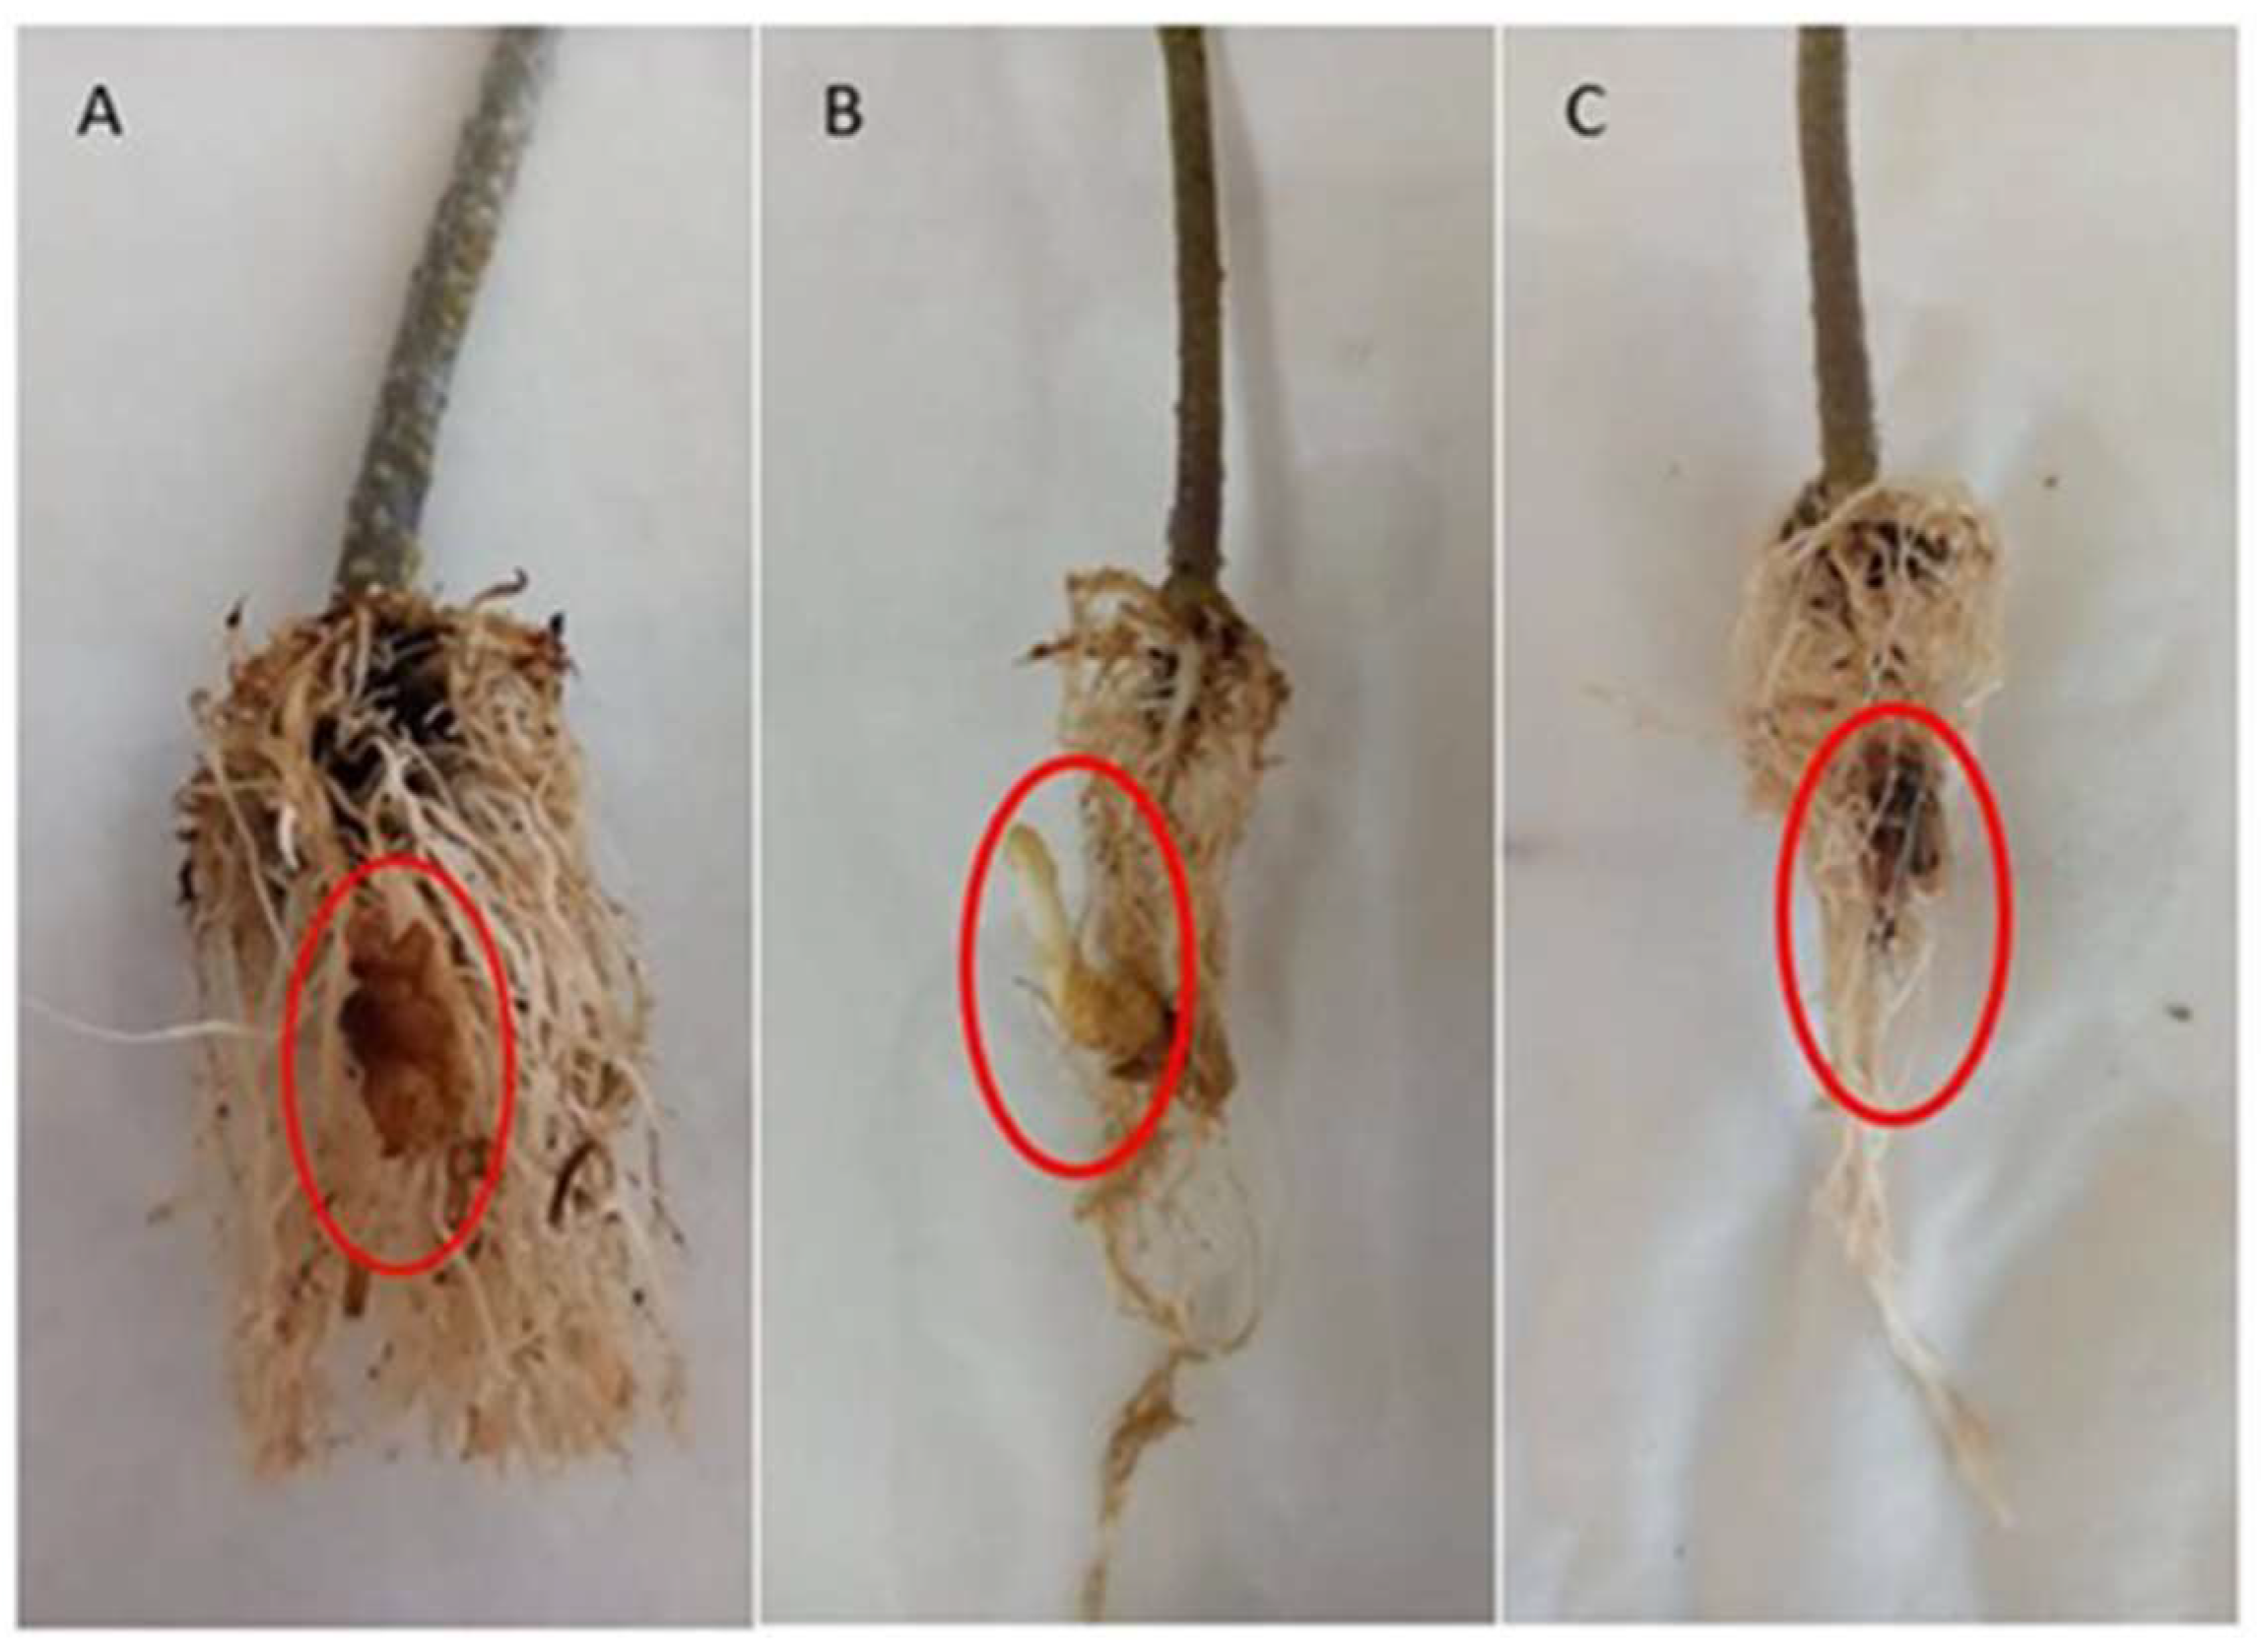
3.1. Plant Growth
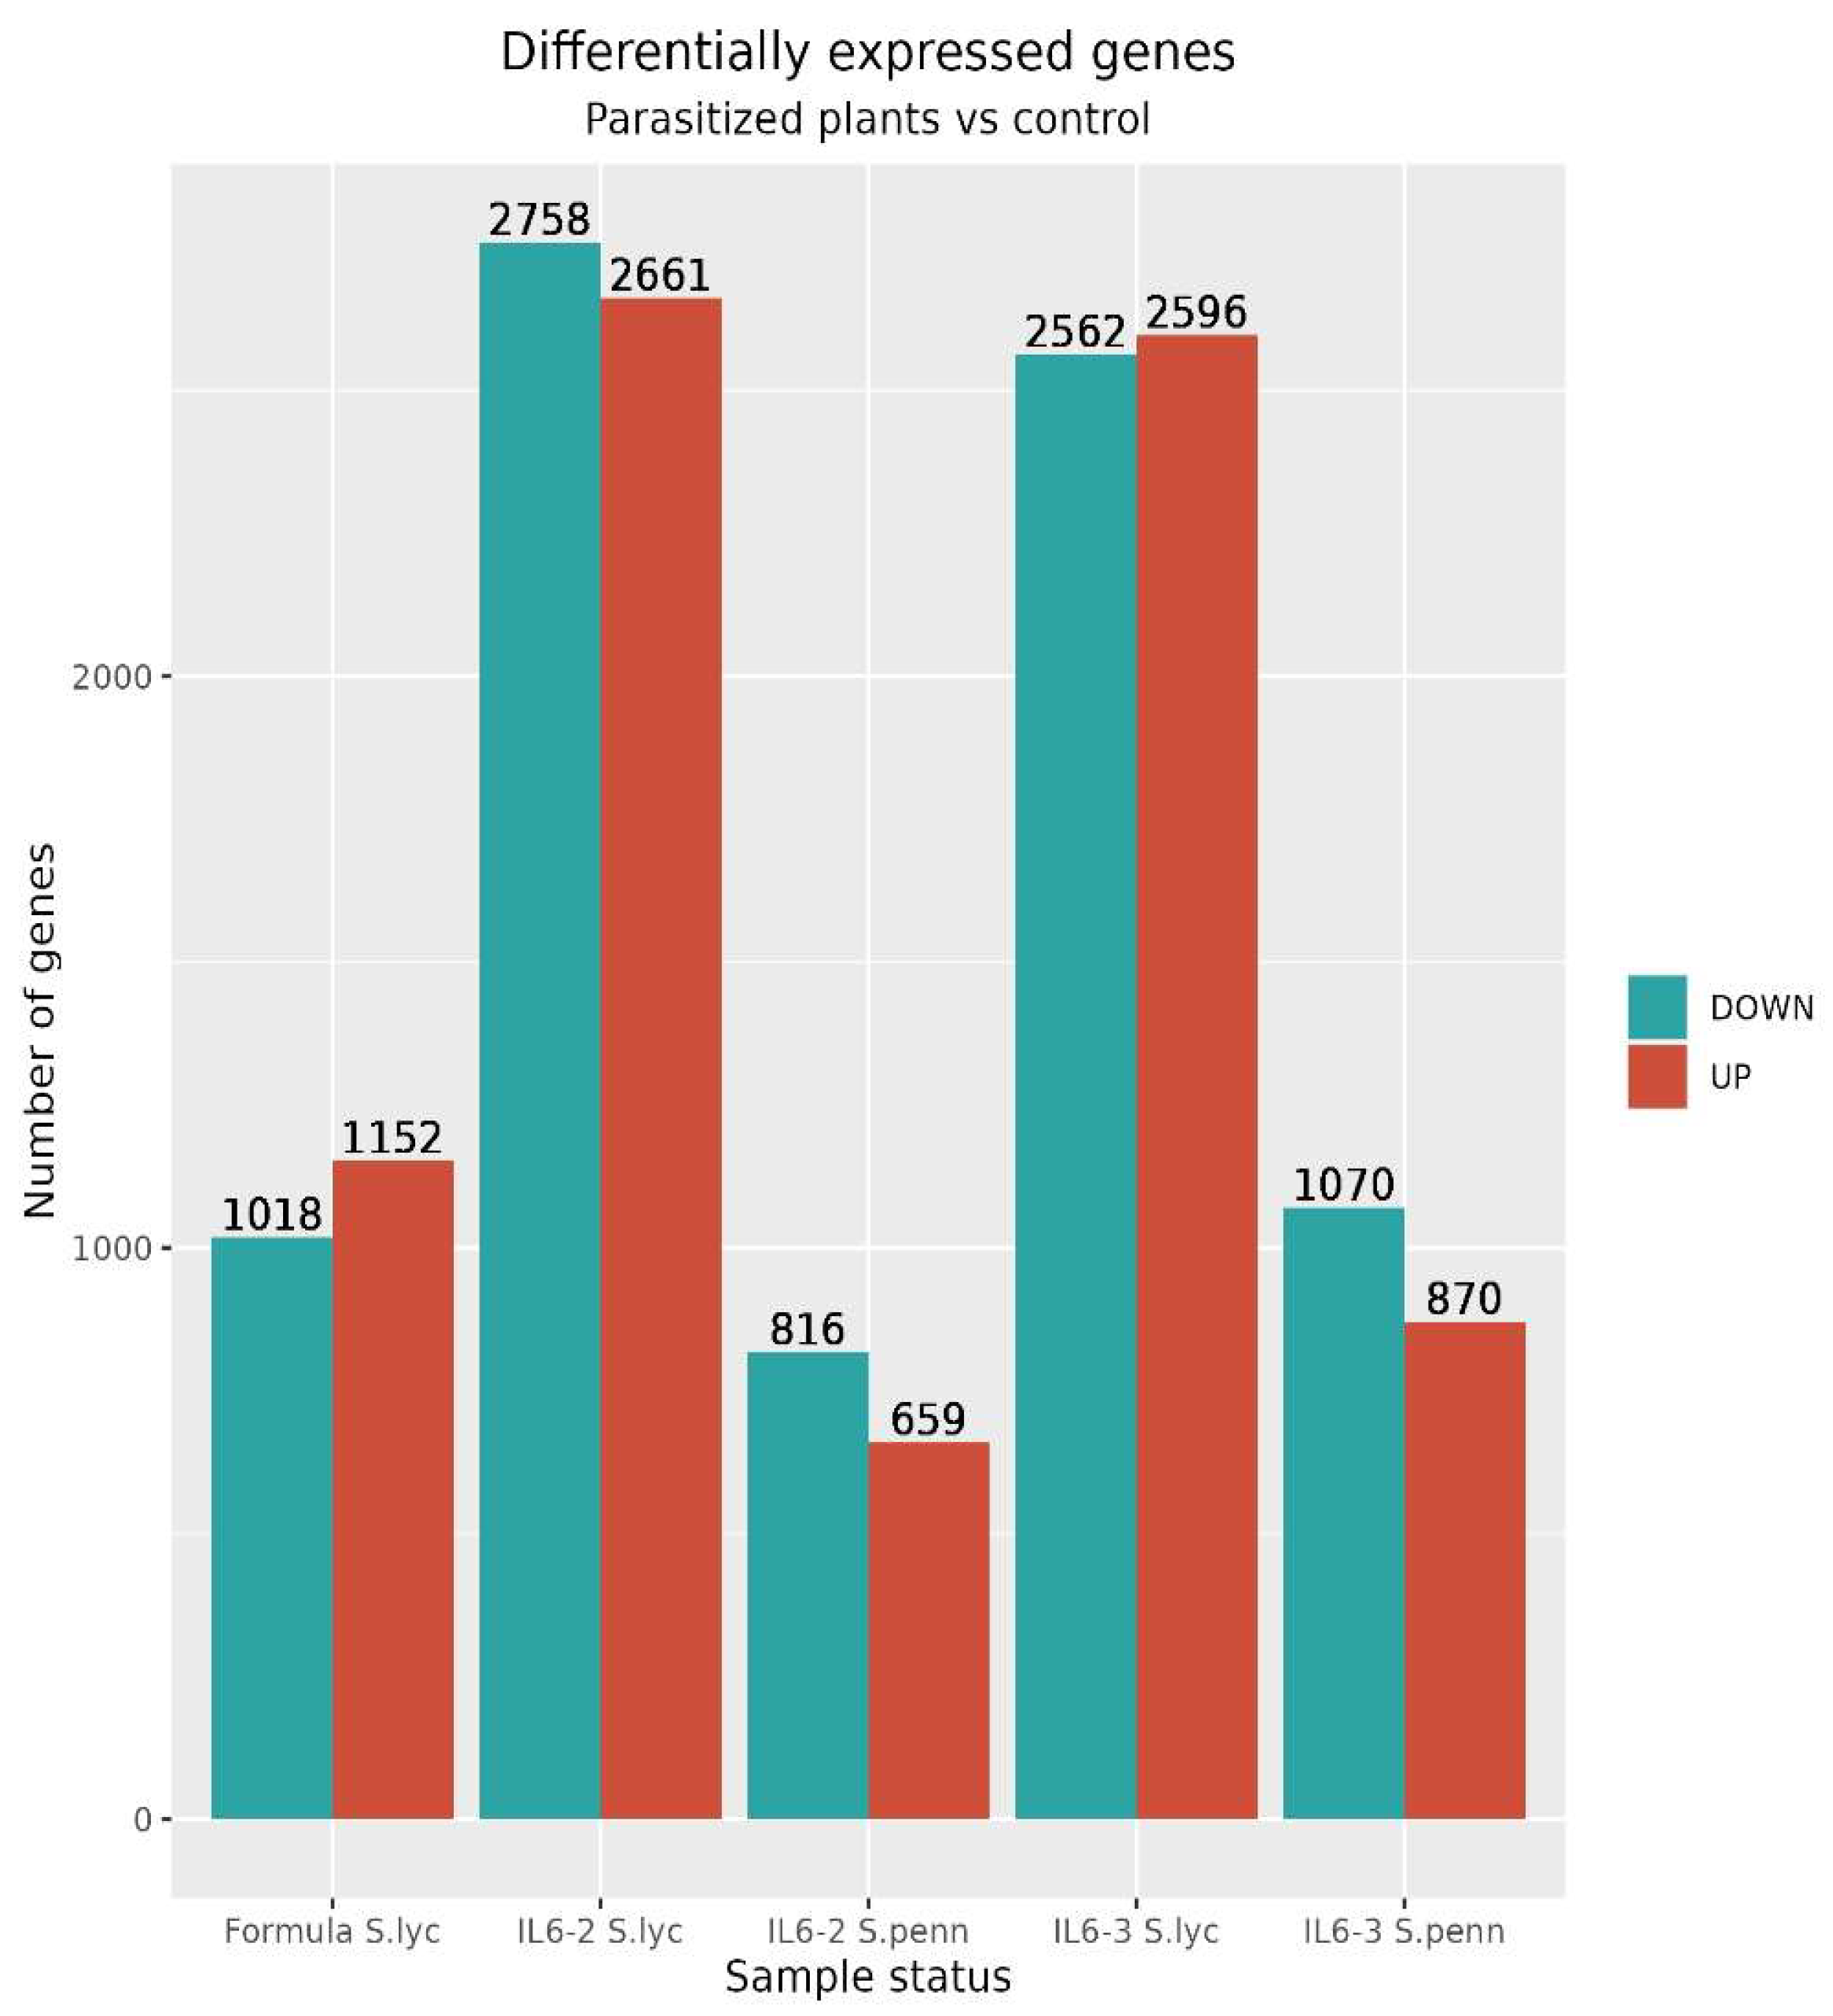
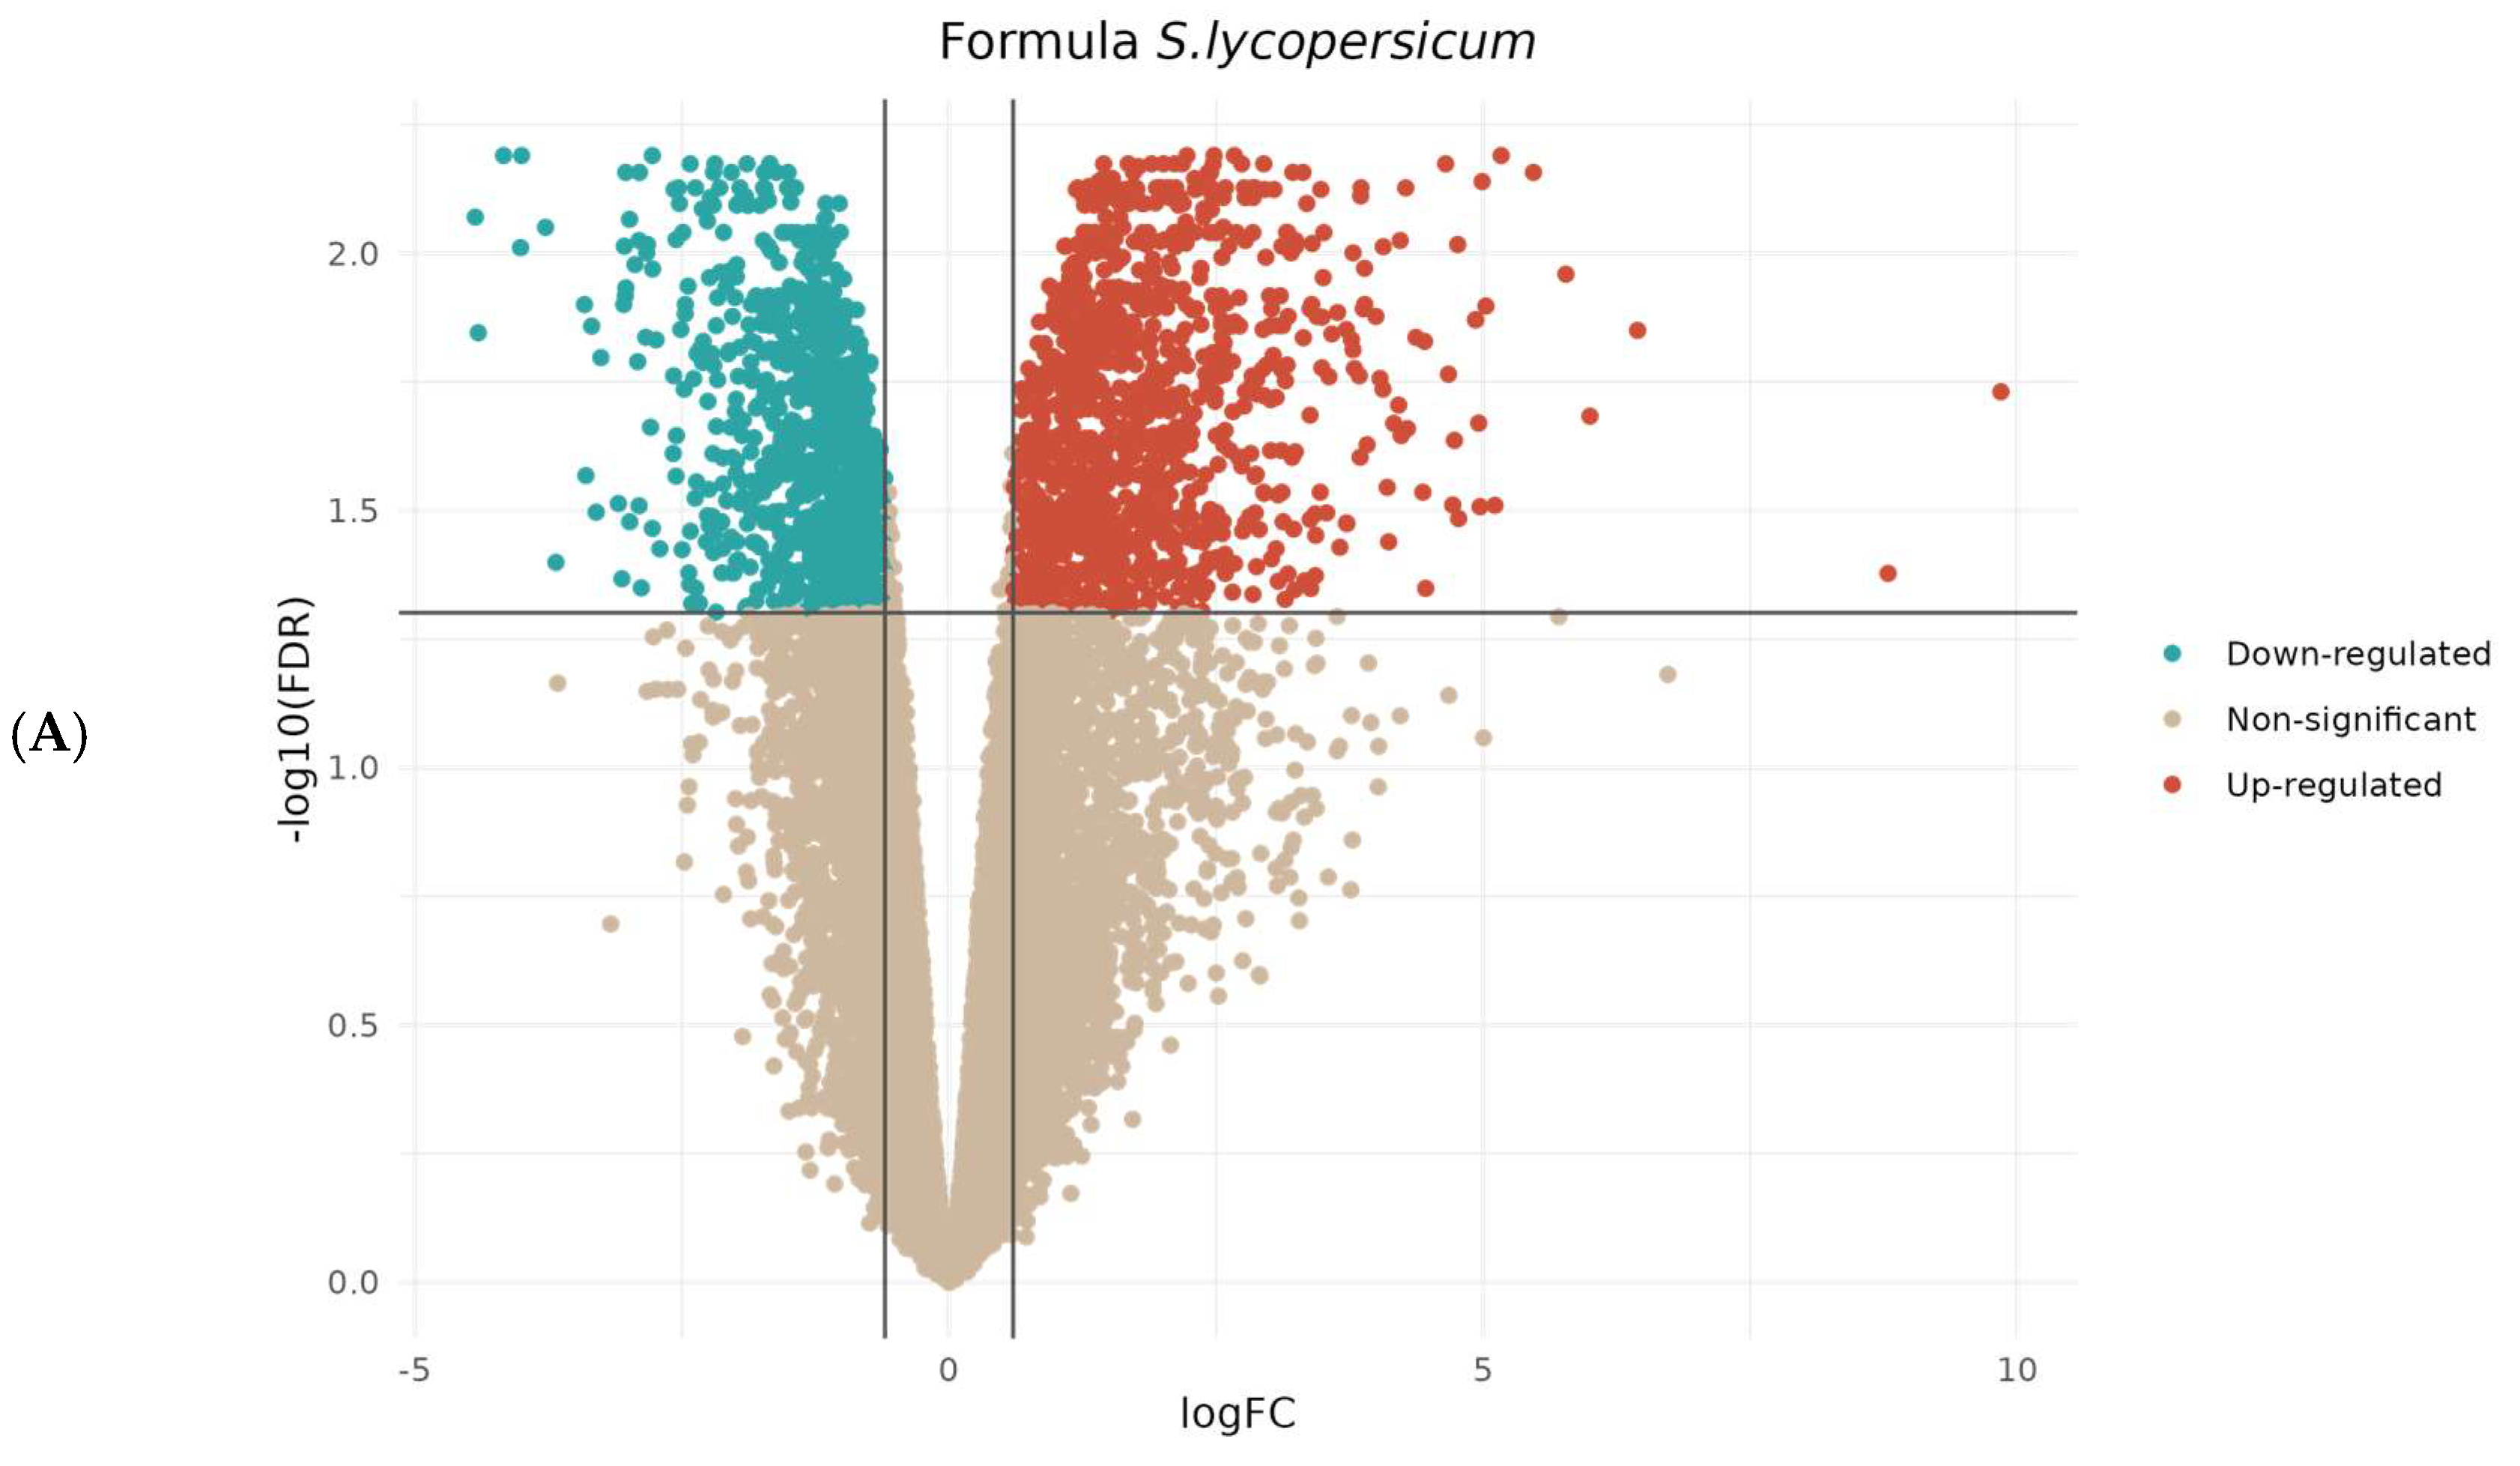
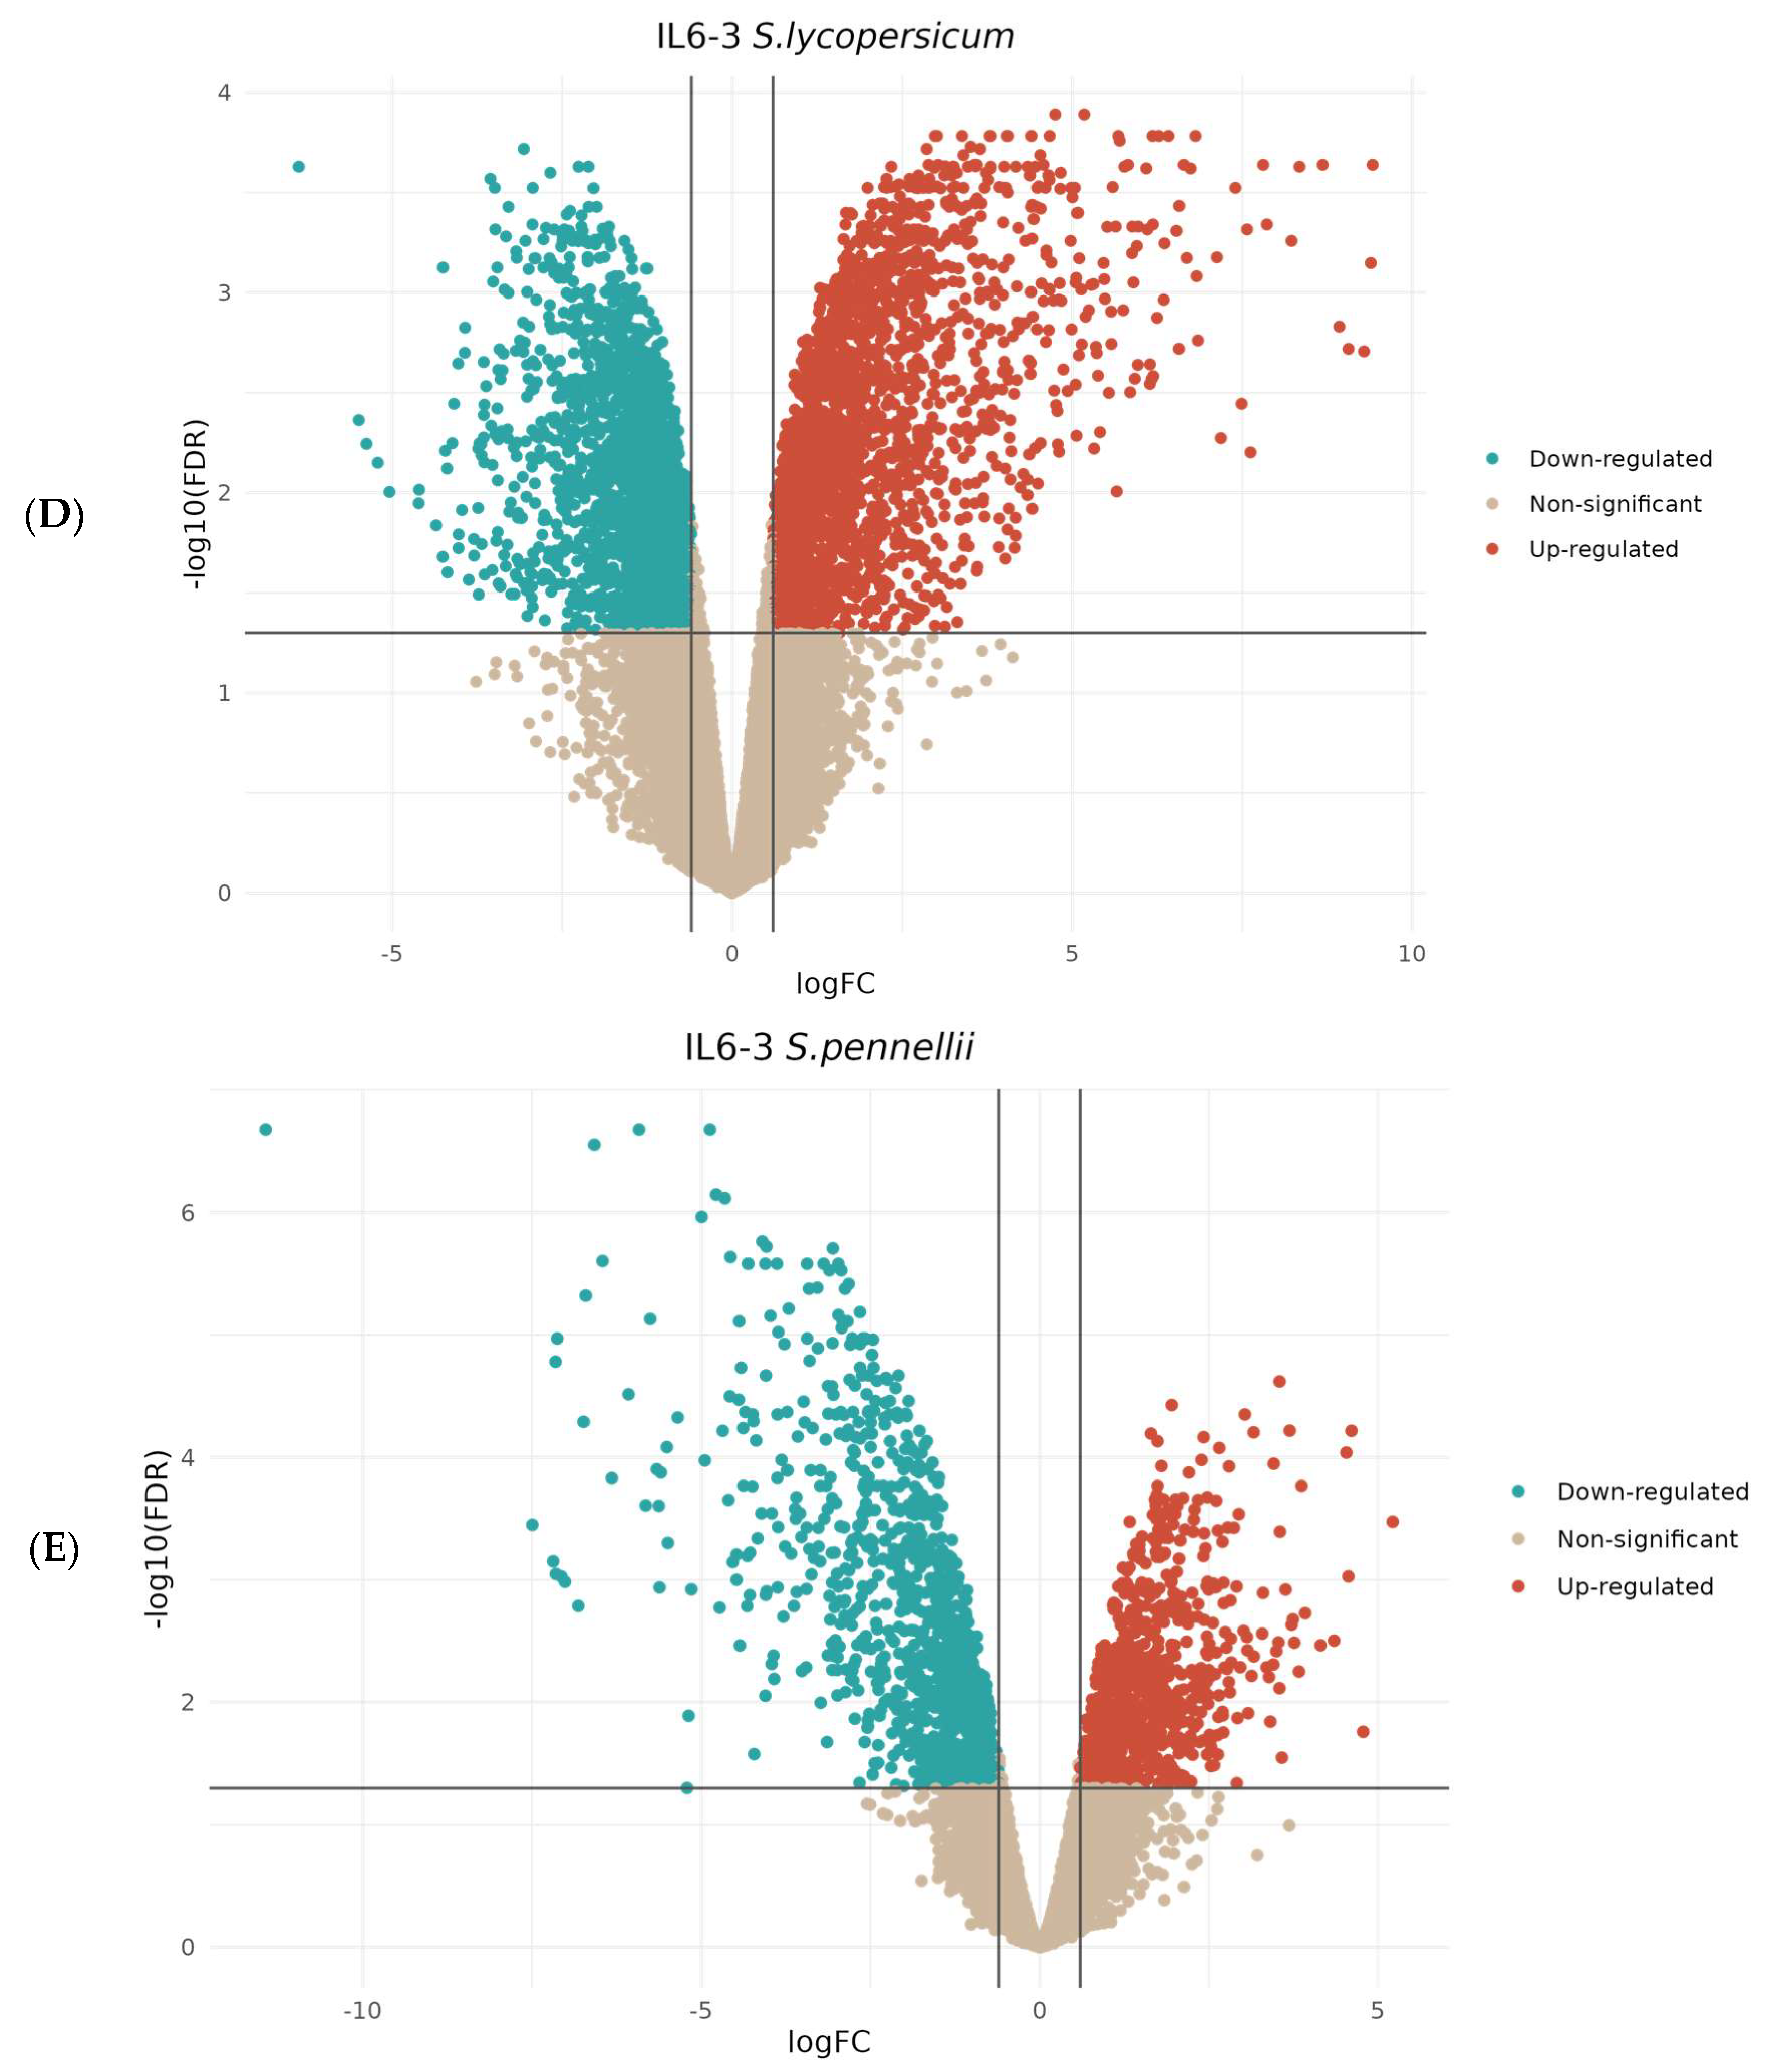
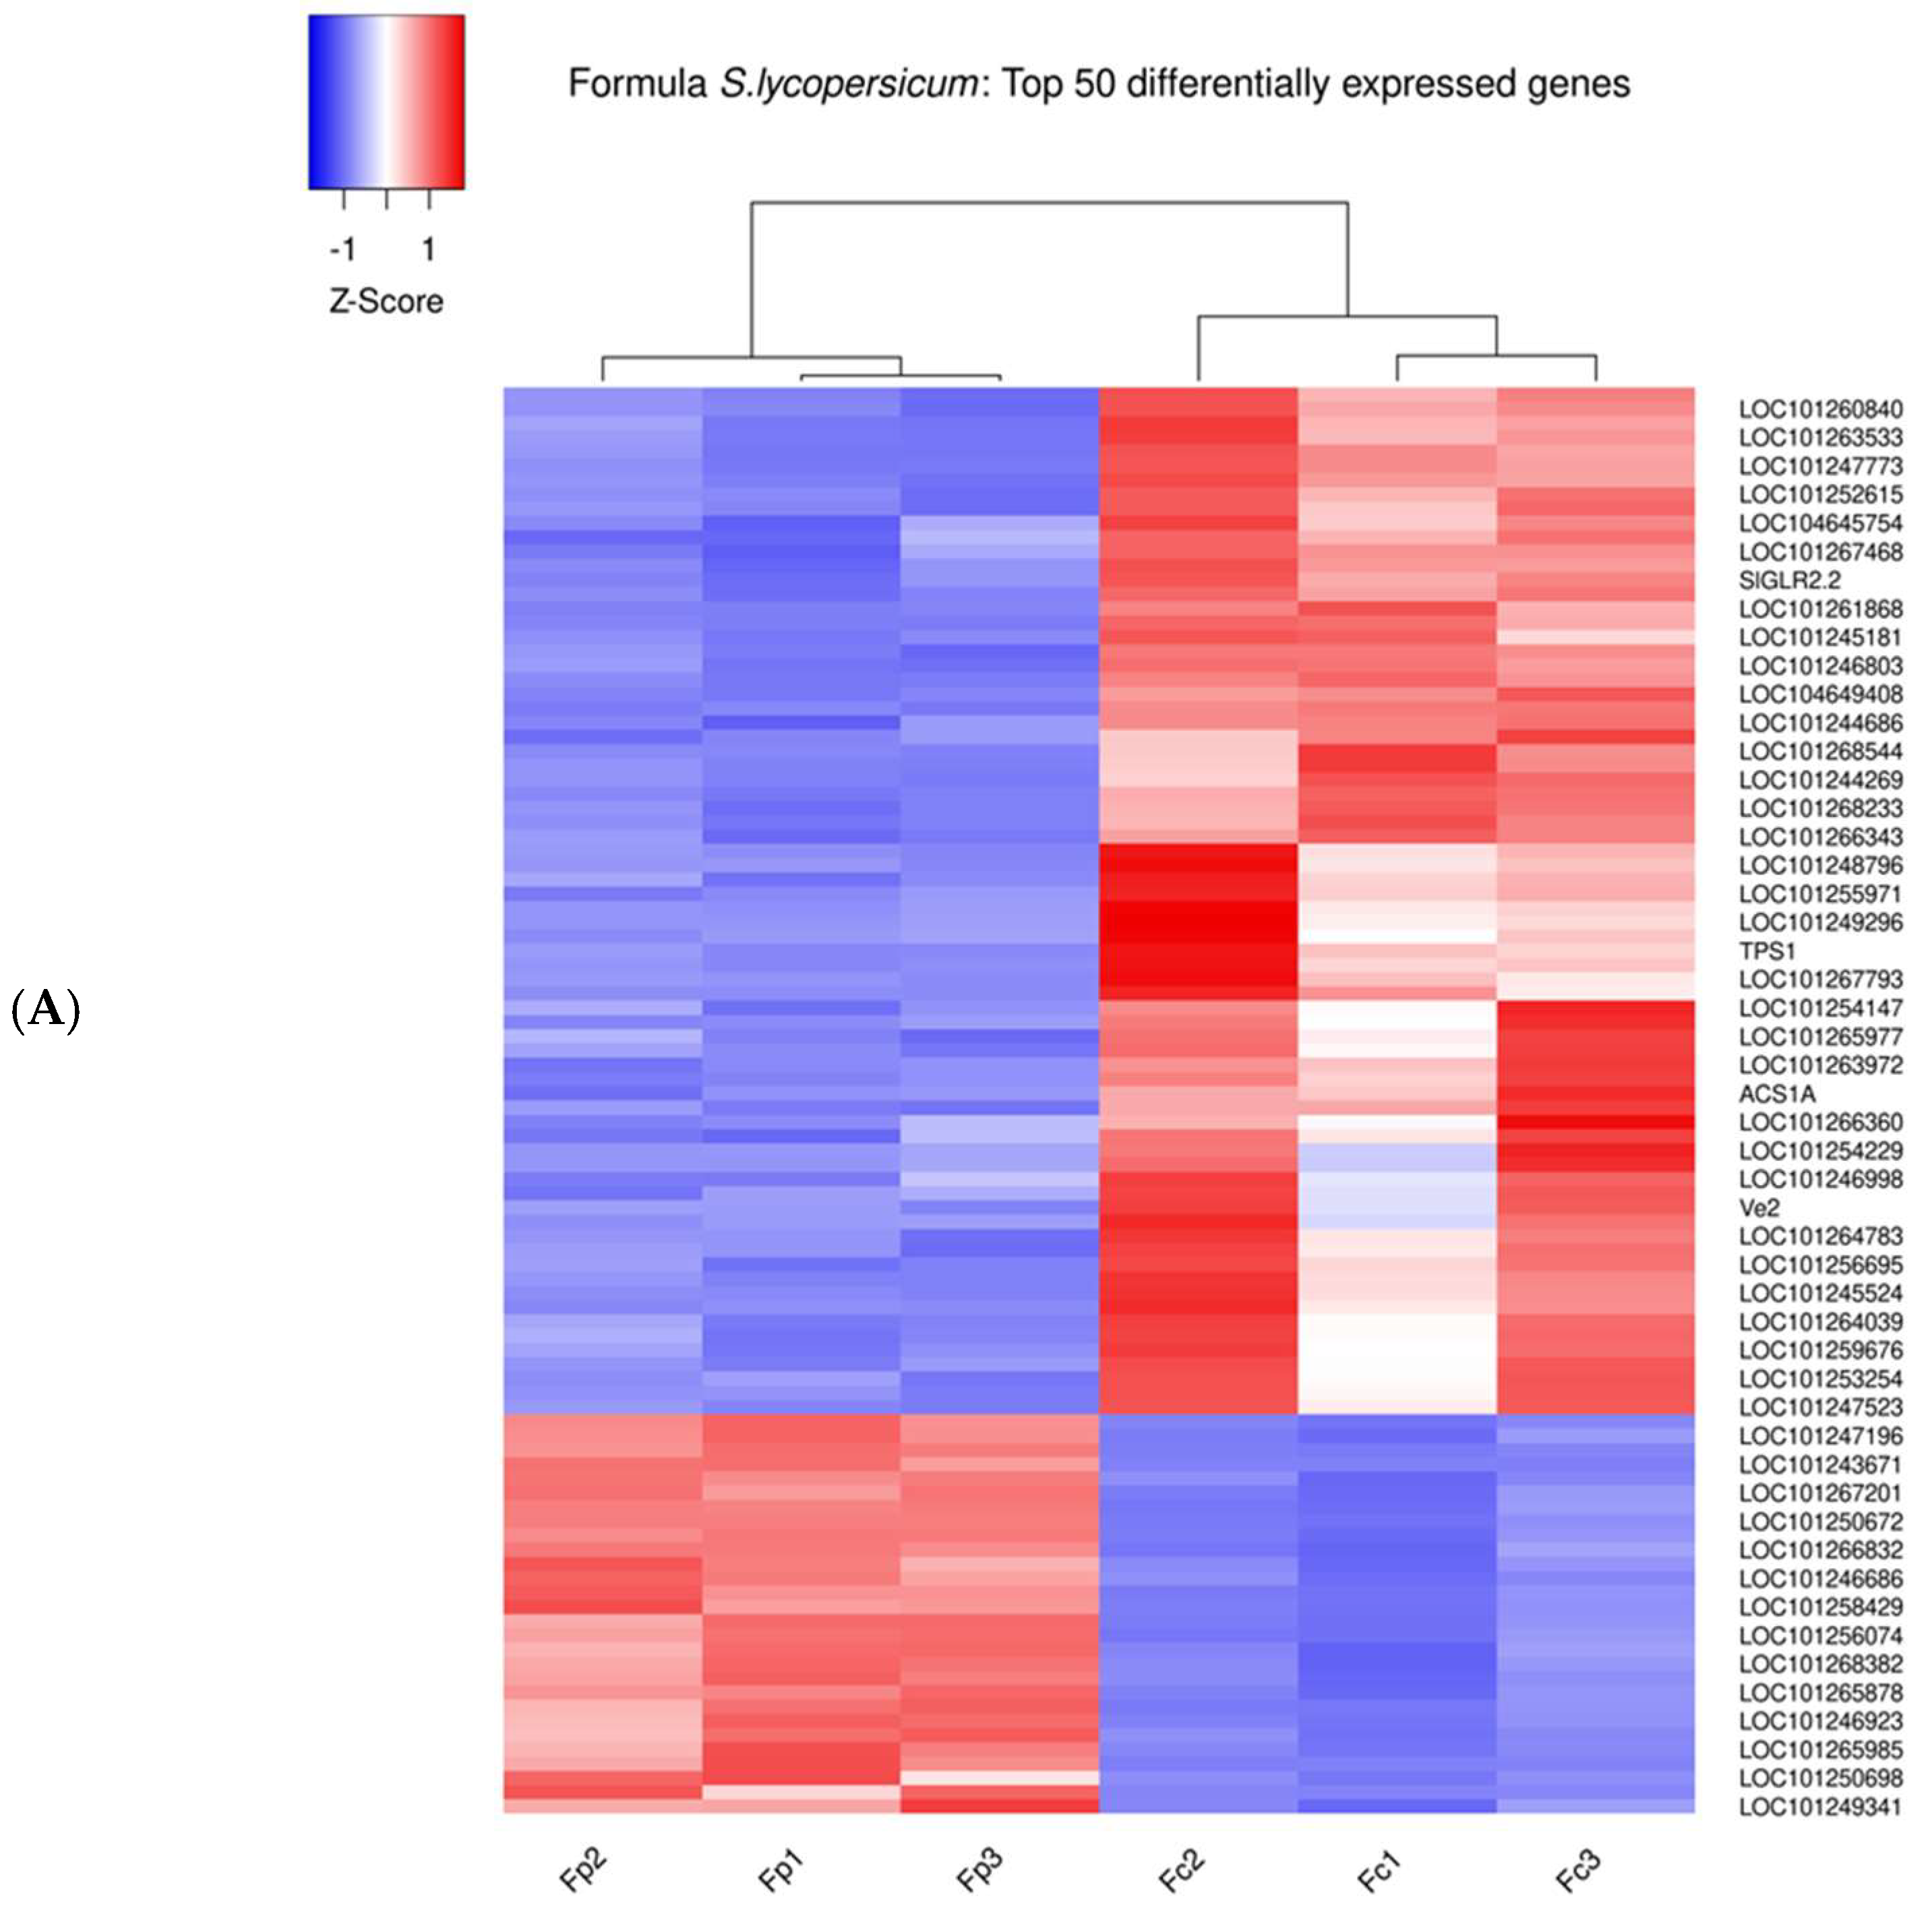
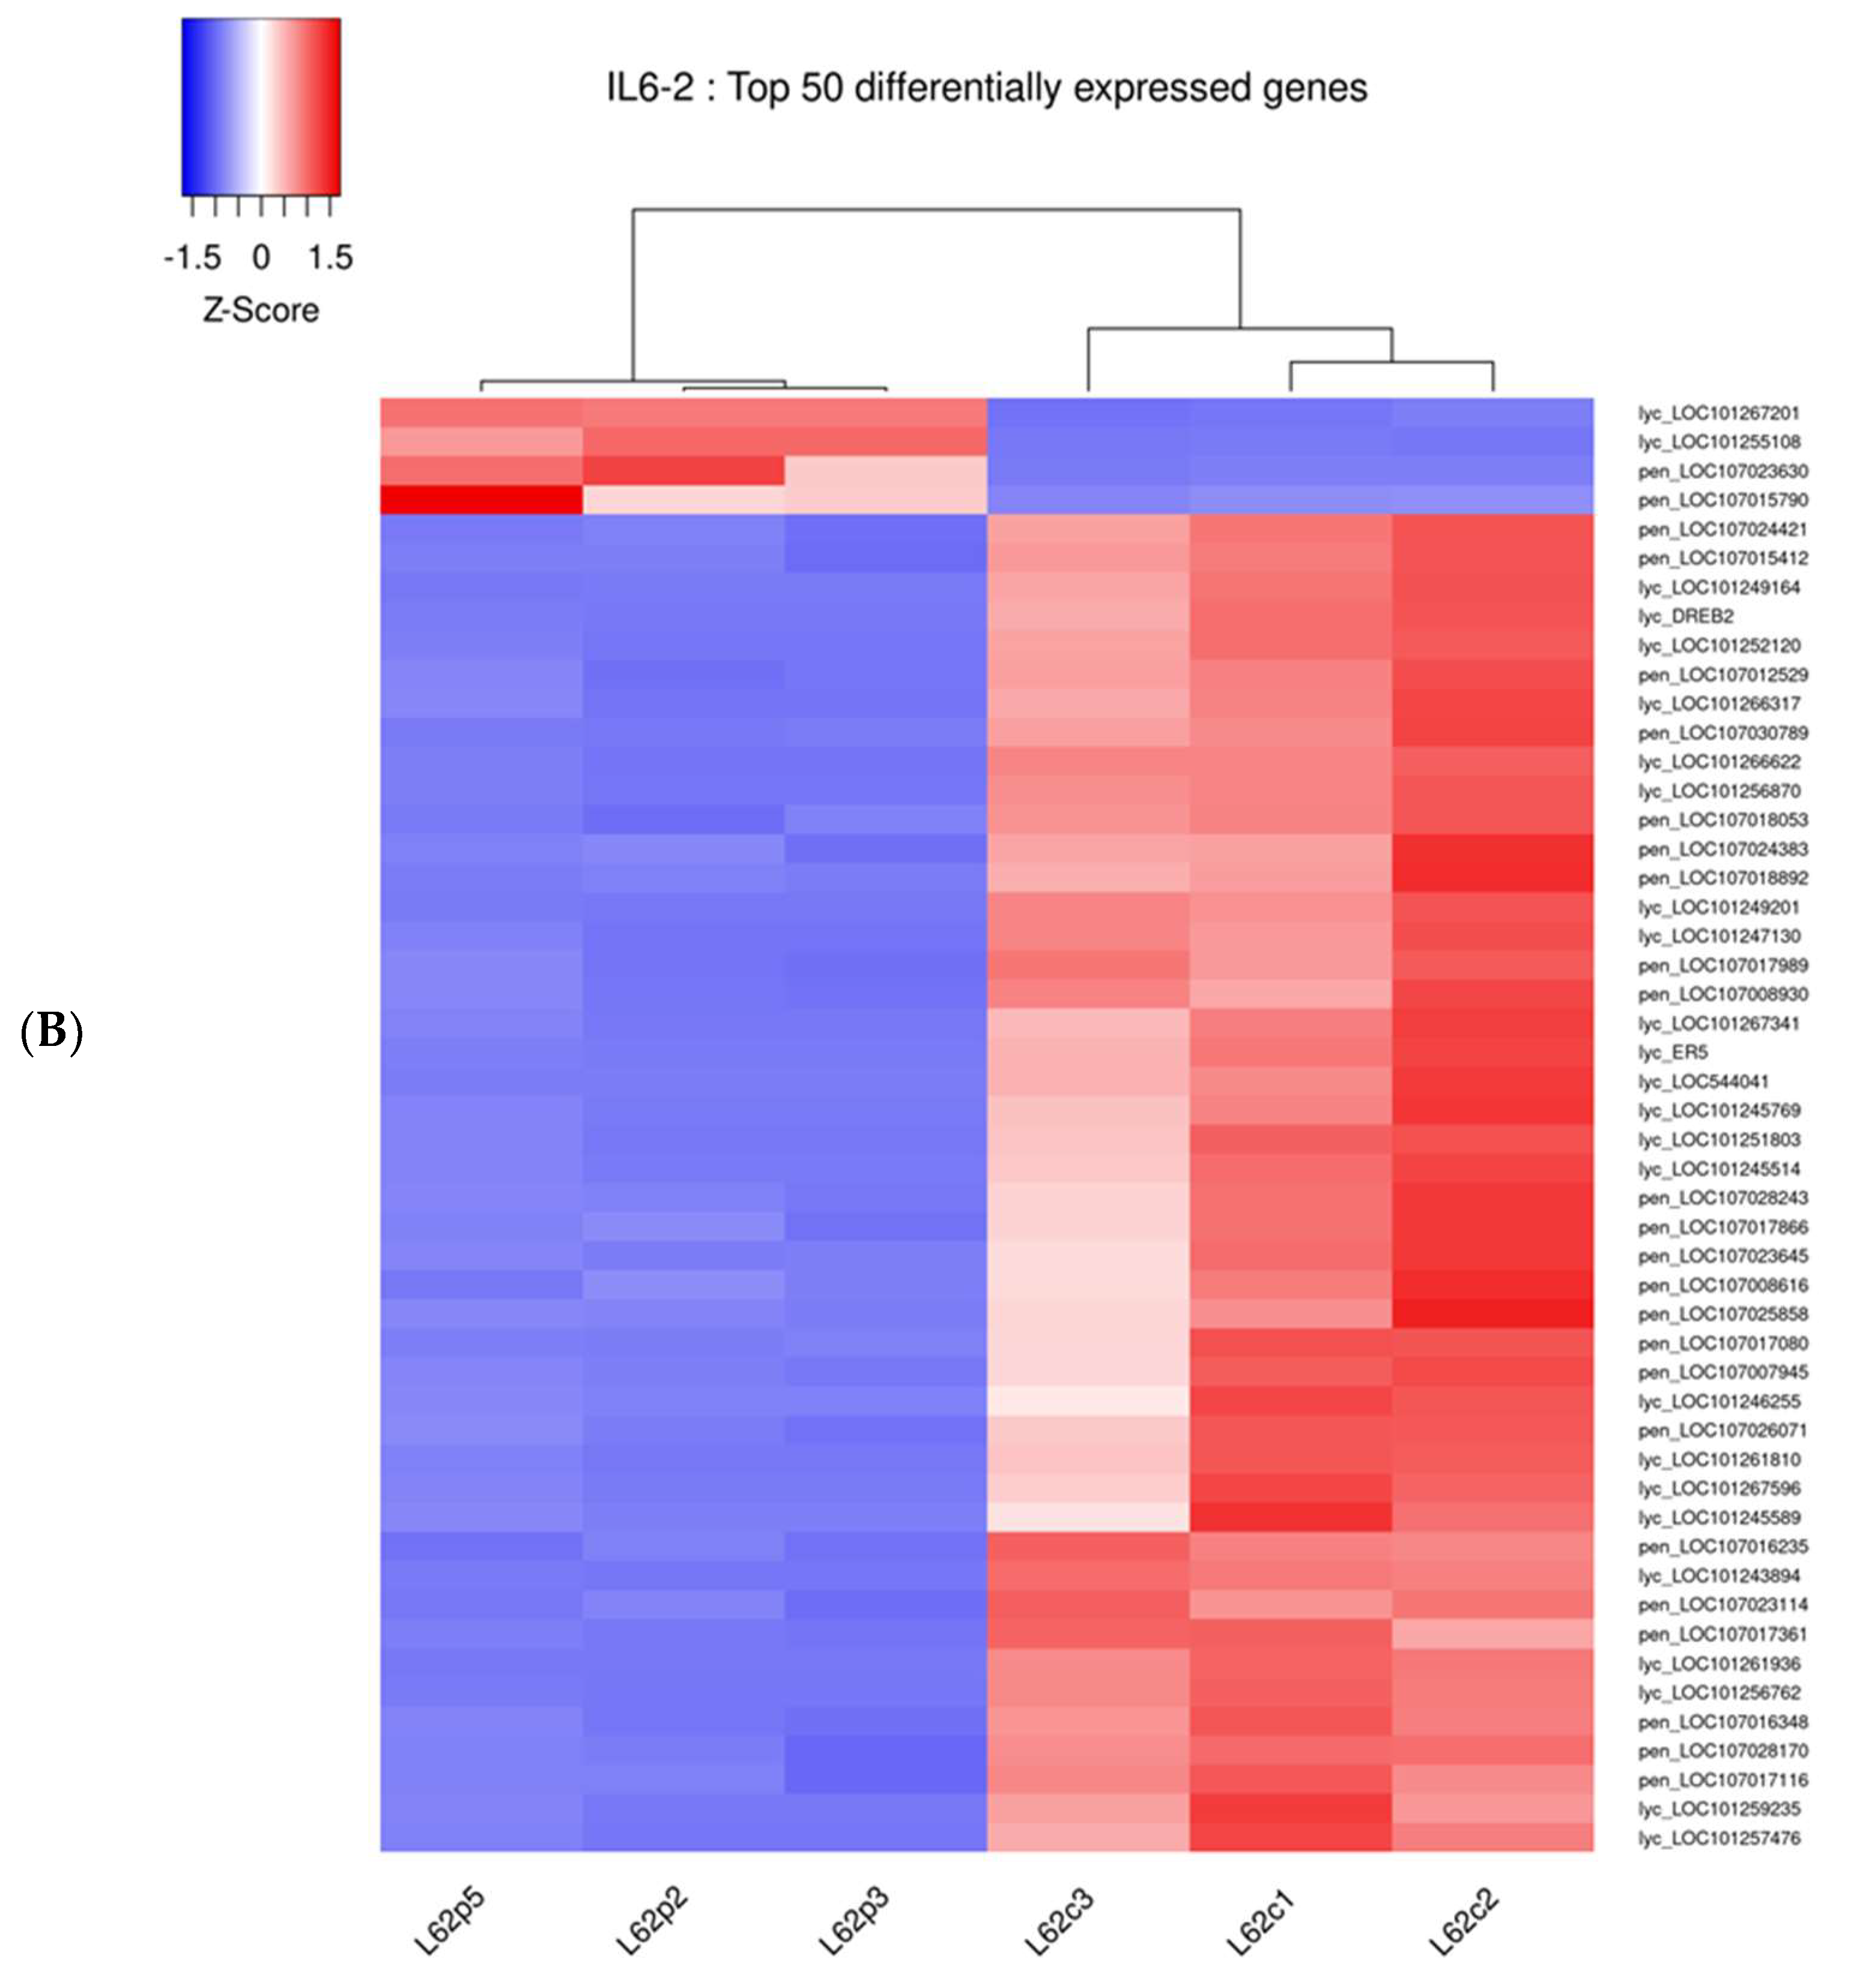
3.2. Comparative Transcriptomic Analysis Reveals Differentially Regulated Genes upon Parasitism
3.3. The 14 DEGs in Response to Broomrape Parasitism
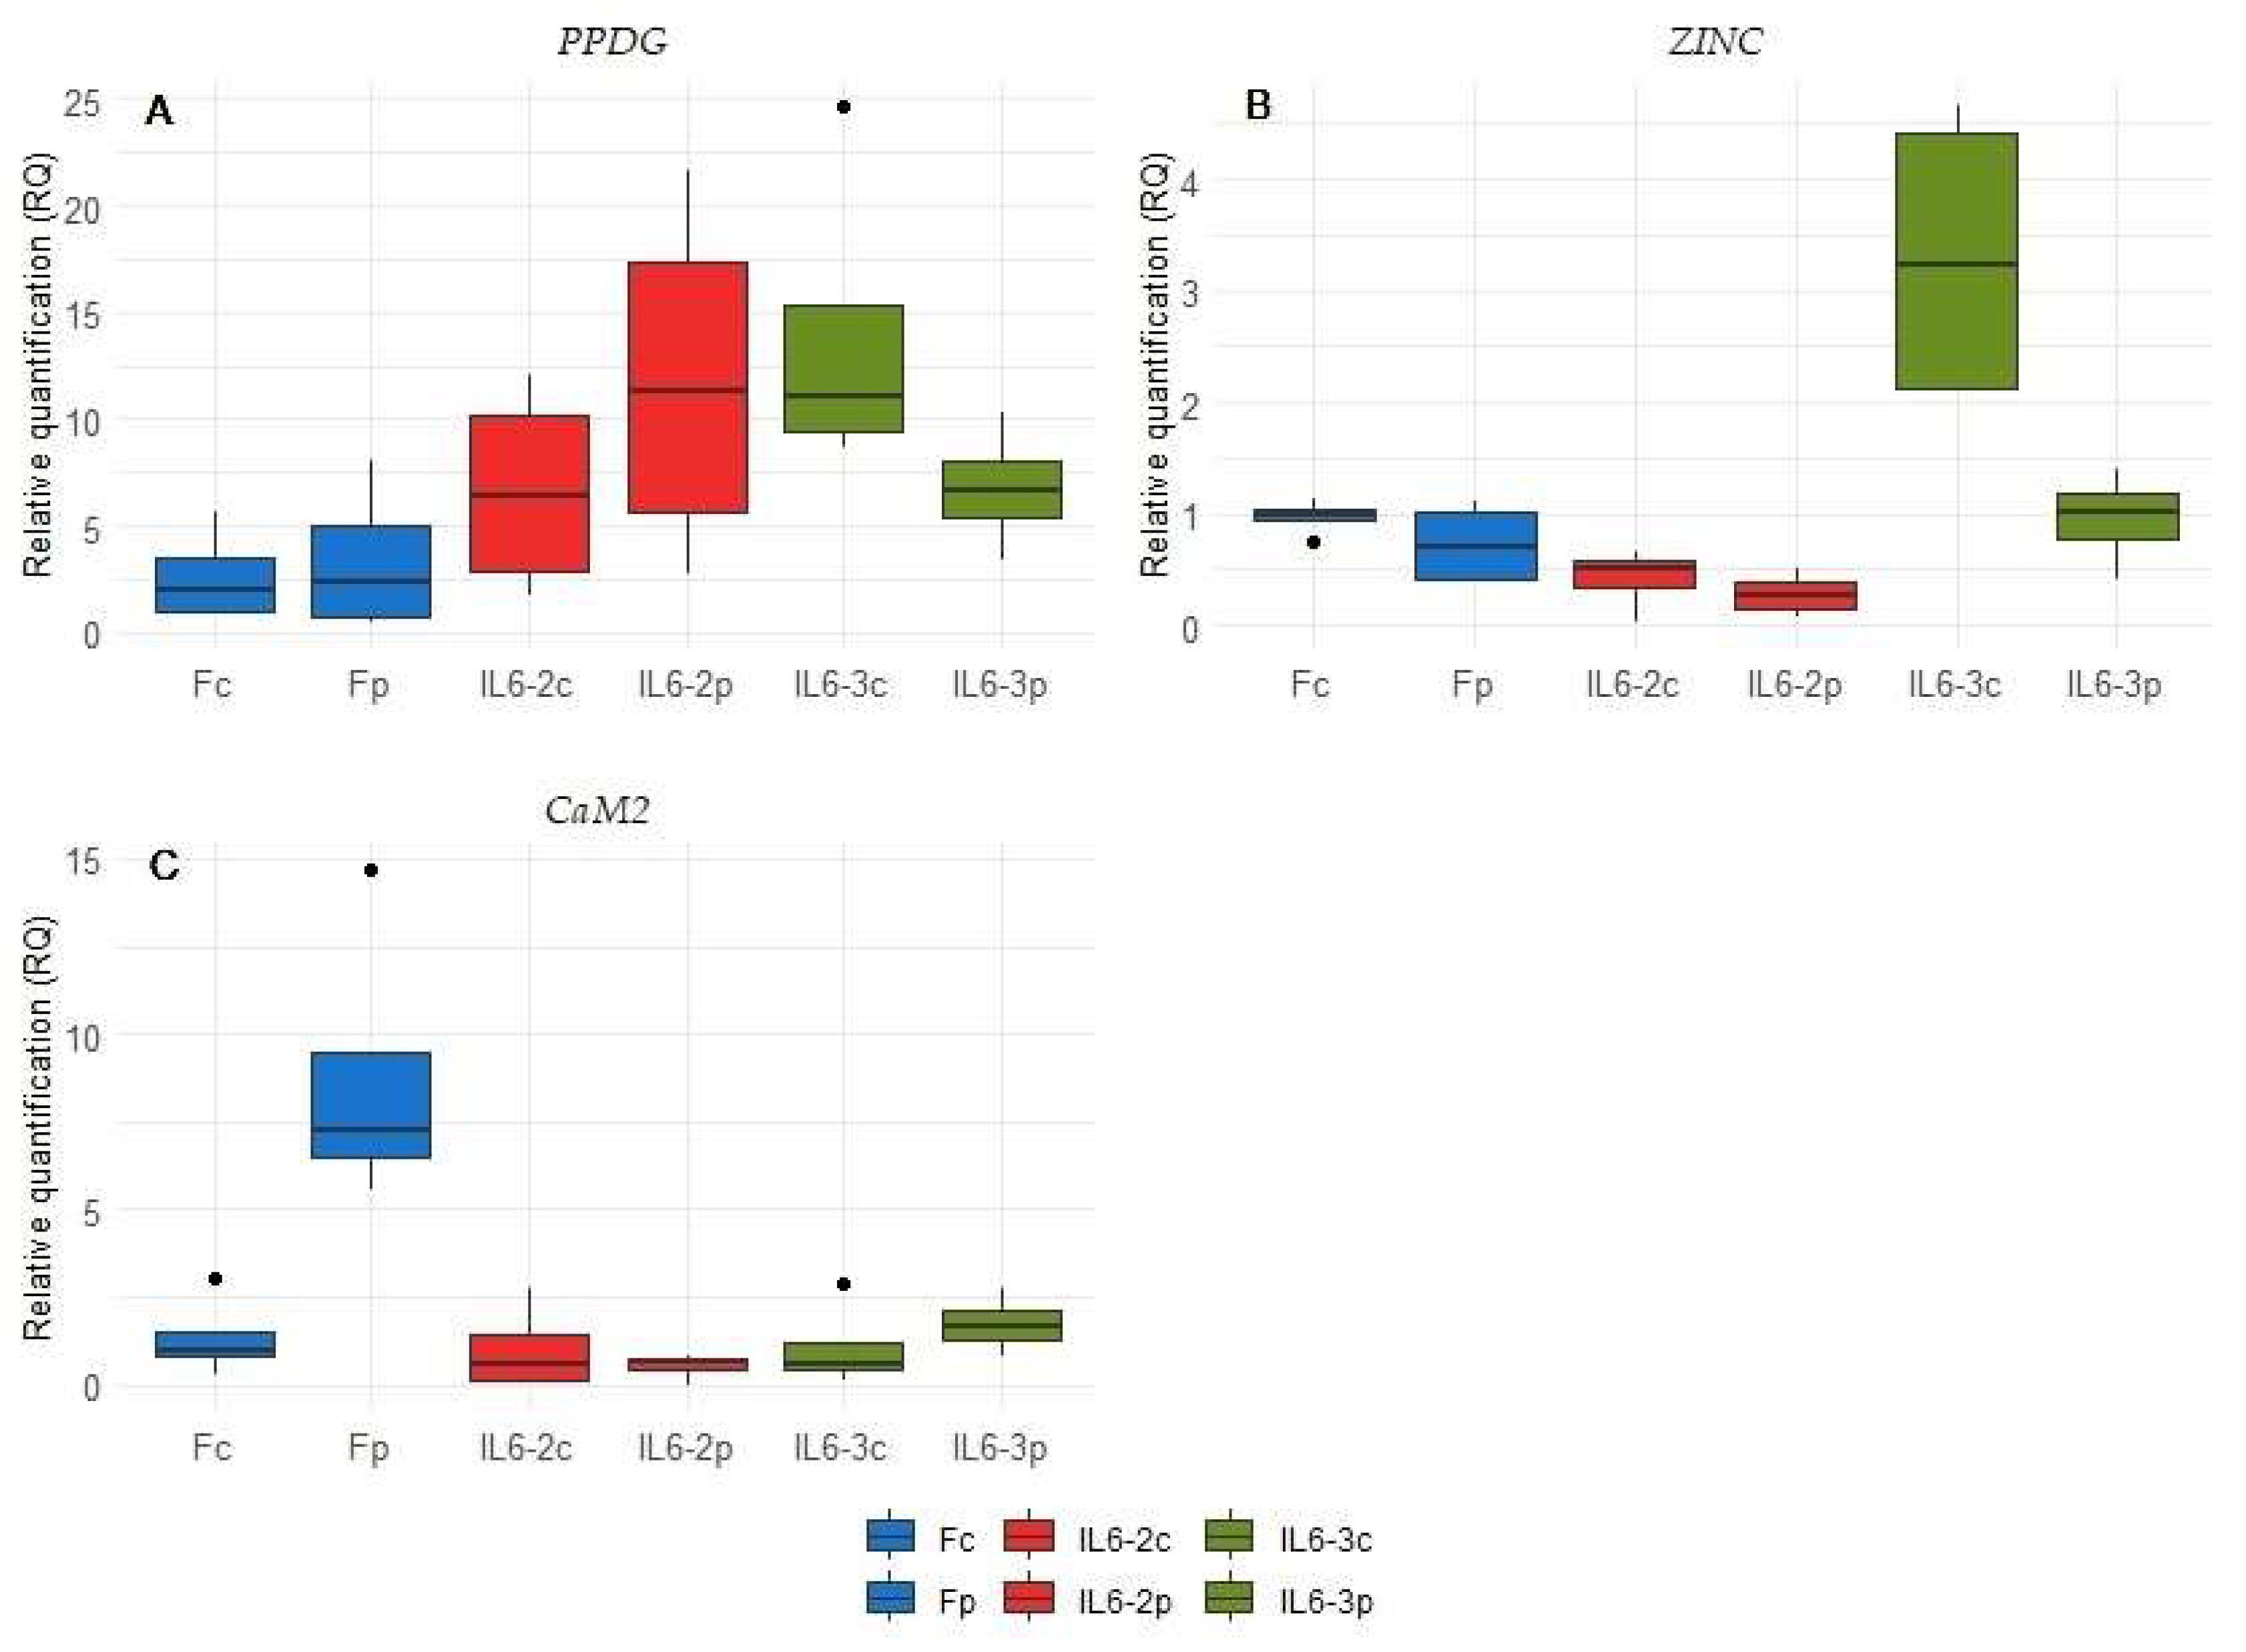
3.4. qPCR Validation Highlights Prominent Changes upon Parasitism in IL6-3 Line
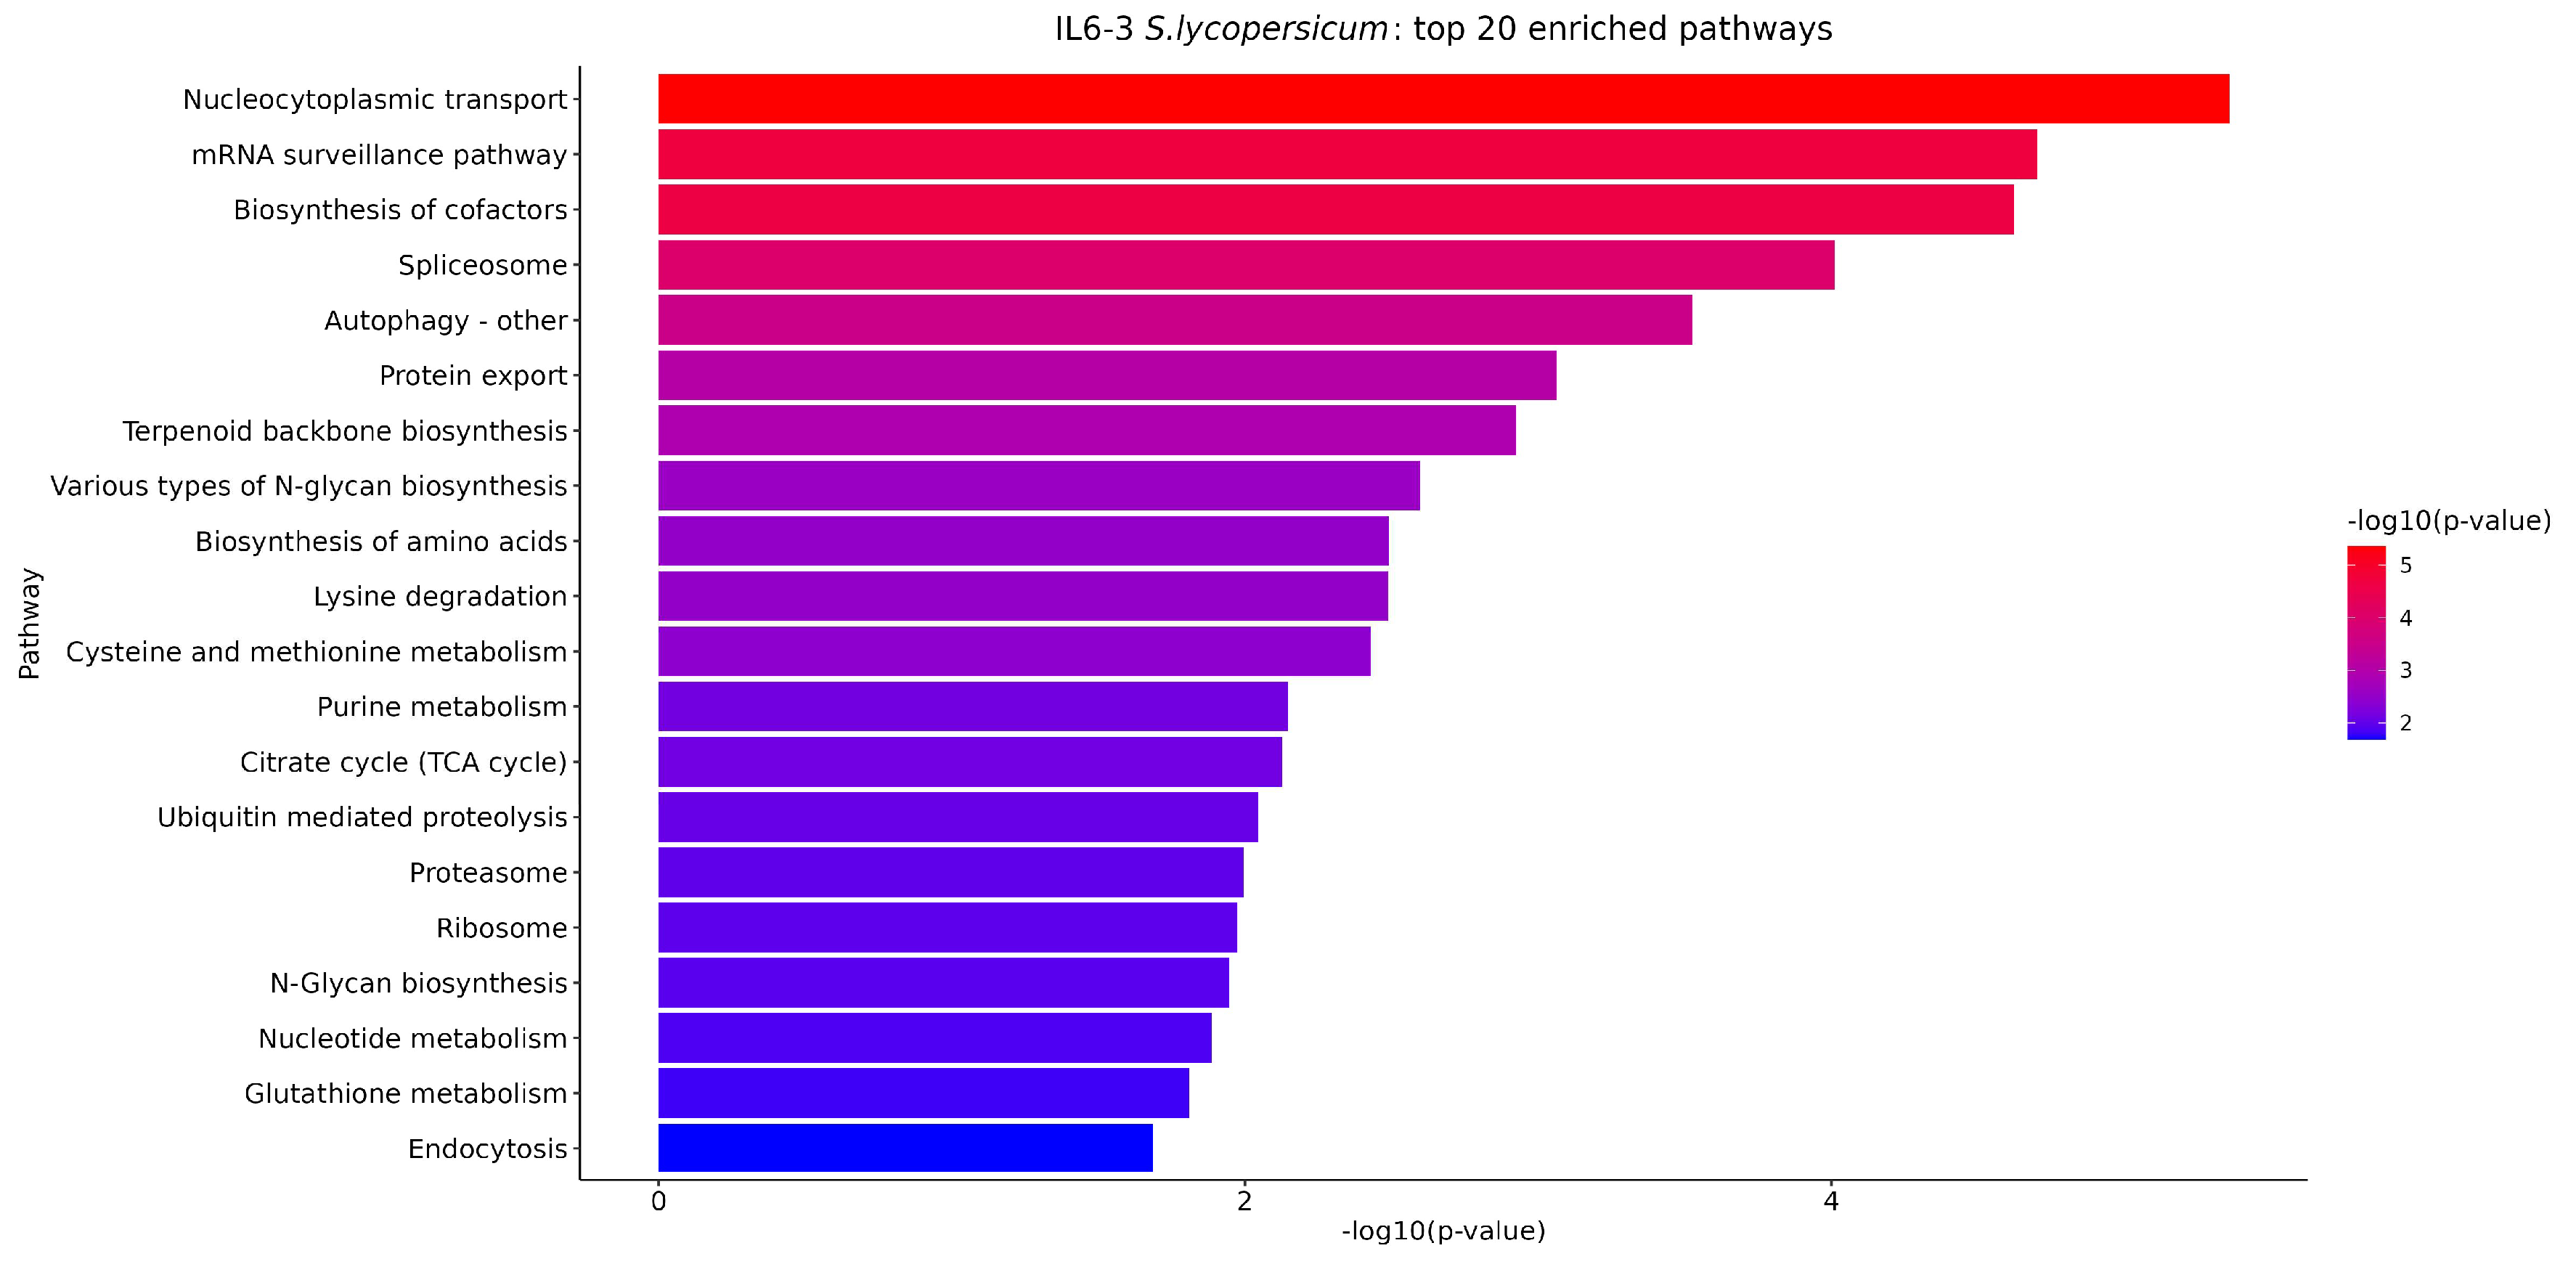
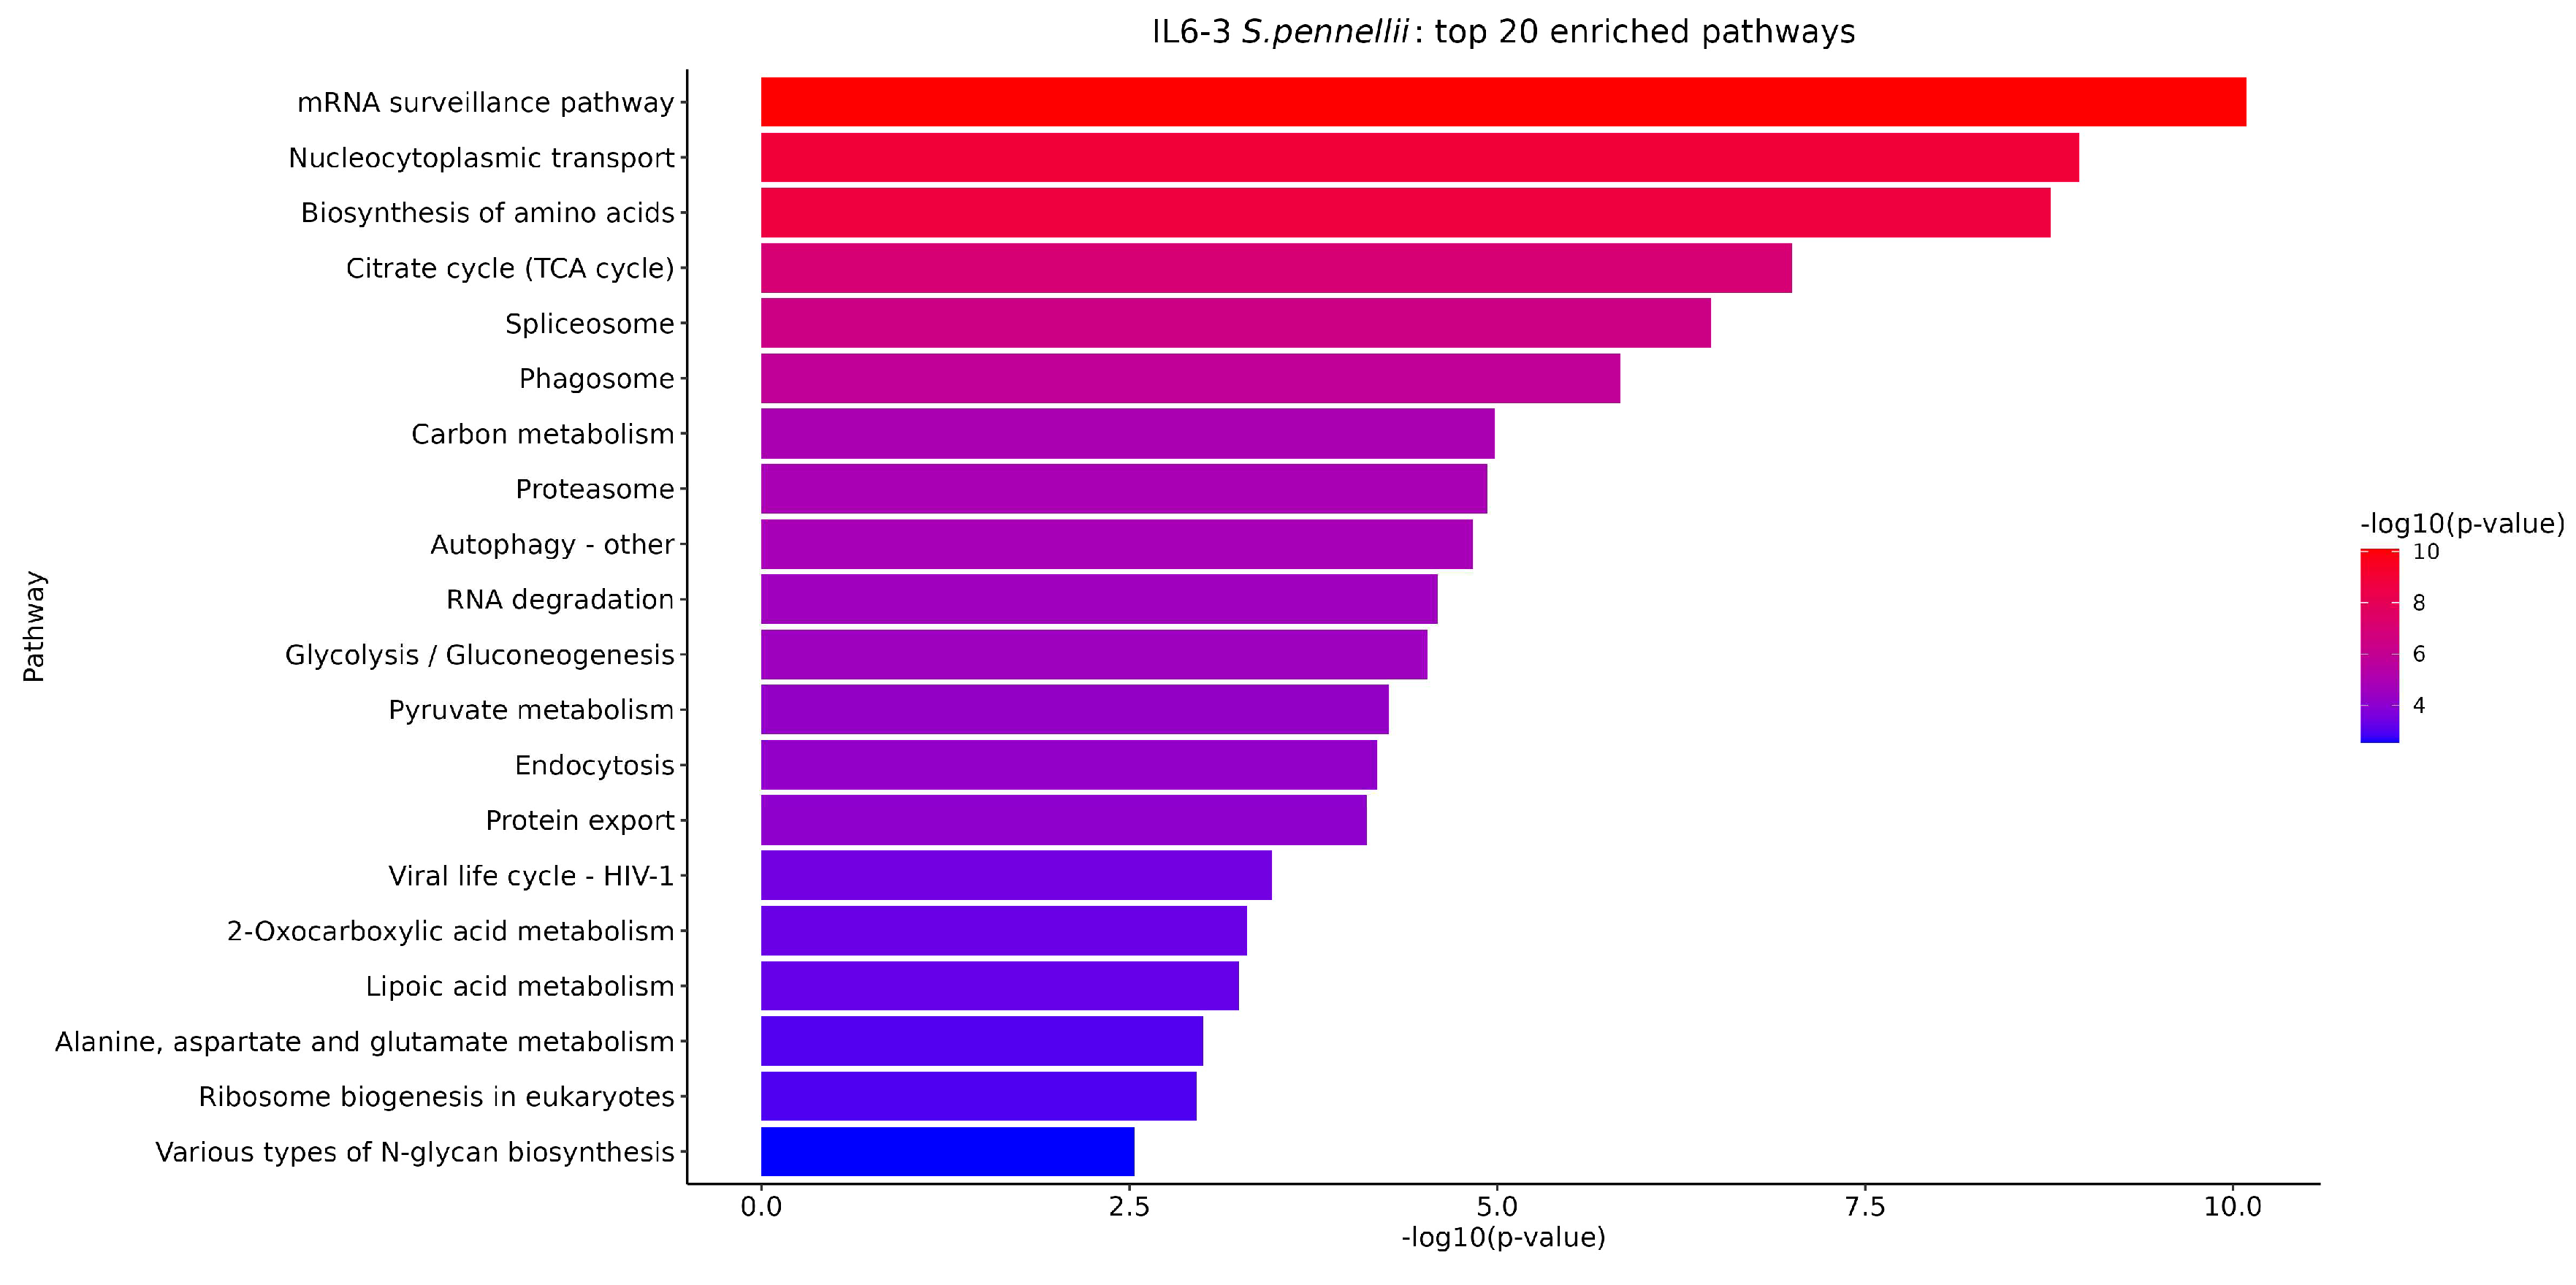
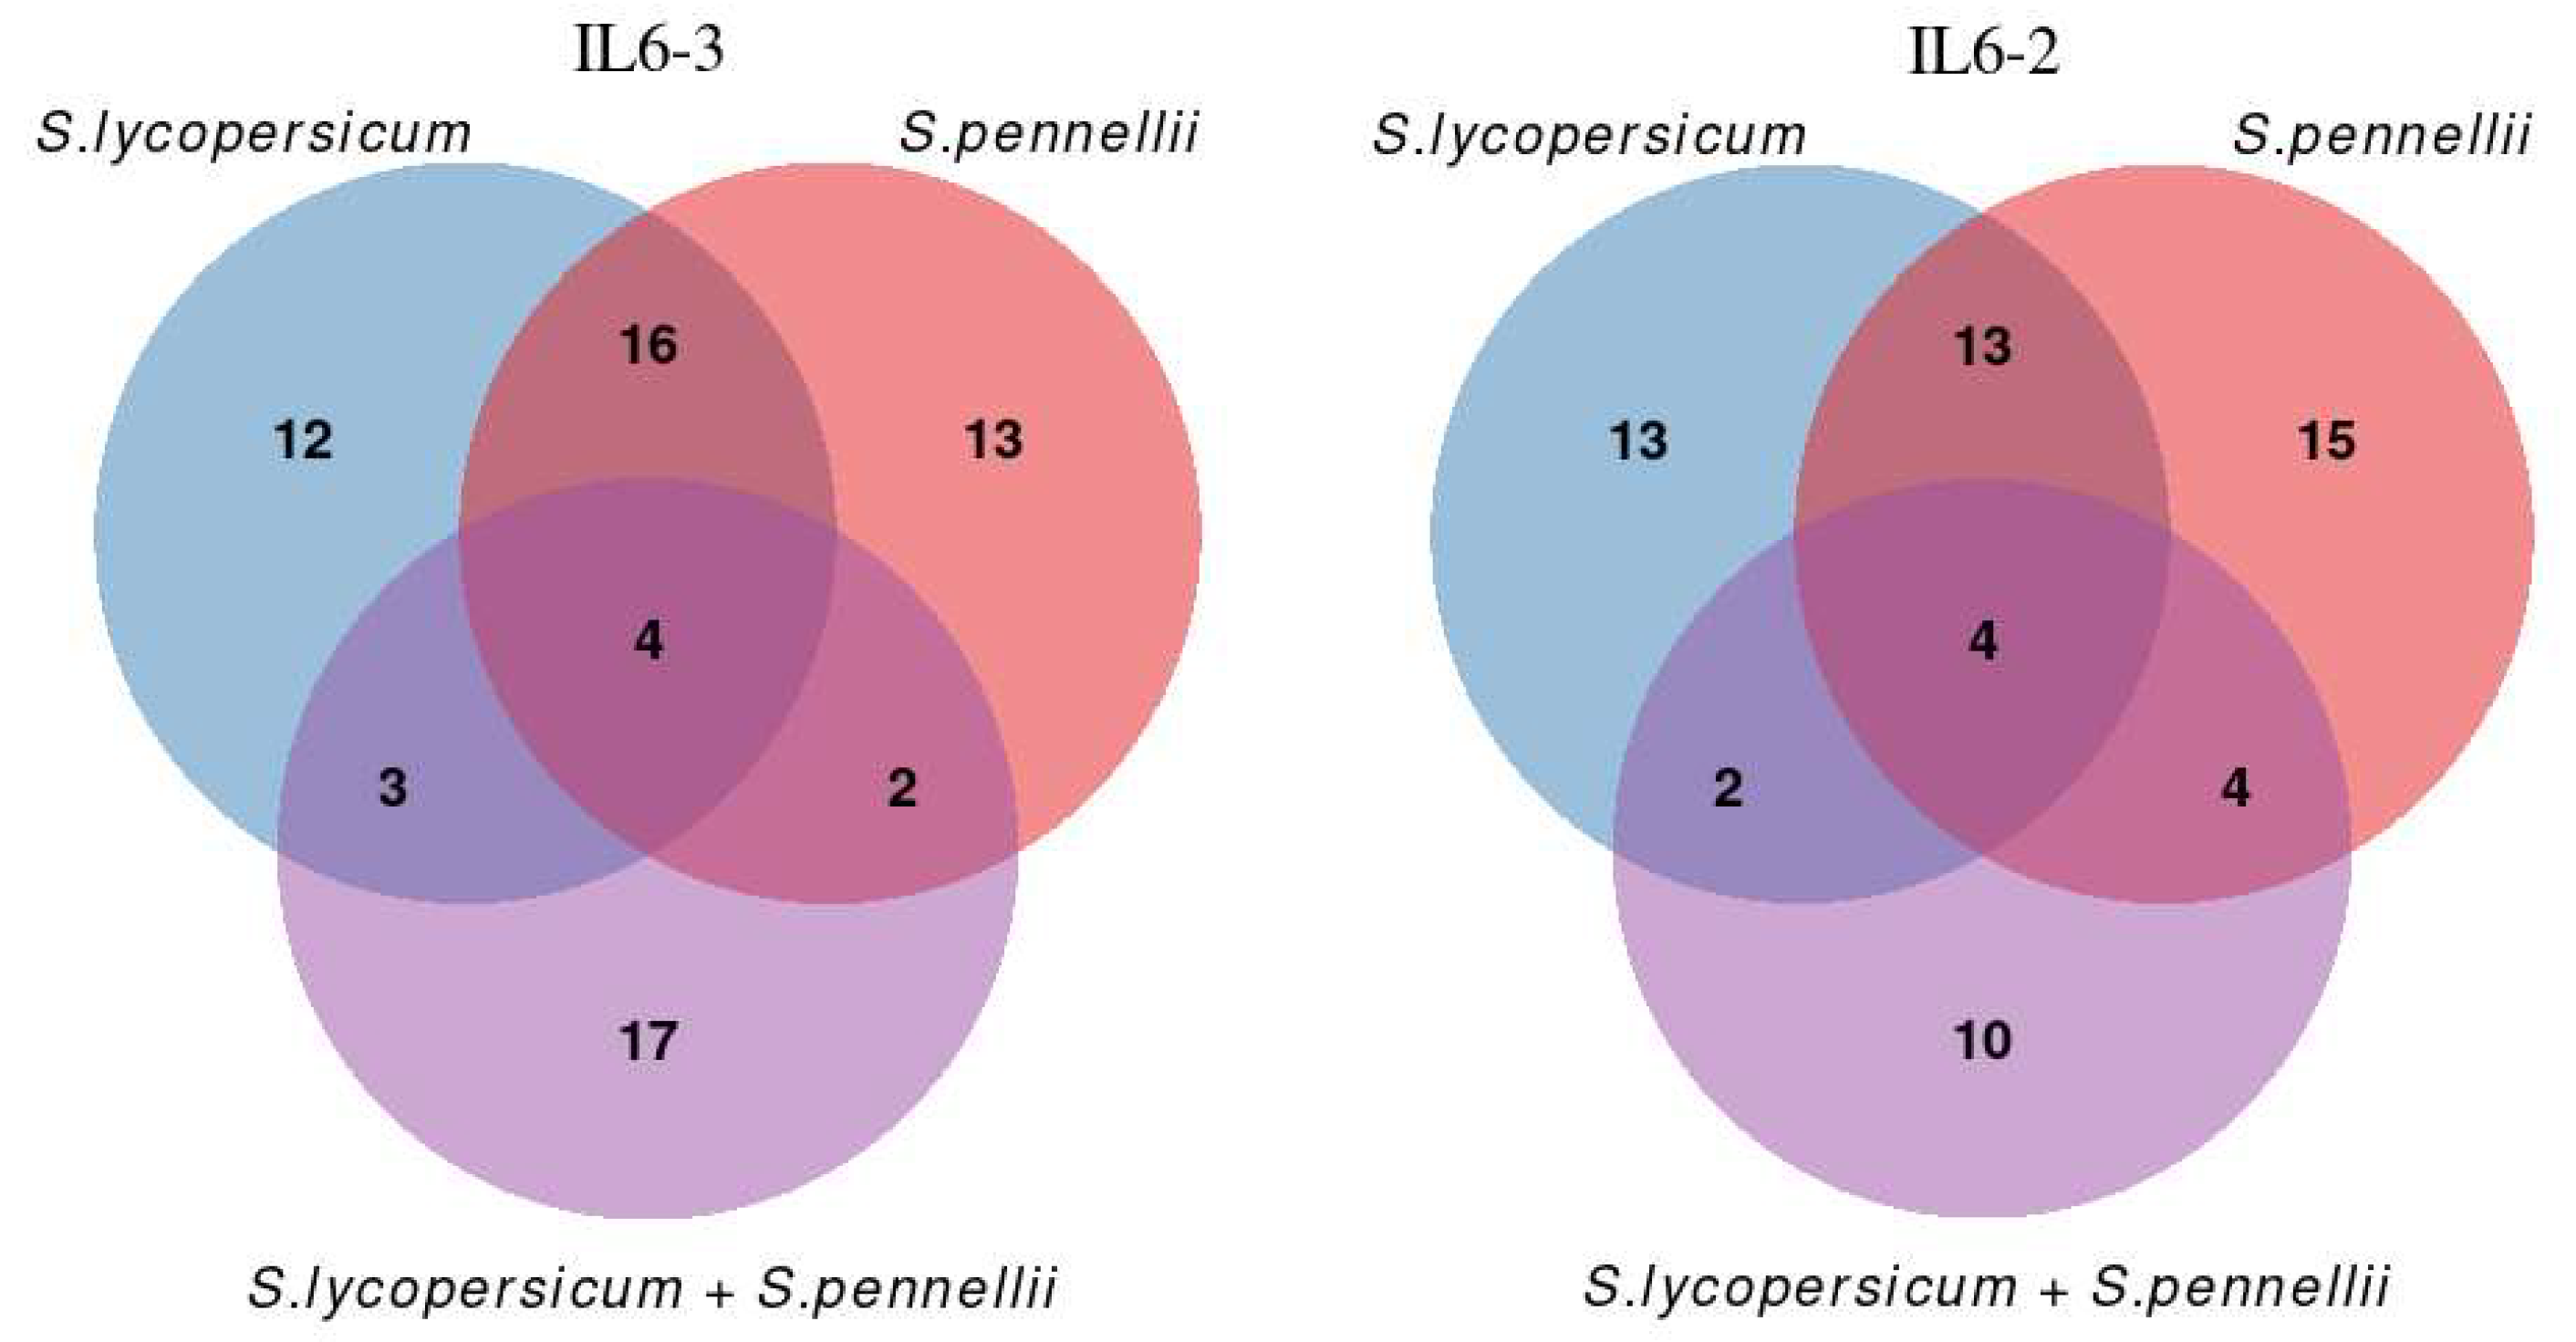
3.5. KEGG Enrichment Analysis of DEGs
4. Discussion
5. Conclusions
Supplementary Materials
Author Contributions
Funding
Institutional Review Board Statement
Data Availability Statement
Acknowledgments
Conflicts of Interest
References
- Varanasi, A.; Prasad, P.V.V.; Jugulam, M. Chapter Three—Impact of Climate Change Factors on Weeds and Herbicide Efficacy. In Advances in Agronomy; Sparks, D.L., Ed.; Academic Press: Cambridge, MA, USA, 2016; Volume 135, pp. 107–146. [Google Scholar]
- Matzrafi, M.; Seiwert, B.; Reemtsma, T.; Rubin, B.; Peleg, Z. Climate Change Increases the Risk of Herbicide-Resistant Weeds Due to Enhanced Detoxification. Planta 2016, 244, 1217–1227. [Google Scholar] [CrossRef]
- Dor, E.; Goldwasser, Y. “Parasitic Weeds: Biology and Control” Special Issue Editors Summary. Plants 2022, 11, 1891. [Google Scholar] [CrossRef] [PubMed]
- Gerakari, M.; Cheimona, N.; Tani, E.; Travlos, I.; Chachalis, D.; Loddo, D.; Mathiassen, S.K.; Gitsopoulos, T.K.; Scarabel, L.; Panozzo, S.; et al. Biochemical and Rapid Molecular Analyses to Identify Glyphosate Resistance in Lolium spp. Agronomy 2022, 12, 40. [Google Scholar] [CrossRef]
- Ramesh, K.; Matloob, A.; Aslam, F.; Florentine, S.K.; Chauhan, B.S. Weeds in a Changing Climate: Vulnerabilities, Consequences, and Implications for Future Weed Management. Front. Plant Sci. 2017, 8, 95. [Google Scholar] [CrossRef] [PubMed]
- Cheng, X.; Floková, K.; Bouwmeester, H.; Ruyter-Spira, C. The Role of Endogenous Strigolactones and Their Interaction with ABA during the Infection Process of the Parasitic Weed Phelipanche ramosa in Tomato Plants. Front. Plant Sci. 2017, 8, 392. [Google Scholar] [CrossRef] [PubMed]
- Hershenhorn, J.; Eizenberg, H.; Dor, E.; Kapulnik, Y.; Goldwasser, Y. Phelipanche aegyptiaca Management in Tomato. Weed Res. 2009, 49, 34–47. [Google Scholar] [CrossRef]
- Fernández-Aparicio, M.; Reboud, X.; Gibot-Leclerc, S. Broomrape Weeds. Underground Mechanisms of Parasitism and Associated Strategies for Their Control: A Review. Front. Plant Sci. 2016, 7, 135. [Google Scholar] [CrossRef]
- Negewo, T.; Ahmed, S.; Tessema, T.; Tana, T. Biological Characteristics, Impacts, and Management of Crenate Broomrape (Orobanche crenata) in Faba Bean (Vicia faba): A Review. Front. Agron. 2022, 4, 708187. [Google Scholar] [CrossRef]
- Goldwasser, Y.; Kleifeld, Y. Recent Approaches to Orobanche Management. In Weed Biology and Management; Inderjit, Ed.; Springer: Dordrecht, The Netherlands, 2004; pp. 439–466. ISBN 978-94-017-0552-3. [Google Scholar]
- Joel, D.M.; Hershenhorn, J.; Eizenberg, H.; Aly, R.; Ejeta, G.; Rich, P.J.; Ransom, J.K.; Sauerborn, J.; Rubiales, D. Biology and Management of Weedy Root Parasites. In Horticultural Reviews; John Wiley & Sons, Ltd.: Hoboken, NJ, USA, 2007; pp. 267–349. ISBN 978-0-470-16801-1. [Google Scholar]
- Tsialtas, J.T.; Eleftherohorinos, I.G. First Report of Branched Broomrape (Orobanche ramosa) on Oilseed Rape (Brassica napus), Wild Mustard (Sinapis Arvensis), and Wild Vetch (Vicia Spp.) in Northern Greece. Plant Dis. 2011, 95, 1322. [Google Scholar] [CrossRef]
- Parker, C. The Parasitic Weeds of the Orobanchaceae. In Parasitic Orobanchaceae: Parasitic Mechanisms and Control Strategies; Joel, D.M., Gressel, J., Musselman, L.J., Eds.; Springer: Berlin/Heidelberg, Germany, 2013; pp. 313–344. ISBN 978-3-642-38146-1. [Google Scholar]
- Bergougnoux, V. The History of Tomato: From Domestication to Biopharming. Biotechnol. Adv. 2014, 32, 170–189. [Google Scholar] [CrossRef]
- Disciglio, G.; Lops, F.; Carlucci, A.; Gatta, G.; Tarantino, A.; Frabboni, L.; Carriero, F.; Tarantino, E. Effects of Different Methods to Control the Parasitic Weed Phelipanche ramosa (L.) Pomel in Processing Tomato Crops. Ital. J. Agron. 2016, 11, 39–46. [Google Scholar] [CrossRef]
- El-Halmouch, Y.; Benharrat, H.; Thalouarn, P. Effect of Root Exudates from Different Tomato Genotypes on Broomrape (O. aegyptiaca) Seed Germination and Tubercle Development. Crop Prot. 2006, 25, 501–507. [Google Scholar] [CrossRef]
- Cvejić, S.; Radanović, A.; Dedić, B.; Jocković, M.; Jocić, S.; Miladinović, D. Genetic and Genomic Tools in Sunflower Breeding for Broomrape Resistance. Genes 2020, 11, 152. [Google Scholar] [CrossRef] [PubMed]
- Kostov, K.; Batchvarova, R.; Slavov, S. Application of Chemical Mutagenesis to Increase the Resistance of Tomato to Orobanche ramosa L. Bulg. J. Agric. Sci. 2007, 13, 505–513. [Google Scholar]
- Draie, R. Differential Responses of Commercial Tomato Rootstocks to Branched Broomrape. Res. Plant Sci. 2017, 5, 15–25. [Google Scholar] [CrossRef]
- Bari, V.K.; Nassar, J.A.; Kheredin, S.M.; Gal-On, A.; Ron, M.; Britt, A.; Steele, D.; Yoder, J.; Aly, R. CRISPR/Cas9-Mediated Mutagenesis of CAROTENOID CLEAVAGE DIOXYGENASE 8 in Tomato Provides Resistance against the Parasitic Weed Phelipanche aegyptiaca. Sci. Rep. 2019, 9, 11438. [Google Scholar] [CrossRef] [PubMed]
- Bari, V.K.; Nassar, J.A.; Meir, A.; Aly, R. Targeted Mutagenesis of Two Homologous ATP-Binding Cassette Subfamily G (ABCG) Genes in Tomato Confers Resistance to Parasitic Weed Phelipanche aegyptiaca. J. Plant Res. 2021, 134, 585–597. [Google Scholar] [CrossRef] [PubMed]
- Orellana, S.; Yañez, M.; Espinoza, A.; Verdugo, I.; González, E.; Ruiz-Lara, S.; Casaretto, J.A. The Transcription Factor SlAREB1 Confers Drought, Salt Stress Tolerance and Regulates Biotic and Abiotic Stress-Related Genes in Tomato. Plant Cell Environ. 2010, 33, 2191–2208. [Google Scholar] [CrossRef] [PubMed]
- Bolger, A.; Scossa, F.; Bolger, M.E.; Lanz, C.; Maumus, F.; Tohge, T.; Quesneville, H.; Alseekh, S.; Sørensen, I.; Lichtenstein, G.; et al. The Genome of the Stress-Tolerant Wild Tomato Species Solanum pennellii. Nat. Genet. 2014, 46, 1034–1038. [Google Scholar] [CrossRef]
- Kapazoglou, A.; Gerakari, M.; Lazaridi, E.; Kleftogianni, K.; Sarri, E.; Tani, E.; Bebeli, P.J. Crop Wild Relatives: A Valuable Source of Tolerance to Various Abiotic Stresses. Plants 2023, 12, 328. [Google Scholar] [CrossRef]
- Chitwood, D.H.; Kumar, R.; Headland, L.R.; Ranjan, A.; Covington, M.F.; Ichihashi, Y.; Fulop, D.; Jiménez-Gómez, J.M.; Peng, J.; Maloof, J.N.; et al. A Quantitative Genetic Basis for Leaf Morphology in a Set of Precisely Defined Tomato Introgression Lines. Plant Cell 2013, 25, 2465–2481. [Google Scholar] [CrossRef] [PubMed]
- Pessoa, H.P.; Dariva, F.D.; Copati, M.G.F.; Paula, R.G.d.; Dias, F.d.O.; Gomes, C.N. Uncovering Tomato Candidate Genes Associated with Drought Tolerance Using Solanum pennellii Introgression Lines. PLoS ONE 2023, 18, e0287178. [Google Scholar] [CrossRef] [PubMed]
- Bielecka, M.; Pencakowski, B.; Nicoletti, R. Using Next-Generation Sequencing Technology to Explore Genetic Pathways in Endophytic Fungi in the Syntheses of Plant Bioactive Metabolites. Agriculture 2022, 12, 187. [Google Scholar] [CrossRef]
- García-Campos, M.A.; Espinal-Enríquez, J.; Hernández-Lemus, E. Pathway Analysis: State of the Art. Front. Physiol. 2015, 6, 383. [Google Scholar] [CrossRef] [PubMed]
- Tan, G.; Liu, K.; Kang, J.; Zhang, Y.; Hu, L.; Li, C. Transcriptome Analysis of the Compatible Interaction of Tomato with Verticillium dahliae Using RNA-Sequencing. Front. Plant Sci. 2015, 6, 428. [Google Scholar] [CrossRef] [PubMed]
- Jhu, M.-Y.; Farhi, M.; Wang, L.; Zumstein, K.; Sinha, N.R. Investigating Host and Parasitic Plant Interaction by Tissue-Specific Gene Analyses on Tomato and Cuscuta campestris Interface at Three Haustorial Developmental Stages. Front. Plant Sci. 2022, 12, 764843. [Google Scholar] [CrossRef] [PubMed]
- Eshed, Y.; Zamir, D. An Introgression Line Population of Lycopersicon pennellii in the Cultivated Tomato Enables the Identification and Fine Mapping of Yield-Associated QTL. Genetics 1995, 141, 1147–1162. [Google Scholar] [CrossRef] [PubMed]
- Bai, J.; Wei, Q.; Shu, J.; Gan, Z.; Li, B.; Yan, D.; Huang, Z.; Guo, Y.; Wang, X.; Zhang, L.; et al. Exploration of Resistance to Phelipanche aegyptiaca in Tomato. Pest Manag. Sci. 2020, 76, 3806–3821. [Google Scholar] [CrossRef]
- Yan, Y.-S.; Chen, X.-Y.; Yang, K.; Sun, Z.-X.; Fu, Y.-P.; Zhang, Y.-M.; Fang, R.-X. Overexpression of an F-Box Protein Gene Reduces Abiotic Stress Tolerance and Promotes Root Growth in Rice. Mol. Plant 2011, 4, 190–197. [Google Scholar] [CrossRef]
- Misra, V.A.; Wafula, E.K.; Wang, Y.; de Pamphilis, C.W.; Timko, M.P. Genome-Wide Identification of MST, SUT and SWEET Family Sugar Transporters in Root Parasitic Angiosperms and Analysis of Their Expression during Host Parasitism. BMC Plant Biol. 2019, 19, 196. [Google Scholar] [CrossRef]
- Asakura, H.; Yamakawa, T.; Tamura, T.; Ueda, R.; Taira, S.; Saito, Y.; Abe, K.; Asakura, T. Transcriptomic and Metabolomic Analyses Provide Insights into the Upregulation of Fatty Acid and Phospholipid Metabolism in Tomato Fruit under Drought Stress. J. Agric. Food Chem. 2021, 69, 2894–2905. [Google Scholar] [CrossRef] [PubMed]
- Babraham Bioinformatics—FastQC A Quality Control Tool for High Throughput Sequence Data. Available online: https://www.bioinformatics.babraham.ac.uk/projects/fastqc/ (accessed on 10 January 2024).
- Martin, M. Cutadapt Removes Adapter Sequences from High-Throughput Sequencing Reads. EMBnet J. 2011, 17, 10–12. [Google Scholar] [CrossRef]
- Dobin, A.; Davis, C.A.; Schlesinger, F.; Drenkow, J.; Zaleski, C.; Jha, S.; Batut, P.; Chaisson, M.; Gingeras, T.R. STAR: Ultrafast Universal RNA-Seq Aligner. Bioinformatics 2013, 29, 15–21. [Google Scholar] [CrossRef] [PubMed]
- RSEM: Accurate Transcript Quantification from RNA-Seq Data with or without a Reference Genome | BMC Bioinformatics. Available online: https://link.springer.com/article/10.1186/1471-2105-12-323 (accessed on 23 January 2024).
- Szymański, J.; Bocobza, S.; Panda, S.; Sonawane, P.; Cárdenas, P.D.; Lashbrooke, J.; Kamble, A.; Shahaf, N.; Meir, S.; Bovy, A.; et al. Analysis of Wild Tomato Introgression Lines Elucidates the Genetic Basis of Transcriptome and Metabolome Variation Underlying Fruit Traits and Pathogen Response. Nat. Genet. 2020, 52, 1111–1121. [Google Scholar] [CrossRef]
- Robinson, M.D.; McCarthy, D.J.; Smyth, G.K. edgeR: A Bioconductor Package for Differential Expression Analysis of Digital Gene Expression Data. Bioinformatics 2010, 26, 139–140. [Google Scholar] [CrossRef]
- Benjamini, Y.; Hochberg, Y. Controlling the False Discovery Rate: A Practical and Powerful Approach to Multiple Testing. J. R. Stat. Soc. Ser. B (Methodol.) 1995, 57, 289–300. [Google Scholar] [CrossRef]
- Ritchie, M.E.; Phipson, B.; Wu, D.; Hu, Y.; Law, C.W.; Shi, W.; Smyth, G.K. Limma Powers Differential Expression Analyses for RNA-Sequencing and Microarray Studies. Nucleic Acids Res. 2015, 43, e47. [Google Scholar] [CrossRef] [PubMed]
- Wilkinson, L. Ggplot2: Elegant Graphics for Data Analysis by WICKHAM, H. Biometrics 2011, 67, 678–679. [Google Scholar] [CrossRef]
- Kassambara, A. Ggpubr: “ggplot2” Based Publication Ready Plots 2023. Available online: https://www.mdpi.com/authors/references (accessed on 13 February 2024).
- Warnes, G.R.; Bolker, B.; Bonebakker, L.; Gentleman, R.; Huber, W.; Liaw, A.; Lumley, T.; Maechler, M.; Magnusson, A.; Moeller, S.; et al. Gplots: Various R Programming Tools for Plotting Data 2024. Available online: https://CRAN.R-project.org/package=gplots (accessed on 14 February 2024).
- Auguie, B.; Antonov, A. gridExtra: Miscellaneous Functions for “Grid” Graphics 2017. 2017. Available online: https://CRAN.R-project.org/package=gridExtra (accessed on 14 February 2024).
- VennDiagram: A Package for the Generation of Highly-Customizable Venn and Euler Diagrams in R|BMC Bioinformatics | Full Text. Available online: https://bmcbioinformatics.biomedcentral.com/articles/10.1186/1471-2105-12-35 (accessed on 15 February 2024).
- Livak, K.J.; Schmittgen, T.D. Analysis of Relative Gene Expression Data Using Real-Time Quantitative PCR and the 2−ΔΔCT Method. Methods 2001, 25, 402–408. [Google Scholar] [CrossRef]
- Barker, E.R.; Press, M.C.; Scholes, J.D.; Quick, W.P. Interactions between the Parasitic Angiosperm Orobanche aegyptiaca and Its Tomato Host: Growth and Biomass Allocation. New Phytol. 1996, 133, 637–642. [Google Scholar] [CrossRef]
- Kanehisa, M.; Goto, S. KEGG: Kyoto Encyclopedia of Genes and Genomes. Nucleic Acids Res. 2000, 28, 27–30. [Google Scholar] [CrossRef] [PubMed]
- Albert, M.; Axtell, M.J.; Timko, M.P. Mechanisms of Resistance and Virulence in Parasitic Plant–Host Interactions. Plant Physiol. 2021, 185, 1282–1291. [Google Scholar] [CrossRef] [PubMed]
- Julio, E.; Malpica, A.; Cotucheau, J.; Bachet, S.; Volpatti, R.; Decorps, C.; Dorlhac de Borne, F. RNA-Seq Analysis of Orobanche Resistance in Nicotiana tabacum: Development of Molecular Markers for Breeding Recessive Tolerance from ‘Wika’ Tobacco Variety. Euphytica 2019, 216, 6. [Google Scholar] [CrossRef]
- Yang, C.; Fu, F.; Zhang, N.; Wang, J.; Hu, L.; Islam, F.; Bai, Q.; Yun, X.; Zhou, W. Transcriptional Profiling of Underground Interaction of Two Contrasting Sunflower Cultivars with the Root Parasitic Weed Orobanche cumana. Plant Soil 2020, 450, 303–321. [Google Scholar] [CrossRef]
- Zhao, Y.; Bi, K.; Gao, Z.; Chen, T.; Liu, H.; Xie, J.; Cheng, J.; Fu, Y.; Jiang, D. Transcriptome Analysis of Arabidopsis thaliana in Response to Plasmodiophora brassicae during Early Infection. Front. Microbiol. 2017, 8, 673. [Google Scholar] [CrossRef]
- Uluisik, S.; Oney-Birol, S. Uncovering Candidate Genes Involved in Postharvest Ripening of Tomato Using the Solanum pennellii Introgression Line Population by Integrating Phenotypic Data, RNA-Seq, and SNP Analyses. Sci. Hortic. 2021, 288, 110321. [Google Scholar] [CrossRef]
- Yao, Z.; Tian, F.; Cao, X.; Xu, Y.; Chen, M.; Xiang, B.; Zhao, S. Global Transcriptomic Analysis Reveals the Mechanism of Phelipanche aegyptiaca Seed Germination. Int. J. Mol. Sci. 2016, 17, 1139. [Google Scholar] [CrossRef] [PubMed]
- Zhao, T.; Xu, X. Genome-Wide Analyses of the Genetic Screening of C2H2-Type Zinc Finger Transcription Factors and Abiotic and Biotic Stress Responses in Tomato (Solanum lycopersicum) Based on RNA-Seq Data. Front. Genet. 2020, 11, 540. [Google Scholar] [CrossRef] [PubMed]
- Fernández-Aparicio, M.; Kisugi, T.; Xie, X.; Rubiales, D.; Yoneyama, K. Low Strigolactone Root Exudation: A Novel Mechanism of Broomrape (Orobanche and Phelipanche Spp.) Resistance Available for Faba Bean Breeding. J. Agric. Food Chem. 2014, 62, 7063–7071. [Google Scholar] [CrossRef]
- Bouwmeester, H.; Li, C.; Thiombiano, B.; Rahimi, M.; Dong, L. Adaptation of the Parasitic Plant Lifecycle: Germination Is Controlled by Essential Host Signaling Molecules. Plant Physiol. 2021, 185, 1292–1308. [Google Scholar] [CrossRef]
- Huang, Q.; Lei, Z.; Xiang, L.; Zhang, W.; Zhang, L.; Gao, Y. Transcriptomic Analysis of Sunflower (Helianthus annuus) Roots Resistance to Orobanche cumana at the Seedling Stage. Horticulturae 2022, 8, 701. [Google Scholar] [CrossRef]
- Wallis, J.G.; Watts, J.L.; Browse, J. Polyunsaturated Fatty Acid Synthesis: What Will They Think of Next? Trends Biochem. Sci. 2002, 27, 467–473. [Google Scholar] [CrossRef] [PubMed]
- Shi, Y.; Yue, X.; An, L. Integrated Regulation Triggered by a Cryophyte ω-3 Desaturase Gene Confers Multiple-Stress Tolerance in Tobacco. J. Exp. Bot. 2018, 69, 2131–2148. [Google Scholar] [CrossRef]
- Hirano, T.; Matsuzawa, T.; Takegawa, K.; Sato, M.H. Loss-of-Function and Gain-of-Function Mutations in FAB1A/B Impair Endomembrane Homeostasis, Conferring Pleiotropic Developmental Abnormalities in Arabidopsis. Plant Physiol. 2011, 155, 797–807. [Google Scholar] [CrossRef] [PubMed]
- Shaheen, N.; Khan, U.M.; Farooq, A.; Zafar, U.B.; Khan, S.H.; Ahmad, S.; Azhar, M.T.; Atif, R.M.; Rana, I.A.; Seo, H. Comparative Transcriptomic and Evolutionary Analysis of FAD-like Genes of Brassica Species Revealed Their Role in Fatty Acid Biosynthesis and Stress Tolerance. BMC Plant Biol. 2023, 23, 250. [Google Scholar] [CrossRef]
- Han, Y.; Lu, M.; Yue, S.; Li, K.; Dong, M.; Liu, L.; Wang, H.; Shang, F. Comparative Methylomics and Chromatin Accessibility Analysis in Osmanthus fragrans Uncovers Regulation of Genic Transcription and Mechanisms of Key Floral Scent Production. Hortic. Res. 2022, 9, uhac096. [Google Scholar] [CrossRef]
- Li, J.; Li, X.; Han, P.; Liu, H.; Gong, J.; Zhou, W.; Shi, B.; Liu, A.; Xu, L. Genome-Wide Investigation of bHLH Genes and Expression Analysis under Different Biotic and Abiotic Stresses in Helianthus annuus L. Int. J. Biol. Macromol. 2021, 189, 72–83. [Google Scholar] [CrossRef]
- Jiang, L.; Tian, X.; Li, S.; Fu, Y.; Xu, J.; Wang, G. The AabHLH35 Transcription Factor Identified from Anthurium andraeanum Is Involved in Cold and Drought Tolerance. Plants 2019, 8, 216. [Google Scholar] [CrossRef]
- Mo, F.; Zhang, N.; Qiu, Y.; Meng, L.; Cheng, M.; Liu, J.; Yao, L.; Lv, R.; Liu, Y.; Zhang, Y.; et al. Molecular Characterization, Gene Evolution and Expression Analysis of the F-Box Gene Family in Tomato (Solanum lycopersicum). Genes 2021, 12, 417. [Google Scholar] [CrossRef]
- Sadanandom, A.; Bailey, M.; Ewan, R.; Lee, J.; Nelis, S. The Ubiquitin–Proteasome System: Central Modifier of Plant Signalling. New Phytol. 2012, 196, 13–28. [Google Scholar] [CrossRef]
- Guo, H.; Ecker, J.R. Plant Responses to Ethylene Gas Are Mediated by SCFEBF1/EBF2-Dependent Proteolysis of EIN3 Transcription Factor. Cell 2003, 115, 667–677. [Google Scholar] [CrossRef] [PubMed]
- Sasaki, A.; Itoh, H.; Gomi, K.; Ueguchi-Tanaka, M.; Ishiyama, K.; Kobayashi, M.; Jeong, D.-H.; An, G.; Kitano, H.; Ashikari, M.; et al. Accumulation of Phosphorylated Repressor for Gibberellin Signaling in an F-Box Mutant. Science 2003, 299, 1896–1898. [Google Scholar] [CrossRef] [PubMed]
- Kepinski, S.; Leyser, O. The Arabidopsis F-Box Protein TIR1 Is an Auxin Receptor. Nature 2005, 435, 446–451. [Google Scholar] [CrossRef]
- Piisilä, M.; Keceli, M.A.; Brader, G.; Jakobson, L.; Jõesaar, I.; Sipari, N.; Kollist, H.; Palva, E.T.; Kariola, T. The F-Box Protein MAX2 Contributes to Resistance to Bacterial Phytopathogens in Arabidopsis thaliana. BMC Plant Biol. 2015, 15, 53. [Google Scholar] [CrossRef] [PubMed]
- Bai, Y.; Pavan, S.; Zheng, Z.; Zappel, N.F.; Reinstädler, A.; Lotti, C.; De Giovanni, C.; Ricciardi, L.; Lindhout, P.; Visser, R.; et al. Naturally Occurring Broad-Spectrum Powdery Mildew Resistance in a Central American Tomato Accession Is Caused by Loss of Mlo Function. Mol. Plant-Microbe Interact. 2008, 21, 30–39. [Google Scholar] [CrossRef] [PubMed]
- Kusch, S.; Panstruga, R. Mlo-Based Resistance: An Apparently Universal “Weapon” to Defeat Powdery Mildew Disease. Mol. Plant-Microbe Interact. 2017, 30, 179–189. [Google Scholar] [CrossRef]
- Takayama, M.; Koike, S.; Kusano, M.; Matsukura, C.; Saito, K.; Ariizumi, T.; Ezura, H. Tomato Glutamate Decarboxylase Genes SlGAD2 and SlGAD3 Play Key Roles in Regulating γ-Aminobutyric Acid Levels in Tomato (Solanum lycopersicum). Plant Cell Physiol. 2015, 56, 1533–1545. [Google Scholar] [CrossRef]
- Kim, M.C.; Chung, W.S.; Yun, D.-J.; Cho, M.J. Calcium and Calmodulin-Mediated Regulation of Gene Expression in Plants. Mol. Plant 2009, 2, 13–21. [Google Scholar] [CrossRef]
- Rajani, M.S.; Bedair, M.F.; Li, H.; Duff, S.M.G. Phenotypic Effects from the Expression of a Deregulated AtGAD1 Transgene and GABA Pathway Suppression Mutants in Maize. PLoS ONE 2021, 16, e0259365. [Google Scholar] [CrossRef]
- Pinosa, F.; Buhot, N.; Kwaaitaal, M.; Fahlberg, P.; Thordal-Christensen, H.; Ellerström, M.; Andersson, M.X. Arabidopsis Phospholipase Dδ Is Involved in Basal Defense and Nonhost Resistance to Powdery Mildew Fungi. Plant Physiol. 2013, 163, 896–906. [Google Scholar] [CrossRef]
- Seong, S.Y.; Shim, J.S.; Bang, S.W.; Kim, J.-K. Overexpression of OsC3H10, a CCCH-Zinc Finger, Improves Drought Tolerance in Rice by Regulating Stress-Related Genes. Plants 2020, 9, 1298. [Google Scholar] [CrossRef] [PubMed]
- Chicco, D.; Agapito, G. Nine Quick Tips for Pathway Enrichment Analysis. PLoS Comput. Biol. 2022, 18, e1010348. [Google Scholar] [CrossRef] [PubMed]
- Dai, Q.; Geng, L.; Lu, M.; Jin, W.; Nan, X.; He, P.; Yao, Y. Comparative Transcriptome Analysis of the Different Tissues between the Cultivated and Wild Tomato. PLoS ONE 2017, 12, e0172411. [Google Scholar] [CrossRef]
- Wang, H.; Zhou, P.; Zhu, W.; Wang, F. De Novo Comparative Transcriptome Analysis of Genes Differentially Expressed in the Scion of Homografted and Heterografted Tomato Seedlings. Sci. Rep. 2019, 9, 20240. [Google Scholar] [CrossRef] [PubMed]
- Ashapkin, V.V.; Kutueva, L.I.; Aleksandrushkina, N.I.; Vanyushin, B.F.; Teofanova, D.R.; Zagorchev, L.I. Genomic and Epigenomic Mechanisms of the Interaction between Parasitic and Host Plants. Int. J. Mol. Sci. 2023, 24, 2647. [Google Scholar] [CrossRef] [PubMed]
- Irafaha, G.; Mutinda, S.; Mobegi, F.; Hale, B.; Omwenga, G.; Wijeratne, A.J.; Wicke, S.; Bellis, E.S.; Runo, S. A Transcriptome Atlas of Striga hermonthica Germination: Implications for Managing An Intractable Parasitic Plant. Plants People Planet 2022. [Google Scholar] [CrossRef]


| NCBI Gene Description | Gene Names in This Manuscript | GeneIDs | SolycIDS |
|---|---|---|---|
| omega-3 fatty acid desaturase, chloroplastic (FAD) | OFA | LOC107023114 | Solyc06g051400 |
| transcription factor bHLH35 (bHLH) | BHLH35 | LOC107024383 | Solyc07g018010 |
| 1-phosphatidylinositol-3-phosphate 5-kinase FAB1B-like (FAB) | FAB1B | LOC101246905 | Solyc03g123570 |
| F-box protein At1g78280 (F-box) | F-BOX | LOC107017080 | Solyc04g074490 |
| glutamate decarboxylase 4 (GAD) | GLDE | LOC107016348 | Solyc04g025530 |
| MLO-like protein 9 | MLO | LOC101254181 | Solyc02g038806 |
| phospholipase D gamma 1-like (PLD) | PPDG | LOC107007945 | Solyc01g091910 |
| zinc finger CCCH domain-containing protein 32 (ZFP) | ZINC | LOC101250699 | Solyc06g008740 |
| CaM2 calmodulin 2 | CaM2 | SlCaM2 | Solyc10g081170 |
| ATP-citrate synthase beta chain protein 2-like | ACLA2 | LOC107007996 | Solyc01g059880 |
| alpha/beta-hydrolase DWARF14-like | D14 | LOC101259838 | Solyc02g092770 |
| GABA-TP3 gamma-aminobutyrate transaminase subunit precursor isozyme 3 | GABA | GABA-TP3 | Solyc12g006450 |
| phytoene synthase 1 | PSY | LOC107014634 | Solyc03g031860 |
| zinc finger protein ZPR1-like | ZPR1 | LOC101251441 | Solyc02g069120 |
| Gene Name | NCBI ID | SolycID | Pathway Name | Species | Significant Pathway Found |
|---|---|---|---|---|---|
| FAB1B | LOC101246905 | Solyc03g123570 | Inositol phosphate metabolism | S. lycopersicum | - |
| GLDE | LOC107016348 | Solyc04g025530 | Alanine, aspartate, and glutamate metabolism | S. pennelli | IL6-2_penn, IL6-3_penn |
| PPDG | LOC107007945 | Solyc01g091910 | Glycerophospholipid metabolism | S. pennelli | IL6-2_merged, IL6-3_merged |
| CaM2 | SlCaM2 | Solyc10g081170 | MAPK signaling pathway–plant | S. lycopersicum | IL6-2_merged, IL6-3_merged |
Disclaimer/Publisher’s Note: The statements, opinions and data contained in all publications are solely those of the individual author(s) and contributor(s) and not of MDPI and/or the editor(s). MDPI and/or the editor(s) disclaim responsibility for any injury to people or property resulting from any ideas, methods, instructions or products referred to in the content. |
© 2024 by the authors. Licensee MDPI, Basel, Switzerland. This article is an open access article distributed under the terms and conditions of the Creative Commons Attribution (CC BY) license (https://creativecommons.org/licenses/by/4.0/).
Share and Cite
Gerakari, M.; Kotsira, V.; Kapazoglou, A.; Tastsoglou, S.; Katsileros, A.; Chachalis, D.; Hatzigeorgiou, A.G.; Tani, E. Transcriptomic Approach for Investigation of Solanum spp. Resistance upon Early-Stage Broomrape Parasitism. Curr. Issues Mol. Biol. 2024, 46, 9047-9073. https://doi.org/10.3390/cimb46080535
Gerakari M, Kotsira V, Kapazoglou A, Tastsoglou S, Katsileros A, Chachalis D, Hatzigeorgiou AG, Tani E. Transcriptomic Approach for Investigation of Solanum spp. Resistance upon Early-Stage Broomrape Parasitism. Current Issues in Molecular Biology. 2024; 46(8):9047-9073. https://doi.org/10.3390/cimb46080535
Chicago/Turabian StyleGerakari, Maria, Vasiliki Kotsira, Aliki Kapazoglou, Spyros Tastsoglou, Anastasios Katsileros, Demosthenis Chachalis, Artemis G. Hatzigeorgiou, and Eleni Tani. 2024. "Transcriptomic Approach for Investigation of Solanum spp. Resistance upon Early-Stage Broomrape Parasitism" Current Issues in Molecular Biology 46, no. 8: 9047-9073. https://doi.org/10.3390/cimb46080535