
Genetics and Traumatic Brain Injury: Findings from an Exome-Based Study of a 50-Patient Case Series

 ,
,  ,
,  , and
, and
Abstract
1. Introduction
2. Materials and Methods
2.1. Participants
2.2. Exome Sequencing and Variant Calling
2.3. Variant Annotation
2.4. Data Analysis
3. Results
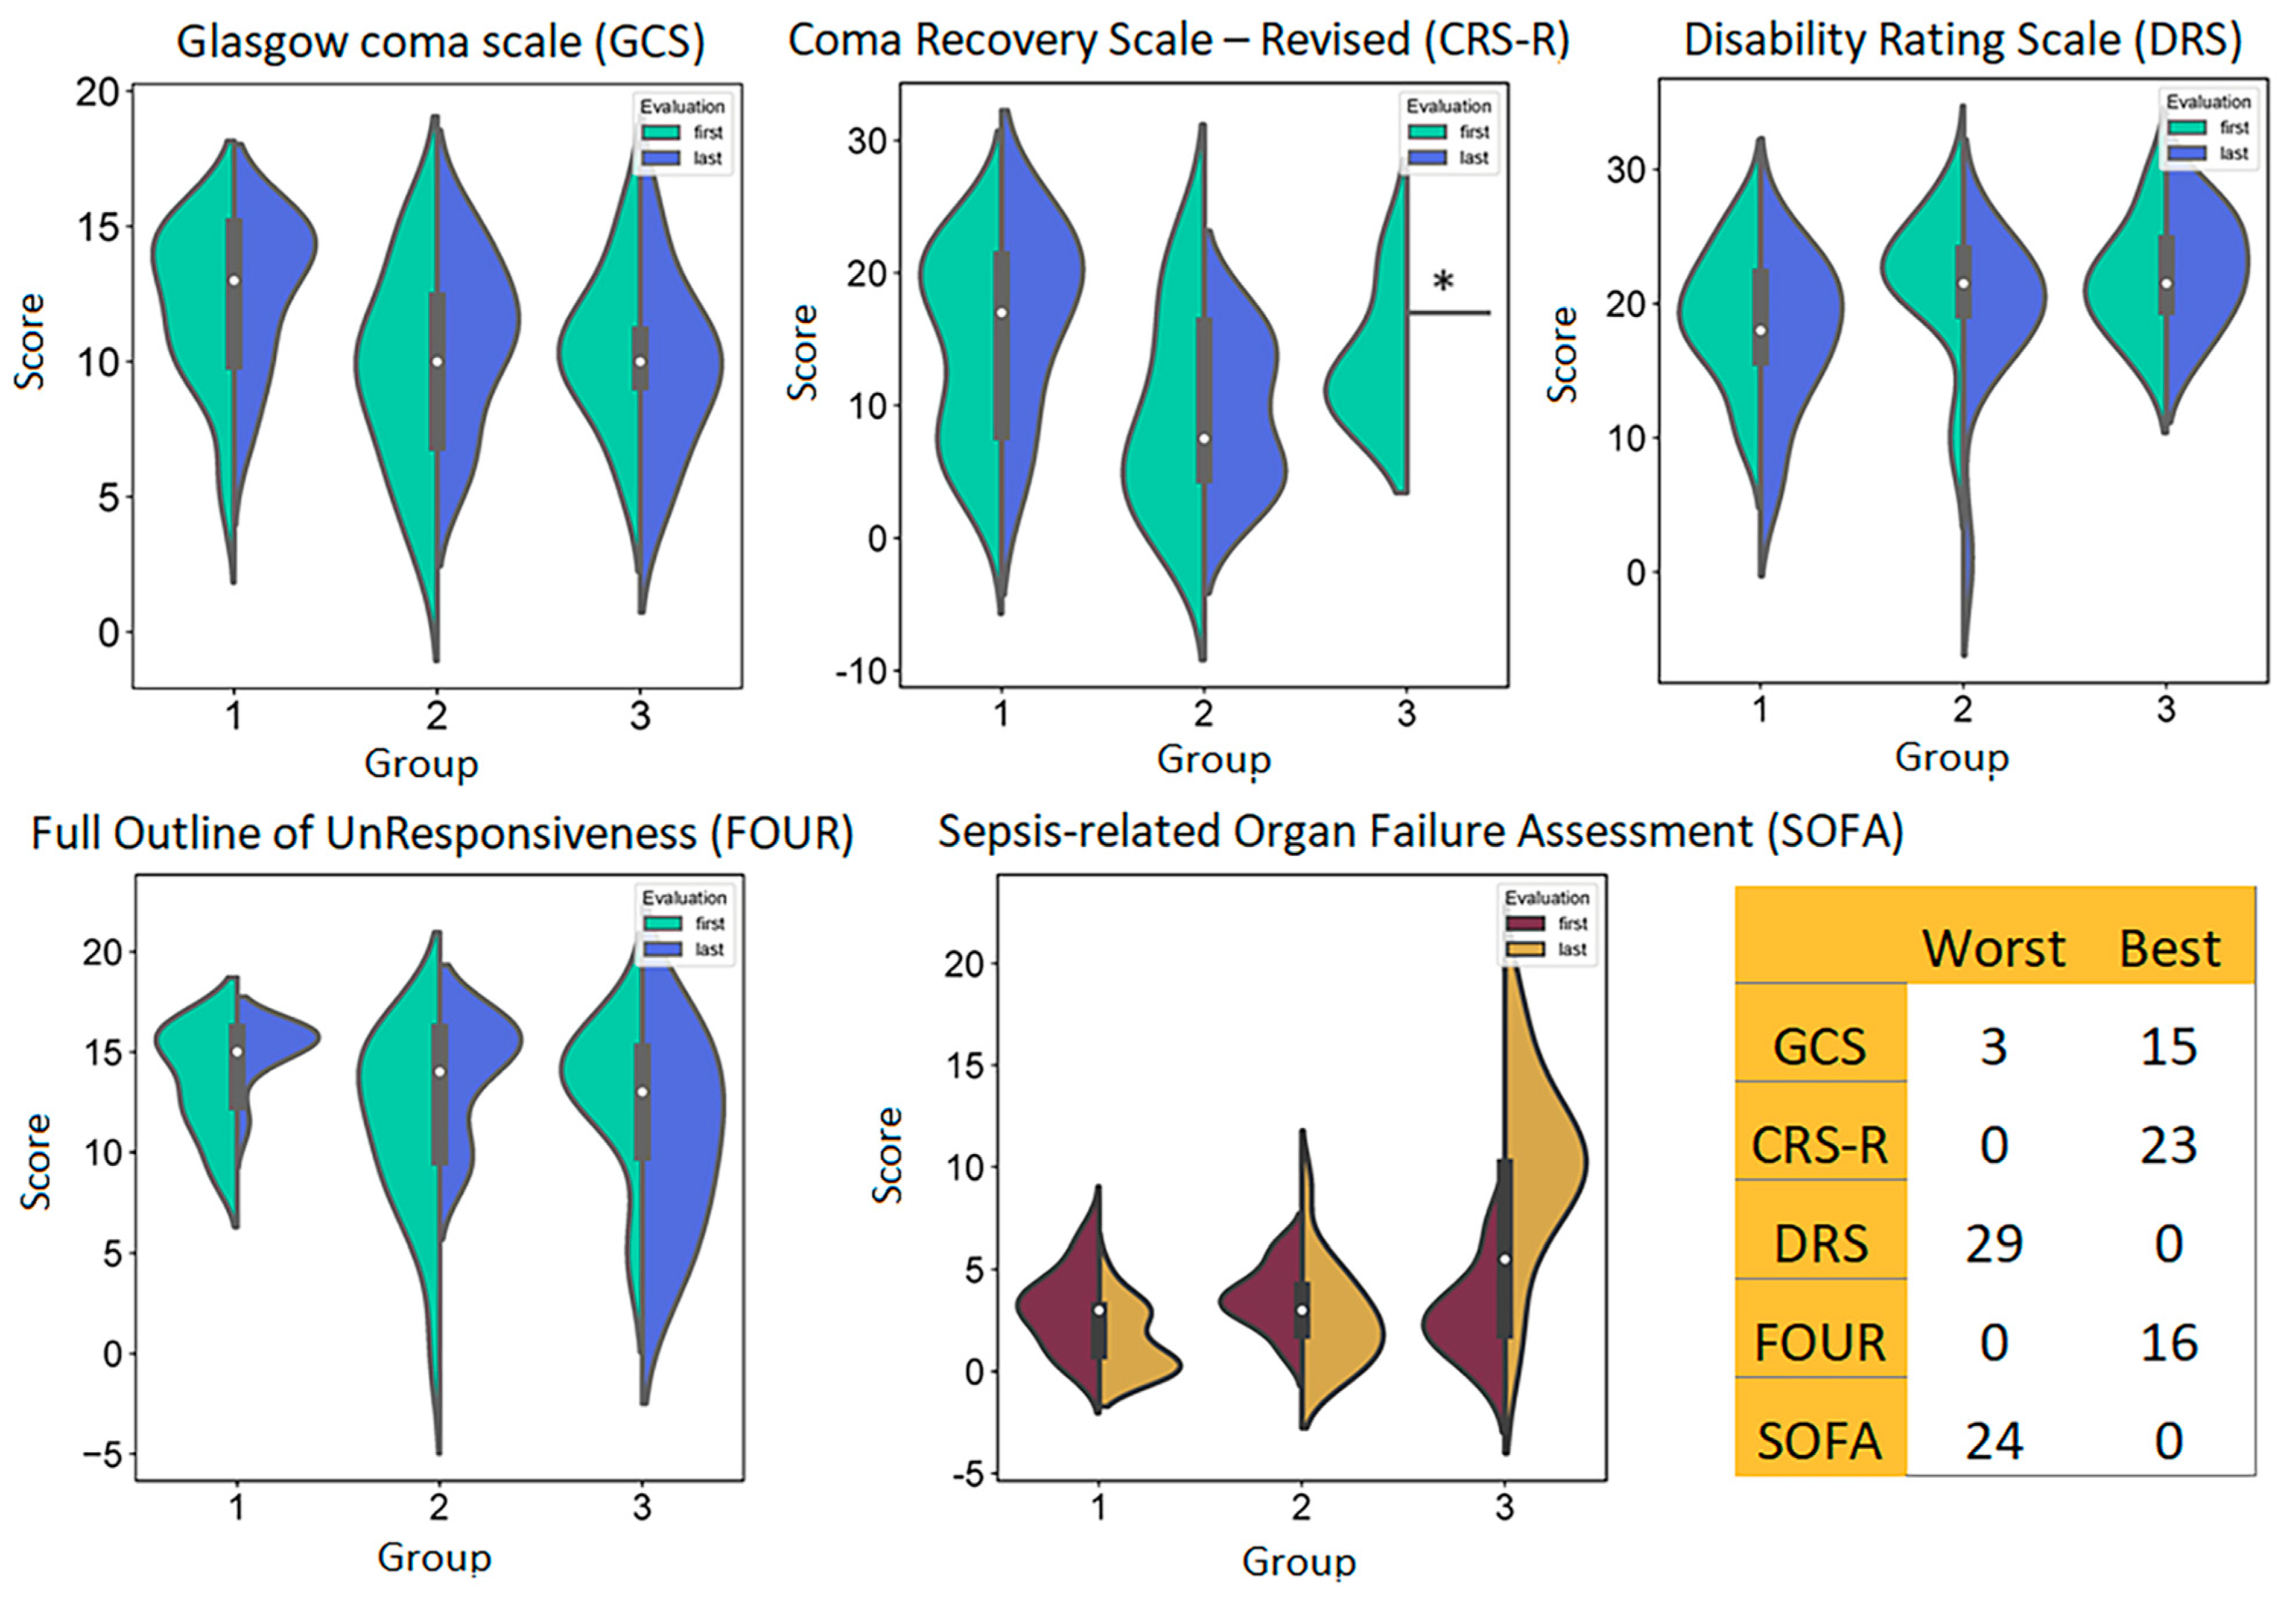
3.1. Patients
3.2. Genetic Landscape Overview
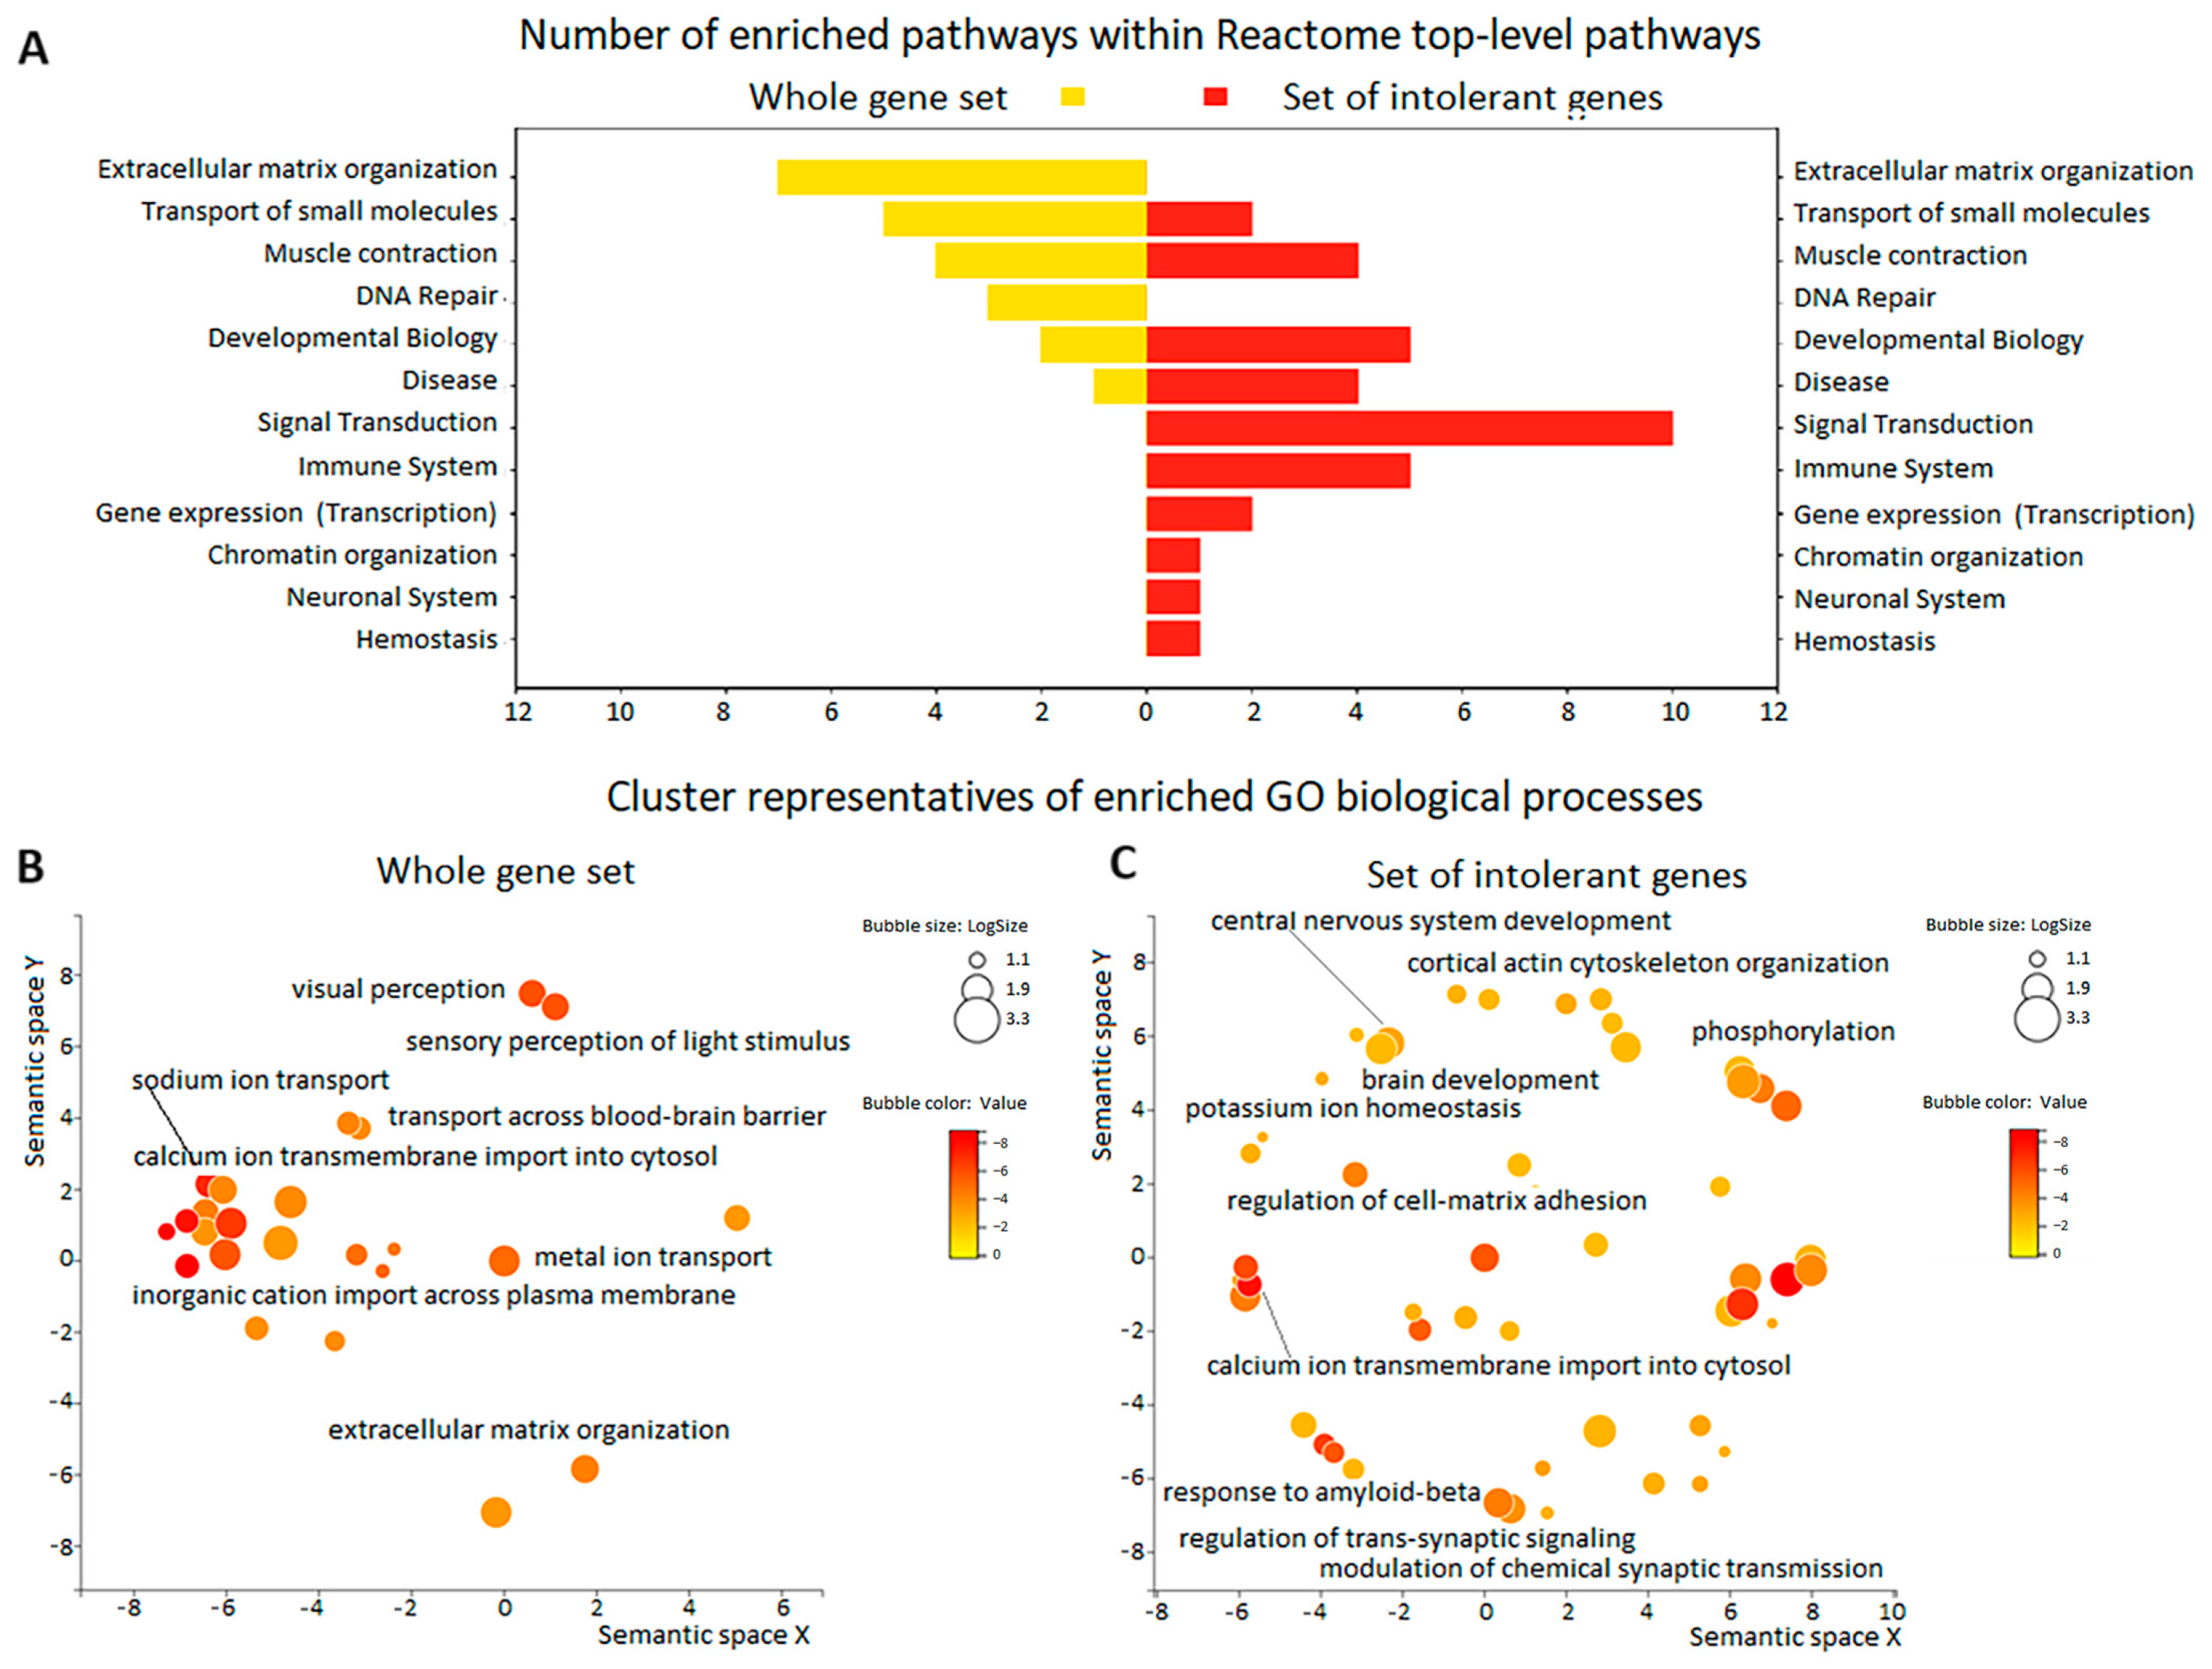
3.3. Enrichment Analysis of Gene Function in the Whole Series of 50 TBI Patients
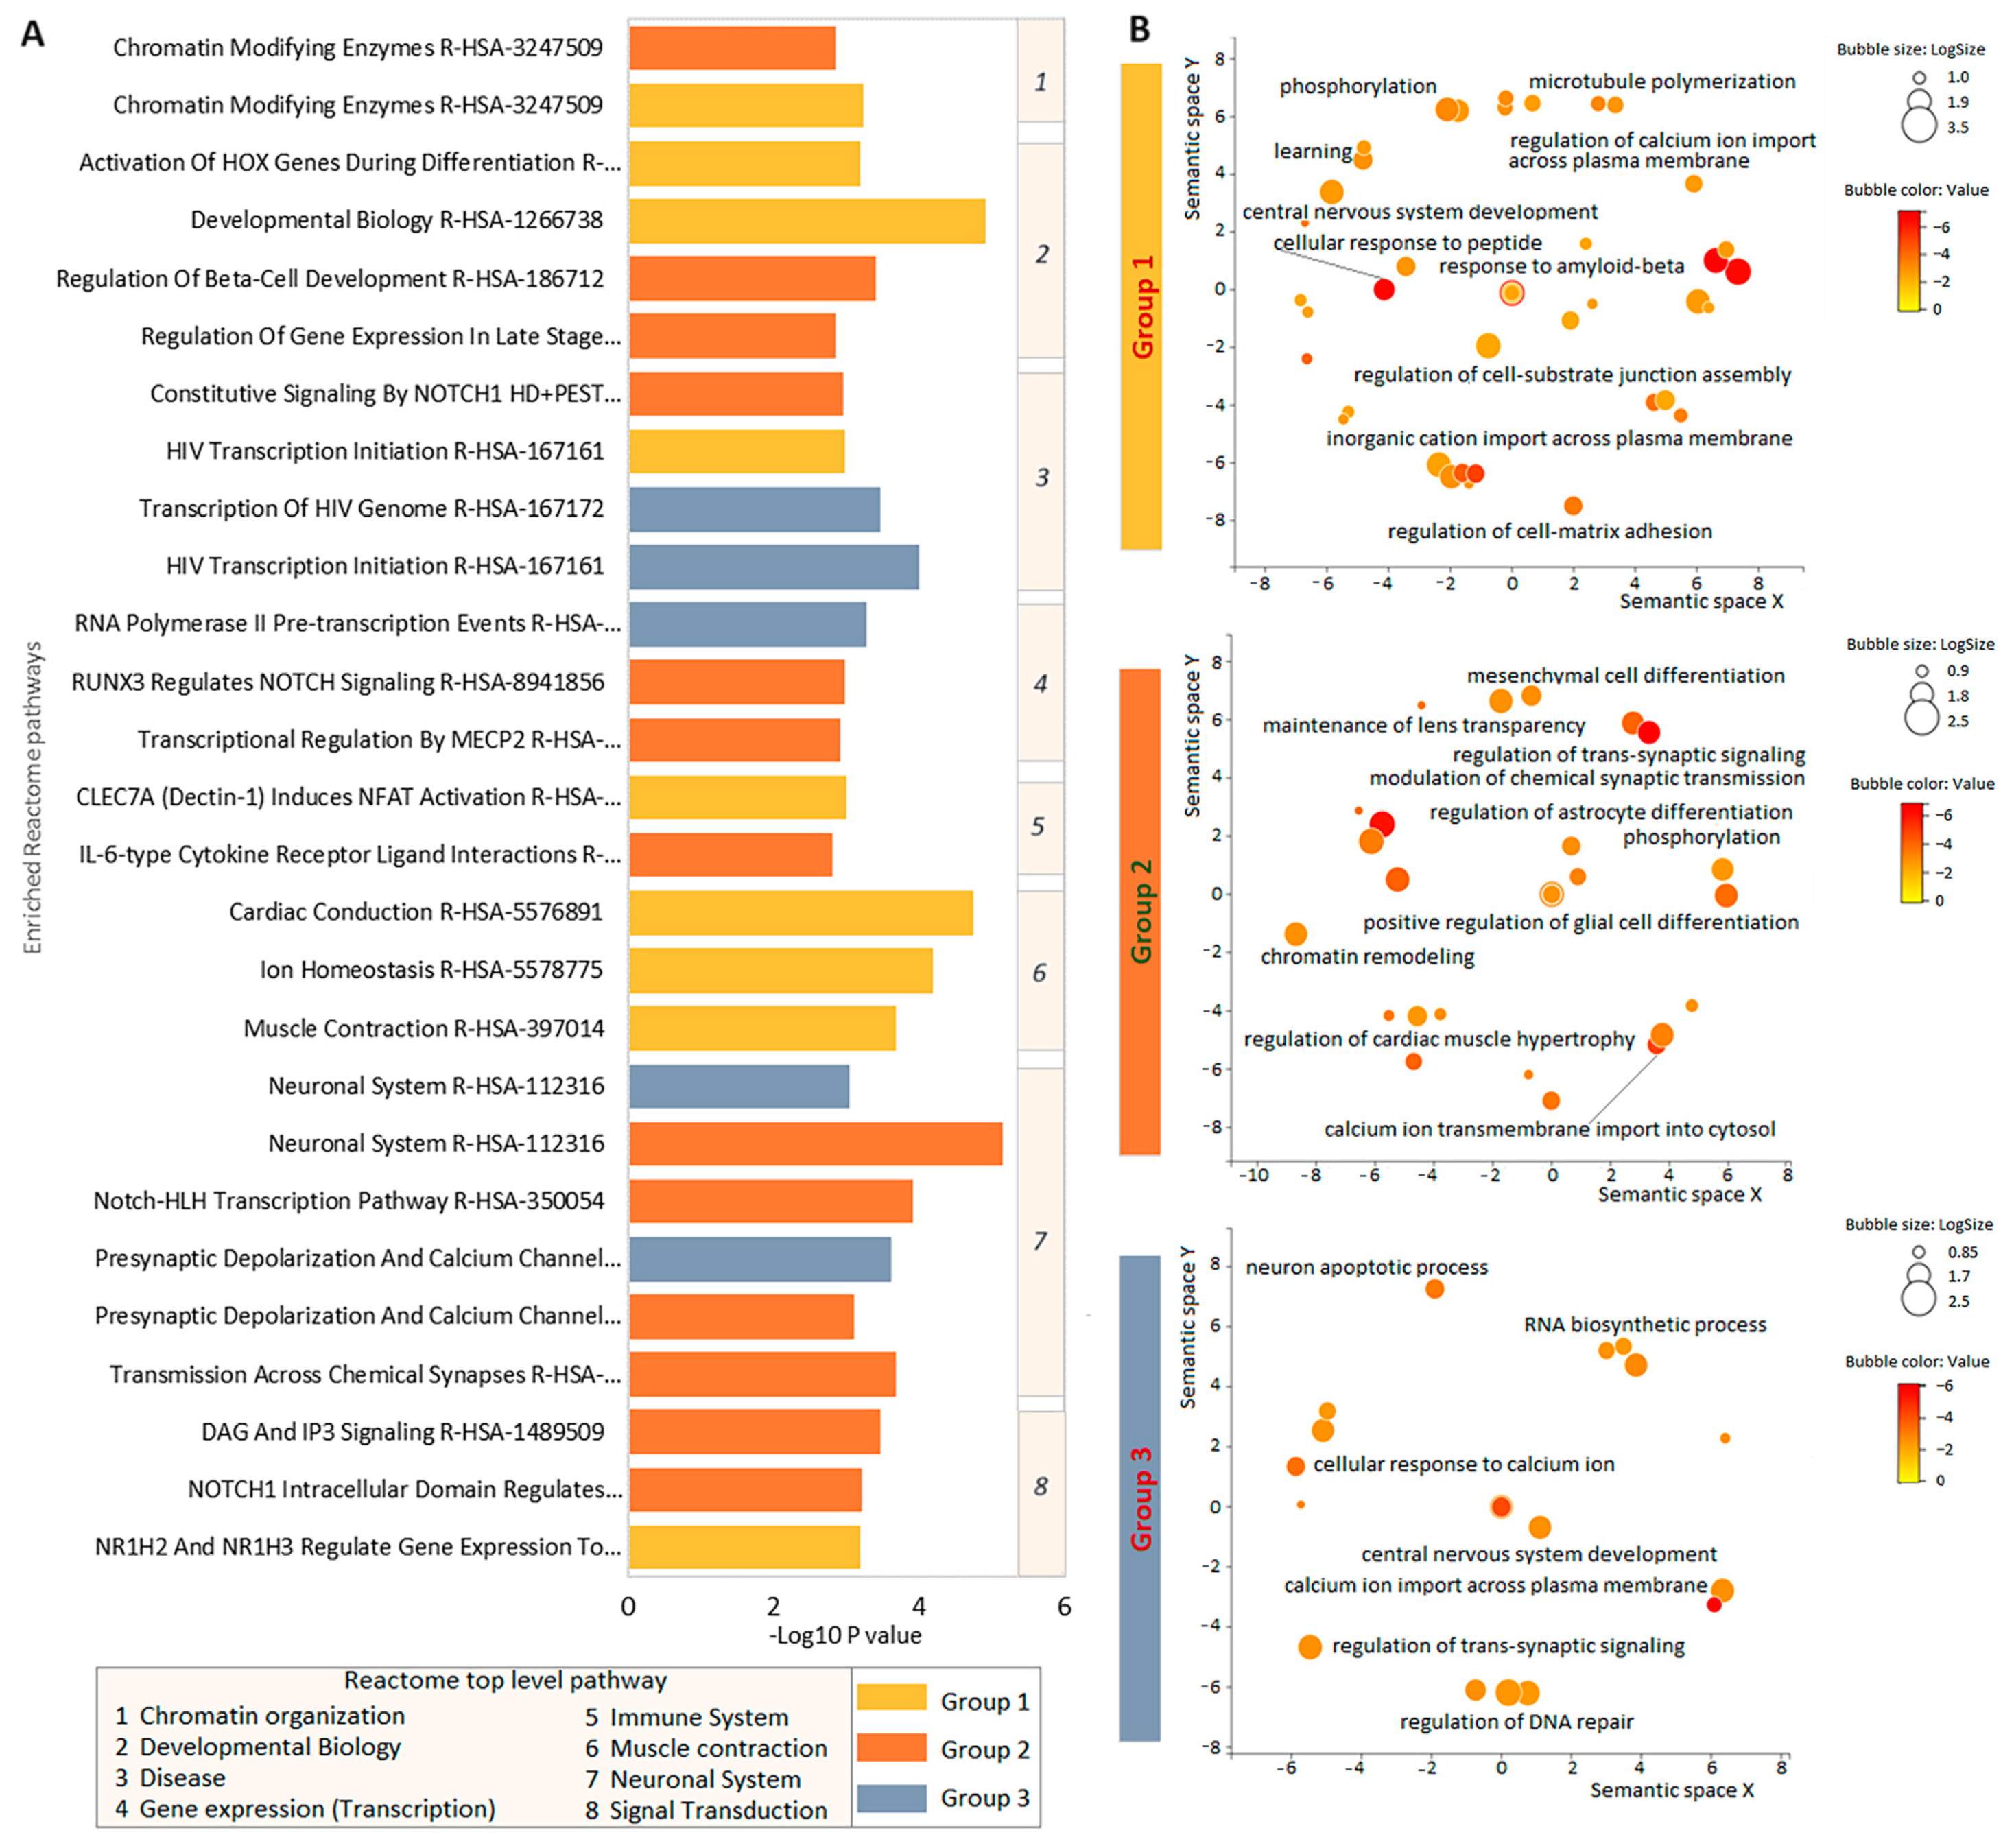
3.4. Enrichment Analysis of Intolerant Gene Function in the Three Groups of Patients with TBI
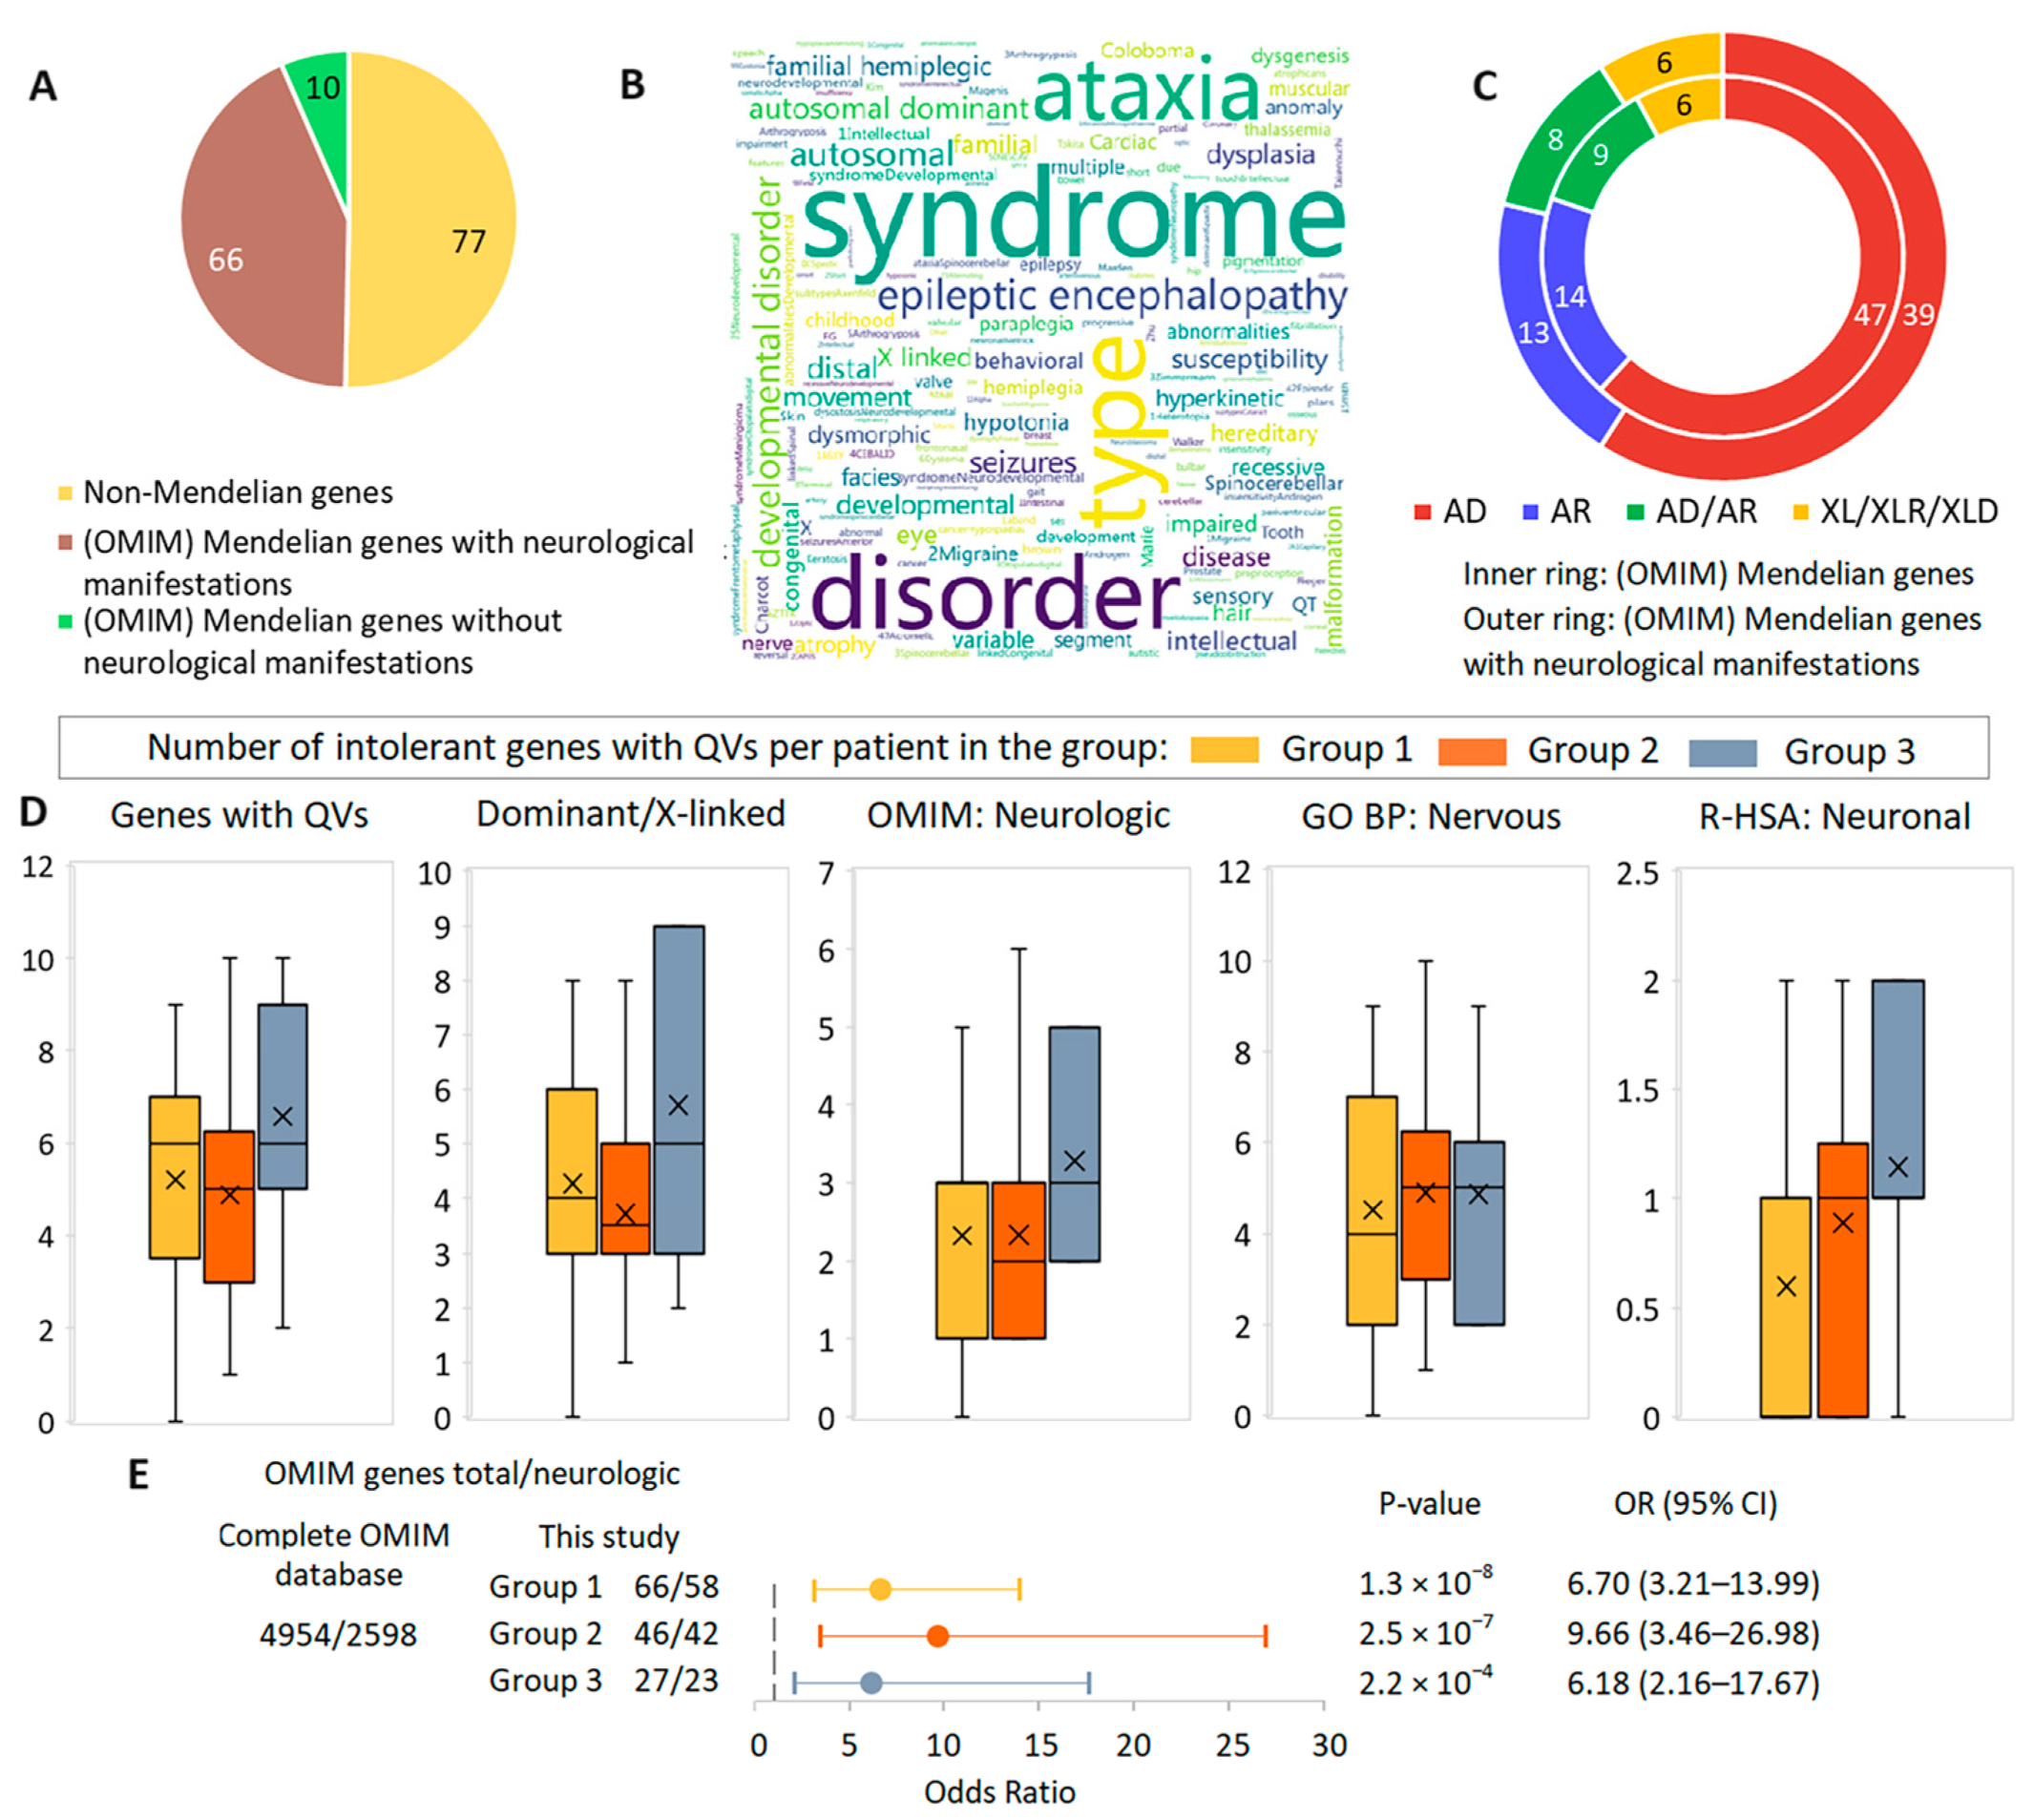
3.5. Gene-Based Synopsis
3.6. Comparative Analysis of the Role of Rare Potentially Pathogenic Variants in Intolerant Genes in Other Cohorts in the Context of TBI Case Series Findings
4. Discussion
5. Conclusions
Supplementary Materials
Author Contributions
Funding
Institutional Review Board Statement
Informed Consent Statement
Data Availability Statement
Conflicts of Interest
References
- GBD 2016 Traumatic Brain Injury and Spinal Cord Injury Collaborators. Global, regional, and national burden of traumatic brain injury and spinal cord injury, 1990–2016: A systematic analysis for the Global Burden of Disease Study 2016. Lancet Neurol. 2019, 18, 56–87. [Google Scholar]
- Dewan, M.C.; Rattani, A.; Gupta, S.; Baticulon, R.E.; Hung, Y.C.; Punchak, M.; Agrawal, A.; Adeleye, A.O.; Shrime, M.G.; Rubiano, A.M.; et al. Estimating the global incidence of traumatic brain injury. J. Neurosurg. 2018, 130, 1080–1097. [Google Scholar]
- Corrigan, J.D.; Hammond, F.M. Traumatic brain injury as a chronic health condition. Arch. Phys. Med. Rehabil. 2013, 94, 1199–1201. [Google Scholar]
- Dikmen, S.S.; Machamer, J.E.; Powell, J.M.; Temkin, N.R. Outcome 3 to 5 years after moderate to severe traumatic brain injury. Arch. Phys. Med. Rehabil. 2003, 84, 1449–1457. [Google Scholar] [PubMed]
- Kumar, R.G.; Ketchum, J.M.; Corrigan, J.D.; Hammond, F.M.; Sevigny, M.; Dams-O’Connor, K. The longitudinal effects of comorbid health burden on functional outcomes for adults with moderate to severe traumatic brain injury. J. Head Trauma Rehabil. 2020, 35, E372–E381. [Google Scholar]
- Sigurdardottir, S.; Andelic, N.; Røe, C.; Schanke, A.K. Trajectory of 10-year neurocognitive functioning after moderate-severe traumatic brain injury: Early associations and clinical application. J. Int. Neuropsychol. Soc. 2020, 26, 654–667. [Google Scholar] [PubMed]
- Claussnitzer, M.; Cho, J.H.; Collins, R.; Cox, N.J.; Dermitzakis, E.T.; Hurles, M.E.; Kathiresan, S.; Kenny, E.E.; Lindgren, C.M.; MacArthur, D.G.; et al. A brief history of human disease genetics. Nature 2020, 577, 179–189. [Google Scholar]
- Zeiler, F.A.; McFadyen, C.; Newcombe, V.F.J.; Synnot, A.; Donoghue, E.L.; Ripatti, S.; Steyerberg, E.W.; Gruen, R.L.; McAllister, T.W.; Rosand, J.; et al. Genetic Influences on Patient-Oriented Outcomes in Traumatic Brain Injury: A Living Systematic Review of Non-Apolipoprotein E Single-Nucleotide Polymorphisms. J. Neurotrauma 2021, 38, 1107–1123. [Google Scholar]
- Kals, M.; Kunzmann, K.; Parodi, L.; Radmanesh, F.; Wilson, L.; Izzy, S.; Anderson, C.D.; Puccio, A.M.; Okonkwo, D.O.; Temkin, N.; et al. A genome-wide association study of outcome from traumatic brain injury. eBioMedicine 2022, 77, 103933. [Google Scholar]
- Marchese, S.; Huckins, L.M. Trauma Matters: Integrating Genetic and Environmental Components of PTSD. Adv. Genet. 2022, 4, 2200017. [Google Scholar]
- Cortes, D.; Pera, M.F. The genetic basis of inter-individual variation in recovery from traumatic brain injury. NPJ Regen. Med. 2021, 6, 5. [Google Scholar] [PubMed]
- Ibrahim, O.; Sutherland, H.G.; Maksemous, N.; Smith, R.; Haupt, L.M.; Griffiths, L.R. Exploring Neuronal Vulnerability to Head Trauma Using a Whole Exome Approach. J. Neurotrauma 2020, 37, 1870–1879. [Google Scholar] [PubMed]
- Breslau, N.; Lucia, V.C.; Alvarado, G.F. Intelligence and other predisposing factors in exposure to trauma and posttraumatic stress disorder: A follow-up study at age 17 years. Arch. Gen. Psychiatry 2006, 63, 1238–1245. [Google Scholar]
- Plomin, R.; von Stumm, S. The new genetics of intelligence. Nat. Rev. Genet. 2018, 19, 148–159. [Google Scholar]
- Merritt, V.C.; Maihofer, A.X.; Gasperi, M.; Chanfreau-Coffinier, C.; Stein, M.B.; Panizzon, M.S.; Hauger, R.L.; Logue, M.W.; Delano-Wood, L.; Nievergelt, C.M. Genome-wide association study of traumatic brain injury in U.S. military veterans enrolled in the VA million veteran program. Mol. Psychiatry 2024, 29, 97–111. [Google Scholar]
- Fossella, J.; Sommer, T.; Fan, J.; Wu, Y.; Swanson, J.M.; Pfaff, D.W.; Posner, M.I. Assessing the molecular genetics of attention networks. BMC Neurosci. 2002, 3, 14. [Google Scholar]
- Davies, G.; Lam, M.; Harris, S.E.; Trampush, J.W.; Luciano, M.; Hill, W.D.; Hagenaars, S.P.; Ritchie, S.J.; Marioni, R.E.; Fawns-Ritchie, C.; et al. Study of 300,486 individuals identifies 148 independent genetic loci influencing general cognitive function. Nat. Commun. 2018, 9, 2098. [Google Scholar]
- Mountford, H.S.; Hill, A.; Barnett, A.L.; Newbury, D.F. Genome-Wide Association Study of Motor Coordination. Front. Hum. Neurosci. 2021, 15, 669902. [Google Scholar]
- Wainschtein, P.; Jain, D.; Zheng, Z.; TOPMed Anthropometry Working Group; NHLBI Trans-Omics for Precision Medicine (TOPMed) Consortium; Cupples, L.A.; Shadyab, A.H.; McKnight, B.; Shoemaker, B.M.; Mitchell, B.D.; et al. Assessing the contribution of rare variants to complex trait heritability from whole-genome sequence data. Nat. Genet. 2022, 54, 263–273. [Google Scholar]
- Satterstrom, F.K.; Kosmicki, J.A.; Wang, J.; Breen, M.S.; De Rubeis, S.; An, J.-Y.; Peng, M.; Collins, R.; Grove, J.; Klei, L.; et al. Large-Scale Exome Sequencing Study Implicates Both Developmental and Functional Changes in the Neurobiology of Autism. Cell 2020, 180, 568–584.e23. [Google Scholar]
- Floen, S.K.; Elklit, A. Psychiatric diagnoses, trauma, and suicidiality. Ann. Gen. Psychiatry 2007, 6, 12. [Google Scholar] [PubMed]
- Houston, J.E.; Shevlin, M.; Adamson, G.; Murphy, J. A person-centred approach to modelling population experiences of trauma and mental illness. Soc. Psychiatry Psychiatr. Epidemiol. 2011, 46, 149–157. [Google Scholar] [PubMed]
- Didden, R.; Mevissen, L. Trauma in individuals with intellectual and developmental disabilities: Introduction to the Special Issue. Res. Dev. Disabil. 2022, 120, 104122. [Google Scholar] [PubMed]
- Humphreys, K.; Blodgett, J.C.; Roberts, L.W. The exclusion of people with psychiatric disorders from medical research. J. Psychiatr. Res. 2015, 70, 28–32. [Google Scholar]
- Teasdale, G.; Jennett, B. Assessment of coma and impaired consciousness. A practical scale. Lancet 1974, 2, 81–84. [Google Scholar]
- Gerrard, P.; Zafonte, R.; Giacino, J.T. Coma recovery scale revised: Evidentiary support for hierarchical grading of level of consciousness. Arch. Phys.Med. Rehabil. 2014, 95, 2335–2341. [Google Scholar] [PubMed]
- Rappaport, M.; Hall, K.M.; Hopkins, K.; Belleza, T.; Cope, D.N. Disability rating scale for severe head trauma: Coma to community. Arch. Phys. Med. Rehabil. 1982, 63, 118–123. [Google Scholar]
- Wijdicks, E.F.; Bamlet, W.R.; Maramattom, B.V.; Manno, E.M.; McClelland, R.L. Validation of a new coma scale: The FOUR score. Ann. Neurol. 2005, 58, 585–593. [Google Scholar]
- Iazeva, E.G.; Legostaeva, L.A.; Zimin, A.A.; Sergeev, D.V.; Domashenko, M.A.; Samorukov, V.Y.; Yusupova, D.G.; Ryabinkina, J.V.; Suponeva, N.A.; Piradov, M.A.; et al. A Russian validation study of the Coma Recovery Scale-Revised (CRS-R). Brain Inj. 2019, 33, 218–225. [Google Scholar]
- Lucca, L.F.; Lofaro, D.; Leto, E.; Ursino, M.; Rogano, S.; Pileggi, A.; Vulcano, S.; Conforti, D.; Tonin, P.; Cerasa, A. The Impact of Medical Complications in Predicting the Rehabilitation Outcome of Patients With Disorders of Consciousness After Severe Traumatic Brain Injury. Front. Hum. Neurosci. 2020, 14, 570544. [Google Scholar]
- Piradov, M.A.; Suponeva, N.A.; Yatsko, K.A.; Yusupova, J.G.; Zimin, A.A.; Legostaeva, L.A.; Yazeva, E.G.; Domashenko, M.A.; Samorukov, V.Y.; Belkin, A.A.; et al. Full Outline of UnResponsiveness (FOUR) Scale: A Multicenter Validation Study of the Psychometric Properties of the Approved Russian Version. Gen. Reanimatol. 2024, 20, 15–21. [Google Scholar]
- Vincent, J.L.; Moreno, R.; Takala, J.; Willatts, S.; De Mendonca, A.; Bruining, H.; Reinhart, C.K.; Suter, P.M.; Thijs, L.G. The SOFA (Sepsis-related Organ Failure Assessment) score to describe organ dysfunction/failure. On behalf of the Working Group on Sepsis-Related Problems of the European Society of Intensive Care Medicine. Intensive Care Med. 1996, 22, 707–710. [Google Scholar] [PubMed]
- Khadzhieva, M.B.; Gracheva, A.S.; Belopolskaya, O.B.; Kolobkov, D.S.; Kashatnikova, D.A.; Redkin, I.V.; Kuzovlev, A.N.; Grechko, A.V.; Salnikova, L.E. COVID-19 severity: Does the genetic landscape of rare variants matter? Front. Genet. 2023, 14, 1152768. [Google Scholar]
- Malay, S.; Chung, K.C. The choice of controls for providing validity and evidence in clinical research. Plast. Reconstr. Surg. 2012, 130, 959–965. [Google Scholar] [PubMed]
- Belova, V.; Pavlova, A.; Afasizhev, R.; Moskalenko, V.; Korzhanova, M.; Krivoy, A.; Cheranev, V.; Nikashin, B.; Bulusheva, I.; Rebrikov, D.; et al. System analysis of the sequencing quality of human whole exome samples on BGI NGS platform. Sci. Rep. 2022, 12, 609. [Google Scholar]
- Wang, K.; Li, M.; Hakonarson, H. ANNOVAR: Functional annotation of genetic variants from high-throughput sequencing data. Nucleic Acids Res. 2010, 38, e164. [Google Scholar]
- Ioannidis, N.M.; Rothstein, J.H.; Pejaver, V.; Middha, S.; McDonnell, S.K.; Baheti, S.; Musolf, A.; Li, Q.; Holzinger, E.; Karyadi, D.; et al. REVEL: An Ensemble Method for Predicting the Pathogenicity of Rare Missense Variants. Am. J. Hum. Genet. 2016, 99, 877–885. [Google Scholar]
- Kopanos, C.; Tsiolkas, V.; Kouris, A.; Chapple, C.E.; Albarca Aguilera, M.; Meyer, R.; Massouras, A. VarSome: The Human Genomic Variant Search Engine. Bioinformatics 2019, 35, 1978–1980. [Google Scholar]
- Li, C.I.; Samuels, D.C.; Zhao, Y.Y.; Shyr, Y.; Guo, Y. Power and sample size calculations for high-throughput sequencing-based experiments. Brief. Bioinform. 2018, 19, 1247–1255. [Google Scholar]
- Zhang, X.; Basile, A.O.; Pendergrass, S.A.; Ritchie, M.D. Real world scenarios in rare variant association analysis: The impact of imbalance and sample size on the power in silico. BMC Bioinform. 2019, 20, 46. [Google Scholar]
- Roder, J.; Linstid, B.; Oliveira, C. Improving the power of gene set enrichment analyses. BMC Bioinform. 2019, 20, 257. [Google Scholar]
- Tang, D.; Chen, M.; Huang, X.; Zhang, G.; Zeng, L.; Zhang, G.; Wu, S.; Wang, Y. SRplot: A Free Online Platform for Data Visualization and Graphing. PLoS ONE 2023, 18, e0294236. [Google Scholar]
- Wolfe, D.; Dudek, S.; Ritchie, M.D.; Pendergrass, S.A. Visualizing genomic information across chromosomes with PhenoGram. BioData Min. 2013, 6, 18. [Google Scholar]
- Nurk, S.; Koren, S.; Rhie, A.; Rautiainen, M.; Bzikadze, A.V.; Mikheenko, A.; Vollger, M.R.; Altemose, N.; Uralsky, L.; Gershman, A.; et al. The complete sequence of a human genome. Science 2022, 376, 6588. [Google Scholar]
- Zhao, B.; Fan, Q.; Liu, J.; Yin, A.; Wang, P.; Zhang, W. Identification of Key Modules and Genes Associated with Major Depressive Disorder in Adolescents. Genes 2022, 13, 464. [Google Scholar] [CrossRef]
- Lewis, S.A.; Bakhtiari, S.; Forstrom, J.; Bayat, A.; Bilan, F.; Le Guyader, G.; Alkhunaizi, E.; Vernon, H.; Padilla-Lopez, S.R.; Kruer, M.C. AGAP1-associated endolysosomal trafficking abnormalities link gene-environment interactions in neurodevelopmental disorders. Dis. Model. Mech. 2023, 16, dmm049838. [Google Scholar]
- Baroody, A.J.; Yilmaz, N.; Clements, D.H.; Sarama, J. Evaluating a basic assumption of learning trajectories: The case of early patterning learning. J. Math. Educ. 2021, 13, 8–32. [Google Scholar]
- Kawamoto, E.M.; Vivar, C.; Camandola, S. Physiology and pathology of calcium signaling in the brain. Front. Pharmacol. 2012, 3, 61. [Google Scholar]
- Guan, P.P.; Cao, L.L.; Yang, Y.; Wang, P. Calcium Ions Aggravate Alzheimer’s Disease Through the Aberrant Activation of Neuronal Networks, Leading to Synaptic and Cognitive Deficits. Front. Mol. Neurosci. 2021, 14, 298. [Google Scholar]
- Guerra-Gomes, S.; Sousa, N.; Pinto, L.; Oliveira, J.F. Functional Roles of Astrocyte Calcium Elevations: From Synapses to Behavior. Front. Cell. Neurosci. 2018, 11, 427. [Google Scholar]
- Jamjoom, A.A.B.; Rhodes, J.; Andrews, P.J.D.; Grant, S.G.N. The synapse in traumatic brain injury. Brain 2021, 144, 18–31. [Google Scholar] [PubMed]
- Yuasa-Kawada, J.; Kinoshita-Kawada, M.; Tsuboi, Y.; Wu, J.Y. Neuronal guidance genes in health and diseases. Protein Cell 2023, 14, 238–261. [Google Scholar] [PubMed]
- Oliveira, J.F.; Sardinha, V.M.; Guerra-Gomes, S.; Araque, A.; Sousa, N. Do stars govern our actions? Astrocyte involvement in rodent behavior. Trends Neurosci. 2015, 38, 535–549. [Google Scholar] [PubMed]
- Baracaldo-Santamaría, D.; Avendaño-Lopez, S.S.; Ariza-Salamanca, D.F.; Rodriguez-Giraldo, M.; Calderon-Ospina, C.A.; González-Reyes, R.E.; Nava-Mesa, M.O. Role of Calcium Modulation in the Pathophysiology and Treatment of Alzheimer’s Disease. Int. J. Mol. Sci. 2023, 24, 9067. [Google Scholar] [CrossRef] [PubMed]
- MacArthur, D.G.; Balasubramanian, S.; Frankish, A.; Huang, N.; Morris, J.; Walter, K.; Jostins, L.; Habegger, L.; Pickrell, J.K.; Montgomery, S.B.; et al. A systematic survey of loss-of-function variants in human protein-coding genes. Science 2012, 335, 823–828. [Google Scholar]
- The 1000 Genomes Project Consortium. A global reference for human genetic variation. Nature 2015, 526, 68–74. [Google Scholar]
- Johnston, J.J.; Lewis, K.L.; Ng, D.; Singh, L.N.; Wynter, J.; Brewer, C.; Brooks, B.P.; Brownell, I.; Candotti, F.; Gonsalves, S.G.; et al. Individualized iterative phenotyping for genome-wide analysis of loss-of-function mutations. Am. J. Hum. Genet. 2015, 96, 913–925. [Google Scholar]
- Lek, M.; Karczewski, K.J.; Minikel, E.V.; Samocha, K.E.; Banks, E.; Fennell, T.; O’Donnell-Luria, A.H.; Ware, J.S.; Hill, A.J.; Cummings, B.B.; et al. Analysis of protein-coding genetic variation in 60,706 humans. Nature 2016, 536, 285–291. [Google Scholar]
- Walsh, R.; Thomson, K.L.; Ware, J.S.; Funke, B.H.; Woodley, J.; McGuire, K.J.; Mazzarotto, F.; Blair, E.; Seller, A.; Taylor, J.C.; et al. Reassessment of Mendelian gene pathogenicity using 7855 cardiomyopathy cases and 60,706 reference samples. Genet. Med. 2017, 19, 192–203. [Google Scholar]
- Blekhman, R.; Man, O.; Herrmann, L.; Boyko, A.R.; Indap, A.; Kosiol, C.; Bustamante, C.D.; Teshima, K.M.; Przeworski, M. Natural selection on genes that underlie human disease susceptibility. Curr. Biol. 2008, 18, 883–889. [Google Scholar]
- Salnikova, L.E.; Kolobkov, D.S.; Sviridova, D.A.; Abilev, S.K. An overview of germline variations in genes of primary immunodeficiences through integrative analysis of ClinVar, HGMD® and dbSNP databases. Hum. Genet. 2021, 140, 1379–1393. [Google Scholar] [PubMed]
- Kingdom, R.; Wright, C.F. Incomplete Penetrance and Variable Expressivity: From Clinical Studies to Population Cohorts. Front. Genet. 2022, 13, 920390. [Google Scholar]
- Cooper, D.N.; Krawczak, M.; Polychronakos, C.; Tyler-Smith, C.; Kehrer-Sawatzki, H. Where genotype is not predictive of phenotype: Towards an understanding of the molecular basis of reduced penetrance in human inherited disease. Hum. Genet. 2013, 132, 1077–1130. [Google Scholar] [PubMed]
- Mahat, U.; Ambani, N.M.; Rotz, S.J.; Radhakrishnan, K. Heterozygous CTLA4 Splice Site Mutation c.458-1G > C Presenting with Immunodeficiency and Variable Degree of Immune Dysregulation in Three Generation Kindred of Caribbean Descent. Pediatr. Hematol. Oncol. 2021, 38, 658–662. [Google Scholar]
- Zschocke, J.; Byers, P.H.; Wilkie, A.O.M. Mendelian inheritance revisited: Dominance and recessiveness in medical genetics. Nat. Rev. Genet. 2023, 24, 442–463. [Google Scholar]
- Andrade, A.; Brennecke, A.; Mallat, S.; Brown, J.; Gomez-Rivadeneira, J.; Czepiel, N.; Londrigan, L. Genetic Associations between Voltage-Gated Calcium Channels and Psychiatric Disorders. Int. J. Mol. Sci. 2019, 20, 3537. [Google Scholar] [CrossRef]
- Nieto-Escamez, F.; Obrero-Gaitán, E.; Cortés-Pérez, I. Visual Dysfunction in Parkinson’s Disease. Brain Sci. 2023, 13, 1173. [Google Scholar] [CrossRef]
- Pizzo, L.; Jensen, M.; Polyak, A.; Rosenfeld, J.A.; Mannik, K.; Krishnan, A.; McCready, E.; Pichon, O.; Le Caignec, C.; Van Dijck, A.; et al. Rare variants in the genetic background modulate cognitive and developmental phenotypes in individuals carrying disease-associated variants. Genet. Med. 2019, 21, 816–825. [Google Scholar]


| Characteristics | Total Group (n = 50) | Group 1 Discharged/ Transferred with Improvement (n = 25) | Group 2 Discharged/ Transferred Unchanged (n = 18) | Group 3 Transferred with Deterioration (n = 2) or Deceased (n = 5) |
|---|---|---|---|---|
| Gender and age | ||||
| Male | 39 (0.78) | 19 (0.76) | 13 (0.72) | 7 (1.00) |
| Female | 11 (0.22) | 6 (0.24) | 5 (0.28) | 0 (0.00) |
| Age | 46.88 ± 18.40 | 47.08 ± 14.49 | 43.56 ± 20.90 | 54.71 ± 21.33 |
| Min–max | 18–86 | 18–79 | 19–86 | 26–82 |
| External cause | ||||
| Falls | 23 (0.46) | 11 (0.44) | 9 (0.50) | 3 (0.42) |
| Transport accidents | 14 (0.28) | 6 (0.24) | 6 (0.33) | 2 (0.29) |
| Assault | 3 (0.06) | 2 (0.08) | 1 (0.06) | 0 (0.00) |
| Events of undetermined intent | 10 (0.20) | 6 (0.24) | 2 (0.11) | 2 (0.29) |
| Types of TBI | ||||
| Closed brain injury | 39 (0.78) | 19 (0.76) | 14 (0.78) | 6 (0.86) |
| Penetrating brain injury | 11 (0.22) | 6 (0.24) | 4 (0.22) | 1 (0.14) |
| Diffuse axonal injury | 8 (0.16) | 3 (0.12) | 5 (0.28) | 0 (0.00) |
| Skull fracture | 26 (0.52) | 11 (0.44) | 12 (0.67) | 3 (0.42) |
| Contusion | 43 (0.86) | 21 (0.84) | 16 (0.89) | 6 (0.86) |
| Hematoma | 34 (0.68) | 17 (0.68) | 12 (0.67) | 5 (0.71) |
| Hemorrhage | 27 (0.54) | 13 (0.52) | 10 (0.56) | 4 (0.57) |
| Surgical interventions after TBI | ||||
| Surgical interventions | 35 (0.7) | 16 (0.64) | 14 (0.78) | 5 (0.71) |
| Time to admission to rehab, time in rehab | ||||
| Days before admission to rehab | 46.88 ± 18.40 | 46.42 ± 48.33 | 37.89 ± 32.43 | 113.14 ± 171.22 |
| Min–max | 10–526 | 9–205 | 10–138 | 11–526 |
| Days in the rehab | 41.44 ± 36.49 | 34.64 ± 11.72 | 53.39 ± 54.72 | 35.00 ± 27.28 |
| Min–max | 8–216 | 22–69 | 22–216 | 8–88 |
| Complications/comorbidities | ||||
| Neoplasms | 3 (0.06) | 2 (0.08) | 1 (0.06) | 0 (0.00) |
| Hemic and lympatic/immune a | 35 (0.7) | 15 (0.6) | 15 (0.83) | 5 (0.71) |
| Endocrine, nutritional and metabolic b | 27 (0.54) | 10 (0.4) | 11 (0.61) | 6 (0.86) |
| Mental c | 37 (0.74) | 19 (0.76) | 12 (0.67) | 6 (0.86) |
| Nervous d | 36 (0.72) | 18 (0.72) | 12 (0.67) | 6 (0.86) |
| Eye e | 50 (1) | 25 (1) | 18 (1) | 7 (1.00) |
| Ear | 7 (0.14) | 7 (0.28) | 0 (0) | 0 (0.00) |
| Circulatory f | 31 (0.62) | 16 (0.64) | 9 (0.5) | 6 (0.86) |
| Respiratory g | 43 (0.86) | 19 (0.76) | 17 (0.94) | 7 (1.00) |
| Digestive h | 23 (0.46) | 8 (0.32) | 9 (0.5) | 6 (0.86) |
| Skin and subcutaneous tissue i | 26 (0.52) | 11 (0.44) | 10 (0.56) | 5 (0.71) |
| Musculoskeletal/connective tissue | 6 (0.12) | 2 (0.08) | 3 (0.17) | 1 (0.14) |
| Genitourinary j | 40 (0.8) | 20 (0.8) | 14 (0.78) | 6 (0.86) |
| Clinical and laboratory findings | ||||
| Dysphagia | 30 (0.6) | 11 (0.44) | 14 (0.78) | 5 (0.71) |
| Dysarthria and anarthria | 6 (0.12) | 5 (0.2) | 1 (0.06) | 0 (0.00) |
| Dysphasia and aphasia | 4 (0.08) | 3 (0.12) | 1 (0.06) | 0 (0.00) |
| Systemic inflammatory response syndrome of infectious origin with organ failure (severe sepsis) | 9 (0.18) | 1 (0.04) | 3 (0.17) | 5 (0.71) |
Disclaimer/Publisher’s Note: The statements, opinions and data contained in all publications are solely those of the individual author(s) and contributor(s) and not of MDPI and/or the editor(s). MDPI and/or the editor(s) disclaim responsibility for any injury to people or property resulting from any ideas, methods, instructions or products referred to in the content. |
© 2024 by the authors. Licensee MDPI, Basel, Switzerland. This article is an open access article distributed under the terms and conditions of the Creative Commons Attribution (CC BY) license (https://creativecommons.org/licenses/by/4.0/).
Share and Cite
Gracheva, A.S.; Kashatnikova, D.A.; Redkin, I.V.; Zakharchenko, V.E.; Kuzovlev, A.N.; Salnikova, L.E. Genetics and Traumatic Brain Injury: Findings from an Exome-Based Study of a 50-Patient Case Series. Curr. Issues Mol. Biol. 2024, 46, 10351-10368. https://doi.org/10.3390/cimb46090616
Gracheva AS, Kashatnikova DA, Redkin IV, Zakharchenko VE, Kuzovlev AN, Salnikova LE. Genetics and Traumatic Brain Injury: Findings from an Exome-Based Study of a 50-Patient Case Series. Current Issues in Molecular Biology. 2024; 46(9):10351-10368. https://doi.org/10.3390/cimb46090616
Chicago/Turabian StyleGracheva, Alesya S., Darya A. Kashatnikova, Ivan V. Redkin, Vladislav E. Zakharchenko, Artem N. Kuzovlev, and Lyubov E. Salnikova. 2024. "Genetics and Traumatic Brain Injury: Findings from an Exome-Based Study of a 50-Patient Case Series" Current Issues in Molecular Biology 46, no. 9: 10351-10368. https://doi.org/10.3390/cimb46090616
APA StyleGracheva, A. S., Kashatnikova, D. A., Redkin, I. V., Zakharchenko, V. E., Kuzovlev, A. N., & Salnikova, L. E. (2024). Genetics and Traumatic Brain Injury: Findings from an Exome-Based Study of a 50-Patient Case Series. Current Issues in Molecular Biology, 46(9), 10351-10368. https://doi.org/10.3390/cimb46090616