1. Introduction
This article presents findings from a pilot study that tested a technology-based preschool intervention intended to help children apply foundational mathematics and build data collection and analysis (DCA) skills as they engaged in hands-on, play-based investigations. DCA investigations are an applied context in which children can build new skills with data collection and analysis, while also applying other mathematical skills, such as counting, sorting, classifying, comparing, and contrasting. Our conjecture is that by leveraging preschoolers’ curiosity, these authentic investigations build mathematics and data literacy skills as children engage with data to answer developmentally appropriate research questions. The intervention under investigation here included a series of nine curricular investigations that teachers implemented with preschool children, while using a teacher-facing tablet-based app to scaffold these investigations and help quickly create simple graphs.
In alignment with the “Curriculum Research Framework” (CRF) [
1], which identified phases of research and development that demonstrate the evidentiary grounding of curricular interventions, we leveraged prior work on DCA learning to develop the invention, child assessments, and teacher professional development. This was the second study in a series of studies [
2,
3] as part of a larger design-based research approach, with iterative revisions in response to study findings. CRF is a framework for how to create curricula that is truly based on research, as the authors state that both market research and research-to-practice models are not sufficiently rigorous [
1]. CRF lays out a series of three categories—Apriori Foundations (phase 1–3), Learning Model (phase 4), and Evaluation (phases 5–10)—with 10 phases of research and curriculum design that strengthen the connection between the knowledge generated from research and the instructional materials themselves.
The first phase of CRF involves the consideration of what is already known about (a) the importance of the curriculum goals, (b) existing systems addressing these goals, and (c) pedagogical approaches (CRF A Priori Foundations phases 1, 2, 3). Then, the Learning Model phase focuses on how to create a curriculum that effectively fosters intended outcomes (CRF phase 4) based on existing knowledge. These phases were completed during the proposal stage of this project and revisited at the beginning of the project.
Within the Evaluation phase, this project addressed phase 5 with its first study [
2] to determine the interest level of teachers and receive feedback from those teachers on initial plans for the intervention. Phase 6–8 of CRF focus on different types of studies that generate knowledge about how teachers and children respond to the initial implementation. This paper focuses on that issue with by conducting a formative research with a small group of classrooms (CRF phase 8 study), focused on the extent to which the initial implementation matches the learning model. Findings from the current study were used to revise the investigations and app, which were then tested again with a small-scale summative study (CRF phase 9 study) [
3]. Based on findings from the current pilot study, revisions focused on ensuring that the intervention activities and corresponding app fit into existing preschool structures, were feasible to implement for the teacher, and were developmentally appropriate for young children. Future studies will focus on larger questions of effectiveness with a large-scale comparison study. The overarching purpose of the full line of research is to ensure that the curriculum design is actually based on research findings so that it can optimally meet the needs of the future teachers and children who use it.
Using a series of nine investigations, the preschool DCA intervention seeks to foster mathematics and computational thinking (CT) skills for young children (see full description in
Section 2.4 and
Section 2.5 below). Each investigation includes three–five activities, in which children collect data, create graphs, and discuss that data to answer the research question. For example, in
Animal Data Shuffle, preschool teachers first read a book about a set of five characters and create graphs with the app focused on the characters features and preferences (e.g., favorite food, color hair). In the second part of the activity, children receive cards with pictures of an animal on them and sort themselves into groups around the room based on their animal’s features (e.g., number of legs their animal has, how their animal moves). Finally, the children—who we refer to as “data scientist”—look at the graphs the class created and answer data talk questions about which group has the most/least and arranging the data in the graph in ascending and descending order.
Investigations were developed to include collaboration between teachers and children, developmentally appropriate research questions, opportunities to apply common mathematics skills (e.g., count, sort, classify, order), discussions about data (i.e., data talks), multimodal data collection with manipulatives, pictures, objects, and their own bodies in addition to digital data displays. The teacher-facing tablet app serves as both a scaffold of the investigation process for both teachers and children, as well as a tool that makes it easier to create graphs and tally charts. By decreasing teachers burden in creating graphs and charts, the intervention helps address the suggestion that young children spend two-thirds of their time viewing and discussing data rather than collecting and creating data displays [
4].
1.1. Importance of Data Learning
Recent educational priorities have posited that integrating computational thinking (CT) as a new STEM domain is critically important. One domain of CT is data science, which includes the use of data and models to solve problems [
5]. Specifically, the K-12 Computer Science Framework lists “data and analysis” as one of its five core CT concepts [
6] and the American Statistical Association [
7] recommends data-rich learning, even for young learners [
8]. Standards for CT and DCA are not universal yet, but Common Core State Standards do include DCA topics for K-1 students [
9]. This includes expectations to collect, store, visualize, transform, and interpret data.
The overarching goal of this emphasis on CT, and data science specifically, is to lay the groundwork for a future workforce with skills to collect and use data [
10]. We know more about how older students learn about and use data, yet there is a dearth of similarly robust research focused on how young children learn about CT [
11] and how they learn to use data specifically [
12,
13]. Yet, there is a growing trend to include DCA in state and local [
14] learning standards and, thus, there is a pressing need for research with preschoolers that not only focuses on how preschoolers learn about data, but also provides a developmentally appropriate technology tool built specifically for preschoolers.
Since DCA is a subdomain of CT and also helps young children apply foundational mathematics concepts, its inclusion helps meet multiple educational needs. Yet, DCA is a new area of focus in preschool education and more research is needed to understand how to assist teachers in implementing DCA activities and to foster learning in this domain. This is an area ripe for hands-on, engaging learning in which young children can not only understand how to use data to answer questions, but also have agency in the process.
1.2. Early Mathematics and Data Collection and Analysis Learning
Skeptics might wonder if young children can and should learn about data. Preliminary research does suggest that preschool children can engage with data, and that data learning provides an important context for solving larger problems and answering meaningful questions [
2,
3,
13]. In fact, the underlying foundations of data incorporate critical mathematics content that is already deeply embedded into preschool mathematics; for example, counting objects, sorting objects into groups, and classifying groups by key features in order to represent relationships and illuminate their meaning [
15]. Research also suggests that preschoolers are capable of understanding that graphs show quantities and talking about what the data mean [
4].
Indeed, young children are capable of more mathematical reasoning—including with data—than is generally accepted, yet they also need scaffolding and support at each stage of an investigation that uses data [
16]. Prior work suggests that educational interventions can be designed to assist young children in exploring complex mathematical concepts [
8,
17,
18,
19] and provide important opportunities for the development of life-long communication skills [
20]. Conducting investigations that seek to answer a question is an established method for engaging with data [
13], particularly with older students [
20,
21]. For students to learn how to answer data-related questions and make informed interpretations of that data, however, they need practice [
22].
Building off prior research [
4] and learning trajectories [
12], our team identified learning goals related to the data—organizing, describing, representing, collecting—and mathematics generally. To use data to answer questions, children must also use and practice counting, sorting, comparing, ordering, and classifying. The key is that data are used for a larger purpose—to answer a compelling research question [
4]. Thus, this preschool intervention focuses on DCA and frames the use of data within the context of fun, hands-on, and developmentally appropriate investigations that children engage in with the support of their teacher and an app.
DCA investigation can also help integrate mathematics into other topic areas. A plethora of opportunities exist to link the collection of data with literacy, science, and social studies. For example, a classroom in this study created a series of graphs about their favorite type of exercise that built off a unit they were doing about exercise more generally. Likewise, a unit on water might include an investigation into different types of precipitation or test what objects float and sink, offering opportunities to ask questions, collect and organize data, and most importantly, practice how to think about what the data means.
1.3. Using Technology in Preschool Classrooms
This tablet-based app is intended for preschool teachers to use with the assistance of children, rather than as a stand-alone game or other discreet digital activity. Our teacher-mediated approach helps ensure the technology with children to scaffold the investigation process. Prior research suggests that technology can help facilitate a collaborative learning experience [
23] and foster socialization [
24]. In addition, technology tools can be designed to scaffold complex learning, particularly when the tools both structure the learning task and include tools to scaffold aspects of those tasks [
25]. Prior research also suggests it is developmentally appropriate to use research questions with young children; yet, also suggests that the bulk of instructional time is spent on discussion rather than collection and display type activities [
4]. The Preschool Data Toolbox app leverages this scaffolded, collaborative approach to help teachers create data visualizations faster and focus on talking and thinking about the data.
More generally, research on the effective integration of technology, particularly digital apps, is growing. Studies have found positive benefits of including digital apps in preschool classrooms [
26,
27,
28,
29,
30] that support the assertion that they are a tool for effective learning [
31]. Teachers report regularly using tablets in preschool classrooms [
32] but vary in the extent to which they are convinced of their educational value [
33]. To use apps effectively, it is critical that teachers are trained to use the technology effectively [
32]. While many preschool apps exist, most are not developed through a research-based process [
34] and new tools provide criteria to help preschool teachers evaluate the potential benefits of apps [
35].
1.4. Investigation Framework
Each investigation in the intervention follows an existing set of simple steps to answer questions with data. Based on prior work [
36], this framework includes the following steps: (1) create research question, (2) collect data needed to answer that question, (3) analyze data, and (4) interpret results.
1.5. Research Questions
This study focused on the intervention’s developmental appropriateness, feasibility, and teacher supports. Specifically, it focused on the following primary research questions:
What affordances of the DCA app support preschool teachers in engaging students in DCA?
How did teachers and students engage with and use the DCA intervention (investigations and digital app)?
What are the challenges teachers experience when using the app?
In addition, we include an exploratory question focused on preschoolers initial DCA learning:
- 4.
Does engagement in these instructional activities with the app lead preschool students to greater mathematics and DCA knowledge and skills (as measured by assessment tasks)?
2. Methods
This paper reports on a pilot study conducted with a small group of preschool classrooms utilizing mixed-methods data collection.
2.1. Setting
This study took place within public preschool classrooms. Informed consent was obtained from participating teachers and parents of participating children.
2.2. Participants
Five teachers, all female, in four preschool classrooms serving a diverse range of students participated. Children were assessed at pre-intervention and again at post-intervention (n = 28). The mean age was 4.78 years with the majority of students 4 years of age (n = 24). The sample included slightly more males (n = 16) than females (n = 12). The majority of the sample was white (n = 21), followed by Hispanic or Latino (n = 5), African–American or Black (n = 1), and other (n = 1).
2.3. Pandemic Challenges
This study occurred in the fall of 2020 and was entirely remote due to COVID-19 precautions and protocols. This created three primary challenges: (1) children’s video-recording consent, (2) teachers’ use of technology, and (3) time constraints. First, because children were being video recorded rather than observed in-person by a researcher, active consent was required for each participating child. In each classroom, the number of consented children ranged from 7–12 students. Because of this, teachers could not implement and film the investigations with their full classes, adding an extra burden on the teachers to run the activities in separate, small groups. Throughout filming, the teachers also needed to monitor their students’ whereabouts to ensure that non-consented children did not enter into the video. In their interviews and surveys, teachers noted these logistics were challenging and, during classroom observations, the teachers were observed abruptly starting and stopping their recordings to prevent footage of non-consented children from being recorded. Second, the teachers attended professional development sessions, completed their interviews and surveys, and uploaded their classroom videos to researchers all virtually. Although the necessary technology and equipment (e.g., tablets, casing, tripods) was provided to each teacher, the teachers varied in their comfort levels with the equipment. In particular, teachers often had difficulty uploading their videos to the study’s secure online platform. Support was provided as needed, though these technology challenges were, understandably, a frustration. Finally, each research classroom needed to close and quarantine for periods of time ranging from 10–14 days at least once during this study, with multiple classrooms closing multiple times. Because these closures limited the amount of time teachers and children were in their classrooms, teachers needed to skip or modify activities and no teachers were able to complete the DYODS (the final investigation in the intervention) as it was intended.
2.4. Intervention
The intervention consisted of nine curricular investigations and an integrated digital app that scaffolded the DCA process and offered an applied problem-solving context for using mathematical knowledge. Children counted, sorted, classified, and compared objects and people as they asked research questions, collected data, and created simple graphs and charts. Each investigation revolves around a theme that is explored in multiple ways by posing a series of research questions. All investigations have hands-on components and use a corresponding app—the Preschool Data Toolbox (
Supplemental Materials). The app is intended to scaffold a collaborative process between preschool teachers and children as they engage in the process. For each research question, the teacher guides the children through the process of setting up the graph, selecting variables and the range, as well as entering the data into a graph (see
Section 2.4).
The resulting graphs take many forms, for example, a body graph where children stand in a life-size grid, an object graph with counting bears placed on a masking tape grid on the carpet, a pictograph with cards on the floor or on the app that show a picture for each data point, or a bar graph made of post-it notes on the table or blocks in the app to show the overall amount in each category. Each investigation provides opportunities to apply children’s knowledge with mathematics and extends this learning and scaffold how to collect and organize data (i.e., collect, record, visualize), then interpret that data by looking at the resulting graph and sometimes comparing two graphs. After creating each graph, children engage in a “data talk” to discuss what the graph shows and what the data means. This can take the form of counting how many are in each group, comparing groups to determine which has more or less, and using the data to answer the original question posed.
Of the nine investigations (
Table 1), six investigations have existing lesson plans for the teacher to follow. These hands-on and play-based investigations asked questions about familiar things, such as features of the children’s clothing, characteristics of animals, storybooks, and explorations of classroom and outdoor spaces. For example, one investigation used Eric Carle’s
The Very Hungry Caterpillar book to graph how many pieces of fruit the caterpillar ate Monday through Friday. This graph showed a + 1 pattern and led to both thoughtful predictions about what might happen next and sparked questions and data collection around the children’s favorite fruits and vegetables.
The remaining three investigations gave teachers the opportunity to create research questions based on themes or activities within their curriculum and for children to be involved in the generation of research questions. These open-ended, user-driven investigations were included to allow the DCA to connect to the classroom’s curriculum and to scaffold teachers in applying DCA for their own purposes so that the intervention would live on beyond the study. Of these three user-driven investigations, teachers were invited to engage in two “Create-Your-Own (CYO)” and one “Design-Your-Own Data Story (DYODS).” CYO investigations focused on a single research question posed by the teacher (e.g., Are you wearing boots today?). The theme-based, DYODS investigation included multiple related research questions arising from students’ interests and explorations and used these research questions to tell a data story. The app encouraged the creation of a storybook from graphed data by prompting teachers to enter text that described their DCA process and findings, ideally in the children’s own words, to allow children to revisit their data and to tell and re-tell their findings. However, because the app prototype did not yet allow for the inclusion of narrative descriptions, teachers were asked to create their storybook by taking screenshots of the graphs and adding narration in another program on the tablet.
2.5. The Preschool Data Toolbox App
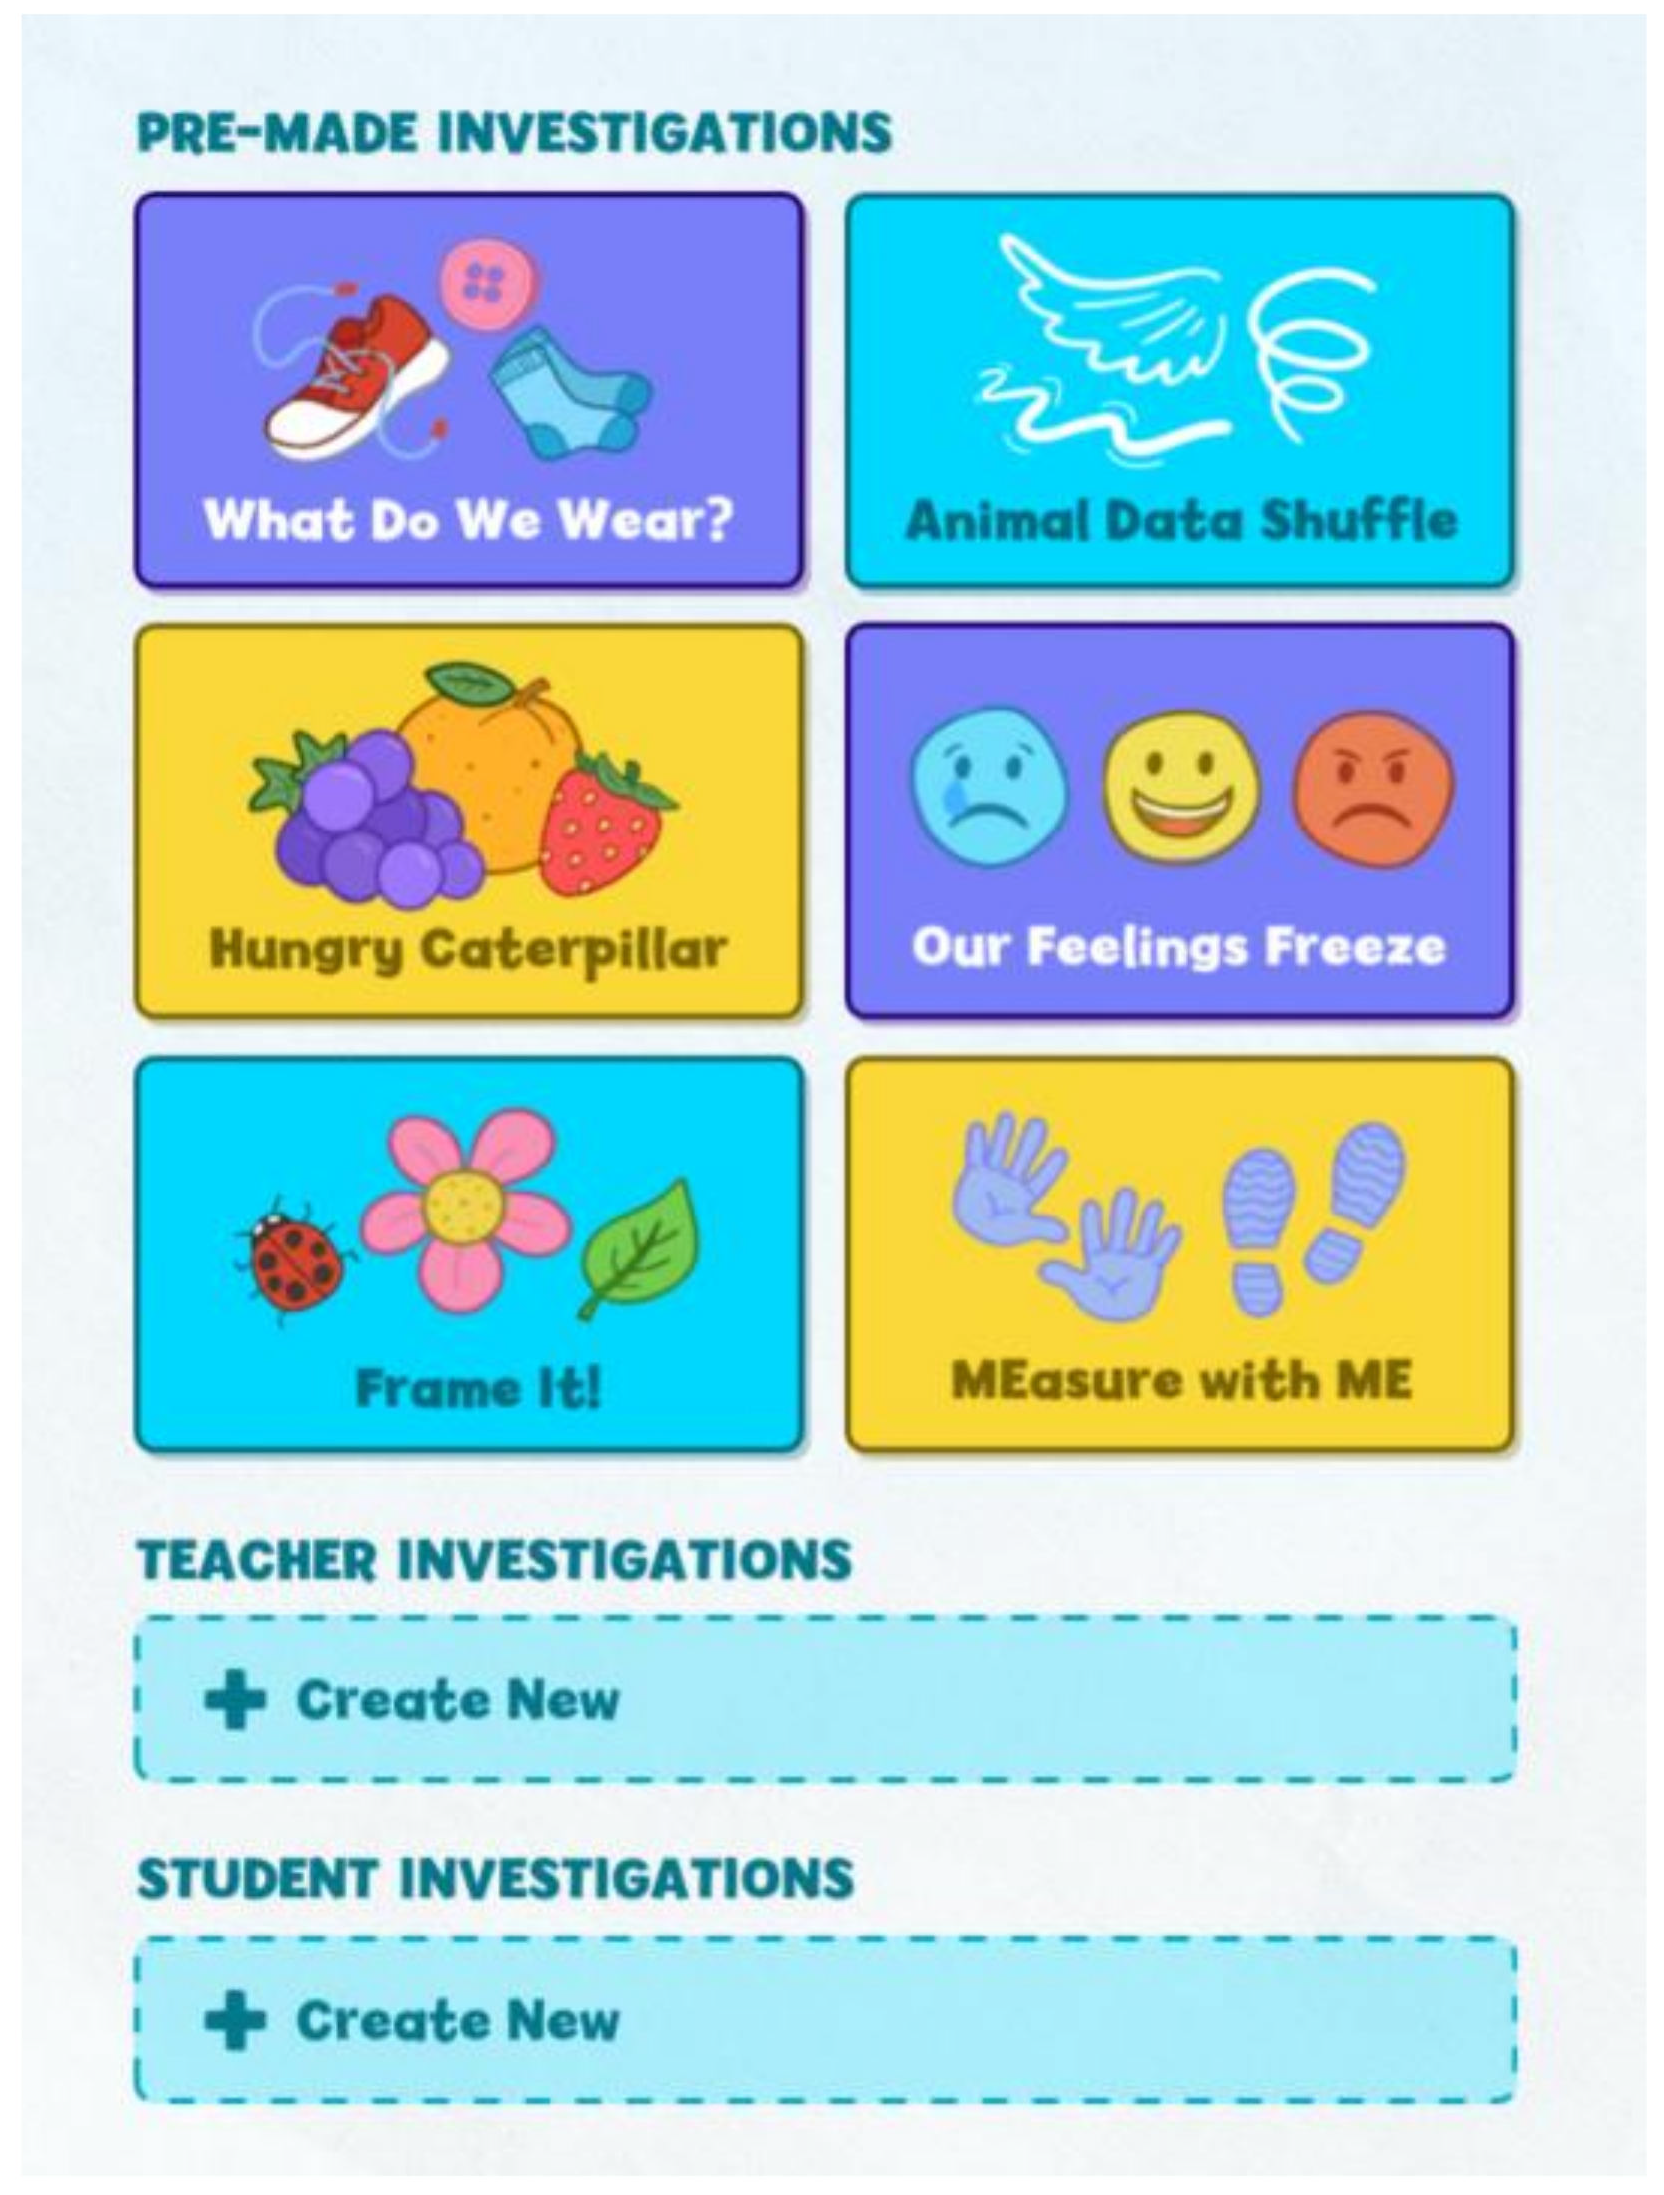
The Preschool Data Toolbox app guides the teachers through the investigations. For the first six investigations with existing lesson plans, teachers selected these from the main screen; to create new investigations teachers selected the “Teacher” and “Student” investigations tabs (see
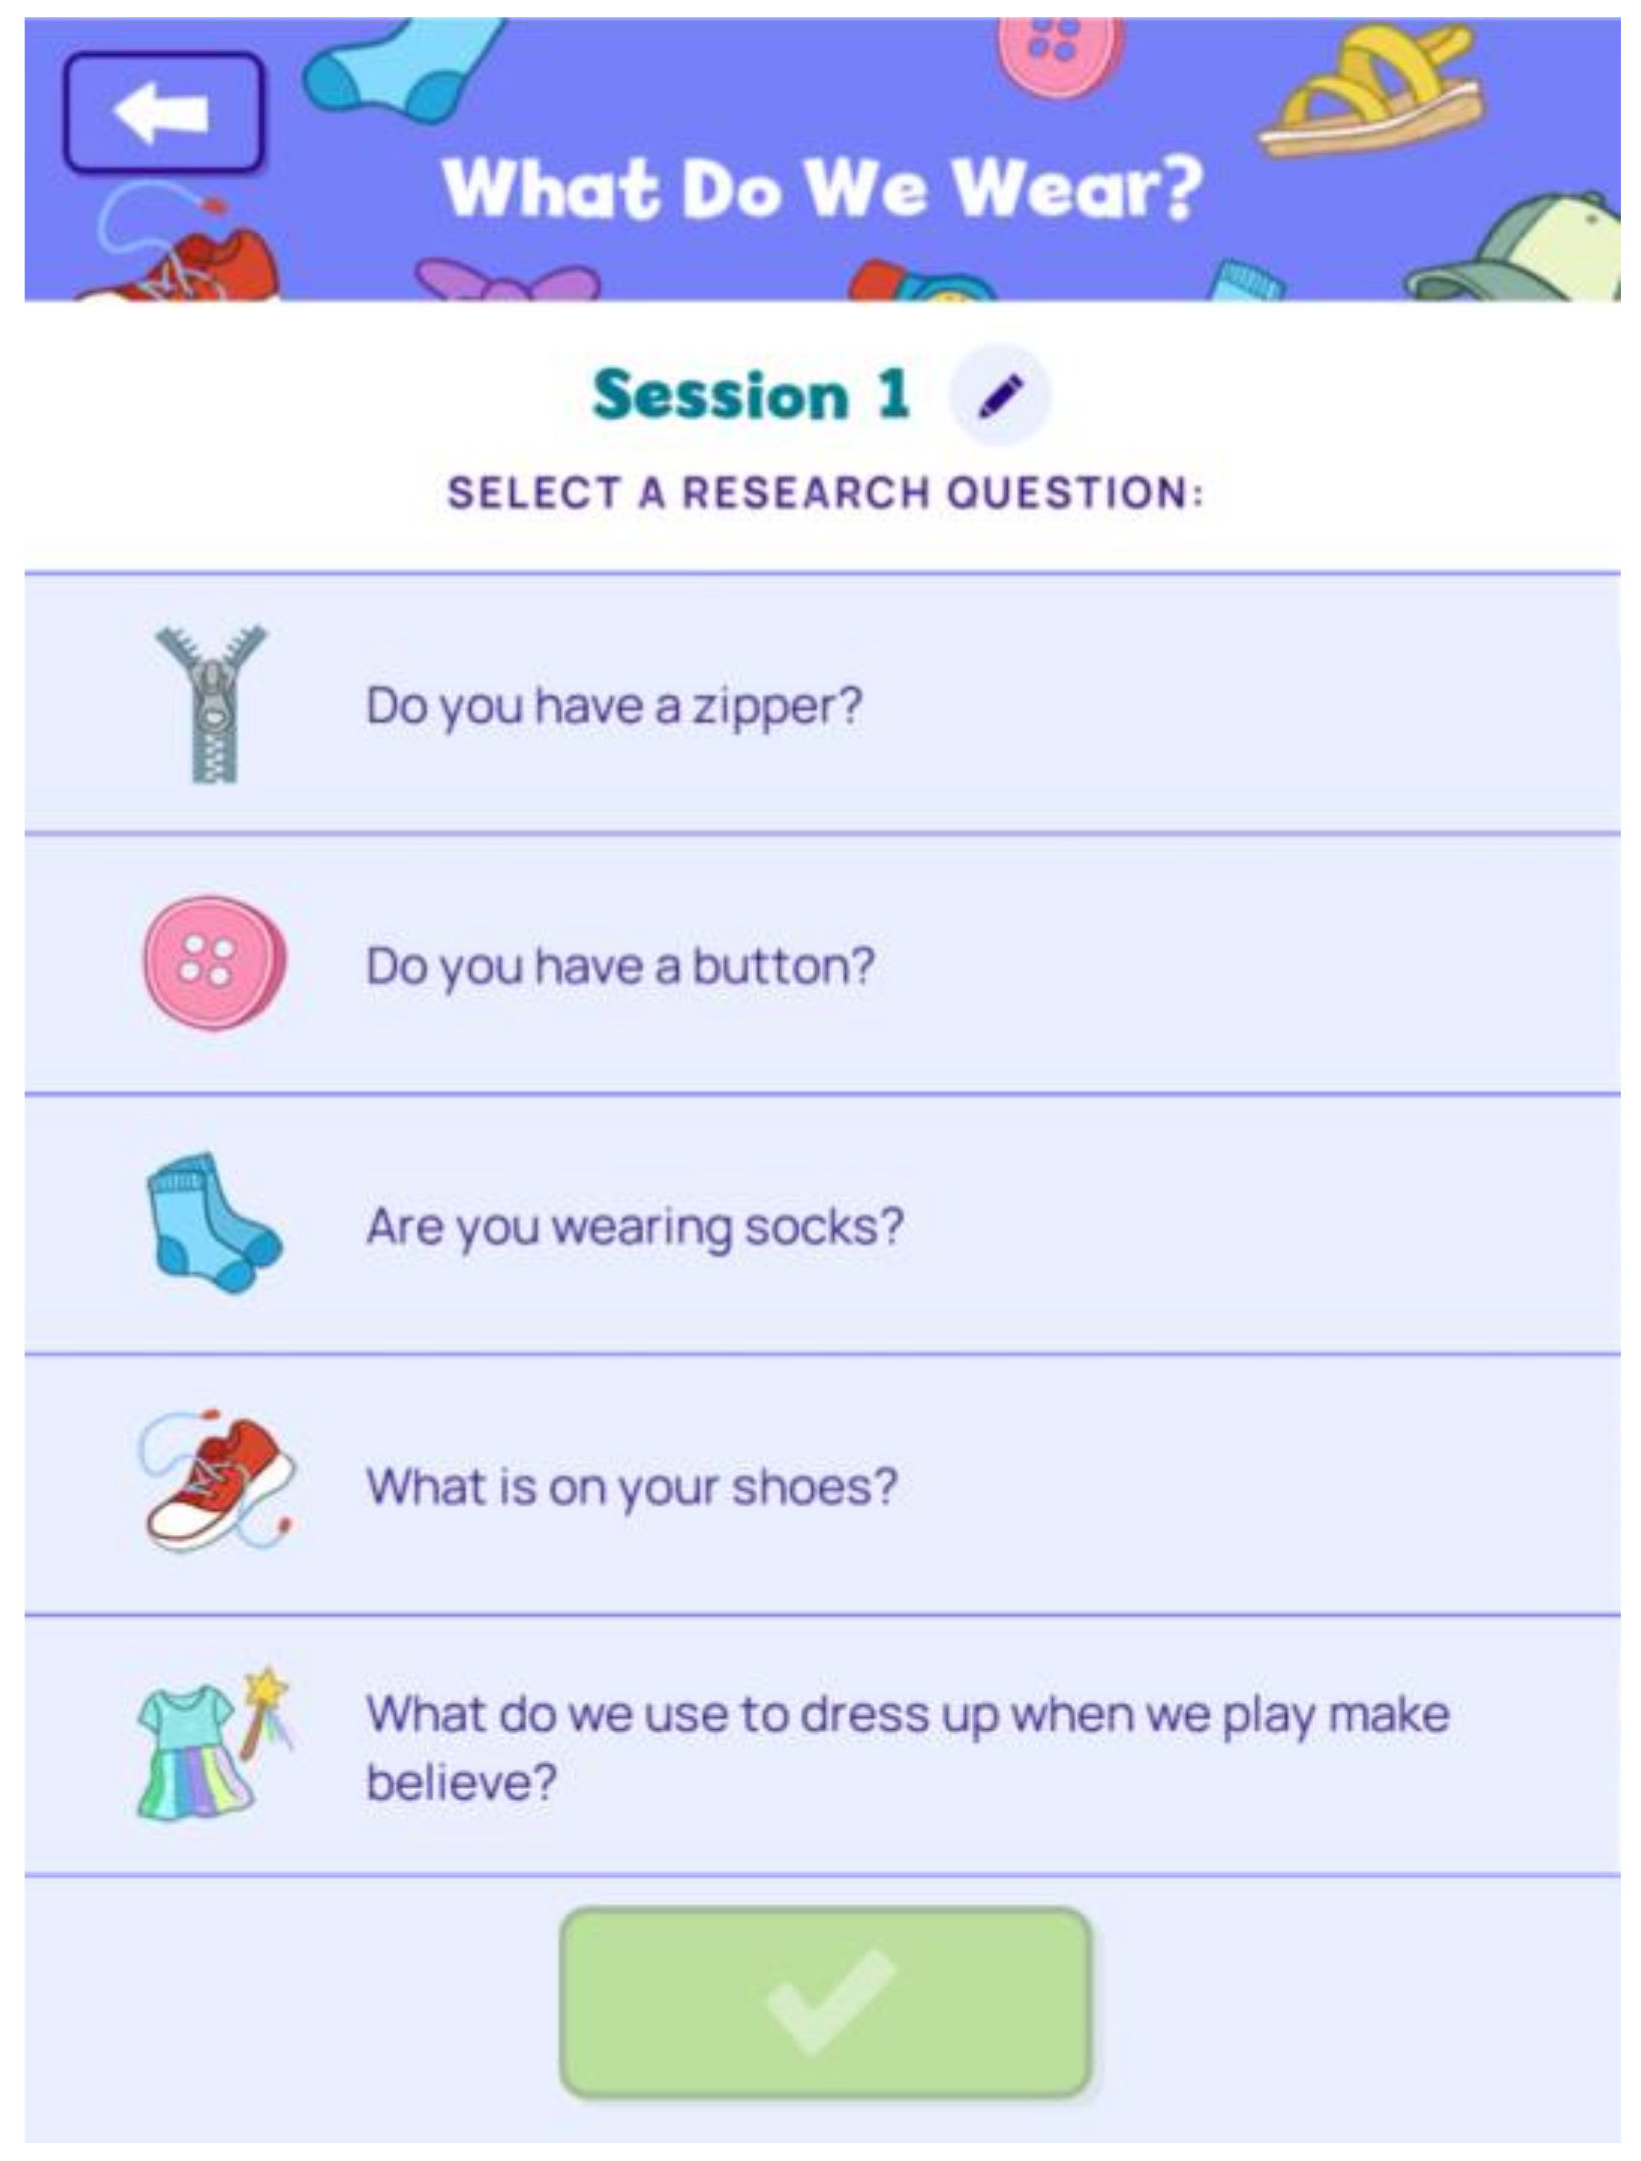
Figure 1). On the next screen, teachers start a new session or revisit a previous one. Then, they select a research question (
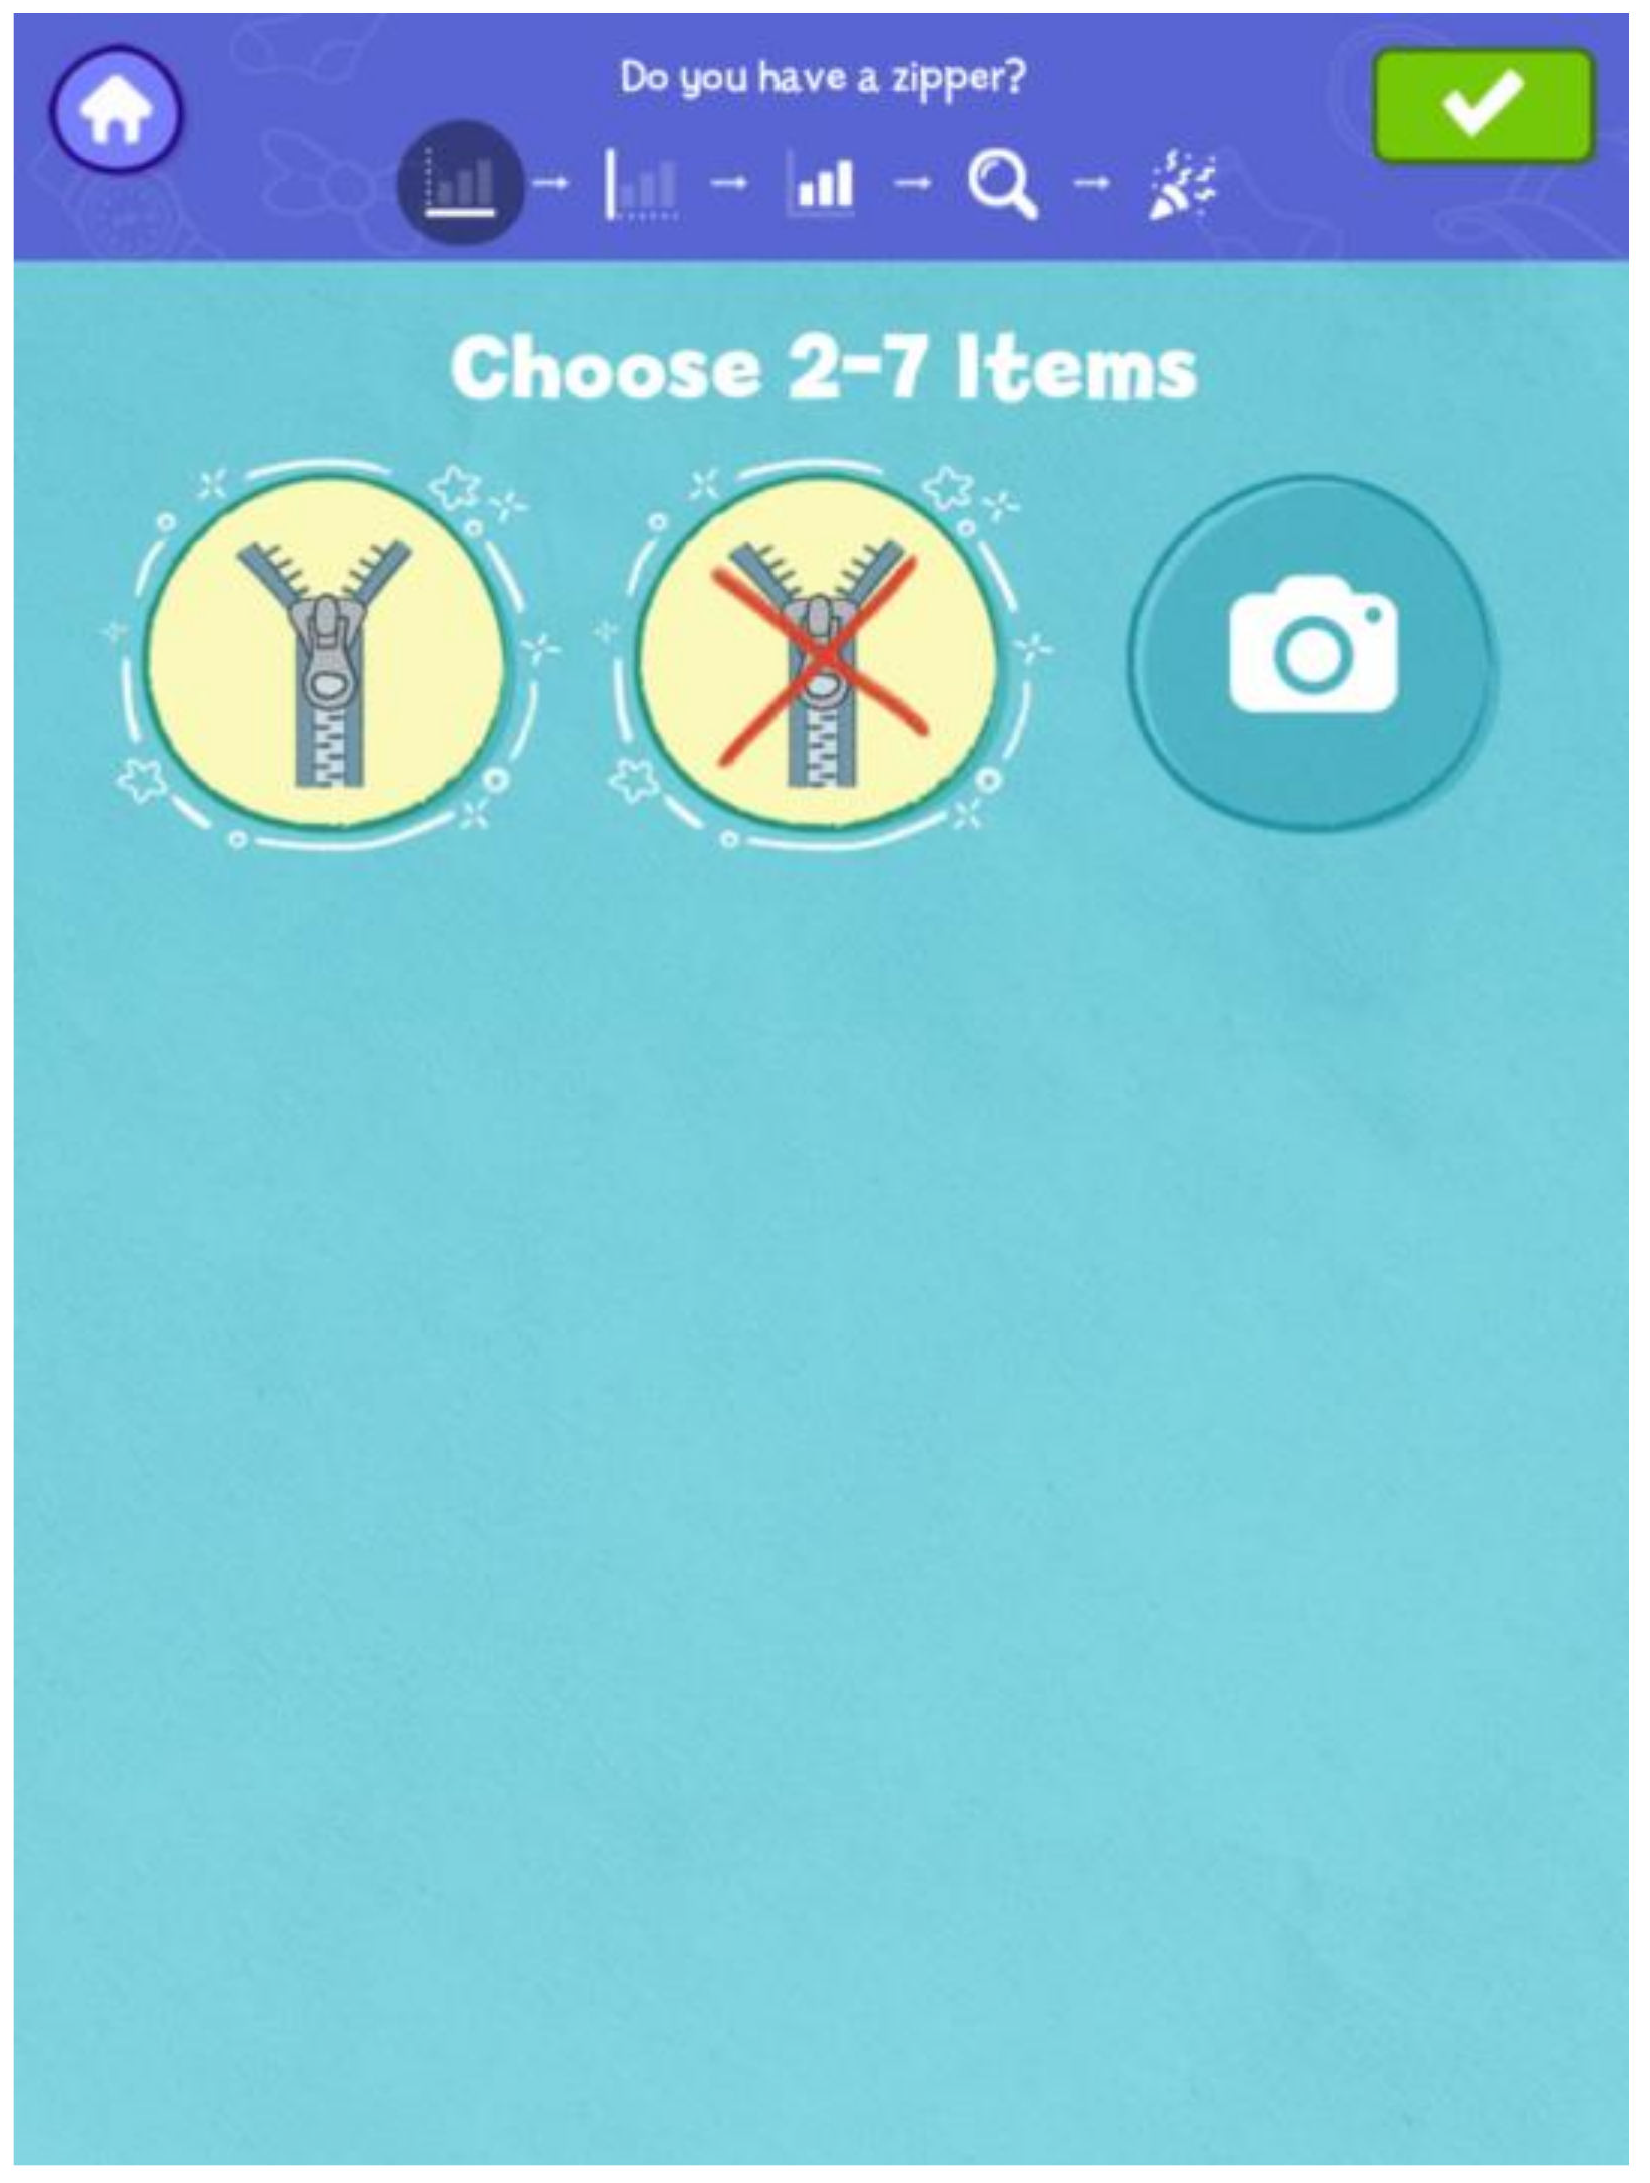
Figure 2), choose variable icons (
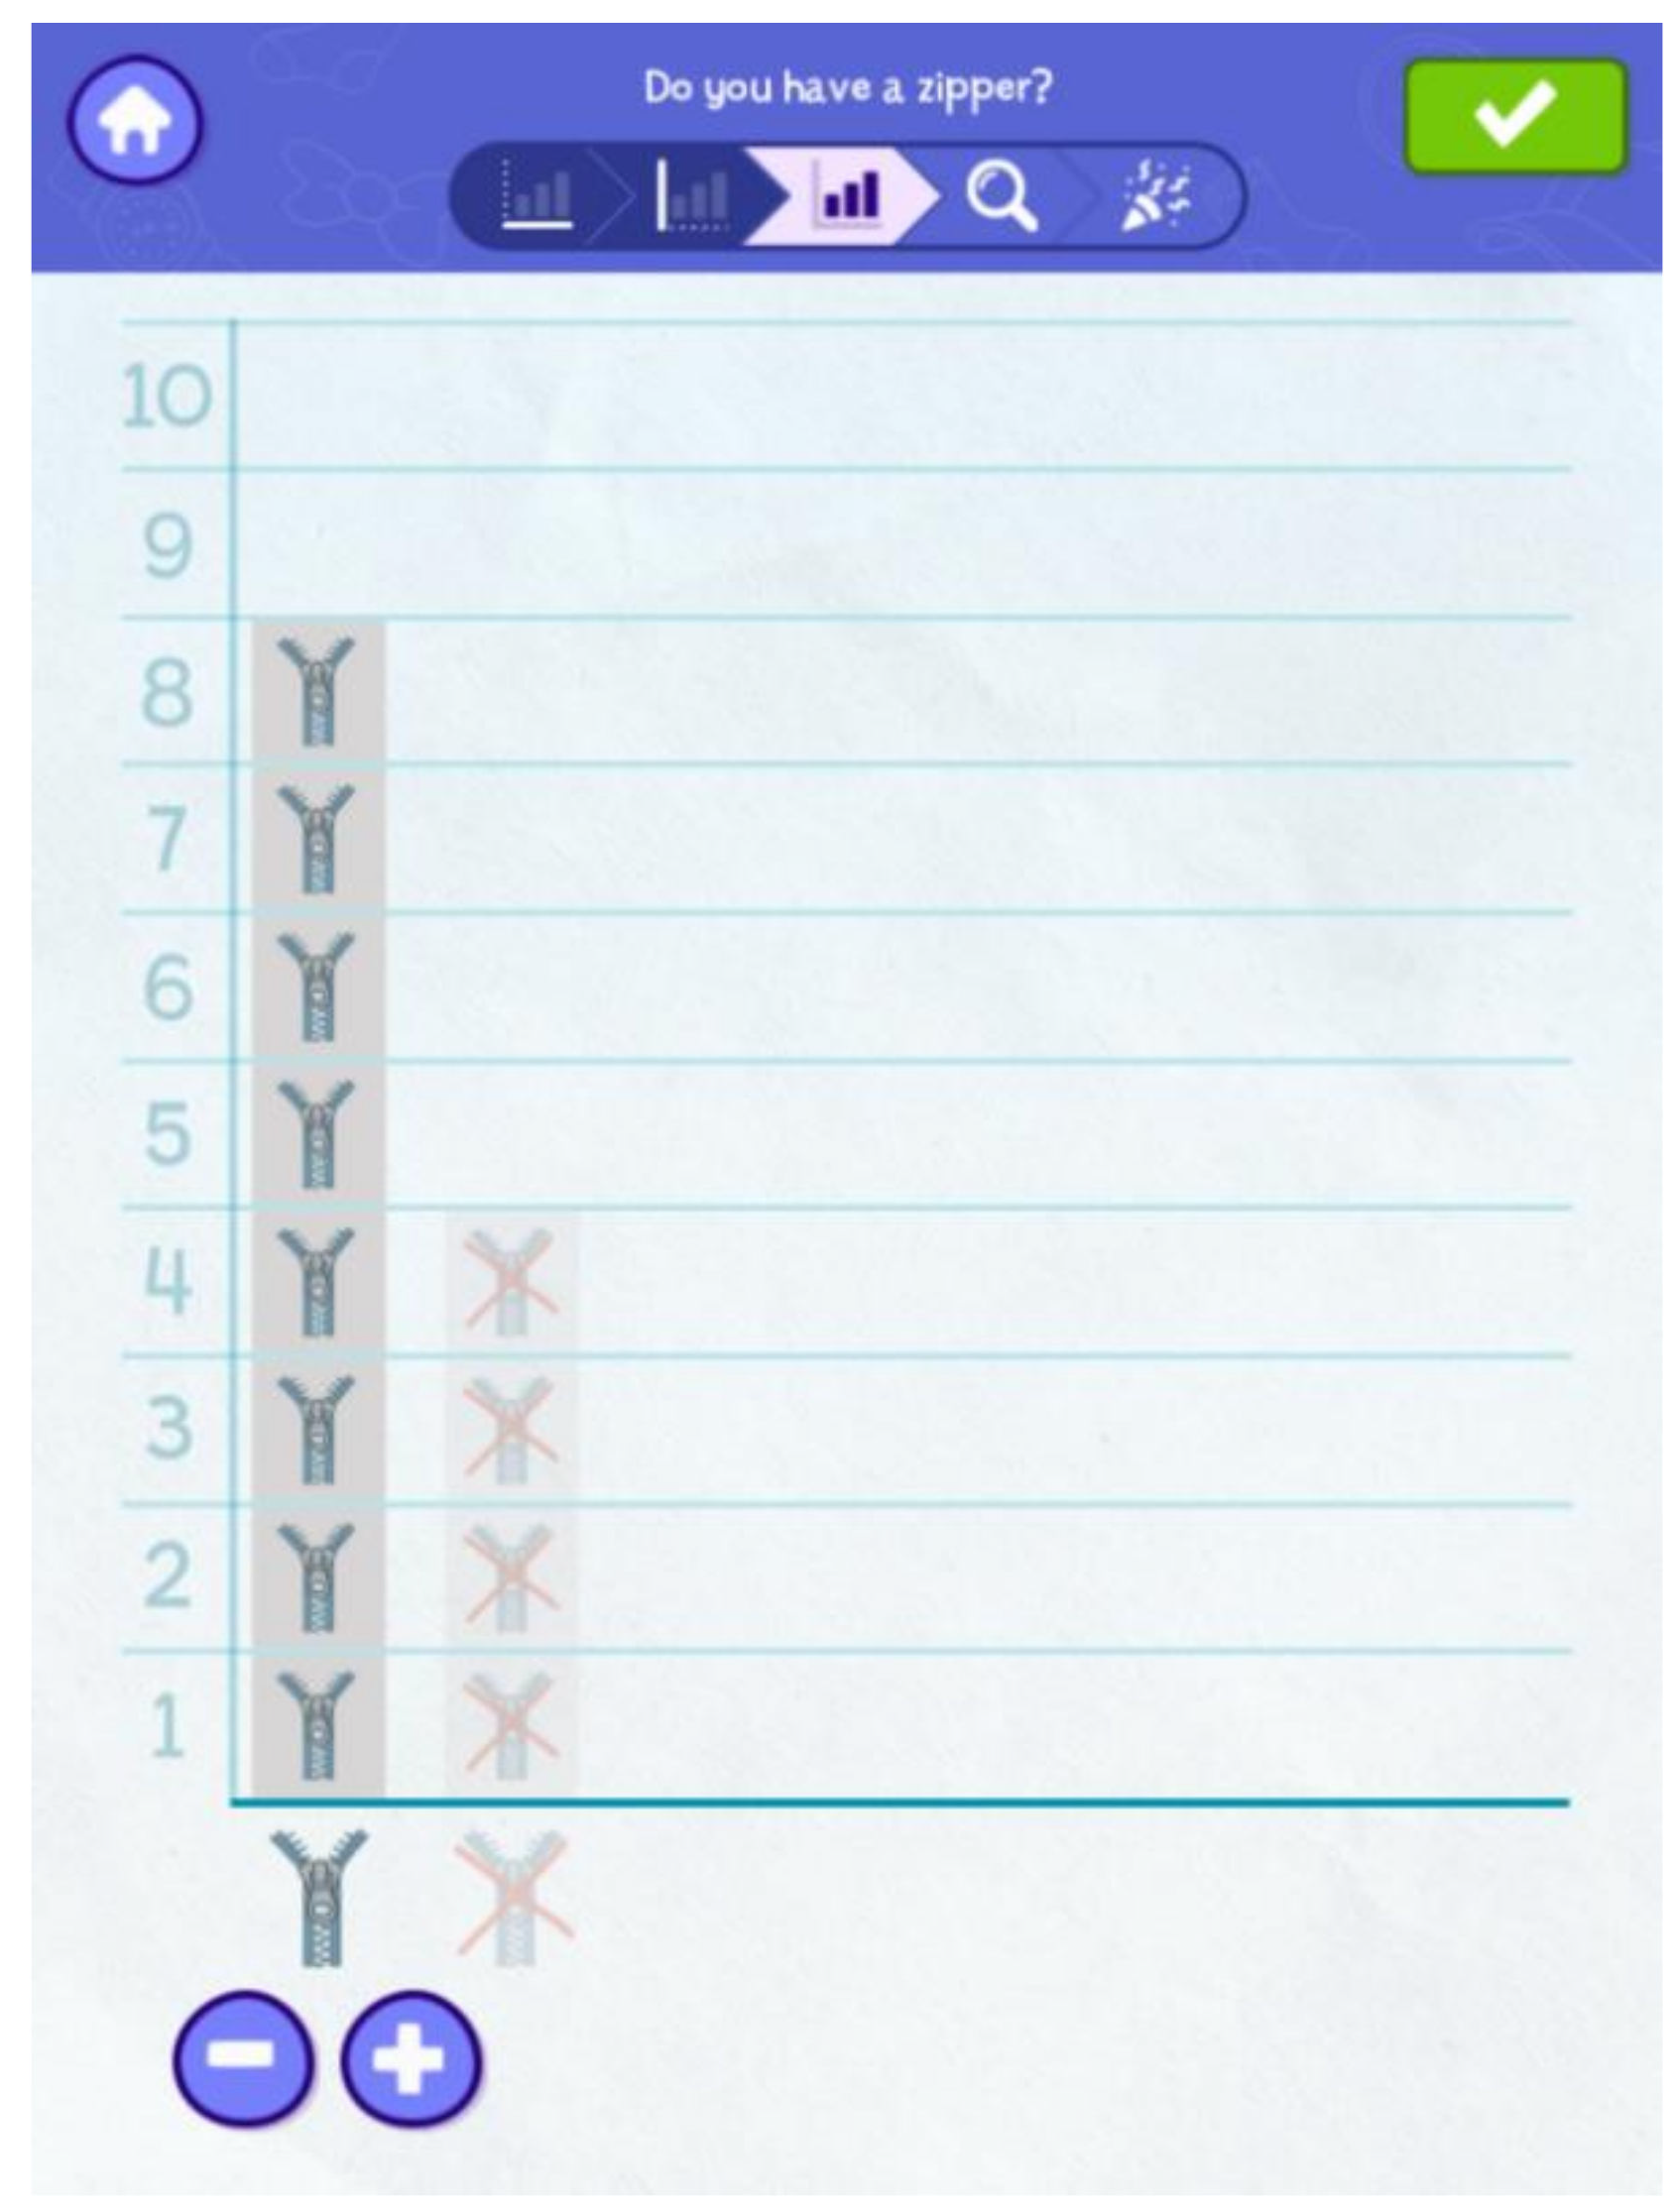
Figure 3), and select the range (
Figure 4). After teachers and children enter data (
Figure 5), they talk about the data while using the analysis page (
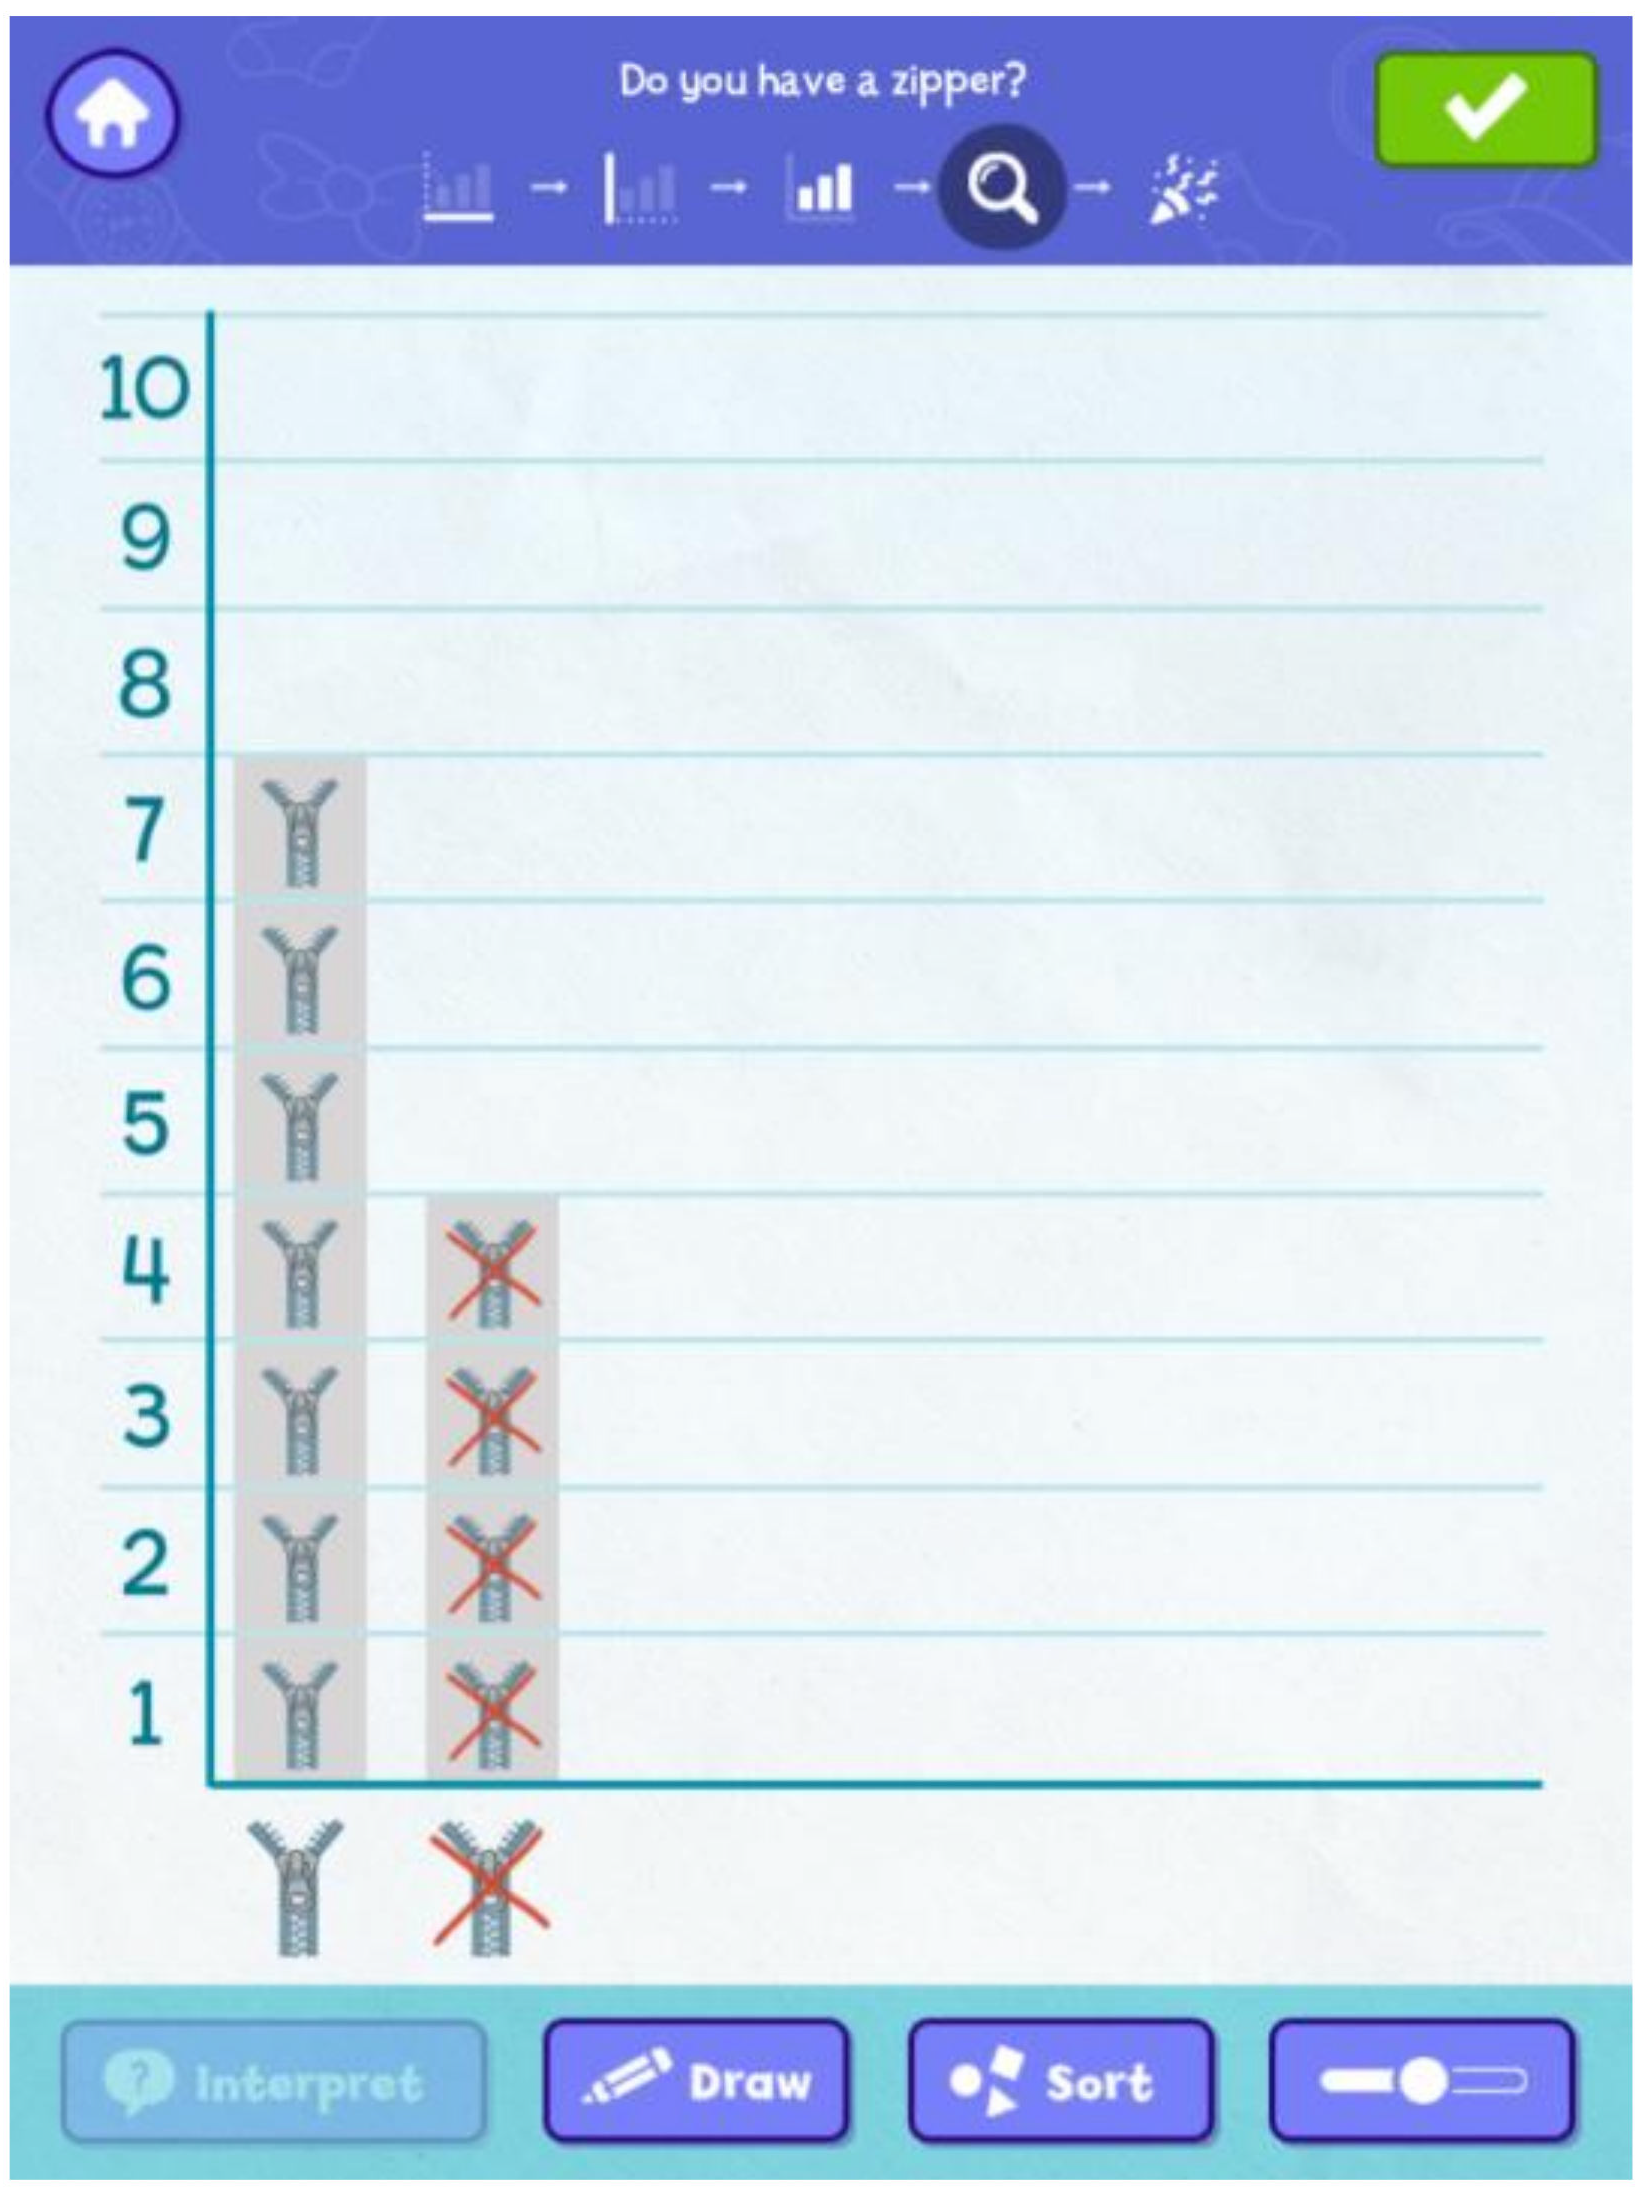
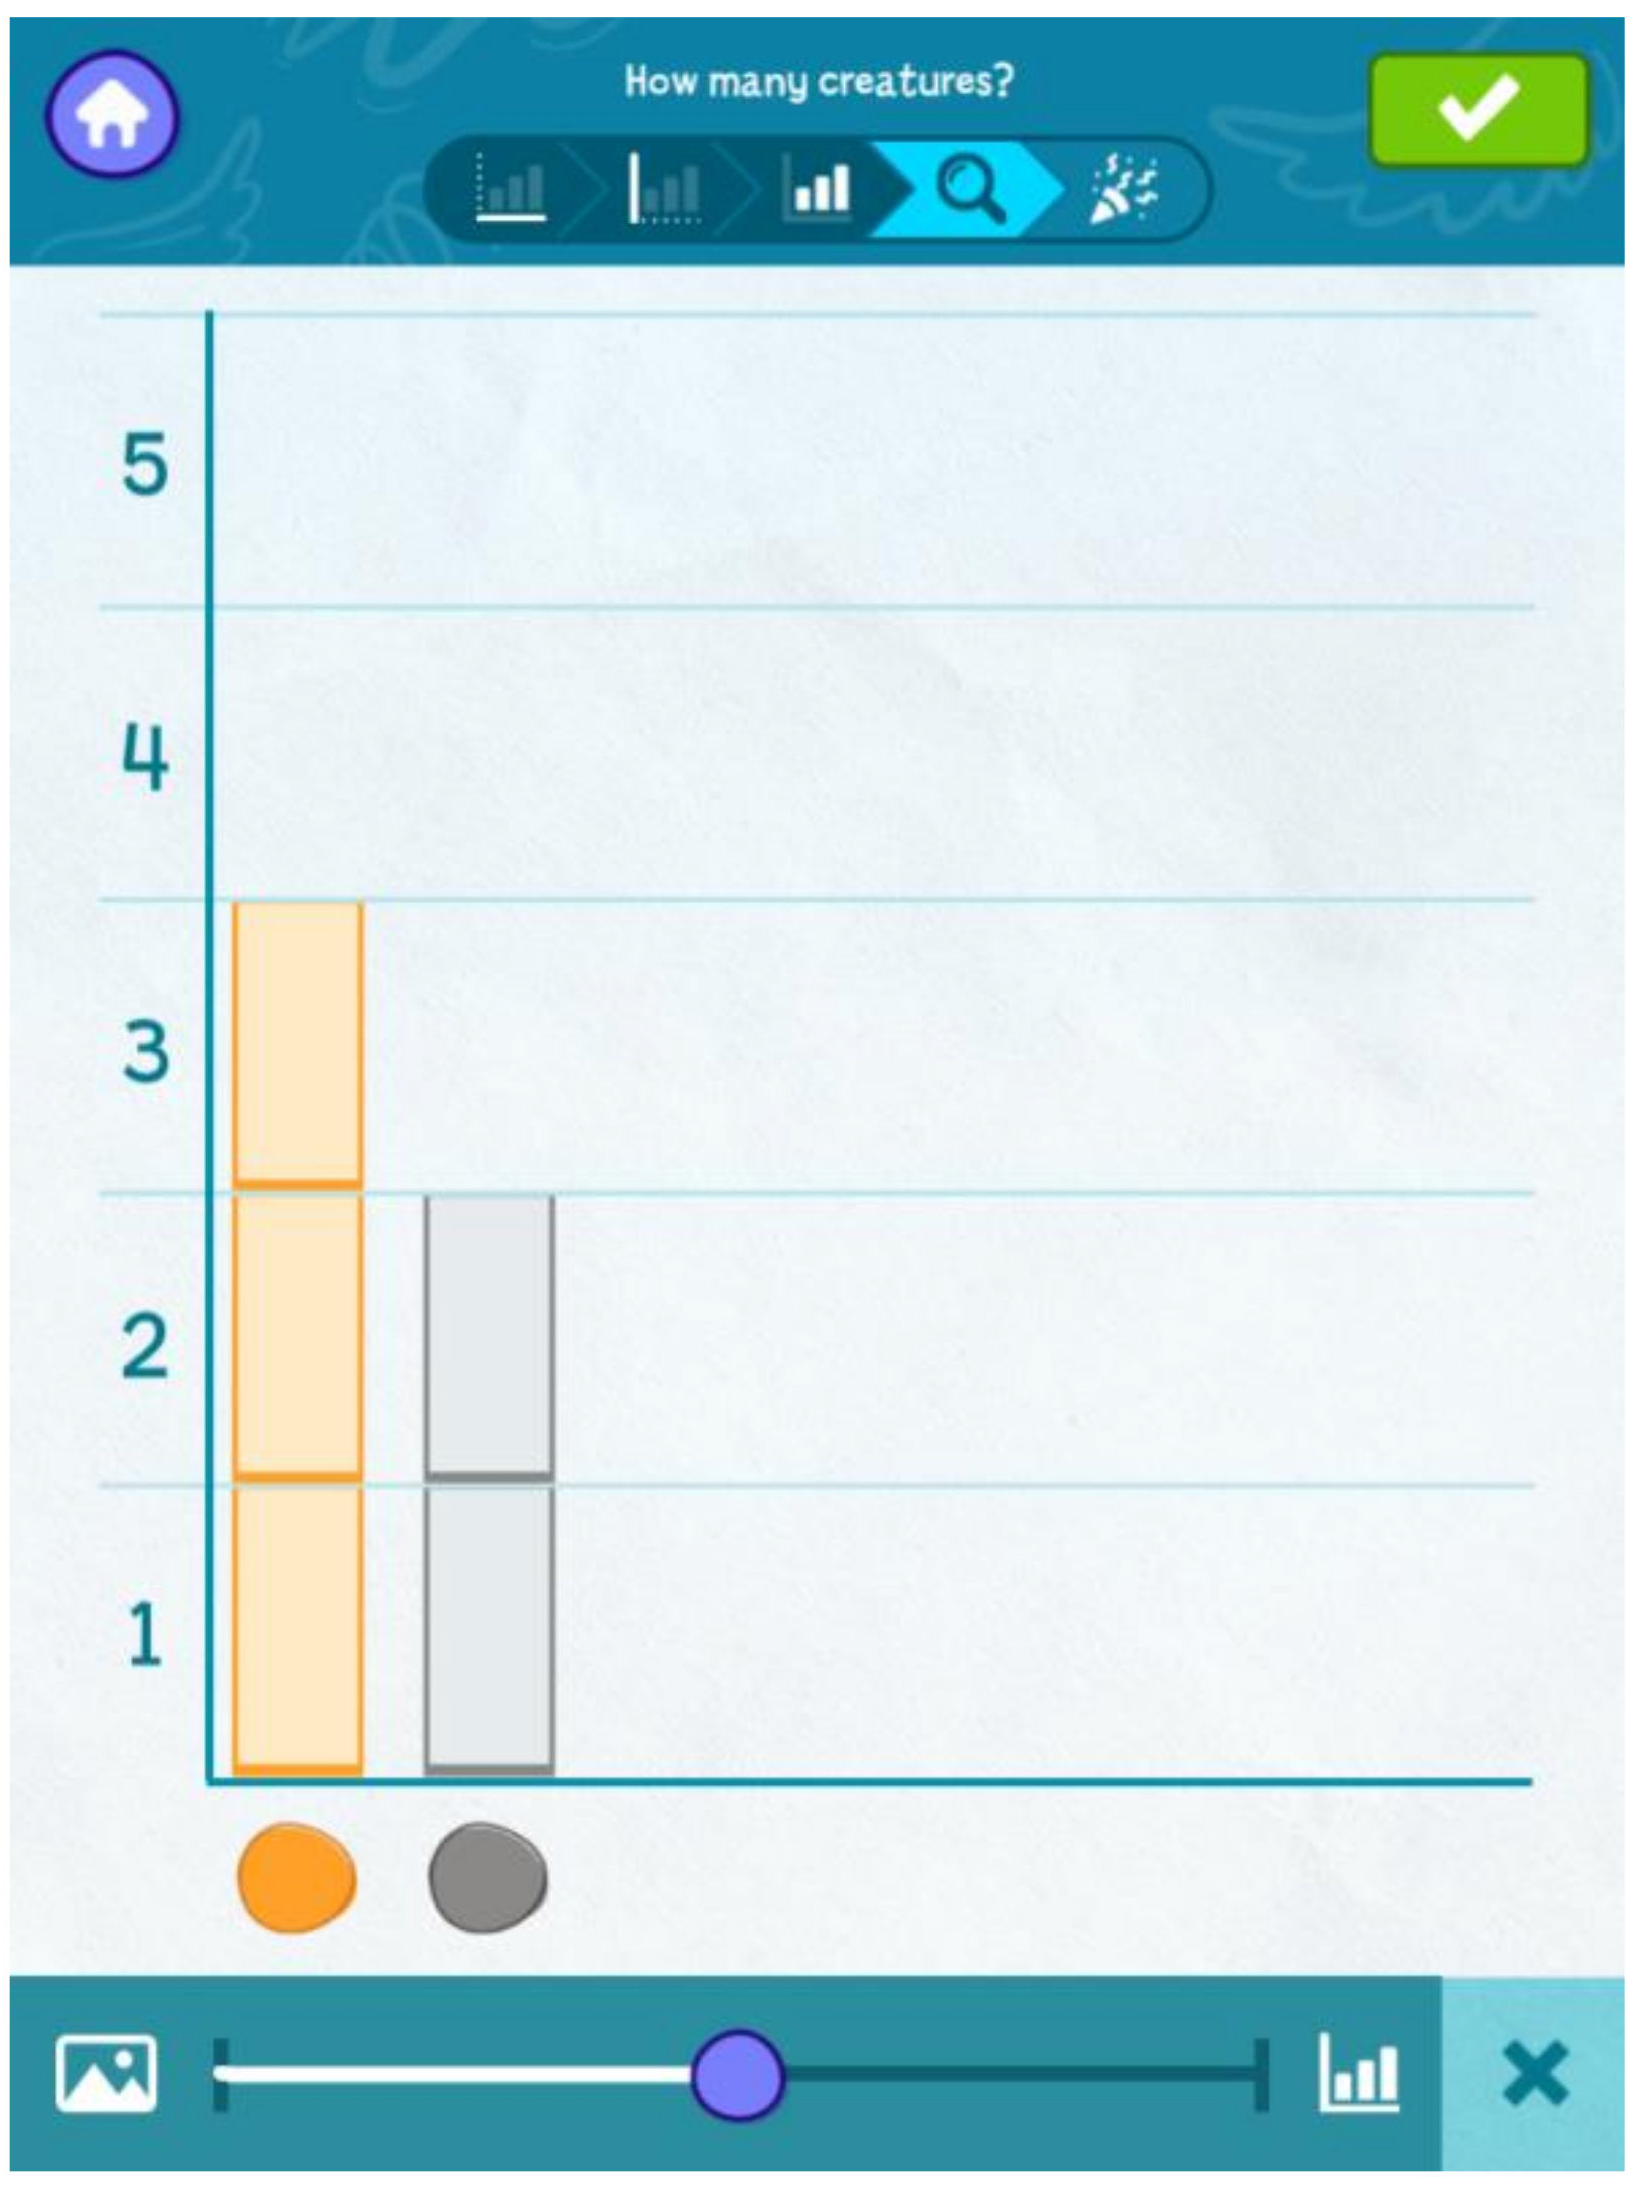
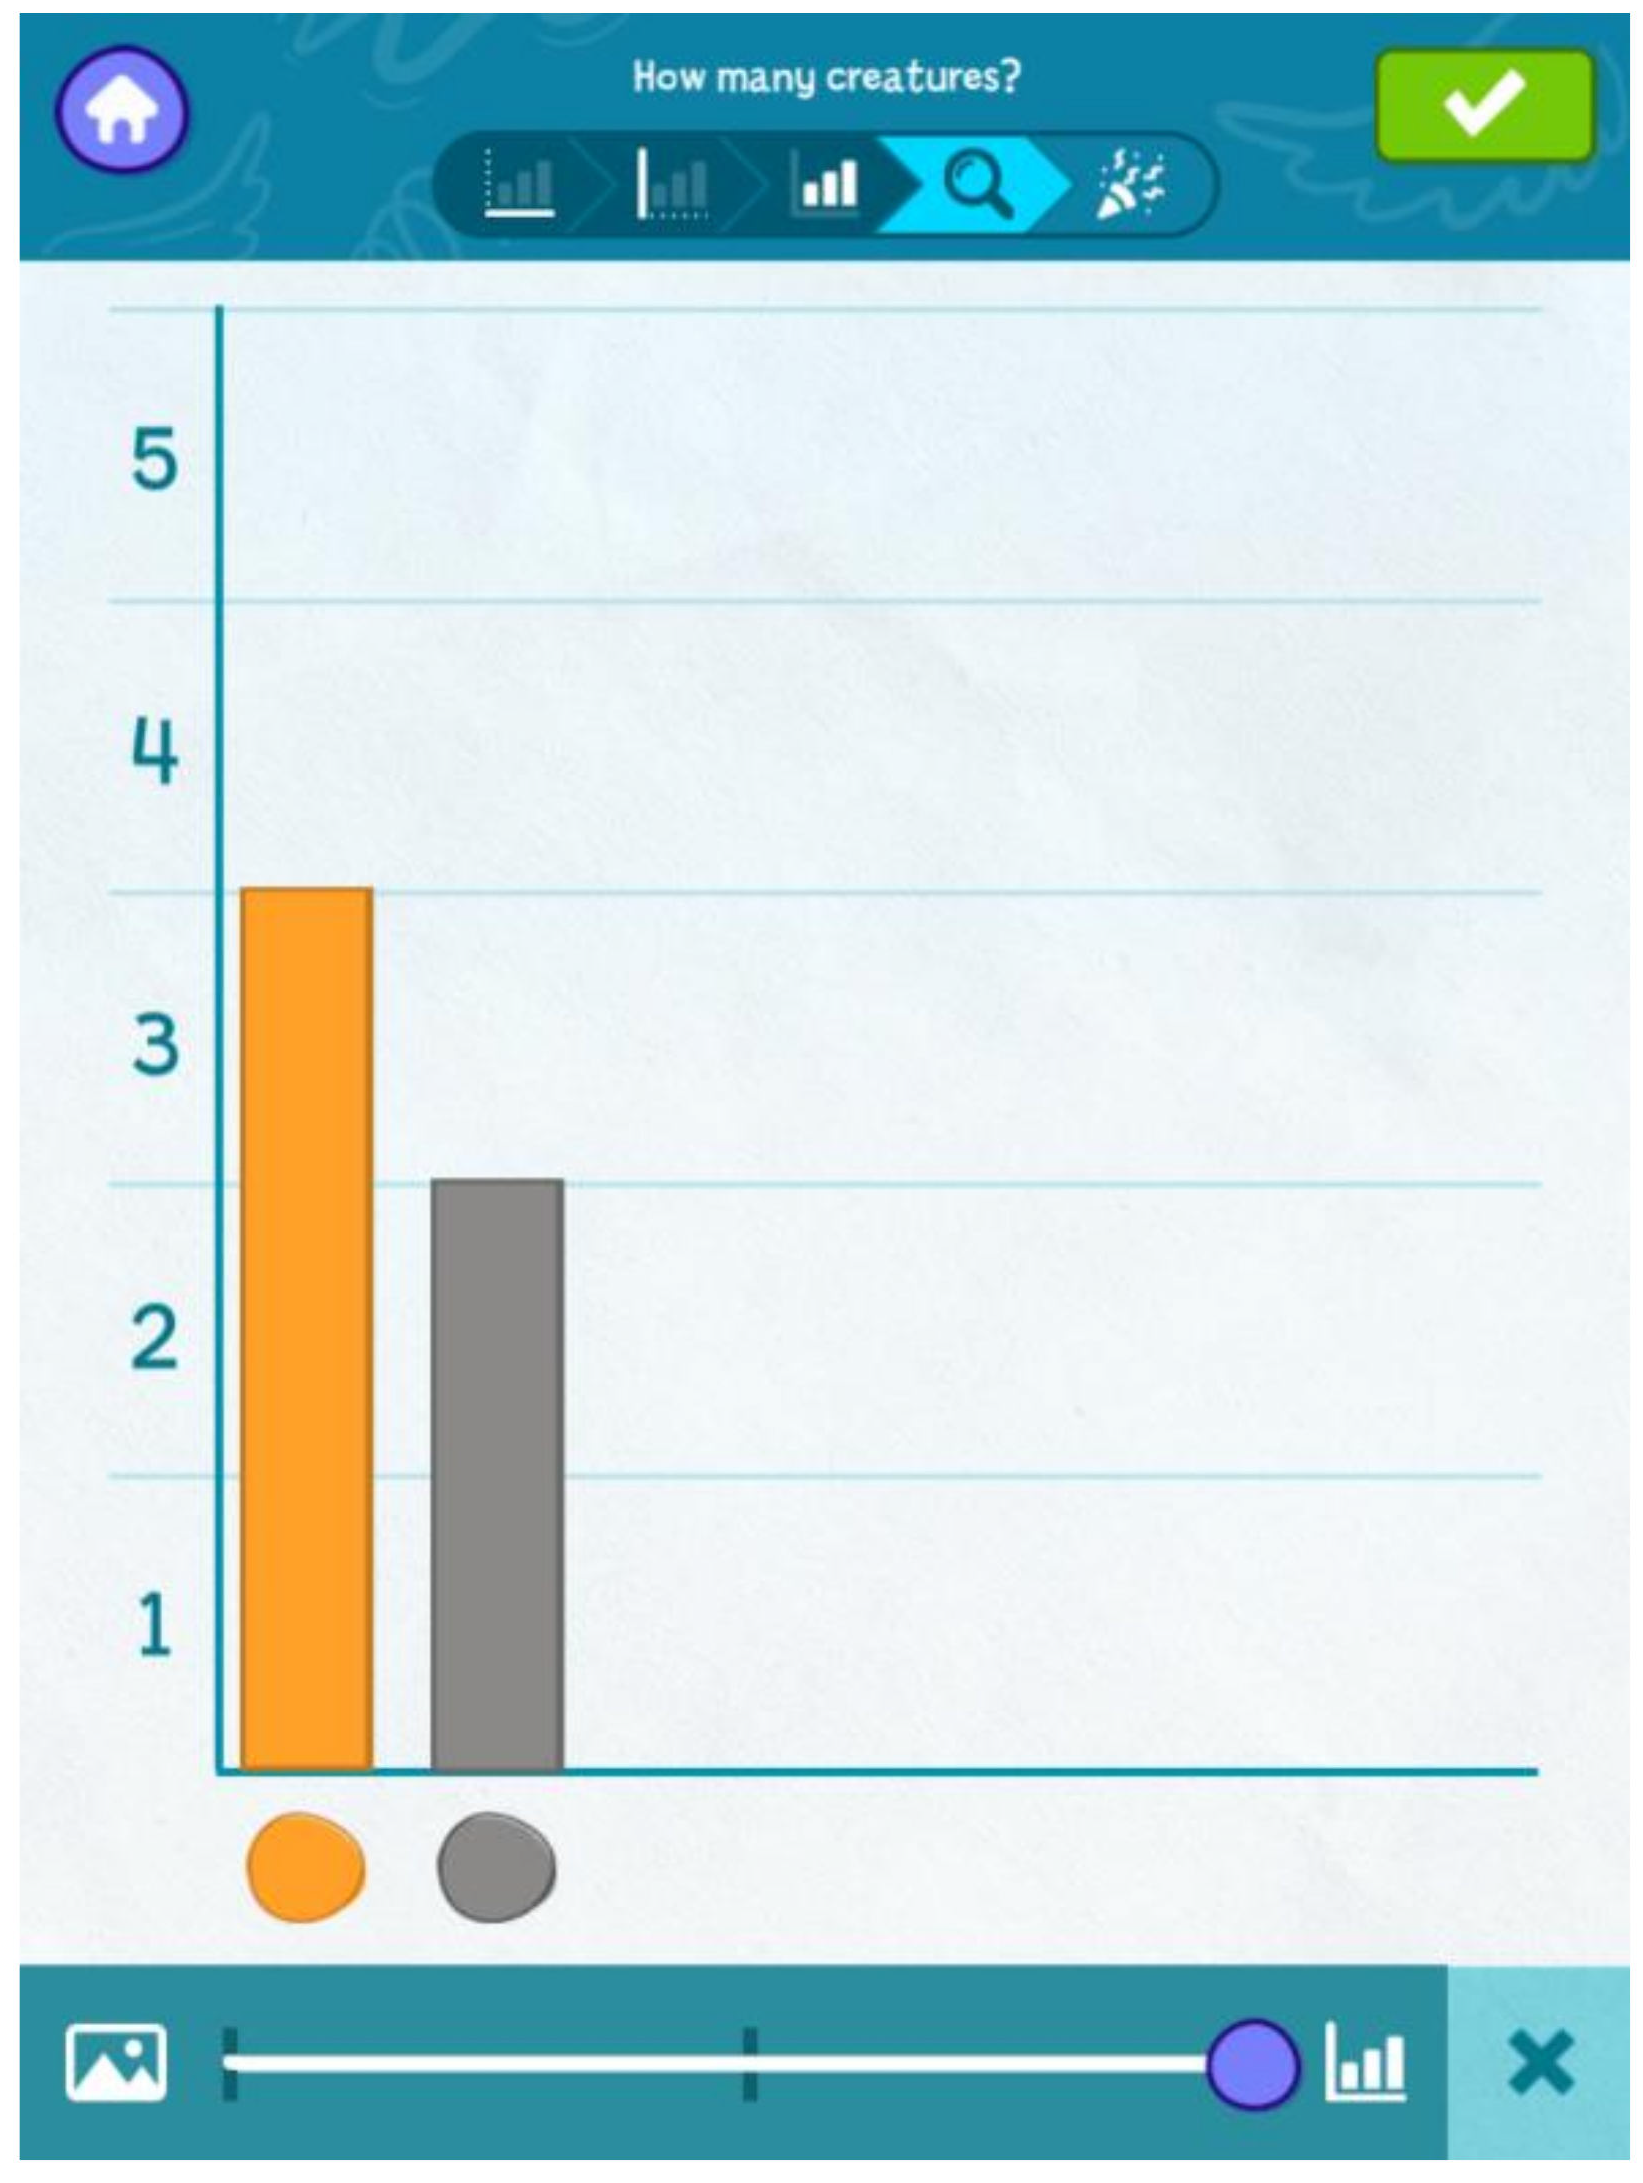
Figure 6), which includes features that allow the user to draw on the screen, sort variables (i.e., ascending, descending, manually), and use the slider to turn a pictograph into a bar graph. This version of the app did not include the “interpret” button with data talk questions, which were included in the next app version. For example, at the bottom of the screen in
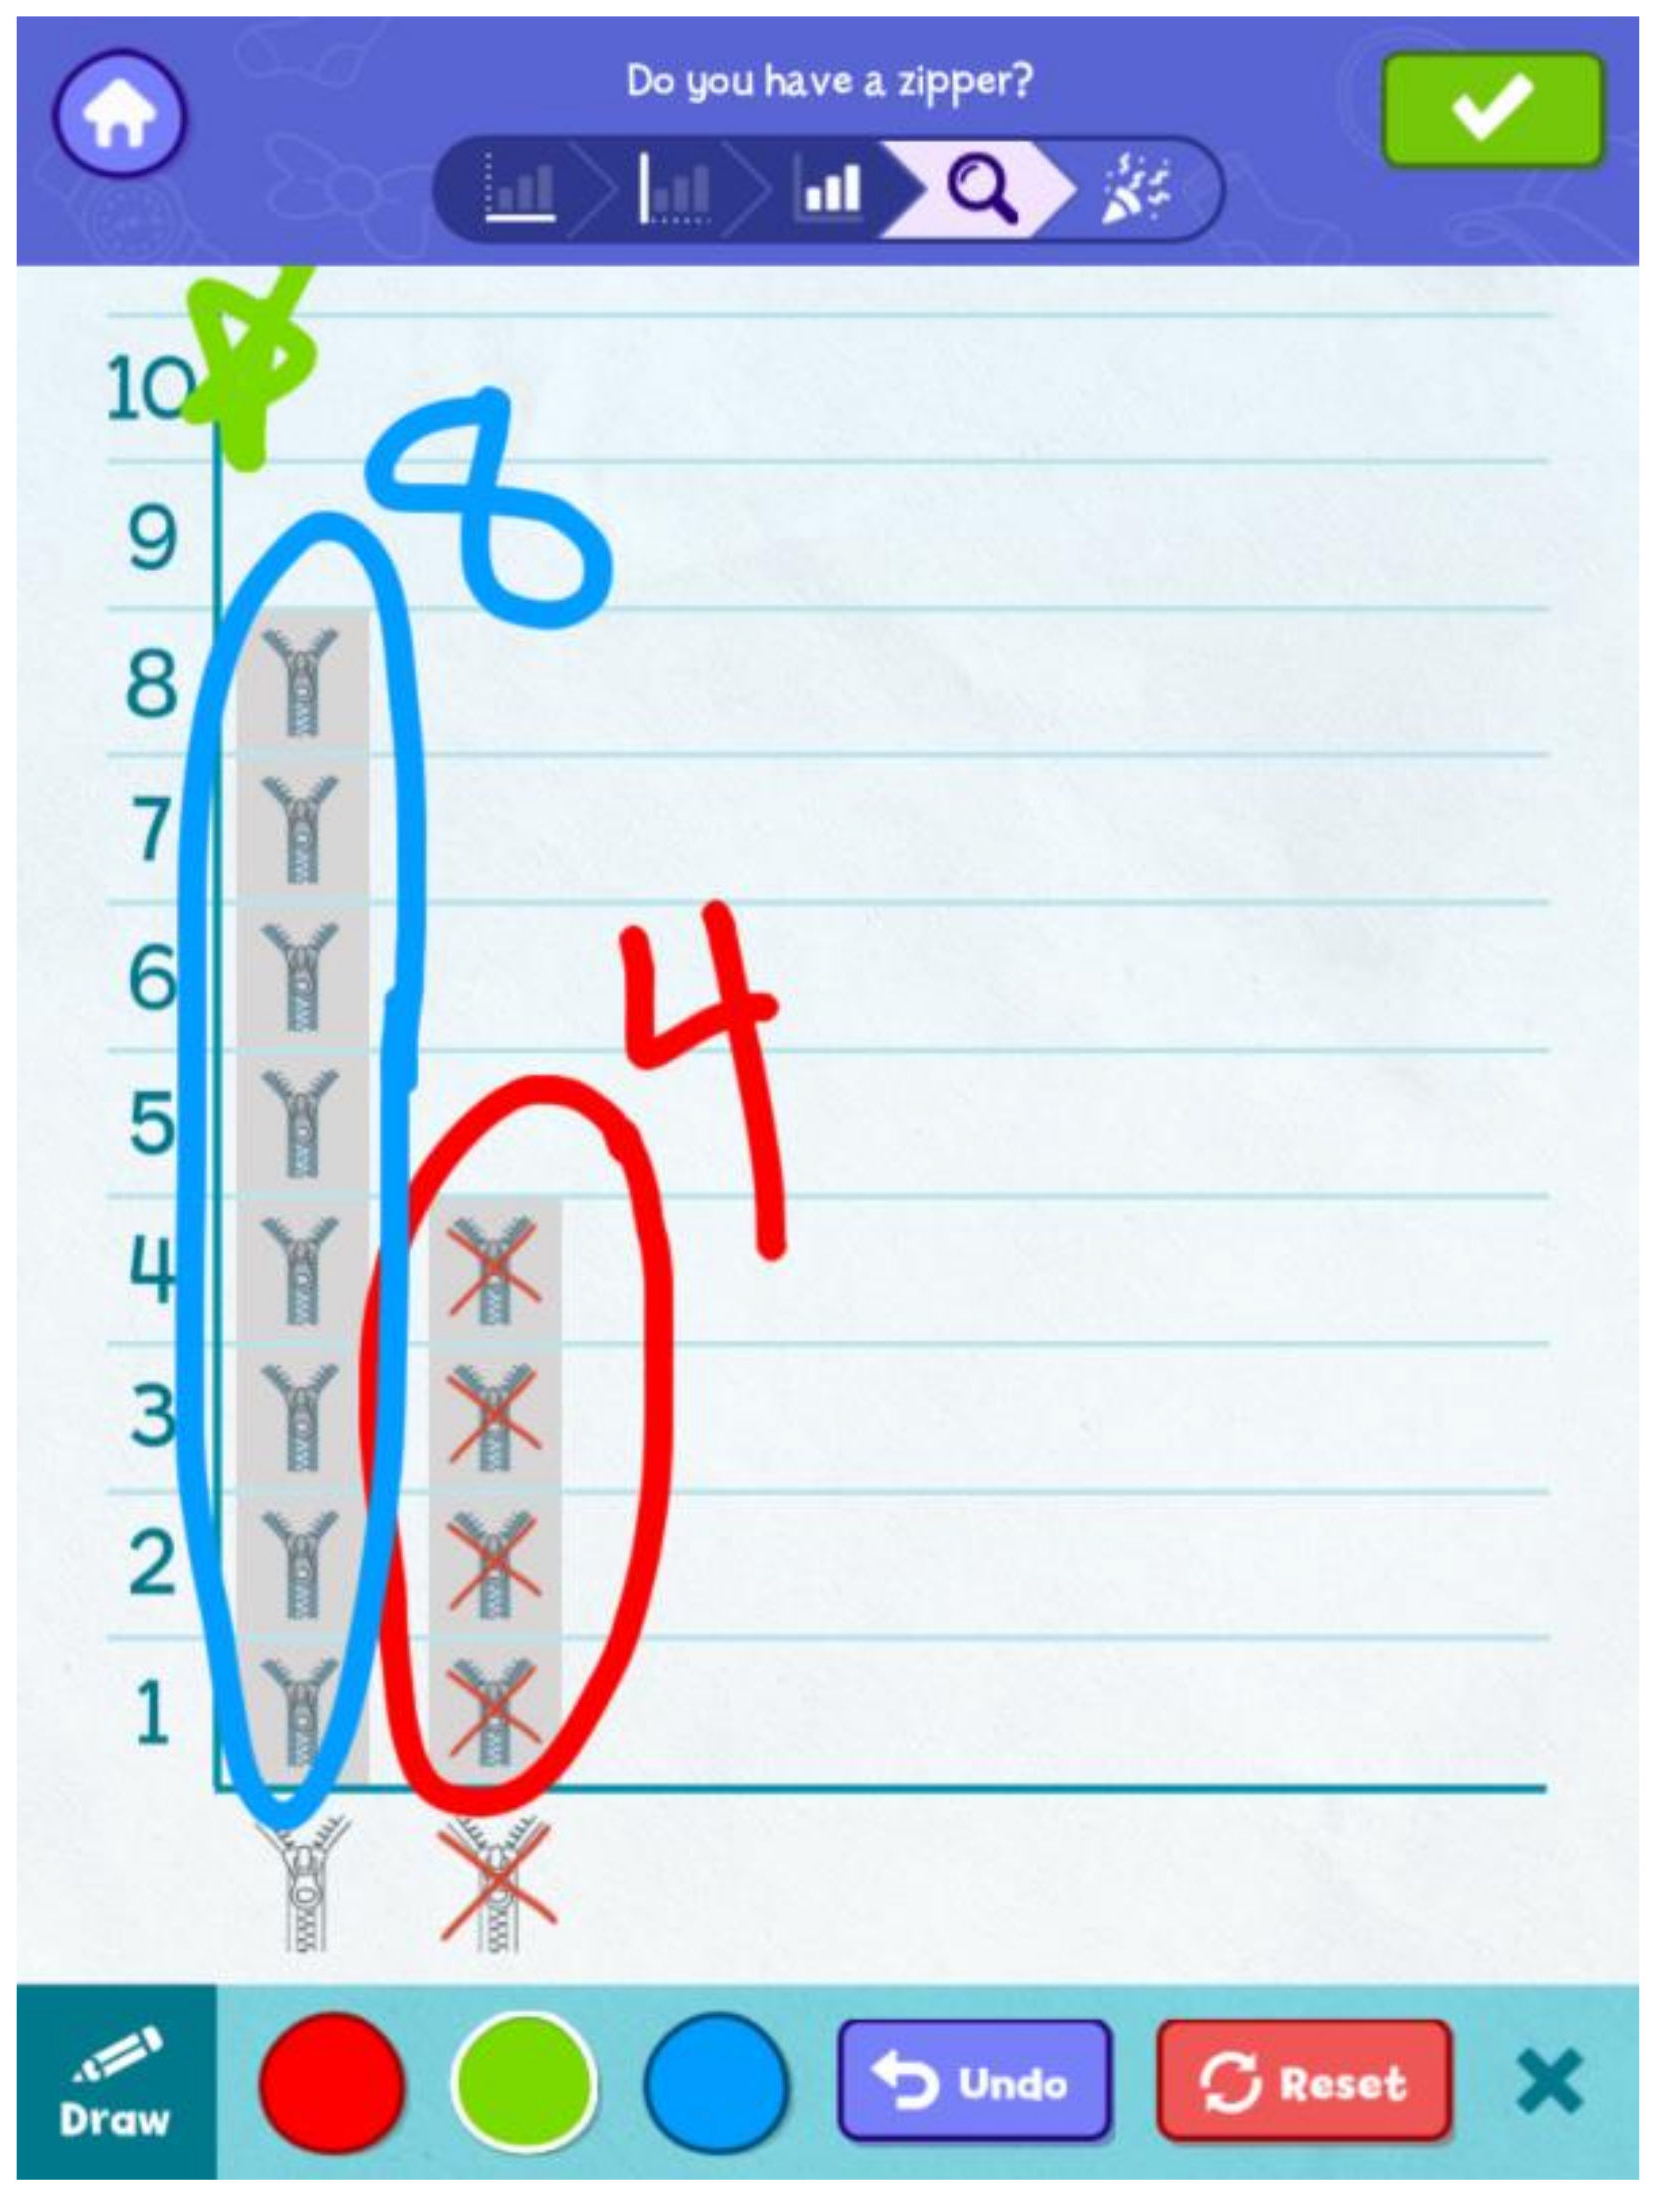
Figure 6, the teacher taps the “draw” button while asking the children how many are in each column and with their verbal responses, the teacher then writes the number above each column (see
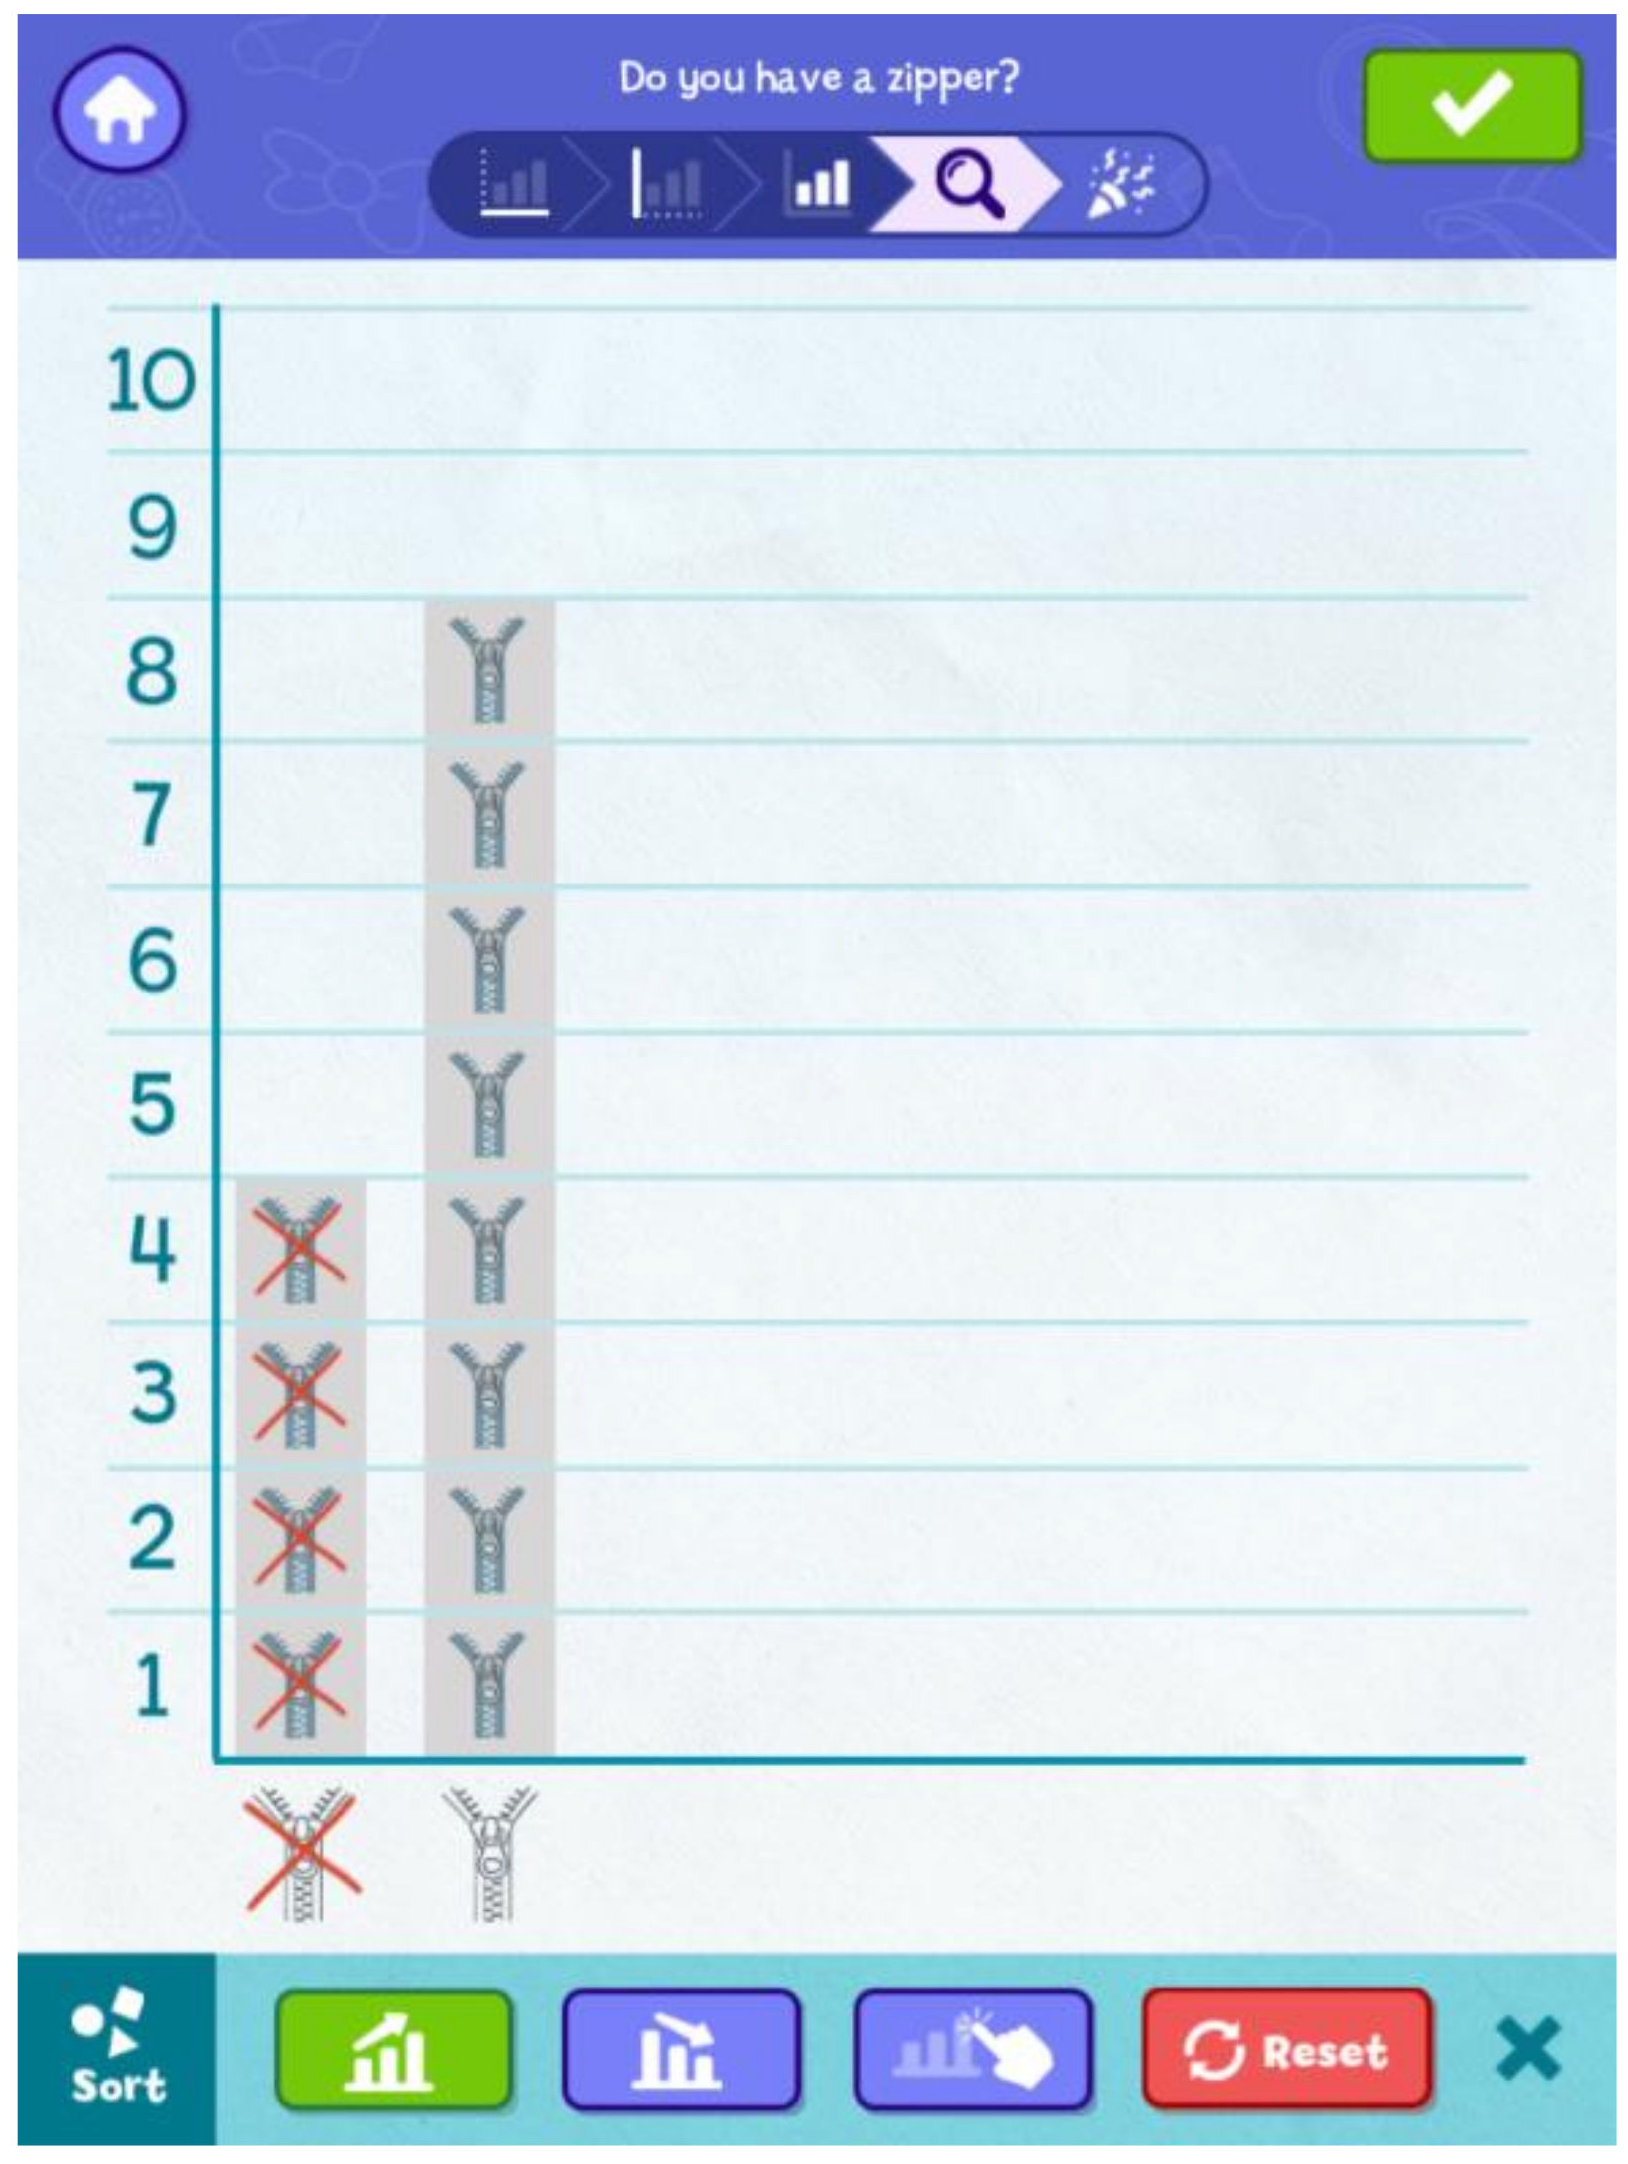
Figure 7). Then, the teacher asks the children which group has the most and places a start above that column. The teacher can also use the sort button (
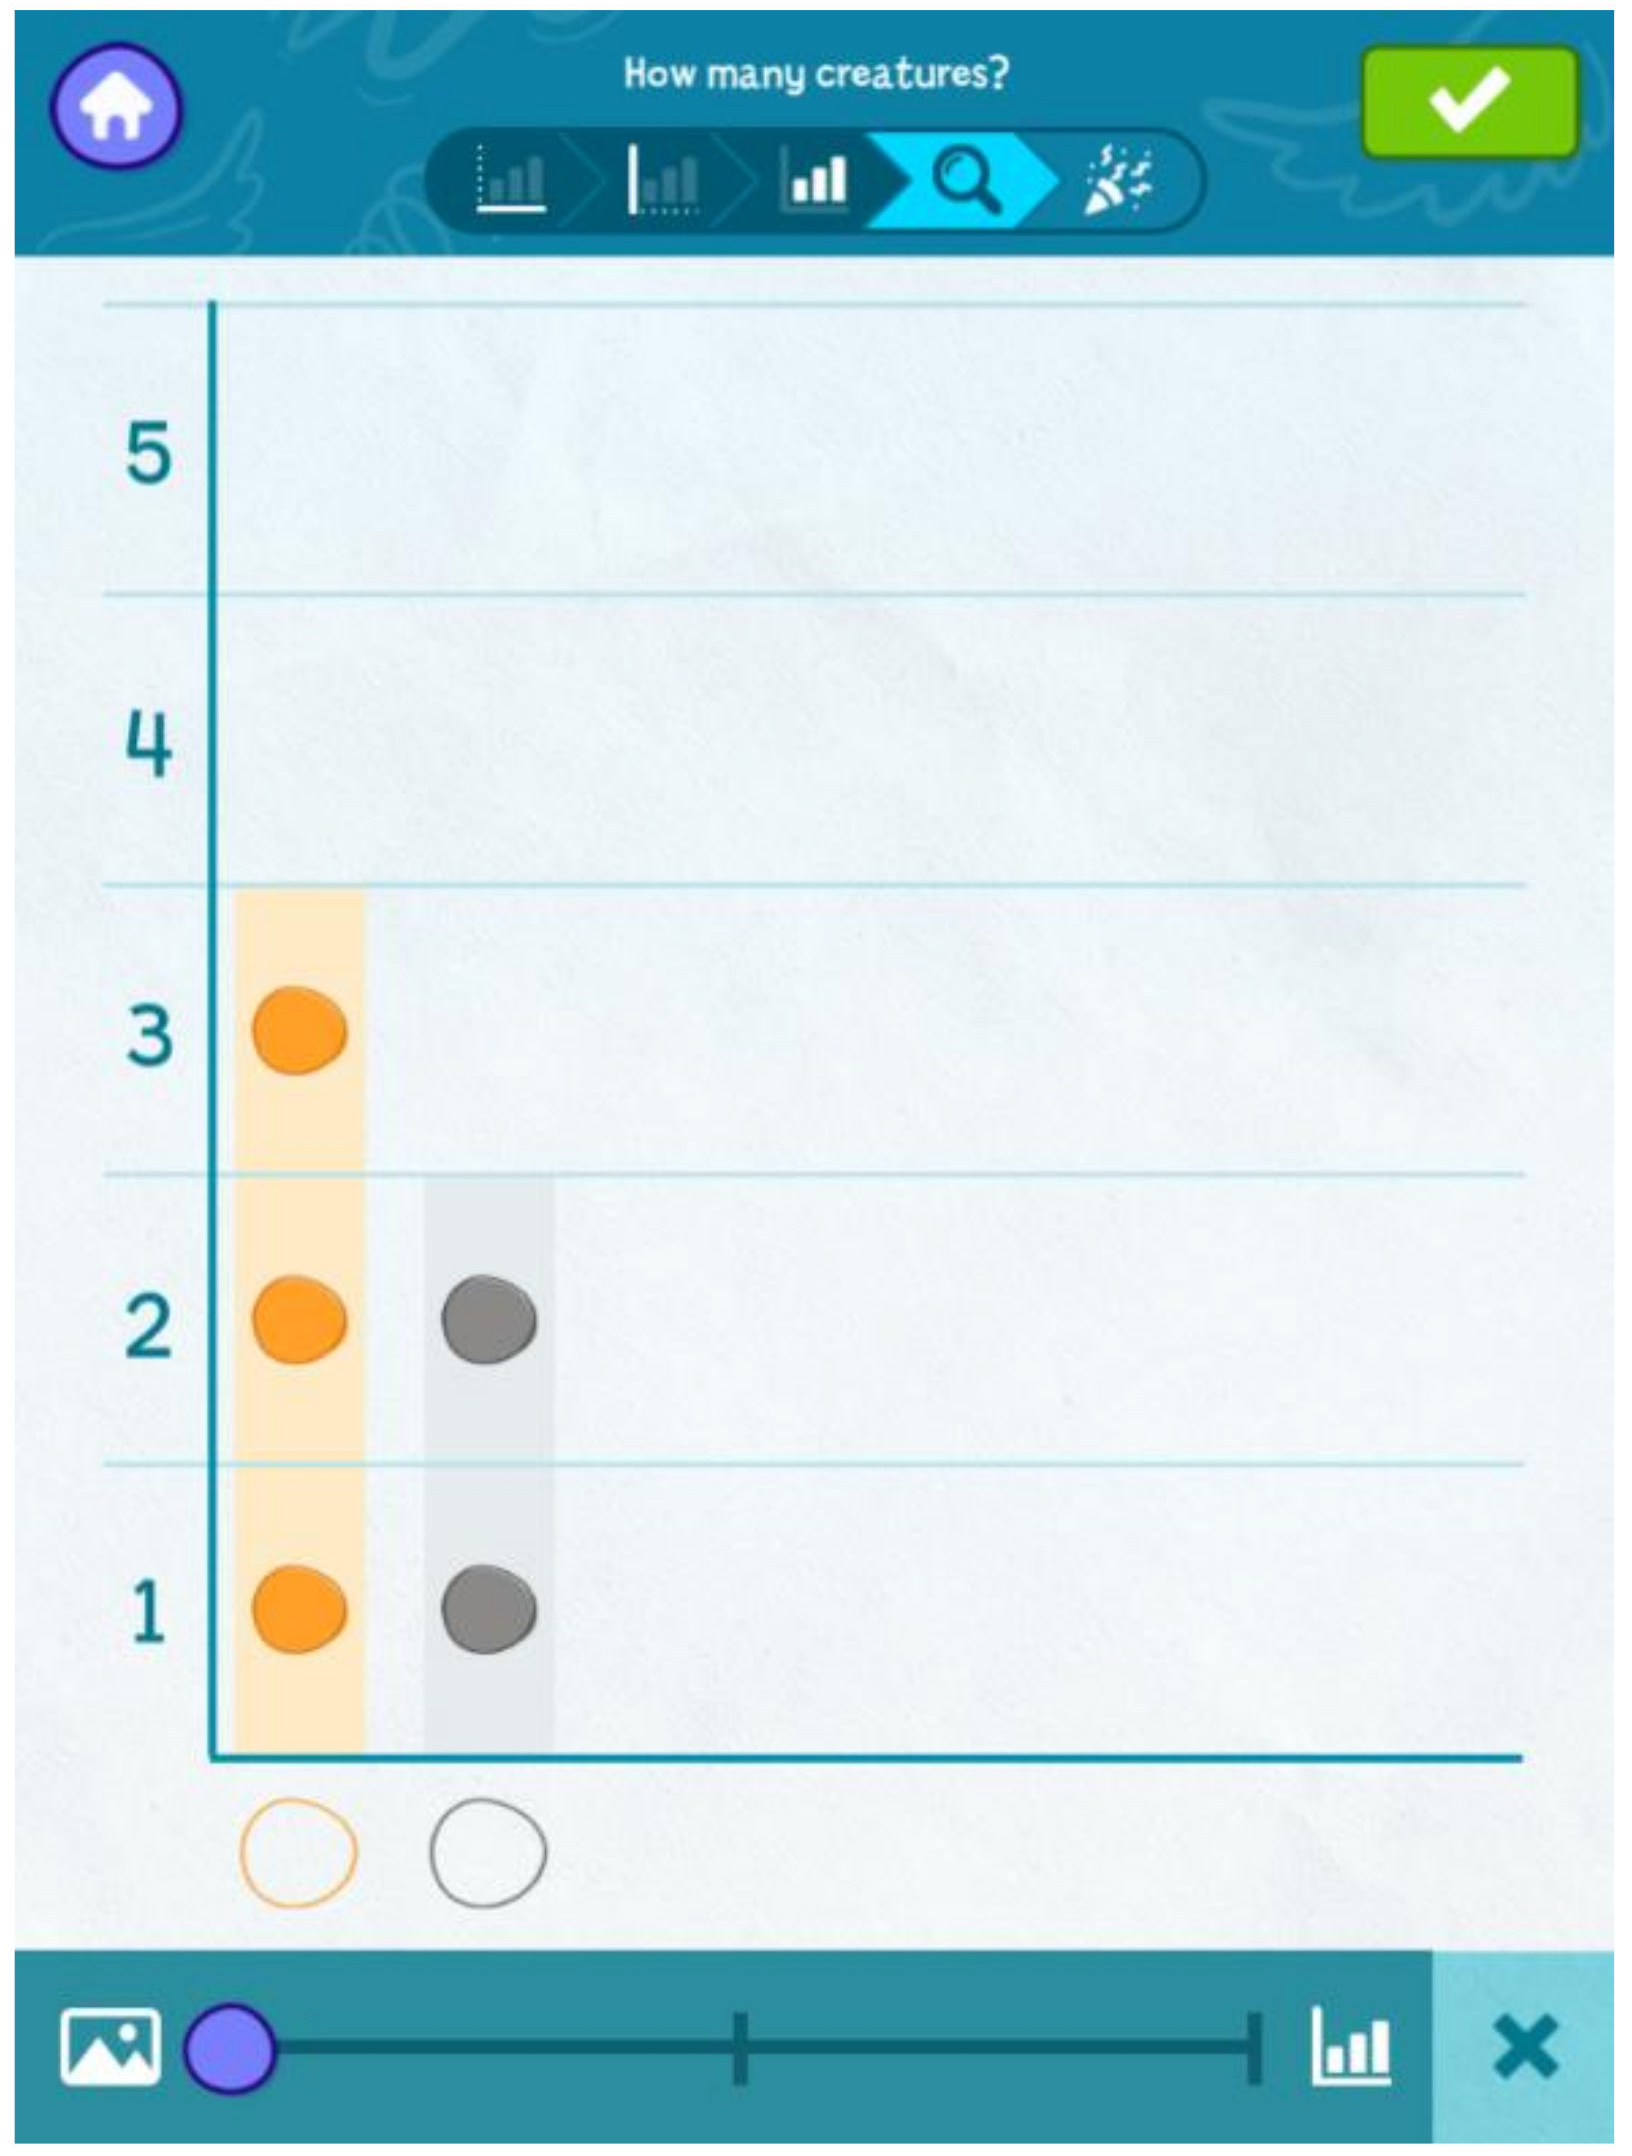
Figure 8) to rearrange the columns in (a) ascending order (button with arrow pointing upwards), (b) descending order (button with arrow pointing downwards), or (c) any other order using the “drag and drop” (button with finger over graph) function. The teacher can also tap the slider button to convert this pictograph with the zipper and no-zipper icons (
Figure 9), to a box for each data point (
Figure 10), or a full bar graph showing the total number of units (
Figure 11).
2.6. Professional Development
To support their implementation, teachers attended four remote professional development sessions with researchers, held with videoconferencing software (e.g., Zoom or RingCentral). Each session lasted approximately one hour. Teachers were provided with printed copies of each lesson and digital copies of the professional development slides. The first session introduced the goals of the study, explored the mathematics and CT skills involved in preschool DCA, and introduced the first investigation. The second session collected feedback and answered questions that arose from initial implementation, and then introduced investigations 2–3. The third session covered the remaining three investigations. The final session was collaborative and gave the teachers time to brainstorm and talk through their CYO and DYO investigations; teachers shared their ideas for research questions and themes that lent themselves well to using the skills of DCA. Researchers took note of the questions teachers asked in order to answer them and integrate revisions into future professional development sessions.
2.7. Research Design
This exploratory project used a design-based implementation research (DBIR) approach and included three cycles of iterative development. We utilized an evidence-based curricular design framework to guide the investigation design process [
37], which is a DBIR approach leveraging diverse perspectives from researchers, curriculum developers, teachers, and advisors throughout development [
38]. A learning blueprint articulated the mathematical and CT learning goals that anchored the development of both the intervention and child assessments, ensuring a consistent focus on the learning goals. The blueprint built on prior developmental learning trajectories research [
12] for DCA, including early trajectories of numeracy, counting, ordering, and comparing, and synthesized research on CT skills related to data [
6]. Findings from each round of research informed the iterative changes. After conducting interviews and surveys with preschool teachers (Study 1) to receive feedback on our prototypes of the app and curricular investigations, a full version of the intervention—investigations and digital app—were created and tested in this study (Study 2). This design study piloted the intervention to test its feasibility and initial promise while also identifying any challenges that required revision to the intervention activities and teacher supports.
2.8. Instruments and Analysis
2.8.1. Classroom Observation
Teacher’s video-recorded curricular implementation within their classrooms and these videos were coded by researchers to examine the DCA processes that occurred, including evidence of mathematics learning and data-focused discussions, children’s engagement, use of the digital app, and implementation challenges. Teachers recorded each activity in the intervention with a second tablet on a tripod and uploaded those videos to a secure site. Researchers then coded each video individually. Recorded activities varied in frequency, depending on when teachers implemented the activities with their children. Overall, there were 77 coded videos (totally 10 h and 9 min), with each classroom ranging between 14–24 videos. The total hours of video ranged from 1.81 to 3.08 h (Classroom A = 3.08; Classroom B = 3.04; Classroom C = 1.81; Classroom D = 2.97 h of video). In some cases, teachers recorded multiple activities in the same video and in other cases teachers recorded each activity separately; for example, an investigation with three activities may generate one to three separate videos.
For each coded video, researchers used a consistent protocol that asked raters to (1) create a running record of the session; (2) quantitatively code math content in terms of whether the teacher prompted the use of the content, children engaged with the content, and whether children demonstrated understanding of the math content; (3) quantitatively code aspects of implementation (e.g., group size, pace and length of activity, level of child engagement, and use of data talk questions); and (4) qualitatively describe math that was observed, child engagement, challenges with implementation or technology, and note suggestions for revision. Due to the small sample of classrooms, quantitative codes were summarized descriptively. This data was combined for each investigation to create individual investigation reports and these reports were used to qualitatively describe themes in implementation and suggest revisions to the intervention. In addition to these themes, we calculated the percentage of observations in which quantitatively coded items occurred; for example, the percentage of observed videos in which children engaged in sorting.
2.8.2. Teacher Interview and Survey
Teachers completed a one hour interview and online survey at the end of the study that included open- and closed-ended questions to elicit feedback on the app, the developmental appropriateness of the investigations, the clarity of lesson plans, teacher perceptions of how well each investigation met its learning goals, and teachers’ overall experiences. In addition to asking about the intervention and app, interview questions asked about each investigation to obtain specific feedback used in the revision process.
Teacher interview findings were analyzed qualitatively. Response to teacher interview questions were coded based on each question, then further summarized across questions to generate themes related to each research question. Teacher survey questions consisted of open- and closed-ended questions. Quantitative, closed-ended questions underwent descriptive analysis to describe the frequency of responses. Open-ended survey questions were summarized across teachers and triangulated with themes from the interviews. Feedback from the interview and survey related to the app was summarized and provided to the app development team to inform revisions. Feedback from the interview and survey that pertained to each investigation was summarized and provided to the curriculum revision team.
2.8.3. Child Assessment
The research team developed a one-on-one, direct assessment of preschoolers’ skills in DCA. The administration of this assessment was used to help develop evidence of the adequacy of the item’s difficulty and feasibility of implementation, in addition to learning about how children changed in their responses from the beginning to the end of this pilot study. Because of pandemic-related restrictions on in-person research, it was designed to be administered via videoconferencing, presenting stimuli using an animated PowerPoint presentation and asking children to respond verbally by choosing an image or providing brief open-ended responses.
Based on the blueprint described above, the assessment focused on learning goals directly related to DCA (e.g., describe what different parts of data visualizations represent) and other precursor math skills (e.g., organize objects into 2 groups that represent categories). One pre-item was given, which asked children to identify animals by color, to ensure they could refer to these colors to give responses on subsequent items. For example, three items showed three squirrels—yellow, red, and blue—and asked the child to identify which one had the most acorns. After a second training item ensured that children could identify correctly the top, middle, and bottom boxes, they provided responses by picking a box shown on the screen to answer the questions (i.e., “Where should I put this one [marble on screen] to sort it by color—in the top, the middle or the bottom box?”). DCA specific items displayed a series of graphs and answer questions about which had the most, fewest, identify how many, and interpret how to use that data to answer a question (e.g., viewing a chart with votes for a class pet and determining which pet the class should get).
The initial version of the assessment consisted of 41 items and took an average of 22.70 min to administer over 1 to 2 testing sessions. All items (or sub-parts of items) were scored as correct (1) or incorrect (0). Items had a good range of difficulty, ranging from 0.03 to 0.97 with a mean of 0.55 (SD = 0.28). Based on item analysis of pre-intervention data and assessor report, minor modifications were made to the assessment for post-intervention testing (removing 2 item sub-parts that were too easy, adding 2 item sub-parts to increase difficulty, and revising 5 visual stimuli and 4 verbal prompts for clarity). Only the items and sub-parts that were common across pre- and post-testing were included in analysis. Scale scores were calculated by averaging scores across items to create a proportion correct. The scale had good internal reliability at both pre- and post-intervention (Cronbach’s alpha of 0.87 and 0.88). Although there are known challenges with the use of Cronbach’s alpha, it can be effectively used as an indicator of consistency and evidence of instrument quality [
39]. To address the exploratory research question (#4), composite scores from the pre- and post- assessment were analyzed across time with a paired-samples
t-test.
3. Results
Qualitative data from the teacher interviews and surveys, as well as classroom observations, provided information about the use of the app affordances (e.g., the way the app scaffolded the process), ease of navigation with the app (e.g., how teachers and children used the app features, challenges encountered), engagement with the investigations (e.g., ease of integration into preschool classrooms), how participants engaged in data talks (e.g., how they talked about the data), the implementation (e.g., how app and lesson plans supported preparation and use), and the degree to which teachers felt the investigations were developmentally appropriate and taught relevant content. Quantitative data from the survey provided information on teacher’s responses about specific intervention aspects, such as the use of app tools, responses about pacing, developmental appropriateness, and ratings of investigation components. Finally, a composite score from the child assessment provided preliminary quantitative data on children’s responses to mathematics and DCA specific knowledge from the beginning to the end of this pilot study.
3.1. Research Question 1: Affordances of the DCA App (What Affordances of the DCA App Support Preschool Teachers in Engaging Students in DCA?)
3.1.1. The App Supported the Investigation Process
Results from the teacher interview and survey suggest that particular affordances of the app include DCA learning opportunities and experiences that would not otherwise be possible or easy to implement. Specifically, teachers indicated that the app supported them to answer data-focused questions by engaging children in a systematic process for data collection, data entry, and interpretation of data. Teachers also noted that the investigations helped them see how DCA can be integrated in the preschool context, with one teacher commenting that her students eventually began to make observations about graphed data without her prompting. For example, a teacher stated that “I thought that the investigations were really great ideas.” Another teacher said: “Doing these investigations and this study I think helped me and [co-teacher’s name] work on a whole different level of math. Before I always felt like we struggled with math…this forced us to focus more on math and take our normal curriculum and graph everything…it pushed us to focus more on math concepts and taking little things we would never have thought to graph and actually graphing it. And because they were exposed to it early on, it’s not like pulling teeth […] children just say what the graph tells us.”
Classroom observations also evidenced this, with each component of DCA—sorting information, representing data, creating data visualizations, describing and quantifying graphed data, and interpreting results—observed across all investigations.
Table 2 outlines how each DCA component was enacted during observations of the Hungry Caterpillar investigation.
Together, these findings suggest that the app scaffolded the DCA process and supported discussion and interpretation of data within each investigation. It allowed teachers to select the relevant investigation and research questions, enter data points to create pictographs and bar graphs, and use integrated and interactive tools to sort data into ascending or descending order, toggle between graph representations, and annotate the graphs.
3.1.2. Ease of App Navigation and Use
Teachers’ survey and interview responses indicated that the app was intuitive to use and easy to navigate (1 reported the app as “very easy” to use and 4 reported it was “easy”), and teachers liked that the app offered a new way for their students to collect and visualize data. Classroom observations also found that, although teachers were the primary app users, both teachers and children interacted with the app throughout the study. Across investigations, teachers selected research questions for their graphs, chose their x-axis category variables and y-axis ranges, entered data, and examined and discussed their completed graphs with students. When children directly engaged with the app, they most frequently did so by adding data to graphs (i.e., tapping “ + ” and “ − ” icons to add and remove data) and using the app’s slider tool (to transition between pictograph and bar graph formats), sorting tool (to arrange data in ascending or descending order), and annotation tool.
3.1.3. The Role of the App’s Tools in Supporting Implementation
Teachers reported that they valued the app’s tools and functions (i.e., the drawing tool, sorting tool, and the ability to transition between pictograph and bar graph formats) as these features allowed them to customize graphs on-the-fly based on their students’ interests and focus students’ attention on highlighted features to support learning. As shown in
Table 3, all teachers reported using at least one of the app’s tools during the study. Importantly, in the beta version of the app that the teachers used, tool usage was impermanent; for example, the graph annotations they created using the drawing tool were erased once they left the graphing screen. The teachers identified this as a limitation and requested an option to keep their graphs annotated or ordered (e.g., graph columns sorted in ascending order), which were subsequently included in the final app version.
3.1.4. Data Talk Prompts
Within the lesson plans for each pre-written investigation, a set of data talk prompts were provided. Results from the teacher interview and survey indicated the prompts were a strength of the investigations, with multiple teachers identifying them as a primary distinguishing factor between the DCA investigations and the activities they normally do. For example, one teacher said “We usually just ask the kids which has the most and least.” Examples of data talk prompts are provided in
Table 4. Although teachers valued the prompts, they did note that it was difficult to locate them in the lesson plans in-the-moment or to remember them off-hand. When asked about embedding the question prompts into the app, the teachers felt this would be a helpful modification; the updated version of the app now has the data talk prompts for each investigation built into its user interface.
3.2. Research Question 2: Engagement with Intervention (How Did Teachers and Students Engage with and Use the DCA Invertention (Investigations and Digital App?)
3.2.1. Ease of Integrating the DCA Investigations into Preschool Classrooms
Teachers survey responses indicated that, overall, they could “easily fit the investigations into” their regular classroom instruction (two strongly agreed and 3 agreed). This high rate of agreement was found across most investigations: specifically, two investigations showed 100% agreement (What Do We Wear? and Animal Data Shuffle), three investigations showed 80% agreement (Hungry Caterpillar, Our Feelings Freeze, and Measure with Me), and one investigation had 60% agreement (Frame It).
An important factor in the teachers’ ability to easily integrate the DCA investigations into their classrooms was the ease of following the investigations’ lesson plans; survey responses indicated that the “lesson plans are easy to follow” (one strongly agreed while 4 agreed). This rate of agreement was also true for most investigations: two investigations demonstrated 100% agreement (Feelings Freeze and Measure with Me) and four investigations demonstrated 80% agreement (What Do We Wear?, Animal Data Shuffle, Hungry Caterpillar, and Frame It).
3.2.2. Preparation, Materials, and Pacing
For each investigation, teachers rated the extent to which they felt it was easy to prepare for and the extent to which they had the necessary materials. Two investigations had 100% agreement that preparation was easy (What Do We Wear? and Animal Data Shuffle), three investigations had 80% agreement (Hungry Caterpillar, Feeling Freeze, and Measure with Me), and one investigation had 60% agreement (Frame It). The teachers were mixed when asked to indicate the extent to which they had the materials they needed to implement each investigation. Importantly, the teachers were sent all of the necessary materials (e.g., cards, books, stickers) to implement the investigations as they were outlined in the lesson plans—but were encouraged to use any alternative materials that were more practical or relatable for their classrooms. Overall, two teachers agreed that they had all of the materials they needed to implement the investigations, two teachers neither agreed nor disagreed, and one teacher disagreed. These responses were variable across the investigations, with teachers reporting that they had all of the needed materials in some investigations but not others. In many cases, teachers referenced the availability of alternative materials as being inconsistent.
Finally, within each investigation’s lesson plan, an estimated time to complete the investigation (ranging from 1 to 4 days) was also provided. Teachers reported that, overall, the investigations took approximately as long as suggested, with four investigations taking longer than suggested and two investigations taking less time than suggested (
Table 5).
3.2.3. Developmental Appropriateness
Teachers were asked to rate each investigation based on its developmental appropriateness (e.g., difficulty level, topical interest) for their preschoolers. While there was variation in responses, both across and within the investigations, with a few ‘disagree’ responses, teachers rated the investigations as being developmentally appropriate overall: (1) What Do We Wear (3 strongly agreed, while 2 agreed); (2) Animal Data Shuffle (3 Strongly Agreed and 2 Agreed); (3) Hungry Caterpillar (1 Strongly Agreed, 3 Agreed, and 1 Neither Agreed nor Disagreed); (4) Our Feelings Freeze (3 Strongly Agreed, 1 Agreed, and 1 Strongly Disagreed); (5) Frame It (2 Strongly Agreed, 2 Agreed, and 1 Strongly Disagreed); and (6) Measure with Me (2 Strongly Agree and 3 Agreed).
3.2.4. Engagement with Mathematics and DCA Content
Teachers’ survey responses indicated that, overall, they felt “the investigations fit students’ current math skills” (1 Strongly Agreed and 4 Agreed). Teachers also reported engaging their students in a variety of traditional preschool mathematics skills (e.g., counting, sorting, comparing, and classifying) and data-focused skills (e.g., collecting, describing, organizing, representing, and interpreting data) during the investigations. Teachers reported that all of the investigations met all of their learning goals.
During classroom observations, evidence of teacher–child engagement in each math and data-focused domain was also observed, with teachers engaging children in sorting in 92% of observations; data representation in 74% of observations; creating visualizations in 88% of observations; describing graphed data in 93% of observations; quantifying graphed data in 92% of observations; and interpreting graphs in 84% of observations. Yet, variation within these domains were found; for example, teachers and children arranged their graph categories in ascending or descending order—a sorting and quantifying graphed data skill—in only 22% of observations. In addition, describing different parts of graphs (e.g., the x- and y-axes), a sub-domain of the ‘describe graphed data’ skill, occurred in only 35% of observations. When comparing observations of children’s mathematical engagement across investigations, engagement was high, with only two investigations demonstrating less than 90% of time spent engaged in mathematics: Measure with Me (67%) and Our Feelings Freeze (88%). Notably, 97% of observations also included teachers engaging in mathematical dialogue with their students.
3.2.5. Create and Design Your Own Investigations
Survey responses suggest that investigations that allowed teachers and children to design investigations around the interests and curricular topics that were most relevant in their classrooms (i.e., CYO and DYODS) were beneficial. Teachers reported feeling comfortable coming up with their own research questions, determining their graph categories, planning investigation activities, writing data talk prompts, determining what was developmentally appropriate, and choosing their investigations’ pacing (
Table 6). Comments during the teacher interviews, however, suggested that some of these tasks might have been more challenging than the survey results suggested. In particular, several teachers relied on members of the research team to help them generate research questions and plan their investigation activities, suggesting that teachers would likely benefit from more comprehensive guidance or support with these particular steps. All five teachers agreed that it would be helpful to include examples of research questions directly in the app. Additionally, regarding the DYODS investigation, teachers noted that it may be particularly challenging to engage preschoolers in the process of choosing research questions and topics to investigate. One teacher noted: “I feel the teacher still needs to guide the children with a research question. Children at this age are just learning the difference between a question and a statement.” In response to this feedback, professional development sessions and a digital (in-app) Teacher’s Guide now include examples of research questions to assist teachers and students in their investigation planning.
A critical part of the DYODS investigation was the storybook aspect and, unfortunately, the teachers in this study were unable to engage with this feature due to time constraints exacerbated by COVID-19 school closures (see Pandemic Challenges below). All teachers were nonetheless asked to review the DYODS lesson plan and provide feedback. Nearly all teachers (n = 4) responded very positively to the idea of the storybook and stressed the importance of being able to print their creations to share with families and other students. Additionally, in response to our description of how the app might be revised to better support the storybook feature, one teacher said, “Yes, if it works like that, where you can organize it and put [the graphs] where you want them, then just click and you can either make it a slideshow or print it, that’s perfect”.
In addition to printing capabilities, teachers noted the following “must-have” features for the storybook: a title or summary page outlining the questions that were investigated; a blank page or textbox for children to use as they would like; pictures of the graphs that were created; and a page to include quotes from children about how they found answers to their questions as well as for the teacher to note different things the children said throughout the investigation.
3.3. Research Question 3: Identified Challenges (What Are the Challenges Teachers Experience When Using the App?)
3.3.1. Graph Modification Challenges
Teacher interview and survey data, as well as classroom observation data, indicated that the teachers were frustrated by their inability to modify graphs after making their initial category (
x-axis) and range (
y-axis) selections. The teachers stressed the importance of having the flexibility to change or add graph categories and to adjust the graph’s
y-axis range. For example, if a teacher intended to set their graph up with five color categories but added only four by mistake, they were not able to return to the set-up screen to add the fifth color category; they needed to either proceed with only four color categories or start a new graph. This was frustrating because in the time it took to start a new graph, students would often become distracted and lose the thread of the investigation. In response, we asked teachers to rate the degree to which additional app features that allow graph modifications and customizations would be helpful, and they rated these features highly in most cases (
Table 7). The app was subsequently updated to give users the ability to adjust their category selections, which was the most desired modification (all five teachers rated this as Very Helpful or Somewhat Helpful). The subsequent version of the app also includes the ability to modify the graph range (four of the teachers rated this as Very Helpful or Somewhat Helpful).
3.3.2. Preparation Challenges
Teachers also reported that not setting up their graphs in advance was a challenge because, again, children’s attention could be lost when graph set-up took time. For instance, if a teacher selected 5–7 graph categories and needed to use the app’s camera feature to take photos of each category’s icon, children were observed to become distracted and inattentive. Classroom observation data also indicated that teachers became frustrated when they attempted to prepare their graphs before school and, when they later opened the app with their students, found their prepared graphs had not saved. One teacher noted, “Just going through an initial 30 s of setting it up—you can lose kids. Children can become easily distracted, so it’s valuable to be able to save time where possible.” The updated version of the app is testing this functionality; however, using only prepared graphs may mean fewer opportunities for children to engage with individual components of a graph (e.g., variable selection) during its set up.
3.4. Student Learning
3.4.1. Teacher’s Perceptions of Children’s Learning
Based on their interview and survey responses, teachers felt the intervention positively impacted their preschoolers’ learning of mathematics and data science content. Overall, the teachers agreed that the investigations “fit my students’ current math skills” (four teachers Agreed and one teacher Strongly Agreed). In addition, results from the teacher interview suggested that the particular affordances of the app provided children with learning opportunities and experiences that would not otherwise be possible or easy to implement in the classroom. The app provided a systematic process for data collection, entry, and interpretation, and one teacher summarized how the app supported her students’ learning: “Counting, once they got towards the end, children anticipated the questions and took time to think about what the graph represented. Seeing the graph was really helpful. They loved the iPad.”
3.4.2. Exploratory Research Question 4: Children’s DCA Learning (Does Engagement in These Instructional Activities with the App Lead Preschool Students to Greater Mathematics and DCA Knowledge and Skills?)
Based on data from the 28 children who completed the assessment at both pre- and post-intervention, scores increased from an average of 0.58 to an average of 0.72. This was a significant change based on a paired-sample t-test, t(27) = 5.62, p < 0.001.
4. Discussion
State standards for early childhood mathematics learning [
14] are beginning to include goals for 4- and 5-year-olds related to DCA, yet it can be daunting for preschool teachers to implement DCA in their classrooms. Although DCA activities are often already used in instructional routines in early childhood classrooms, such as posing a “Question of the day,” there is a dearth of research on supporting young children’s data literacy skills in early childhood [
12]. Moreover, research on introducing data modeling in preschool classrooms is virtually non-existent [
2,
3].
The current study outlined a design-based research study that included the development of technology-enhanced curricular investigations and the implementation and evaluation of a data visualization tool designed for teachers to use with young learners. Findings show that, with specific supports, teachers can indeed enact DCA activities that utilize data modeling with young children. These supports include the lesson plans and teacher professional development materials, the structure of the app with step-by-step pages to scaffold the investigation process, suggested data talk questions, and the analysis tools that allowed teachers to annotate on the screen, sort, and change the format of the graphs. These DCA activities and the corresponding digital app provided a meaningful context for young children to engage in high-quality mathematics learning opportunities that would not otherwise have been possible or easy to implement in their classrooms.
4.1. Affordances and Engagement with the Preschool Data Toolbox App
Research indicates that early childhood teachers need support to engage young children in meaningful data experiences, such as formulating a research question, discussing which data to collect to best answer that question and which variables to consider, deciding how to display data so that children can engage in discussions that answer their initial question, and inspiring children to ask new questions [English 8, Lehrer 18].
Our findings suggest that the intervention and app provided affordances—supporting the process, allowing for quick graph generation, and simplifying choices without removing choices—for enacting developmentally appropriate DCA activities in preschool classrooms. The app’s structure (e.g., stepwise pages to set up graph) and scaffolds (e.g., tool features) [
2] helped teachers engage in a systematic use of data, leading teachers and children through a series of consistent steps to formulate and answer research questions by collecting and representing data. In addition, teachers and observers reported that the app was easy to use and navigate so that teachers could devote less time, resources, and mental effort to the procedural aspects of creating data visualizations [
8,
28], which allowed them to focus their instruction on students’ conceptual understandings and interpretations of data visualizations during data talks (discussions focused on data).
Teachers also reported that the app supported their implementation of DCA in new ways. For example, the app deconstructed the complex task of engaging students in investigations into smaller, more manageable steps: identifying developmentally appropriate research questions; collecting, recording, and organizing data; creating data visualizations; and including “data talks”—discussions between teachers and children about data—as an instructional routine to support interpretations of data and communication of results.
Overall, the curriculum and technology provided support by reducing the presence of overwhelming options when creating data visualizations, offering more structure than comparable tools designed to make simple data visualizations, such as Microsoft’s Excel [
2]. While early childhood teachers could use Excel to create graphs, they typically do not, as the interface is not engaging for children or easy to navigate during instruction in preschool classrooms. Rather, this study’s app was easy to use during preschool instruction, was engaging, visually appealing, intuitive, and motivating for children, and controlled the number of options involved in creating graphs. Importantly, while simplifying the choices that needed to be made to create data visualizations, the app did not remove critical steps to learning about and using data in meaningful ways. For example, app users must still select categories and a range so they can learn about the process of creating data visualizations. In this way, the app engages students not only in math and DCA content, but also with the technology itself. In service of both of these modes of engagement, the app tools for sorting, drawing, and transitioning graph formats were also found to be valuable to students’ learning, quick and easy to use, and helped teachers implement the investigations and discussions.
4.2. Engagement with the Full Intervention
The full DCA intervention (investigations and digital app) was designed to scaffold structured inquiry activities by modeling and making explicit the steps within DCA and relieving the burden of creating visual representations of data, as early childhood teachers often lack access to varied models of DCA activities that go beyond asking a simple question or making cumbersome graphs [
2,
4,
25]. The findings suggest that the DCA intervention was easy to follow, prepare for, and integrate into preschool classrooms and schedules. Specifically, the investigations worked with existing classroom activity structures (e.g., circle time, centers) and were deemed developmentally appropriate by the teachers. Initially, the teachers were unsure whether the use of data visualizations would be developmentally appropriate for their young children. But, since early childhood is a period of rapid development in which emergent numeracy and literacy skills involve meaning making with symbols (numerals and letters), and because data visualizations capitalize on the human ability to identify patterns in images [
39], teachers quickly saw the value of representing information through visual displays (especially for pre-literate children). The investigations also provided a context to practice the mathematics skills that teachers already focus on while building children’s data literacy skills, and were therefore desirable additions to existing curricula. In the rare cases where teachers did not rate an investigation as being developmentally appropriate, it was noted that teachers needed more support to enact the investigation as intended. We are therefore providing additional professional learning supports, embedded app supports, and edits to the curricular investigations in a digital Teacher’s Guide.
Importantly, the focus on data talks—discussions focused on data—was a particular strength of the intervention and provided a unique opportunity to engage young children in discourse around inquiry and mathematics. Question prompts and data talk routines were included in lesson plans to emphasize the learning goals of discussing and interpreting data visualizations and fostering early learners’ reflection on and interpretation of visualizations. Subsequent versions of the app embedded these data talk prompts into the app’s interface so that teachers could use them in real time. This further established the app as a means of freeing up instructional time and cognitive effort during creation of visual representations and repurposed this time and effort on interpretation and discussion of data, which is the ultimate reason for creating visual displays.
Overall, the design and sequencing of the DCA investigations aimed to foster inquiry-based activities where teachers would help children identify and pose research questions and pursue answers to their questions, and then use the app to record, organize, and display their data. However, despite including investigations that set the stage for more open-ended investigations (which were positively received by teachers), the CYO and DYODS investigations posed challenges for teachers to enact in practice. Observational findings showed that when generating their own research questions, teachers typically fell back on instructional routines that were familiar, such as posing a question of the day and using the app to graph the data. Their investigations also typically involved relatively simple mathematics and graphs, such as basic counting and creating tally charts, and did not necessarily incorporate questions of interest to children or ones that a data visualization was necessary to help answer. This indicates that, although preschool teachers are comfortable and able to implement existing DCA curricula that involve a range of mathematics domains and levels of challenge, more targeted teacher supports are likely needed for teachers to develop their own DCA lessons.
4.3. Children’s Mathematics and DCA Knowledge and Skills
Overall, study findings indicate that children’s foundational mathematics skills improved from pre- to post-intervention and they acquired new knowledge and skills related to DCA. Teachers also perceived that the intervention positively impacted their children’s math and data science knowledge, and felt that each investigation was successful in reaching its mathematics and CT learning goals. Yet, this area of research is young and requires future work to solidify our understanding of how young children learn DCA concepts.
4.4. Intervention Challenges
While the app and intervention findings are promising, several challenges were identified as well. We included features in the app, such as visual display tools, to give teachers the ability to customize their graphs and to edit or change the visual displays. However, some of these features were challenging for teachers as they had a difficult time altering certain aspects of the graph, such as changing the range or any included variables after the data entry process had begun. The functionality to change the variables included in the visual display was available to teachers, but it was difficult to navigate to previous steps in the process, despite the inclusion of a process flow chart at the top of every screen which illustrated where teachers were in the investigation process. This process flow was static, however, and was not clickable, so it was not practically useful to teachers to use to navigate to previous screens. Teachers also noted that they sometimes needed to change the range they had chosen during the activity, but once data was entered into the graph, the functionality to change the range did not exist and required teachers to make a new graph to change this feature. This would disrupt the flow of the activity as teachers had to redo previous steps while children waited; often children would lose interest as the teacher worked on the tablet. These issues have been addressed in the subsequent version of the app by making the process flow chart navigable and the data visualization more flexible to accommodate changes in range or categories.
A challenge that teachers encountered during implementation was the realization that for optimal enactment of the activity, they should have set up the graph prior to using the app with the children. In many cases, teachers found it useful to select the research question, range, and variables before sitting down with the children to collect, enter, and discuss the data. In other cases, including the children in the graph setup was a valuable experience that supported children’s understanding of the app functionality and the components of graphs as visual displays of data. To aid teachers in determining when to set up the graph ahead of time and when to do it with the children, suggestions were added to the teacher’s guide about preparing for the activity.
Finally, there were challenges related to the specific timing of the study, as it took place during the pandemic when many schools and classrooms needed to close due to COVID exposures. Specifically, this study took place in the fall of 2020, and teachers and children engaged in classroom activities with various measures in place, such as wearing masks, social distancing, smaller class sizes, and frequent quarantines. Quarantines in particular posed a challenge as children’s attendance was less predictable than usual and teachers and whole classrooms were often sent home for extended quarantine, which delayed completion of the study by two months. In addition, study data was collected remotely by giving each teacher an extra iPad to record and upload videos with. Overall, this approach worked but created its own challenges, as only those children with consent were permitted on camera, yet teachers often had limited staff to work with children who could not be videorecording during study activities.


 ,
, 


