
Basal Ganglia Iron Content Increases with Glioma Severity Using Quantitative Susceptibility Mapping: A Potential Biomarker of Tumor Severity

 and
and
Abstract
:1. Introduction
2. Materials and Methods
3. Results
4. Discussion
5. Conclusions
Author Contributions
Funding
Institutional Review Board Statement
Informed Consent Statement
Data Availability Statement
Acknowledgments
Conflicts of Interest
References
- Youssef, L.A.; Spitalnik, S.L. Iron: A double-edged sword. Transfusion 2017, 57, 2293–2297. [Google Scholar] [CrossRef] [PubMed] [Green Version]
- Crichton, R. (Ed.) The Importance of Iron for Biological Systems. In Iron Metabolism: From Molecular Mechanisms to Clinical Consequences, 3rd ed.; Wiley Online Books: Hoboken, NJ, USA, 2009; pp. 17–58. [Google Scholar] [CrossRef]
- Dizdaroglu, M.; Jaruga, P. Mechanisms of free radical-induced damage to DNA. Free Radic. Res. 2012, 46, 382–419. [Google Scholar] [CrossRef] [PubMed]
- Stevens, R.G.; Beasley, R.P.; Blumberg, B.S. Iron-Binding Proteins and Risk of Cancer in Taiwan. JNCI J. Natl. Cancer Inst. 1986, 76, 605–610. [Google Scholar] [CrossRef] [PubMed]
- Stevens, R.G.; Jones, D.Y.; Micozzi, M.S.; Taylor, P.R. Body Iron Stores and the Risk of Cancer. N. Engl. J. Med. 1988, 319, 1047–1052. [Google Scholar] [CrossRef] [PubMed]
- Selby, J.V.; Friedman, G.D. Epidemiologic evidence of an association between body iron stores and risk of cancer. Int. J. Cancer 1988, 41, 677–682. [Google Scholar] [CrossRef] [PubMed]
- Okada, S. Iron-induced tissue damage and cancer: The role of reactive oxygen species-free radicals. Pathol. Int. 2018, 46, 311–332. [Google Scholar] [CrossRef] [PubMed]
- Bystrom, L.M.; Rivella, S. Cancer cells with irons in the fire. Free Radic. Biol. Med. 2015, 79, 337–342. [Google Scholar] [CrossRef] [PubMed] [Green Version]
- Torti, S.V.; Torti, F.M. Iron and cancer: More ore to be mined. Nat. Rev. Cancer 2013, 13, 342–355. [Google Scholar] [CrossRef] [PubMed] [Green Version]
- Jung, M.; Mertens, C.; Tomat, E.; Brüne, B. Iron as a Central Player and Promising Target in Cancer Progression. Int. J. Mol. Sci. 2019, 20, 273. [Google Scholar] [CrossRef] [Green Version]
- Voth, B.; Nagasawa, D.T.; Pelargos, P.E.; Chung, L.K.; Ung, N.; Gopen, Q.; Tenn, S.; Kamei, D.T.; Yang, I. Transferrin receptors and glioblastoma multiforme: Current findings and potential for treatment. J. Clin. Neurosci. 2015, 22, 1071–1076. [Google Scholar] [CrossRef]
- Calzolari, A.; Larocca, L.M.; Deaglio, S.; Finisguerra, V.; Boe, A.; Raggi, C.; Ricci-Vitani, L.; Pierconti, F.; Malavasi, F.; De Maria, R.; et al. Transferrin Receptor 2 Is Frequently and Highly Expressed in Glioblastomas. Transl. Oncol. 2010, 3, 123–134. [Google Scholar] [CrossRef] [PubMed] [Green Version]
- Schonberg, D.L.; Miller, T.E.; Wu, Q.; Flavahan, W.A.; Das, N.K.; Hale, J.S.; Hubert, C.G.; Mack, S.C.; Jarrar, A.M.; Karl, R.T.; et al. Preferential Iron Trafficking Characterizes Glioblastoma Stem-like Cells. Cancer Cell 2015, 28, 441–455. [Google Scholar] [CrossRef] [PubMed] [Green Version]
- Legendre, C.; Garcion, E. Iron metabolism: A double-edged sword in the resistance of glioblastoma to therapies. Trends Endocrinol. Metab. 2015, 26, 322–331. [Google Scholar] [CrossRef] [PubMed]
- Chitambar, C.R.; Al-Gizawiy, M.M.; Alhajala, H.S.; Pechman, K.R.; Wereley, J.P.; Wujek, R.; Clark, P.A.; Kuo, J.S.; Antholine, W.E.; Schmainda, K.M. Gallium Maltolate Disrupts Tumor Iron Metabolism and Retards the Growth of Glioblastoma by Inhibiting Mitochondrial Function and Ribonucleotide Reductase. Mol. Cancer Ther. 2018, 17, 1240–1250. [Google Scholar] [CrossRef] [PubMed] [Green Version]
- Hallgren, B.; Sourander, P. The effect of age on the non-haemin iron in the human brain. J. Neurochem. 1958, 3, 41–51. [Google Scholar] [CrossRef] [PubMed]
- Dexter, D.T.; Wells, F.R.; Agid, F.; Agid, Y.; Lees, A.J.; Jenner, P.; Marsden, C.D. Increased nigral iron content in postmortem parkinsonian brain. Lancet 1987, 330, 1219–1220. [Google Scholar] [CrossRef]
- Haacke, E.M.; Cheng, N.Y.C.; House, M.J.; Liu, Q.; Neelavalli, J.; Ogg, R.J.; Khan, A.; Ayaz, M.; Kirsch, W.; Obenaus, A. Imaging iron stores in the brain using magnetic resonance imaging. Magn. Reson. Imaging 2005, 23, 1–25. [Google Scholar] [CrossRef]
- Schenck, J.F.; Dumoulin, C.L.; Redington, R.W.; Kressel, H.Y.; Elliott, R.T.; McDougall, I.L. Human exposure to 4.0-Tesla magnetic fields in a whole-body scanner. Med. Phys. 1992, 19, 1089–1098. [Google Scholar] [CrossRef]
- Schenck, J.F. The role of magnetic susceptibility in magnetic resonance imaging: MRI magnetic compatibility of the first and second kinds. Med. Phys. 1996, 23, 815–850. [Google Scholar] [CrossRef]
- Reichenbach, J.R. The future of susceptibility contrast for assessment of anatomy and function. NeuroImage 2012, 62, 1311–1315. [Google Scholar] [CrossRef]
- Zheng, W.; Nichol, H.; Liu, S.; Cheng, Y.-C.; Haacke, E.M. Measuring iron in the brain using quantitative susceptibility mapping and X-ray fluorescence imaging. NeuroImage 2013, 78, 68–74. [Google Scholar] [CrossRef] [PubMed] [Green Version]
- Langkammer, C.; Schweser, F.; Krebs, N.; Deistung, A.; Goessler, W.; Scheurer, E.; Sommer, K.; Reishofer, G.; Yen, K.; Fazekas, F.; et al. Quantitative susceptibility mapping (QSM) as a means to measure brain iron? A post mortem validation study. NeuroImage 2012, 62, 1593–1599. [Google Scholar] [CrossRef] [PubMed] [Green Version]
- Bilgic, B.; Pfefferbaum, A.; Rohlfing, T.; Sullivan, E.V.; Adalsteinsson, E. MRI estimates of brain iron concentration in normal aging using quantitative susceptibility mapping. NeuroImage 2012, 59, 2625–2635. [Google Scholar] [CrossRef] [Green Version]
- Yoon, J.; Gong, E.; Chatnuntawech, I.; Bilgic, B.; Lee, J.; Jung, W.; Ko, J.; Jung, H.; Setsompop, K.; Zaharchuk, G.; et al. Quantitative susceptibility mapping using deep neural network: QSMnet. NeuroImage 2018, 179, 199–206. [Google Scholar] [CrossRef] [PubMed] [Green Version]
- Jung, W.; Yoon, J.; Ji, S.; Choi, J.Y.; Kim, J.M.; Nam, Y.; Kim, E.Y.; Lee, J. Exploring linearity of deep neural network trained QSM: QSMnet+. NeuroImage 2020, 211, 116619. [Google Scholar] [CrossRef] [PubMed]
- Louis, D.N.; Perry, A.; Reifenberger, G.; von Deimling, A.; Figarella-Branger, D.; Cavenee, W.K.; Ohgaki, H.; Wiestler, O.D.; Kleihues, P.; Ellison, D.W. The 2016 World Health Organization Classification of Tumors of the Central Nervous System: A summary. Acta Neuropathol. 2016, 131, 803–820. [Google Scholar] [CrossRef] [PubMed] [Green Version]
- Li, W.; Avram, A.V.; Wu, B.; Xiao, X.; Liu, C. Integrated Laplacian-based phase unwrapping and background phase removal for quantitative susceptibility mapping. NMR Biomed. 2014, 27, 219–227. [Google Scholar] [CrossRef] [PubMed] [Green Version]
- Jenkinson, M.; Bannister, P.; Brady, M.; Smith, S. Improved Optimization for the Robust and Accurate Linear Registration and Motion Correction of Brain Images. NeuroImage 2002, 17, 825–841. [Google Scholar] [CrossRef] [PubMed]
- Jenkinson, M.; Smith, S. A global optimisation method for robust affine registration of brain images. Med. Image Anal. 2001, 5, 143–156. [Google Scholar] [CrossRef]
- Greve, D.N.; Fischl, B. Accurate and robust brain image alignment using boundary-based registration. NeuroImage 2009, 48, 63–72. [Google Scholar] [CrossRef] [Green Version]
- Bedekar, D.; Jensen, T.; Rand, S.; Malkin, M.G.; Connelly, J.; Schmainda, K.M. Delta T1 method: An automatic post-contrast ROI selection technique for brain tumors. In Proceedings of the 18th Annual Meeting and Exhibition of the International Society for Magnetic Resonance in Medicine, Stockholm, Sweden, 1–7 May 2010. [Google Scholar]
- Reith, T.; Wujek, R.; Karr, R.; Koch, K.; Al-Gizawiy, M.; Schmainda, K. Basal ganglia iron deposition as a biomarker of brain tumor severity. In Proceedings of the 27th Annual Meeting and Exhibition of the International Society for Magnetic Resonance in Medicine, Montreal, QC, Canada, 11–16 May 2019. [Google Scholar]
- Herynek, V.; Wagnerová, D.; Malucelli, A.; Vymazal, J.; Sameš, M.; Hájek, M. Alterations in the basal ganglia in patients with brain tumours may be due to excessive iron deposition. Oncol. Lett. 2015, 9, 43–46. [Google Scholar] [CrossRef] [Green Version]
- Aquino, D.; Bizzi, A.; Grisoli, M.; Garavaglia, B.; Bruzzone, M.G.; Nardocci, N.; Savoiardo, M.; Chiapparini, L. Age-related Iron Deposition in the Basal Ganglia: Quantitative Analysis in Healthy Subjects. Radiology 2009, 252, 165–172. [Google Scholar] [CrossRef]
- Xu, M.; Guo, Y.; Cheng, J.; Xue, K.; Yang, M.; Song, X.; Feng, Y.; Cheng, J. Brain iron assessment in patients with First-episode schizophrenia using quantitative susceptibility mapping. NeuroImage Clin. 2021, 31, 102736. [Google Scholar] [CrossRef]
- Blazejewska, A.I.; Al-Radaideh, A.; Wharton, S.; Lim, S.Y.; Bowtell, R.; Constantinescu, C.; Gowland, P.A. Increase in the iron content of the substantia nigra and red nucleus in multiple sclerosis and clinically isolated syndrome: A 7 Tesla MRI study. J. Magn. Reson. Imaging 2015, 41, 1065–1070. [Google Scholar] [CrossRef]
- Langkammer, C.; Liu, T.; Khalil, M.; Enzinger, C.; Jehna, M.; Fuchs, S.; Fazekas, F.; Wang, Y.; Ropele, S. Quantitative Susceptibility Mapping in Multiple Sclerosis. Radiology 2013, 267, 551–559. [Google Scholar] [CrossRef] [Green Version]
- He, N.; Ling, H.; Ding, B.; Huang, J.; Zhang, Y.; Zhang, Z.; Liu, C.; Chen, K.; Yan, F. Region-specific disturbed iron distribution in early idiopathic Parkinson’s disease measured by quantitative susceptibility mapping. Hum. Brain Mapp. 2015, 36, 4407–4420. [Google Scholar] [CrossRef]
- Langkammer, C.; Pirpamer, L.; Seiler, S.; Deistung, A.; Schweser, F.; Franthal, S.; Homayoon, N.; Katschnig-Winter, P.; Koegl-Wallner, M.; Pendl, T.; et al. Quantitative Susceptibility Mapping in Parkinson’s Disease. PLoS ONE 2016, 11, e0162460. [Google Scholar] [CrossRef]
- Wen, C.P.; Lee, J.H.; Tai, Y.-P.; Wen, C.; Wu, S.B.; Tsai, M.K.; Hsieh, D.P.; Chiang, H.-C.; Hsiung, C.A.; Hsu, C.Y.; et al. High Serum Iron Is Associated with Increased Cancer Risk. Cancer Res. 2014, 74, 6589–6597. [Google Scholar] [CrossRef] [Green Version]
- Fonseca-Nunes, A.; Jakszyn, P.; Agudo, A. Iron and Cancer Risk—A Systematic Review and Meta-analysis of the Epidemiological Evidence. Cancer Epidemiol. Biomark. Prev. 2014, 23, 12–31. [Google Scholar] [CrossRef] [Green Version]
- Sato, Y.; Honda, Y.; Asoh, T.; Oizumi, K.; Ohshima, Y.; Honda, E. Cerebrospinal fluid ferritin in glioblastoma: Evidence for tumor synthesis. J. Neuro-Oncol. 1998, 40, 47–50. [Google Scholar] [CrossRef]
- Dubrow, R.; Darefsky, A.S. Demographic variation in incidence of adult glioma by subtype, United States, 1992–2007. BMC Cancer 2011, 11, 325. [Google Scholar] [CrossRef] [PubMed] [Green Version]
- Persson, N.; Wu, J.; Zhang, Q.; Liu, T.; Shen, J.; Bao, R.; Ni, M.; Liu, T.; Wang, Y.; Spincemaille, P. Age and sex related differences in subcortical brain iron concentrations among healthy adults. NeuroImage 2015, 122, 385–398. [Google Scholar] [CrossRef] [PubMed] [Green Version]
- Bartzokis, G.; Tishler, T.A.; Lu, P.H.; Villablanca, P.; Altshuler, L.L.; Carter, M.; Huang, D.; Edwards, N.; Mintz, J. Brain ferritin iron may influence age- and gender-related risks of neurodegeneration. Neurobiol. Aging 2007, 28, 414–423. [Google Scholar] [CrossRef] [PubMed]
- Li, J.; Zhang, Q.; Zhang, N.; Guo, L. Increased Brain Iron Deposition in the Putamen in Patients with Type 2 Diabetes Mellitus Detected by Quantitative Susceptibility Mapping. J. Diabetes Res. 2020, 2020, 7242530. [Google Scholar] [CrossRef] [PubMed]


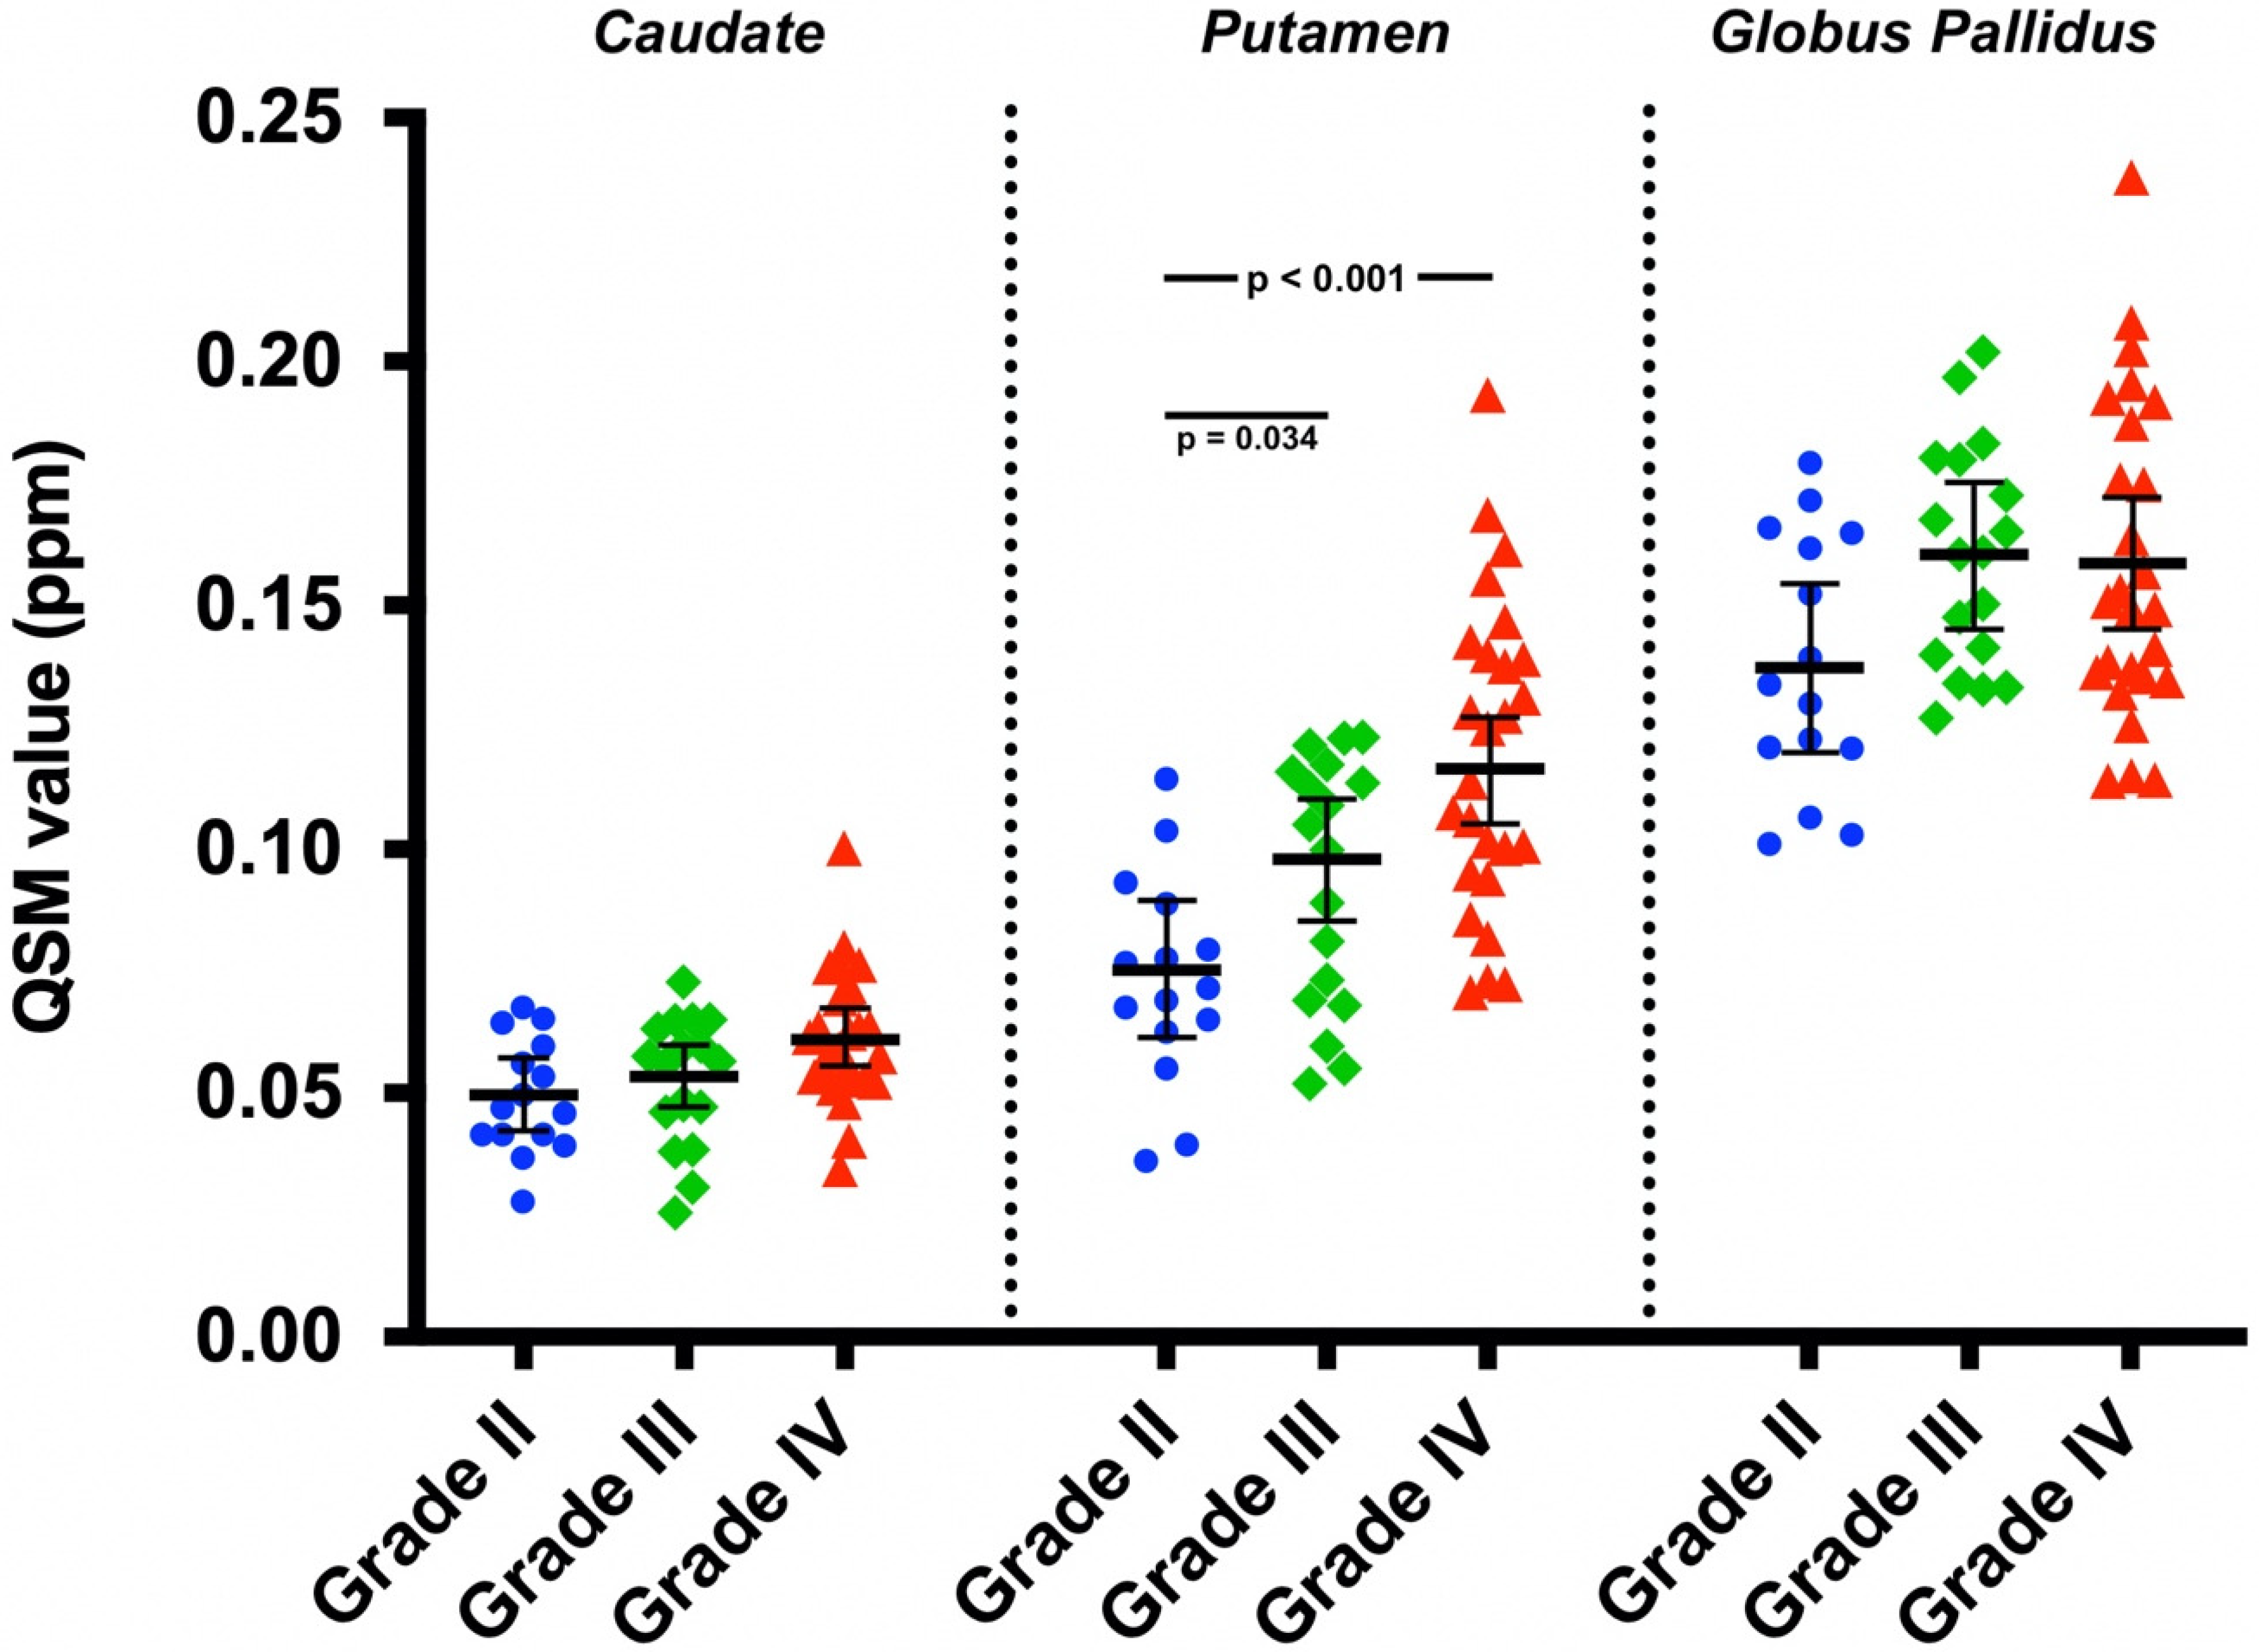
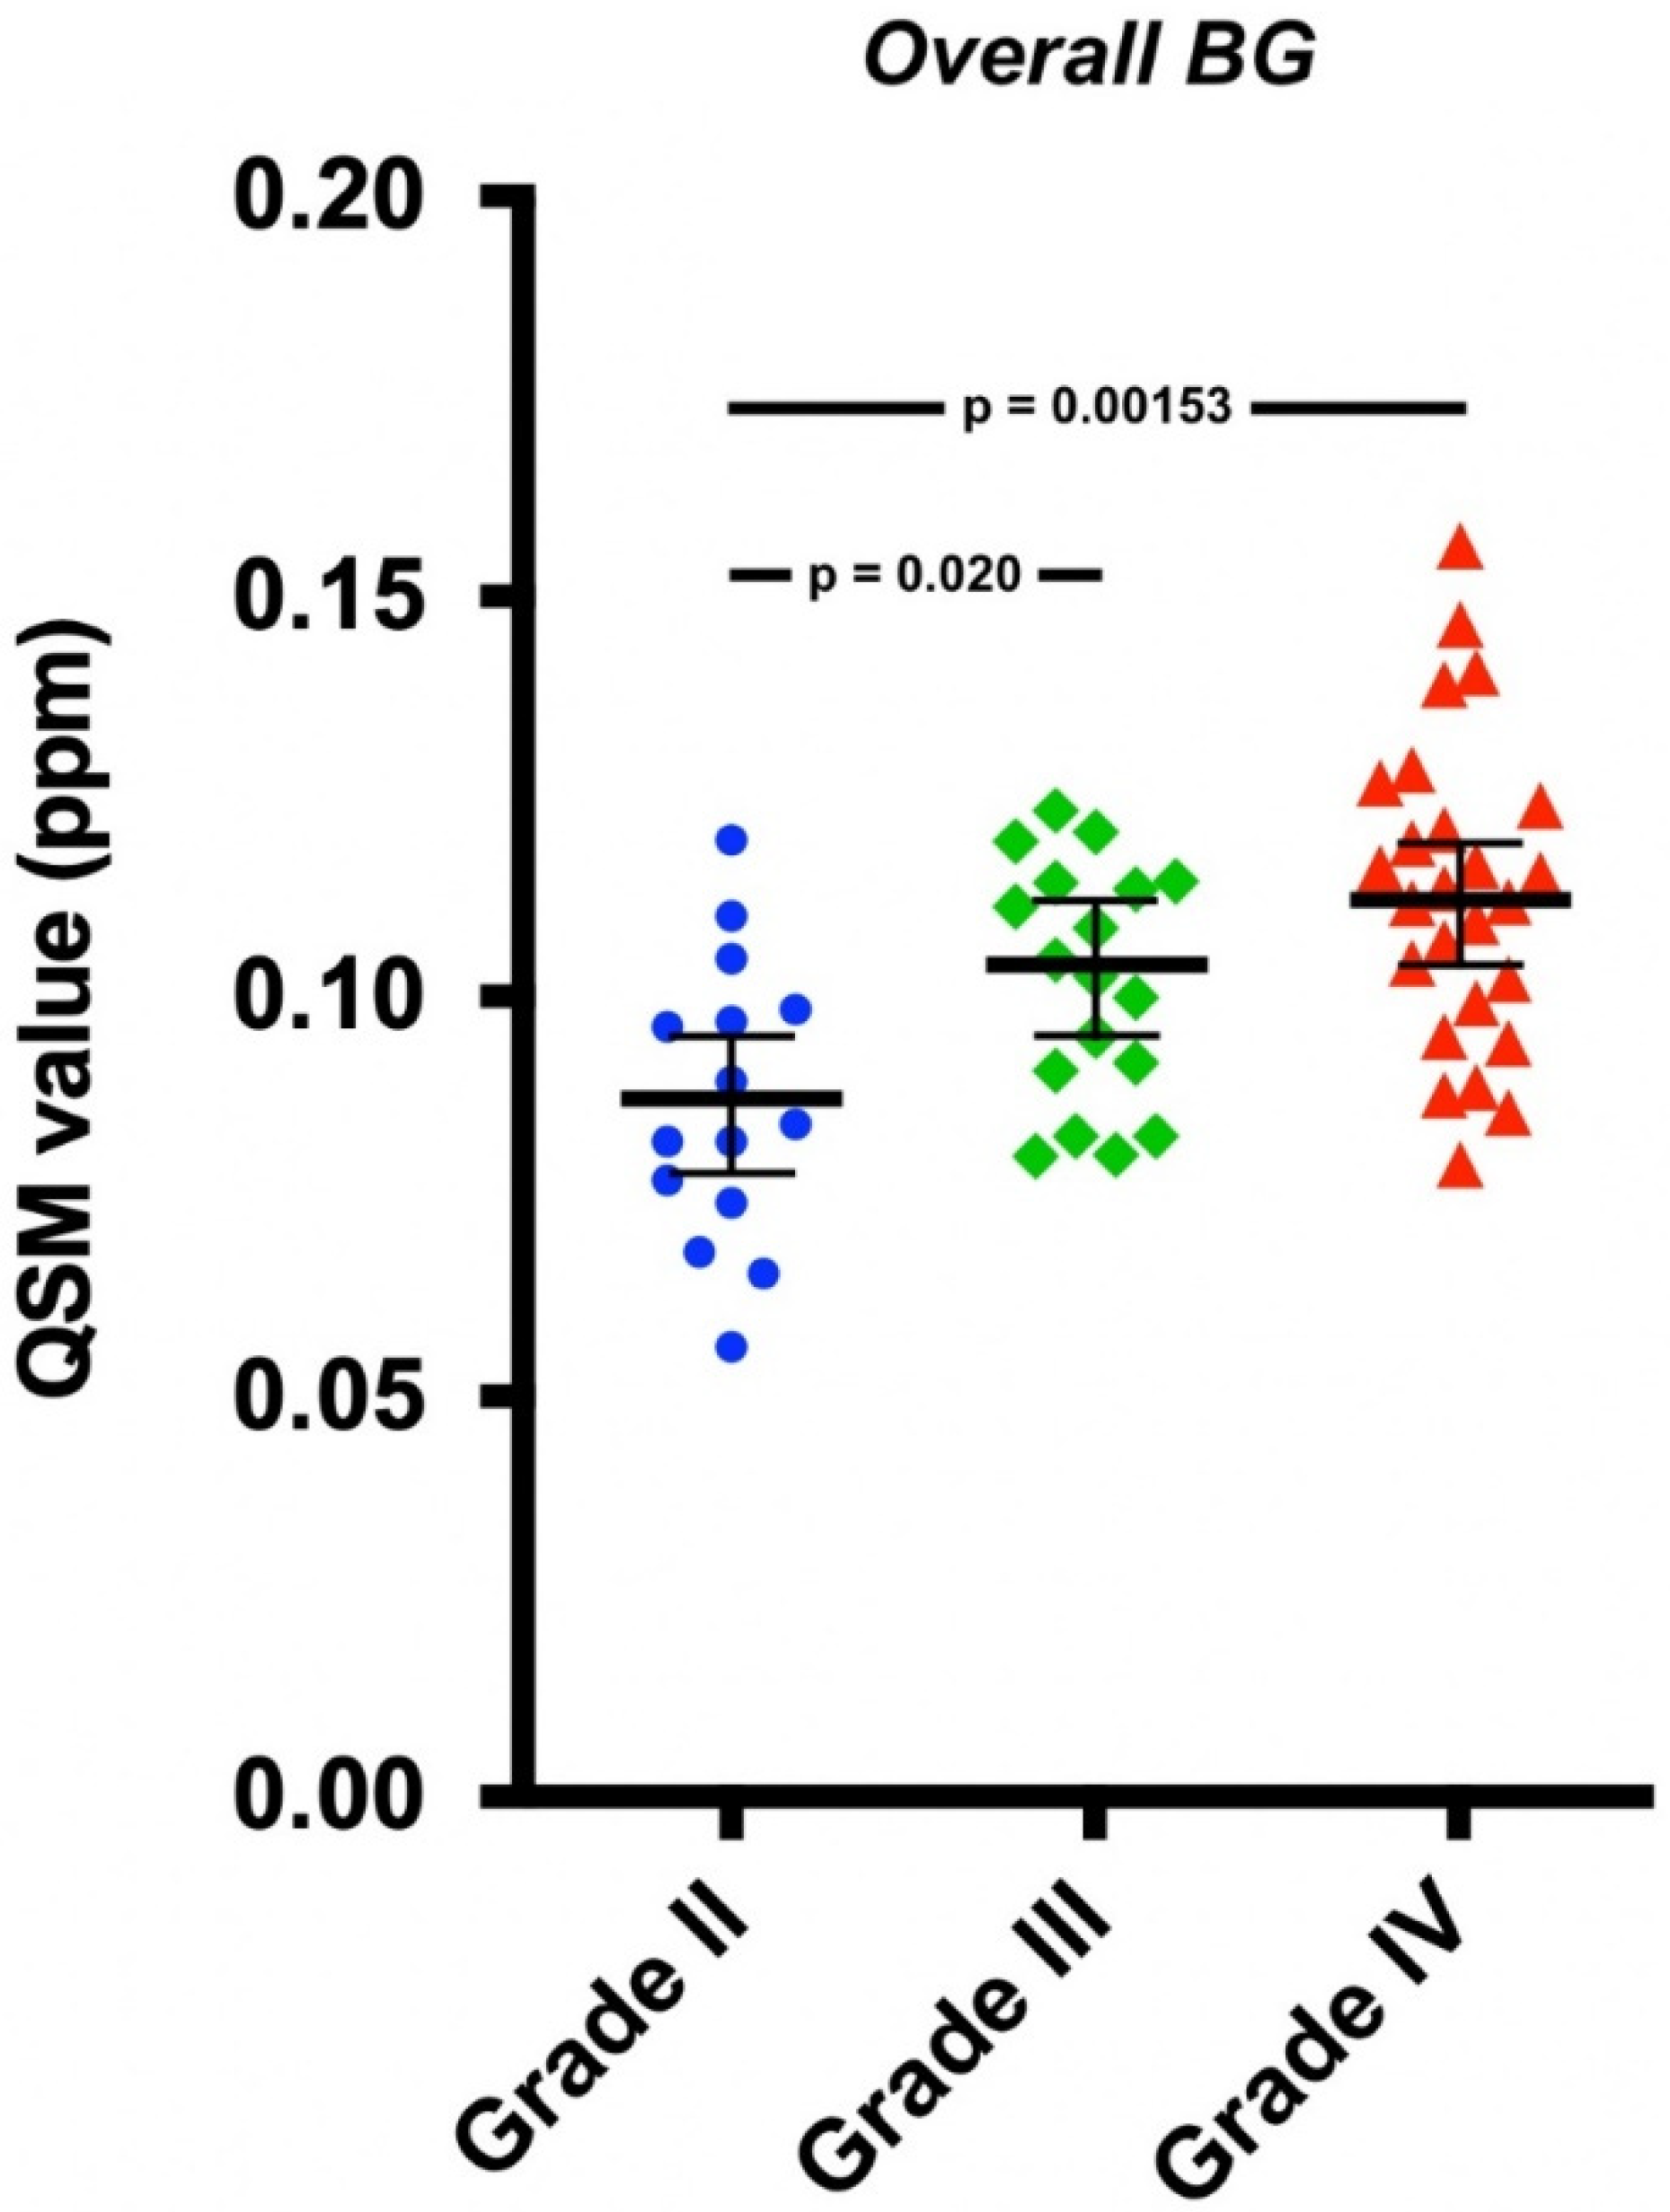
| Covariate Adjusted Mean QSM Value (95% CI) (ppm) | |||
|---|---|---|---|
| Grade II | Grade III | Grade IV | |
| Caudate | 0.050 (0.042, 0.057) | 0.053 (0.047, 0.060) | 0.061 (0.055, 0.067) |
| Putamen | 0.075 (0.061, 0.089) | 0.098 (0.085, 0.110) | 0.116 (0.105, 0.127) |
| Globus pallidus | 0.137 (0.120, 0.154) | 0.160 (0.145, 0.175) | 0.159 (0.145, 0.172) |
| Overall BG | 0.087 (0.078, 0.096) | 0.104 (0.095, 0.112) | 0.112 (0.104, 0.119) |
| Covariate Adjusted Mean QSM Value (95% CI) (ppm) | |
|---|---|
| Astrocytoma | |
| Caudate | 0.055 (0.051, 0.059) |
| Putamen | 0.096 (0.089, 0.104) |
| Globus pallidus | 0.151 (0.142, 0.160) |
| Overall BG | 0.101 (0.096, 0.106) |
| Oligodendroglioma | |
| Caudate | 0.059 (0.051, 0.066) |
| Putamen | 0.112 (0.097, 0.126) |
| Globus pallidus | 0.162 (0.144, 0.180) |
| Overall BG | 0.111 (0.101, 0.121) |
| Mean QSM Value ± SD (ppm) | |||
|---|---|---|---|
| Grade II | Grade III | Grade IV | |
| All Patients/Tumor Types | |||
| Caudate | 0.049 ± 0.012 | 0.052 ± 0.013 | 0.062 ± 0.014 |
| Putamen | 0.073 ± 0.021 | 0.094 ± 0.025 | 0.119 ± 0.032 |
| Globus pallidus | 0.138 ± 0.026 | 0.160 ± 0.023 | 0.158 ± 0.032 |
| Overall BG | 0.087 ± 0.018 | 0.102 ± 0.015 | 0.113 ± 0.019 |
| Male | |||
| Caudate | 0.051 ± 0.011 | 0.051 ± 0.013 | 0.0611 ± 0.0080 |
| Putamen | 0.073 ± 0.024 | 0.094 ± 0.026 | 0.116 ± 0.025 |
| Globus pallidus | 0.137 ± 0.029 | 0.157 ± 0.021 | 0.164 ± 0.038 |
| Overall BG | 0.087 ± 0.018 | 0.101 ± 0.016 | 0.114 ± 0.017 |
| Female | |||
| Caudate | 0.048 ± 0.013 | 0.057 ± 0.012 | 0.062 ± 0.016 |
| Putamen | 0.074 ± 0.020 | 0.094 ± 0.029 | 0.121 ± 0.036 |
| Globus pallidus | 0.140 ± 0.025 | 0.169 ± 0.029 | 0.155 ± 0.030 |
| Overall BG | 0.087 ± 0.018 | 0.1066 ± 0.0088 | 0.113 ± 0.021 |
| Astrocytoma | |||
| Caudate | 0.046 ± 0.013 | 0.050 ± 0.015 | 0.062 ± 0.014 |
| Putamen | 0.067 ± 0.024 | 0.084 ± 0.025 | 0.119 ± 0.032 |
| Globus pallidus | 0.131 ± 0.026 | 0.157 ± 0.023 | 0.158 ± 0.032 |
| Overall BG | 0.081 ± 0.020 | 0.097 ± 0.015 | 0.113 ± 0.019 |
| Oligodendroglioma | |||
| Caudate | 0.052 ± 0.010 | 0.0562 ± 0.0074 | – |
| Putamen | 0.079 ± 0.018 | 0.1139 ± 0.0086 | – |
| Globus pallidus | 0.144 ± 0.027 | 0.166 ± 0.023 | – |
| Overall BG | 0.092 ± 0.015 | 0.1120 ± 0.0094 | – |
Publisher’s Note: MDPI stays neutral with regard to jurisdictional claims in published maps and institutional affiliations. |
© 2022 by the authors. Licensee MDPI, Basel, Switzerland. This article is an open access article distributed under the terms and conditions of the Creative Commons Attribution (CC BY) license (https://creativecommons.org/licenses/by/4.0/).
Share and Cite
Reith, T.P.; Prah, M.A.; Choi, E.-J.; Lee, J.; Wujek, R.; Al-Gizawiy, M.; Chitambar, C.R.; Connelly, J.M.; Schmainda, K.M. Basal Ganglia Iron Content Increases with Glioma Severity Using Quantitative Susceptibility Mapping: A Potential Biomarker of Tumor Severity. Tomography 2022, 8, 789-797. https://doi.org/10.3390/tomography8020065
Reith TP, Prah MA, Choi E-J, Lee J, Wujek R, Al-Gizawiy M, Chitambar CR, Connelly JM, Schmainda KM. Basal Ganglia Iron Content Increases with Glioma Severity Using Quantitative Susceptibility Mapping: A Potential Biomarker of Tumor Severity. Tomography. 2022; 8(2):789-797. https://doi.org/10.3390/tomography8020065
Chicago/Turabian StyleReith, Thomas P., Melissa A. Prah, Eun-Jung Choi, Jongho Lee, Robert Wujek, Mona Al-Gizawiy, Christopher R. Chitambar, Jennifer M. Connelly, and Kathleen M. Schmainda. 2022. "Basal Ganglia Iron Content Increases with Glioma Severity Using Quantitative Susceptibility Mapping: A Potential Biomarker of Tumor Severity" Tomography 8, no. 2: 789-797. https://doi.org/10.3390/tomography8020065