


Tomography 2025, 11(12), 142; https://doi.org/10.3390/tomography11120142 (registering DOI) - 16 Dec 2025
Abstract
►
Show Figures
Background/Objectives: The breast is a highly radiosensitive organ that is directly exposed to ionizing radiation during chest computed tomography (CT) examinations. Excessive radiation exposure increases the risk of radiation-induced malignancies, highlighting the importance of accurate and patient-specific dose estimation. This study aims
[...] Read more.
Background/Objectives: The breast is a highly radiosensitive organ that is directly exposed to ionizing radiation during chest computed tomography (CT) examinations. Excessive radiation exposure increases the risk of radiation-induced malignancies, highlighting the importance of accurate and patient-specific dose estimation. This study aims to estimate the effective radiation dose absorbed by the breast during chest CT examinations using a machine learning (ML)-based personalized prediction approach. Methods: In this retrospective study, a total of 653 female patients who underwent both mammography and chest CT between 2020 and 2024 were included. A structured database was created incorporating demographic and anatomical parameters, including body weight, height, body mass index (BMI), and breast thickness (mm) obtained from mammography, along with dose length product (DLP) values from chest CT scans. Five regression-based ML algorithms—CatBoost, Gradient Boosting, Extra Trees, AdaBoost, and Random Forest—were implemented to predict breast radiation dose. Model performance was evaluated using Mean Squared Error (MSE), Mean Absolute Error (MAE), Mean Absolute Percentage Error (MAPE), and the Coefficient of Determination (R2). Results: Among the evaluated models, the CatBoost algorithm optimized with Particle Swarm Optimization (CatBoostPSO) achieved the best overall predictive performance, yielding the lowest MSE (0.3795), MAE (0.3846), and MAPE (4.37%), along with the highest R2 value (0.9875). CatBoost and Gradient Boosting models demonstrated predictions most closely aligned with ground truth values, indicating that ensemble-based and dynamically optimized models are particularly effective for breast dose estimation. Conclusions: The proposed machine learning framework enables rapid, accurate, and clinically applicable estimation of breast radiation dose during chest CT examinations. This patient-specific approach has strong potential to support personalized radiation dose monitoring and optimization strategies, contributing to improved radiation safety in clinical practice.
Full article
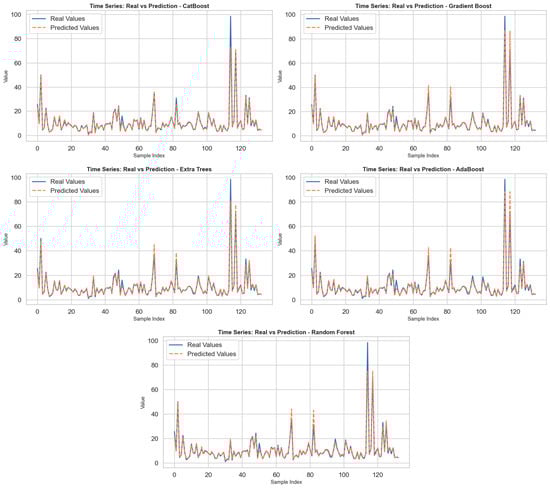
Figure 1


