Abstract
How can we construct the multidimensional evaluation framework of urban vitality from the perspective of urban spatial structure? Under the current intensity of land development, does the population density in the downtown area of Shanghai have the potential to be improved? Can a subdistrict be an appropriate spatial scale for evaluating urban vitality in central Shanghai? First, based on multisource geospatial big data, a comprehensive theoretical framework of the influence mechanism of urban spatial structure on urban vitality was constructed from the three dimensions of population, land use, and traffic, and 11 indicators were selected to form an evaluation index system. Second, the influence mechanism of urban spatial structure on urban vitality was analyzed from the six aspects of economic vitality, cultural vitality, quality of life, social governance, air quality, and nocturnal vitality, using binary spatial correlation analysis and a regression model based on eigenvector space filtering (ESF). The results show the following: (1) According to the combined impact analysis, the job–housing balance degree, floor area ratio, open space ratio, and road network density are positively correlated with urban vitality, while population density, land use mix degree, average block area, rail transit station density, and rail transit station accessibility are negatively correlated with urban vitality. (2) The correlation between population density and the urban comprehensive vitality index is related to the floor area ratio. Under the current land development intensity, the population density of the central urban area of Shanghai has approached the theoretical “ceiling”. (3) Different spatial scales have different effects on urban vitality. Finally, some policy suggestions are proposed to optimize the urban spatial structure and enhance urban vitality.
1. Introduction
Over the past 200 years, the global population has been moving from rural to urban areas, with the share of the global urban population increasing from less than 10 percent in 1800 to 55.7 percent in 2019 [1,2]. Urbanization has become one of the main trends of global population development. Since the reform and opening up, China has also begun the process of rapid urbanization development. However, urban planning, construction, and management in China lag behind the growth of the urban population, resulting in unreasonable urban spatial structures and the phenomenon of “big city disease” [3,4]. The extensive development mode has led to the deterioration of urban quality and vitality, and many cities have encountered problems such as traffic congestion, soaring housing prices, and environmental degradation. In recent years, with the transformation of urban development from epitaxial expansion to connotative compact patterns, research on high-quality urban development and urban vitality has attracted much attention [5,6,7]. The “Shanghai Urban Master Plan (2017–2035)” clearly states that Shanghai is becoming “a more dynamic and innovative city”. Improving the vitality of a city from the aspects of green ecology, economic development, cultural creativity, and quality of life can not only improve people’s life satisfaction but also help shape the image of a city and promote its sustainable development.
In the past, because of the limitations of technology and data acquisition, the data types used in urban studies were limited, and scholars usually studied urban problems such as urban planning, land use, ecological systems, and traffic management on a large scale. Sometimes, they need more detailed data, which can only be obtained through investigation and field visits. It is not only difficult to obtain data but also difficult to cover the whole city with the amount of data. Only local urban research can be carried out, and it is difficult to analyze urban problems on a global level. In recent years, with the advancement of science and technology, the complete coverage of the internet, and smart city construction, new types of geographic data (e.g., POI data, mobile phone signaling data, and Weibo check-in data) are increasing, and the combination of traditional social and economic data and new geographic data provides better data to support academic research.
The purpose of this paper is to attempt to answer three basic academic questions: (1) How can we construct the multidimensional evaluation framework of urban vitality from the perspective of urban spatial structure? (2) Under the current intensity of land development, does the population density in the downtown area of Shanghai have the potential to be improved? (3) Can a subdistrict be an appropriate spatial scale for evaluating urban vitality in central Shanghai?
2. Literature Review and Theoretical Framework
2.1. Literature Review
2.1.1. Study on Urban Spatial Structure
The spatial structure of modern cities has, to a large extent, been shaped by advances in transportation and communications [8]. The common urban spatial structure includes a monocentric structure and polycentric structure. The monocentric city model explains the land use competition among industrial production, commercial activities, and residential areas [9]. However, whether in theory or in practice, the monocentric city model has some defects [10], while the multicenter city model is increasingly used in urban research, involving many fields, such as population [11], employment [12], economy [13], transportation [14], and ecology [15]. Drivers of growth in polycentric cities [16], urban growth simulation [17], and the impact of urban growth on economic productivity [18,19] have also received attention. In addition to monocentric and polycentric urban spatial structure patterns, there are other types of spatial structure patterns, such as “edge city” [20] and “compact city” [21]. Although there are a variety of urban spatial structure patterns, there is no strict limit on their specific advantages and disadvantages. Different cities should scientifically plan their future urban spatial structure system based on their own geographical and cultural factors and developmental stages.
According to the research purpose and data accessibility, different studies will measure one or more dimensions of urban spatial structure. The measures of population spatial structure include population density, employment density, job–housing balance, and population centrality [22,23,24,25]. The common indices of urban land use spatial structure are land use mix degree [26,27], building density, floor area ratio and residential density [24,28,29], average number of floors, and average block area [30,31]. The most common measurement indices of traffic network structure are road network density [23,25], street connectivity [32], road length and road length per capita [26,30], intersection density [33], four road junction ratios [24,25], public transport accessibility [27,34], sidewalk density [24], commuting distance [34], road coverage, and average road width [35]. Some scholars also measure the urban spatial structure from the perspective of green space and water area, and specific indicators include the proportion of urban green space, whether it borders forests, and the distance from public waterways [30,36]. For the study of urban spatial structure, with the change in research scale, the research object and research unit also change correspondingly. In previous studies, from the macro urban scale to the micro urban scale, the research objects were the regional-level spatial structure, urban-level spatial structure, street-level spatial structure, and grid-level spatial structure. The urban spatial structure at the regional level mainly includes the urban agglomeration spatial structure [37], megacity spatial structure [38], and metropolitan area spatial structure [39]. The spatial structure at the city level usually takes a single city as the research object [40,41,42]. The urban spatial structure at the street level mainly refers to the spatial structure of suburban units under the jurisdiction of municipal administrative districts, such as subdistricts and towns in China, neighborhoods in the United States, wards in the United Kingdom, and towns in Japan [43,44,45].
2.1.2. Study on Urban Vitality
Jacobs [46], in her monograph “Death and Life of American Big Cities”, proposed the concept of urban vitality and elaborated its realization conditions. She believes that the vitality of a city is closely related to the diversity of the city and that there are four necessary factors to generate the diversity of the city, i.e., the streets should have a mix of main uses, and most sections should be short, with an appropriate proportion of old buildings and a high enough pedestrian density. For a long time in the past, urban vitality lacked a quantitative comprehensive index system. In recent years, the measurement of urban commercial center vitality, urban economic vitality, and urban cultural vitality has gradually emerged. There are similarities between the measures of urban commercial center vitality and urban economic vitality, which usually include GDP, housing rent, human capital, productivity, and other indicators, while commercial vitality indicators sometimes also include indicators related to pedestrian flow and commercial behavior [47,48,49]. The measurement indices of cultural vitality mainly include creativity and innovation, number of cultural institutions, participation opportunities for cultural activities, and various aspects of cultural support [50,51]. Some scholars measure urban vitality from the perspective of urban ecology [52,53]. In Europe and the United States, the community or neighborhood is one of the most common research units in urban studies, so there are many studies on urban vitality at the community or neighborhood scale. The measurement of community vitality generally includes indicators related to interaction with residents, social tolerance, and crime rate [54,55]. Some studies comprehensively evaluate urban vitality from multiple dimensions, such as economy, culture, and ecology. For example, Lan et al. [56] took 35 large and medium-sized cities in China as research objects and divided urban vitality into five dimensions: economic vitality, social vitality, cultural vitality, innovation vitality, and environmental vitality. In terms of indicator selection and data sources, the POI (point of interest) density [57,58], house price [58], nighttime light [57], LBS (location-based services) data [59], and cell phone signaling data [60] are used to measure urban vitality.
2.1.3. Study on the Interactive Relationship between Urban Spatial Structure and Urban Vitality
Since 2013, with the rapid development of spatial big data, scholars have obtained increasingly detailed data for the quantitative analysis and evaluation of urban vitality. Some studies have analyzed the impact of urban density, land use, and building type on urban vitality from the perspective of urban blocks.
Zhang et al. [61] examined the impact of the urban landscape on urban vitality and its spatial and temporal heterogeneity based on remote sensing data, building footprint data, POI data, and public comment data and used a linear regression model and geographically weighted regression model. Xia et al. [62] analyzed the relationship between land use at the block level and urban vitality based on POI data, building floor data, street data, and nighttime light data in five large cities in China and found some spatial mismatches. Some scholars divide cities into grids and take geographic grids as the minimum research unit. Long et al. [63] took 286 cities in China as the research object, and the minimum research unit was a grid with an area of 1 square kilometer. The regression model was used for analysis, and used crowd comment data, microblog check-in data, POI data, and housing price data from SouFun.com. They analyzed the influence of urban form indicators (such as road network density and mixed land use) on urban economic vitality and found that all the indicators of urban form are significantly correlated with urban economic vitality.
In summary, although great progress has been made in the study of urban spatial structure and urban vitality, the following research potentials still exist: (1) comprehensive measurement of urban vitality needs to be further studied; (2) the consideration of urban spatial structure factors is not comprehensive enough; and (3) the analysis methods adopted in some studies did not consider the factors of spatial autocorrelation between research units. This paper will address these issues.
2.2. Theoretical Framework
2.2.1. Theoretical Model
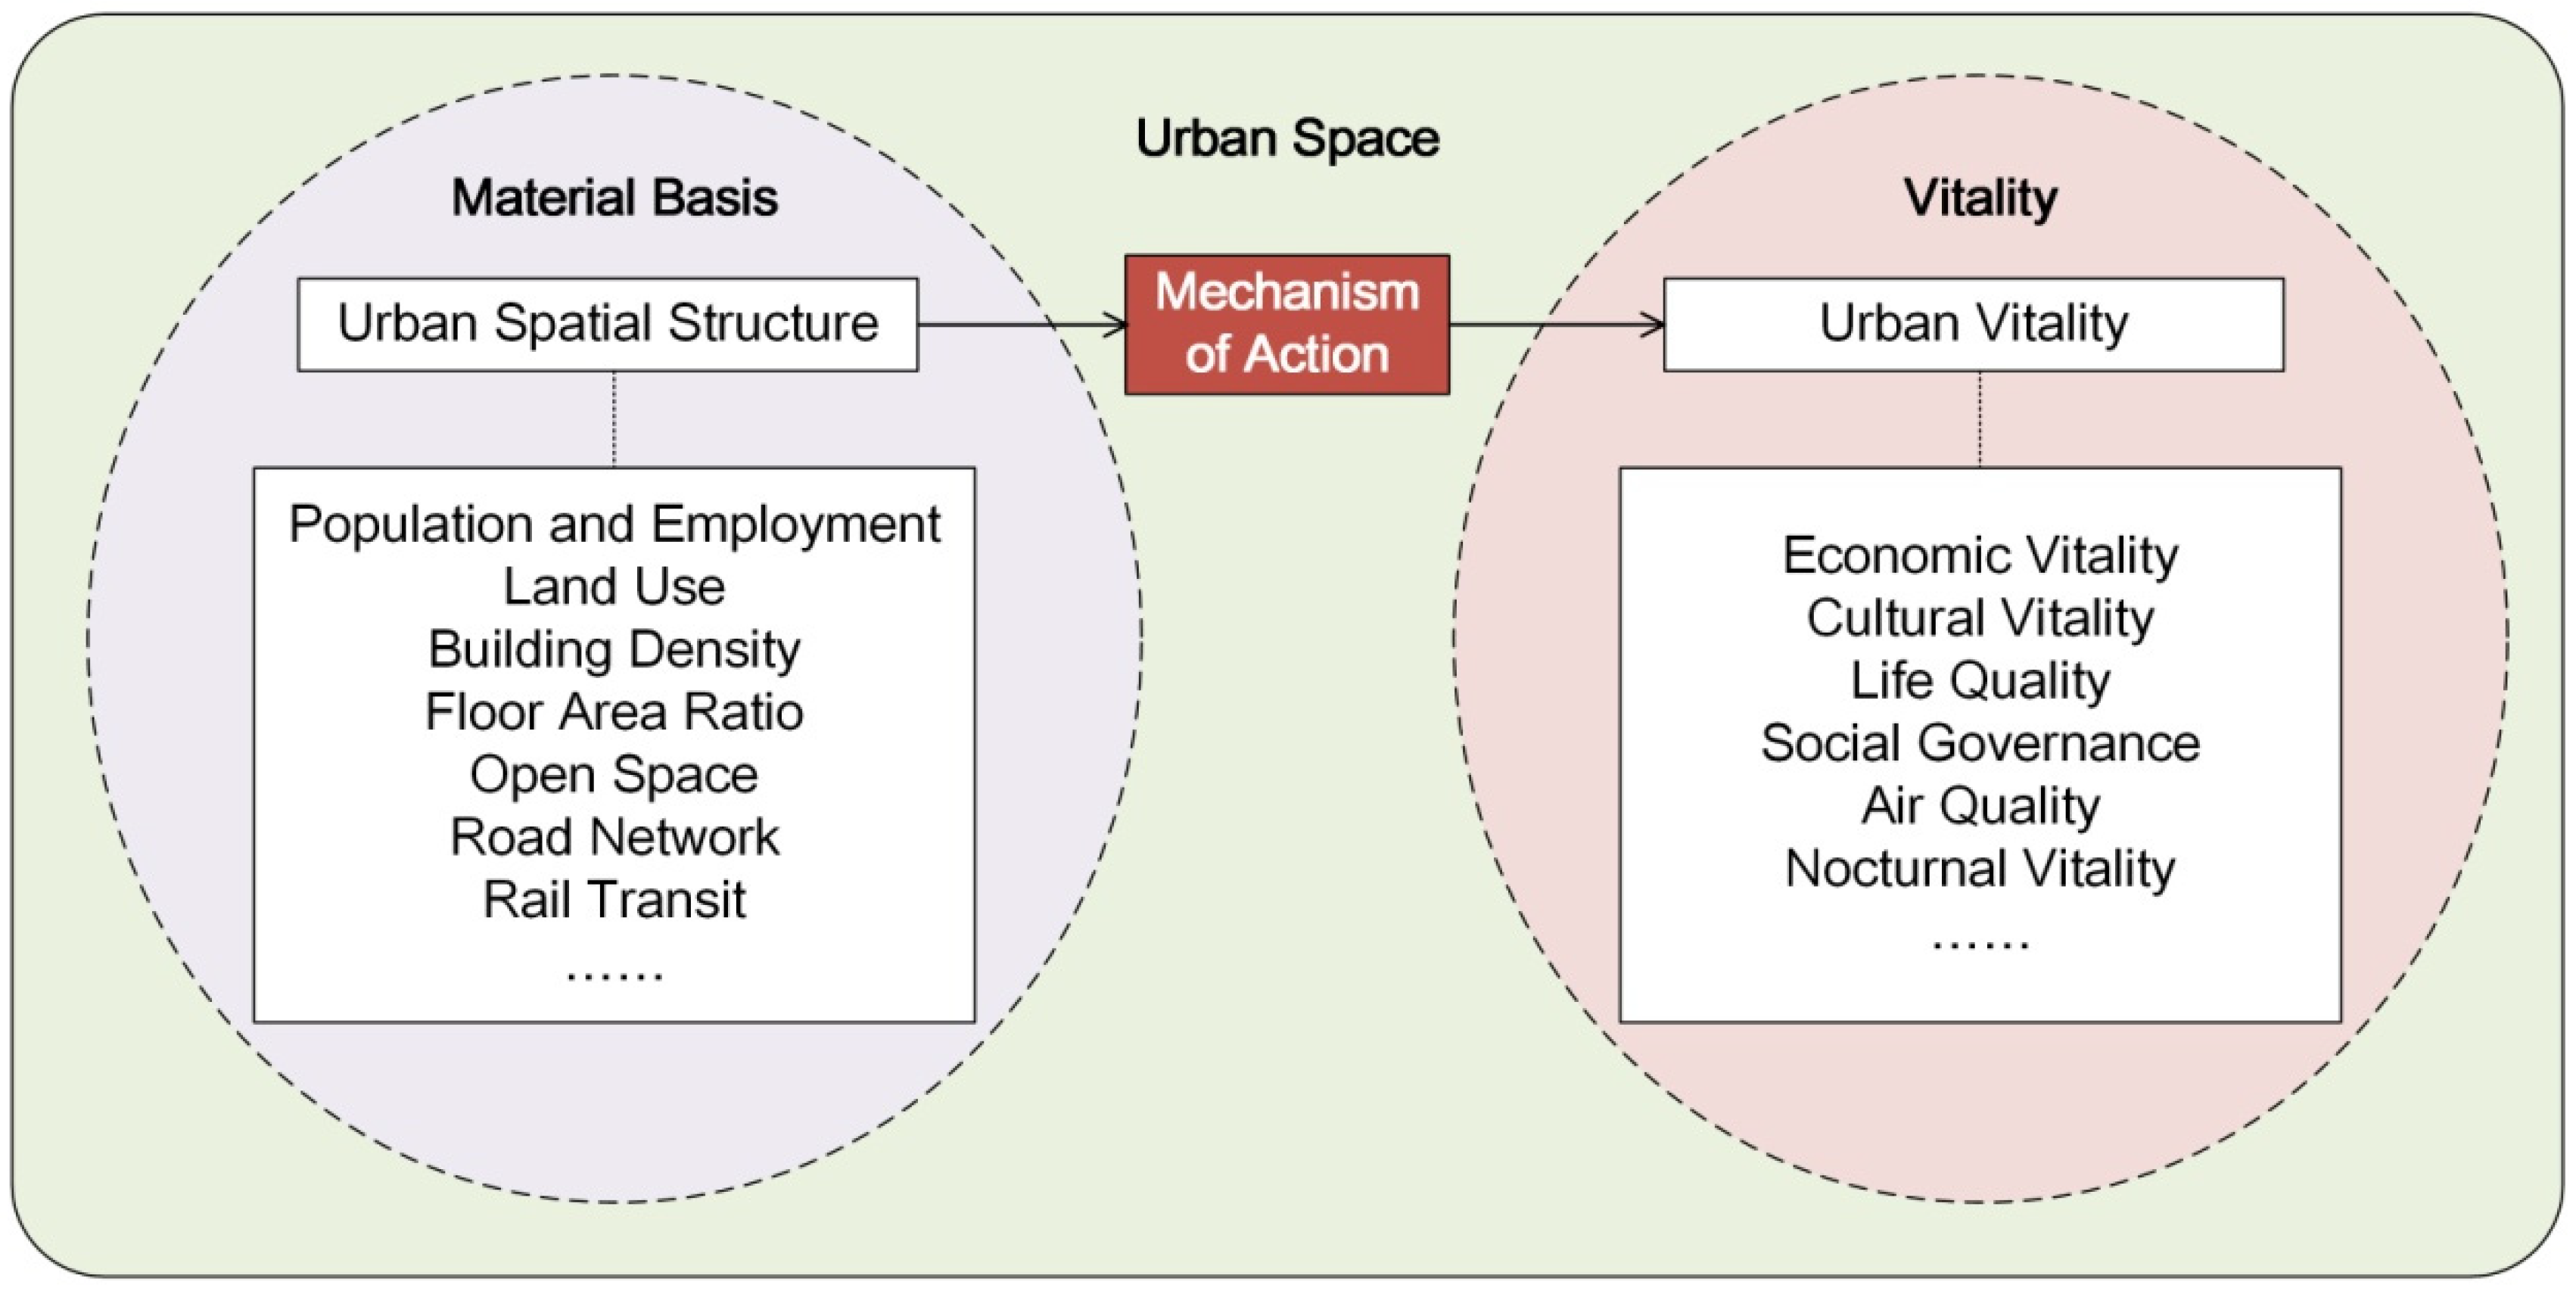
In the process of urban construction and development, various elements of urban space are constantly improved. Population, roads, buildings, water systems, and open space in the city jointly build the material foundation of the whole city. Due to the influence of human factors and natural conditions, these elements may present different distribution states of agglomeration or dispersion, resulting in different urban spatial structures. This paper will analyze the urban spatial structure pattern from population and employment, land use, building density, floor area ratio, open space, road network, and rail transit. All kinds of material elements in the city interact with each other and influence the city, and the external expression of this influence is the vitality of the city. The whole process of action takes place in the urban space. The specific manifestations of urban vitality include economic vitality, cultural vitality, quality of life, social governance, air quality, and nocturnal vitality. The high-value area of urban vitality is the vitality center, which has a certain radiative ability and can influence the surrounding area. Based on this, the theoretical model constructed in this paper is shown in Figure 1.
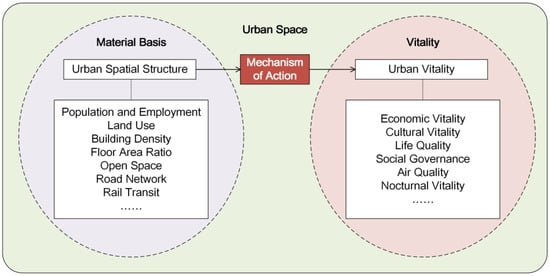
Figure 1.
A theoretical model of the influence mechanism of urban spatial structure on urban vitality.
2.2.2. Indicator System
This paper divides the urban spatial structure into two levels. The first level includes three dimensions: population spatial structure, land use spatial structure, and traffic spatial structure; the second level includes specific measurement indicators (Table 1). The main basis for the selection of indicators is as follows: (1) an appropriate population density is conducive to the sustainable development of a city, and the job–housing relationship is closely related to commuting mode, resource allocation, and public facilities construction. (2) The mixed land use degree reflects the quantitative characteristics and spatial structure of various types of land. The average block area reflects the organizational form of urban land; building density and plot ratio can represent the urban land development density and development intensity, and the proportion of open space and fragmentation reflect the land use patterns related to urban livability. (3) Urban road networks and public transportation are both important parts of urban transportation. In this paper, three indices are selected to measure the traffic spatial structure of the Shanghai urban central area, including road network density, rail transit station density, and rail transit station accessibility.

Table 1.
Measurement indices of urban spatial structure.
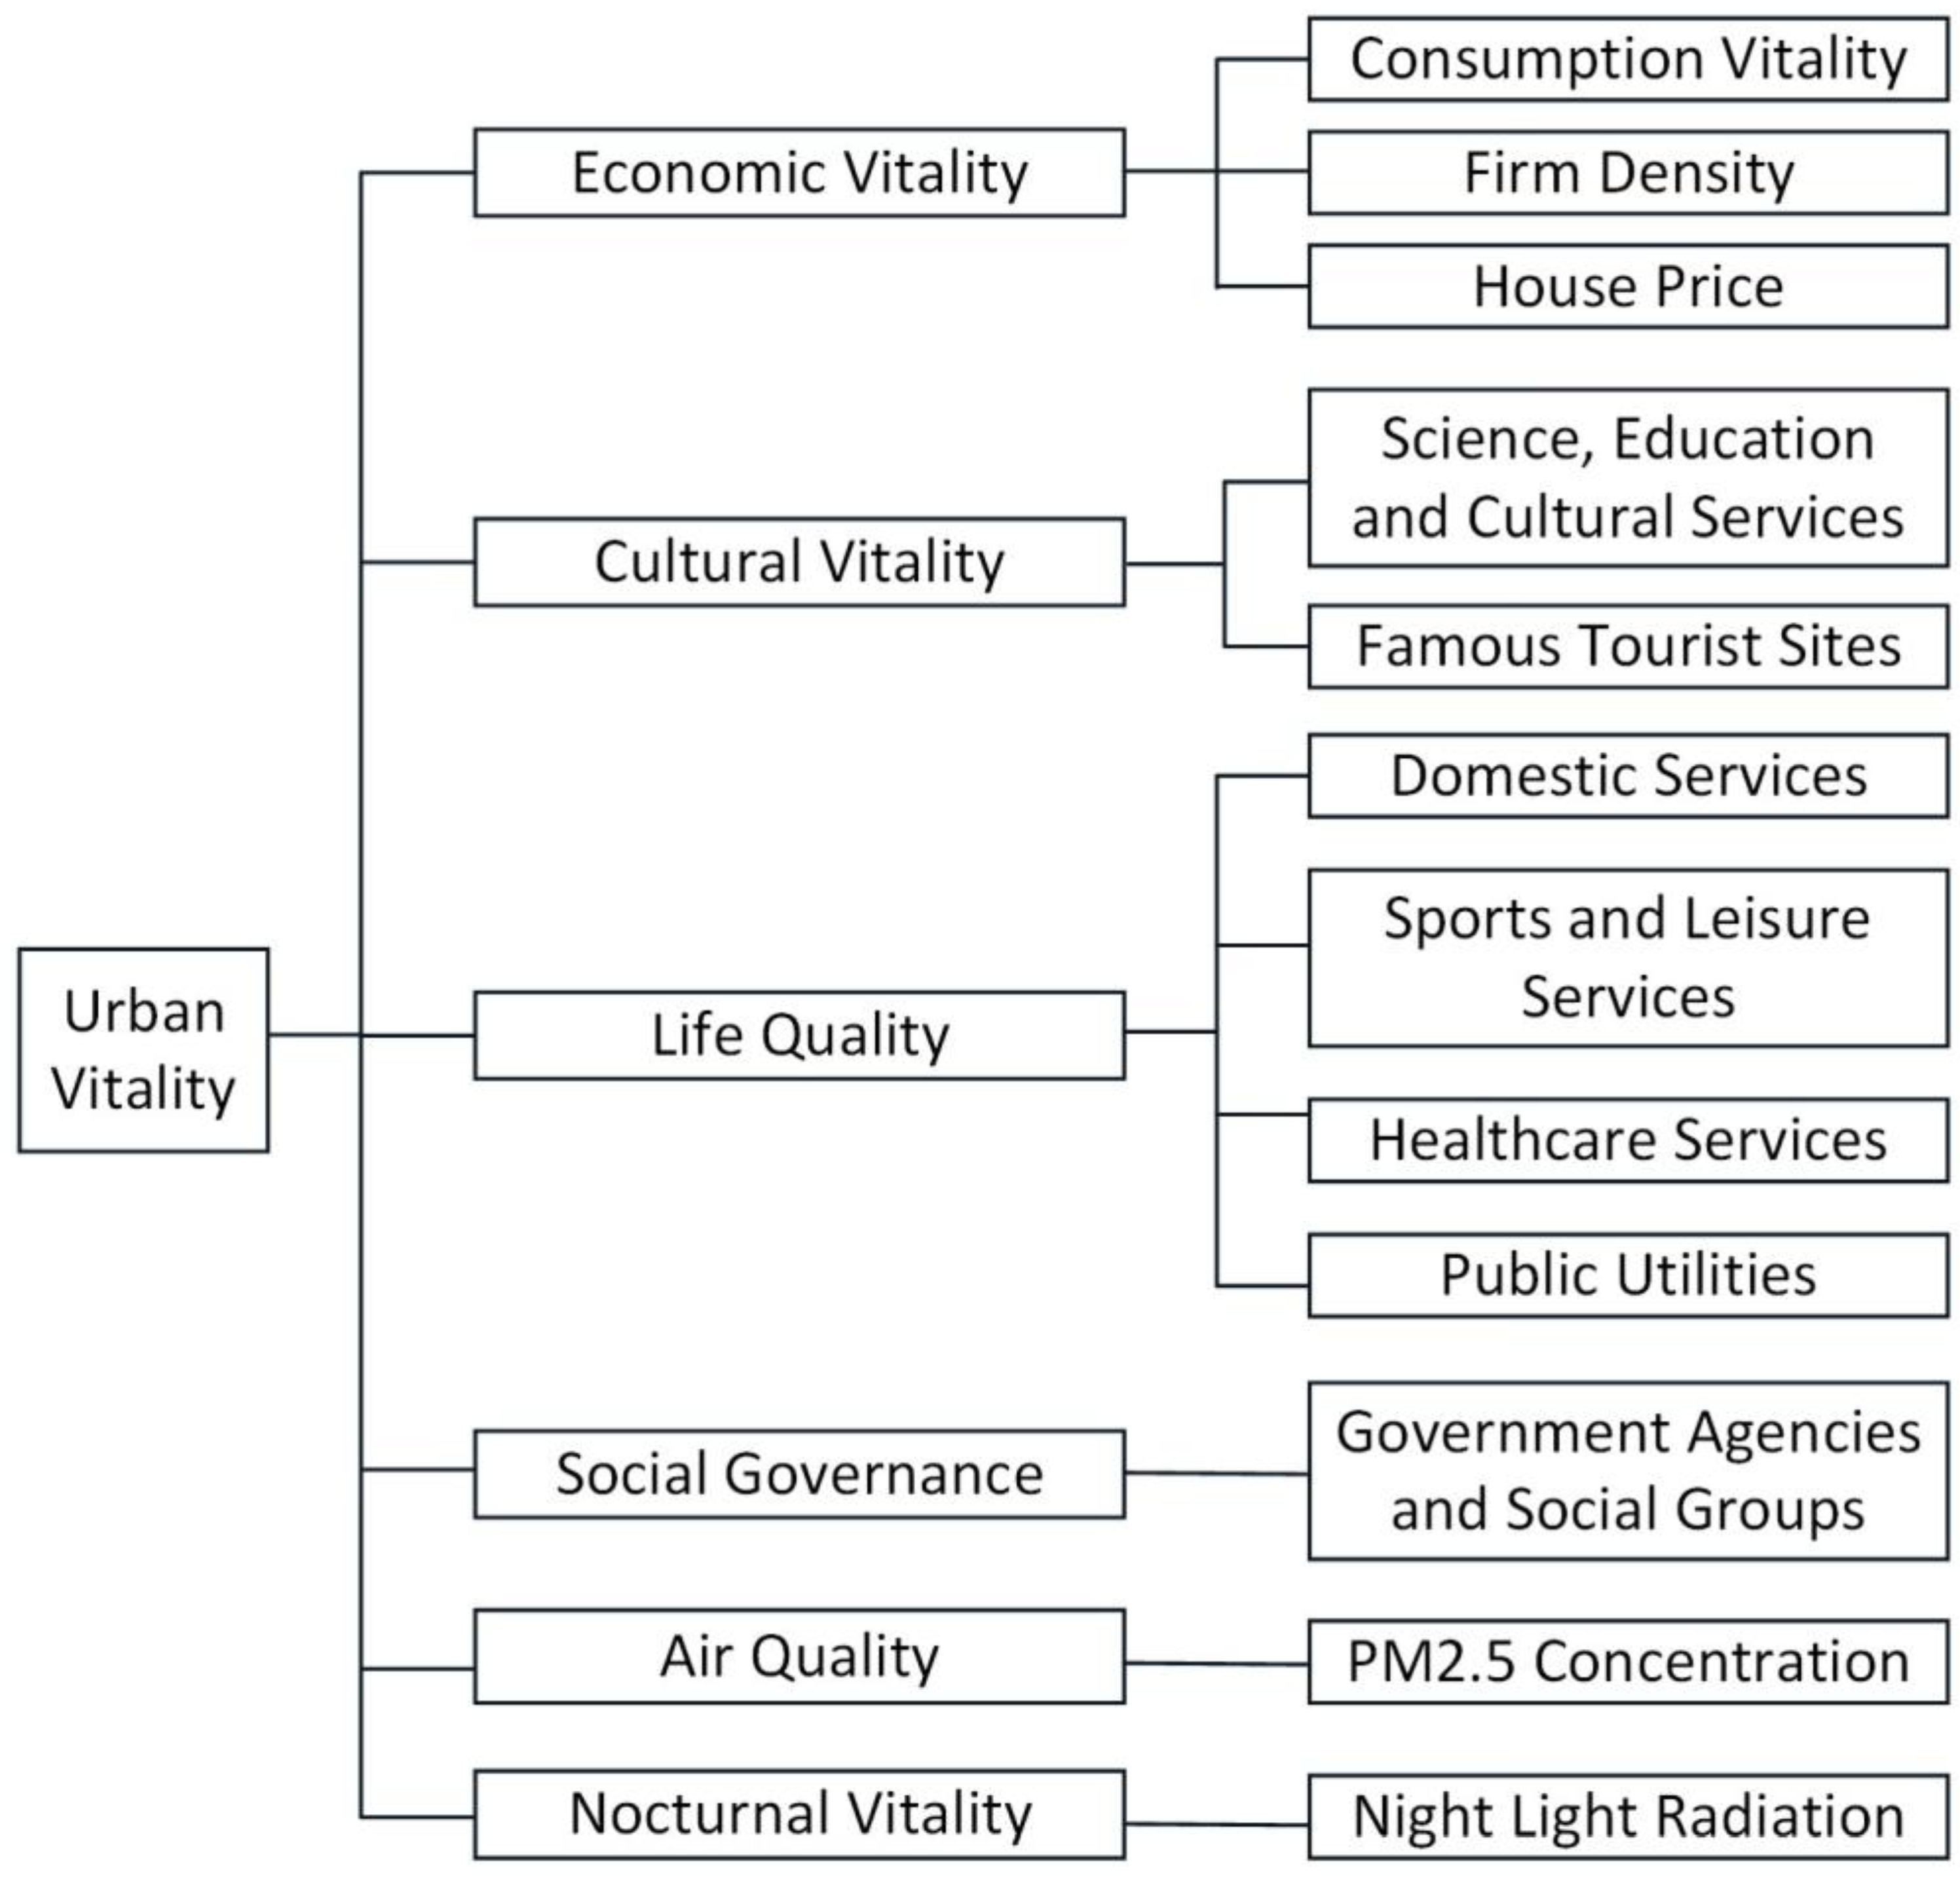
This paper divides urban vitality into six dimensions: economic vitality, cultural vitality, quality of life, social governance, air quality, and nocturnal vitality. The specific indicators of urban vitality are shown in Figure 2.
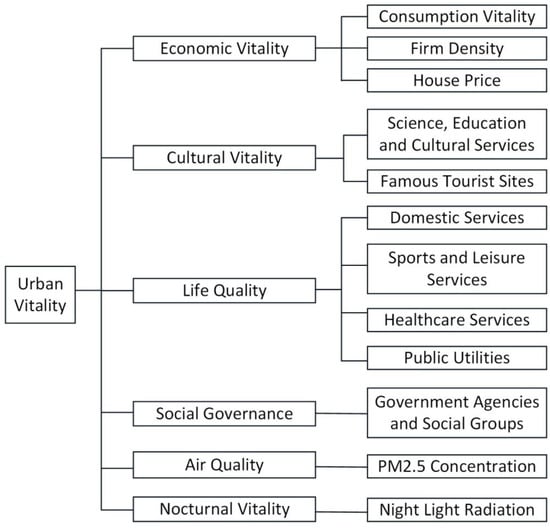
Figure 2.
Urban vitality index system.
Economic vitality includes consumption vitality, enterprise density, and housing price. Over the past 30 years, China has gradually shifted from an economic growth model highly dependent on the construction industry to one driven by consumption. This paper selects three points in POI data that are directly related to consumption, namely, catering services, shopping services, and accommodation services, to measure consumption vitality. The size of enterprise density is the portrayal of a city’s industrial scale and economic development level [64]. In this paper, the data of the “company” label of POI data are selected to measure the enterprise density. The real estate market is closely related to urban economic development, and housing prices can reflect the level of urban economic development. Moreover, the healthy growth of the real estate market is conducive to the improvement of the urban economy. This paper uses the secondhand housing data from the Lianjia website to calculate housing prices.
A city with a cultural atmosphere can not only provide leisure, entertainment, science, and education services for its citizens, but it can also improve the innovation and creativity of a region. This paper uses the density of “science, education, and cultural service” points and “scenic spots” points in POI data to measure regional cultural vitality.
The quality of life indicators selected in this paper are mainly measured by POI data. From the perspective of various convenient services available to residents around the city and combined with the POI data, the quality of life is divided into four categories: life services, sports and leisure services, medical and health care services, and public facilities.
Refinement and grid of social governance is one of the main research directions at present. Social governance cannot completely rely on government agencies but needs to integrate all kinds of resources in society to achieve collaborative governance of all sectors of society. Collaborative subjects of social governance include various subjects participating in the collaborative governance of society, such as party organizations, governments, social organizations, enterprises, people’s organizations, and grassroots autonomous organizations [65]. Therefore, when selecting individuals participating in social governance, this paper selects not only various government agencies but also the subjects of social collaborative governance and measures the degree of refinement of urban social governance according to the density of selected institutions participating in social governance.
Air quality is a feature that reflects the advantages or disadvantages of the environment. PM2.5 is one of the main particle pollutants in cities. In this paper, the PM2.5 concentration is selected to represent urban air quality.
Nighttime light remote sensing data have become a common tool for studying nighttime economic behavior and human activities. In this paper, nighttime activity is used as a human activity index at night, and the data source is Luojia No. 1 nighttime light remote sensing data.
3. Methodology
3.1. Study Area
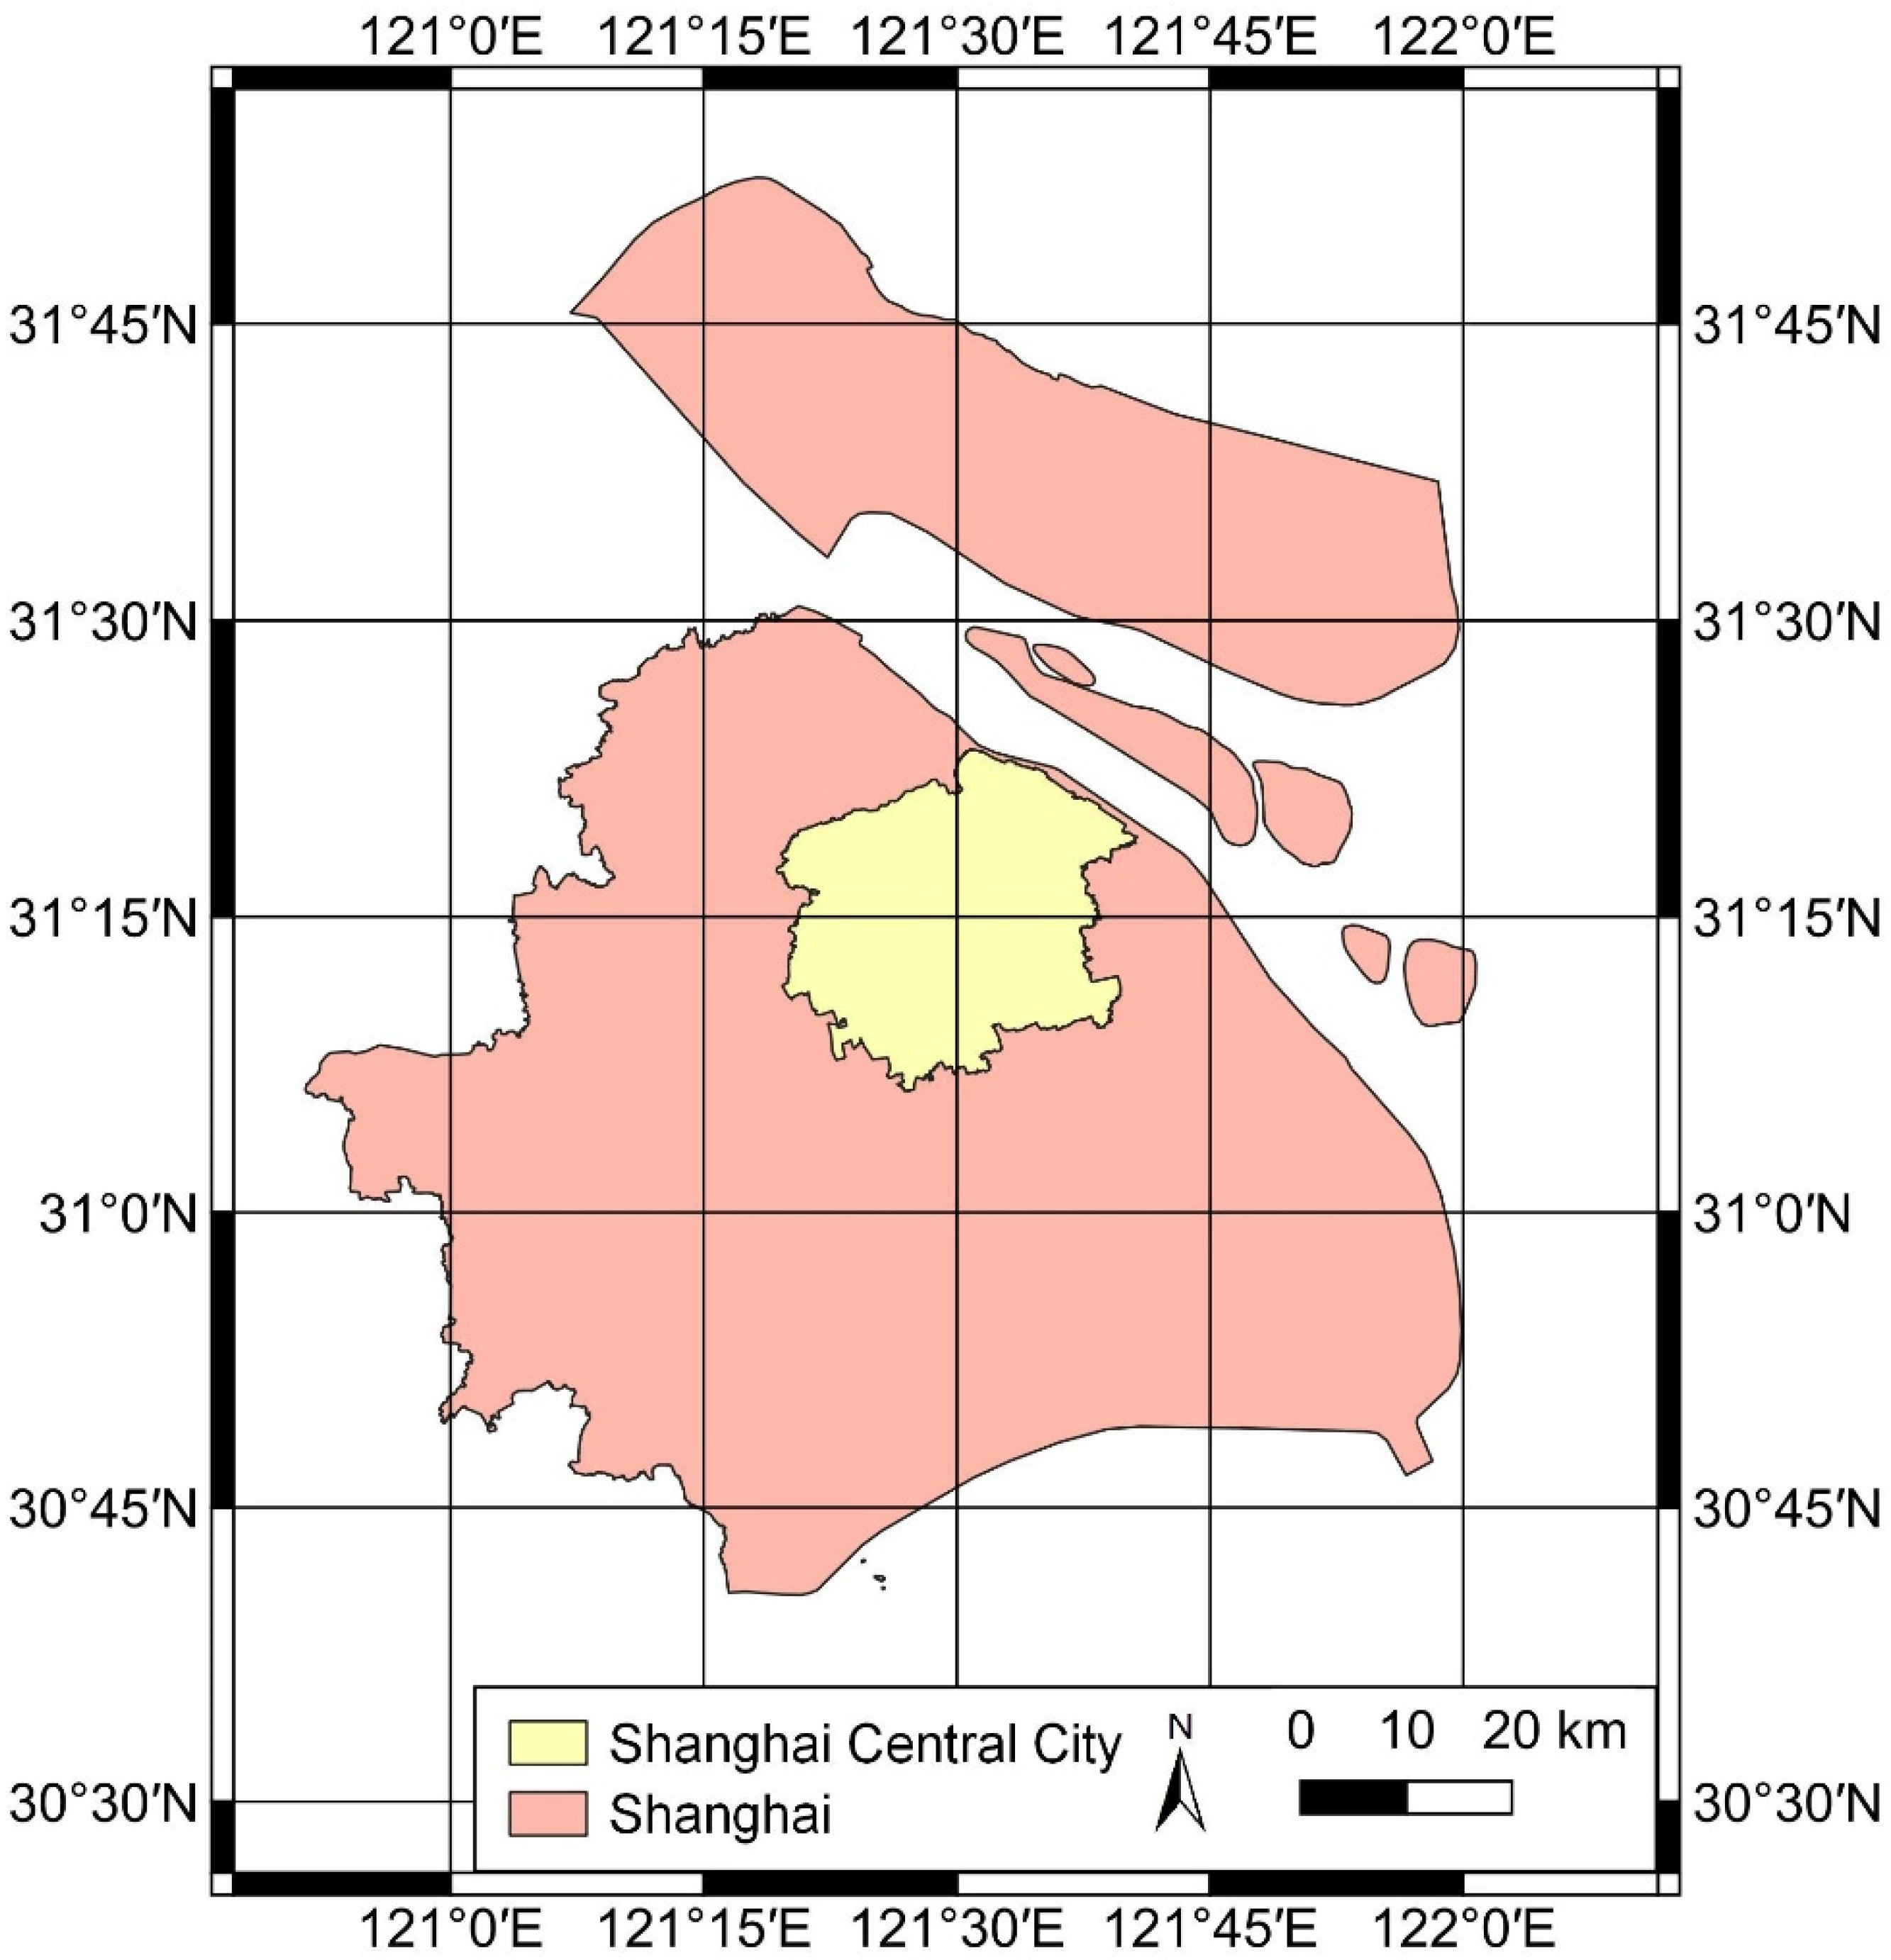
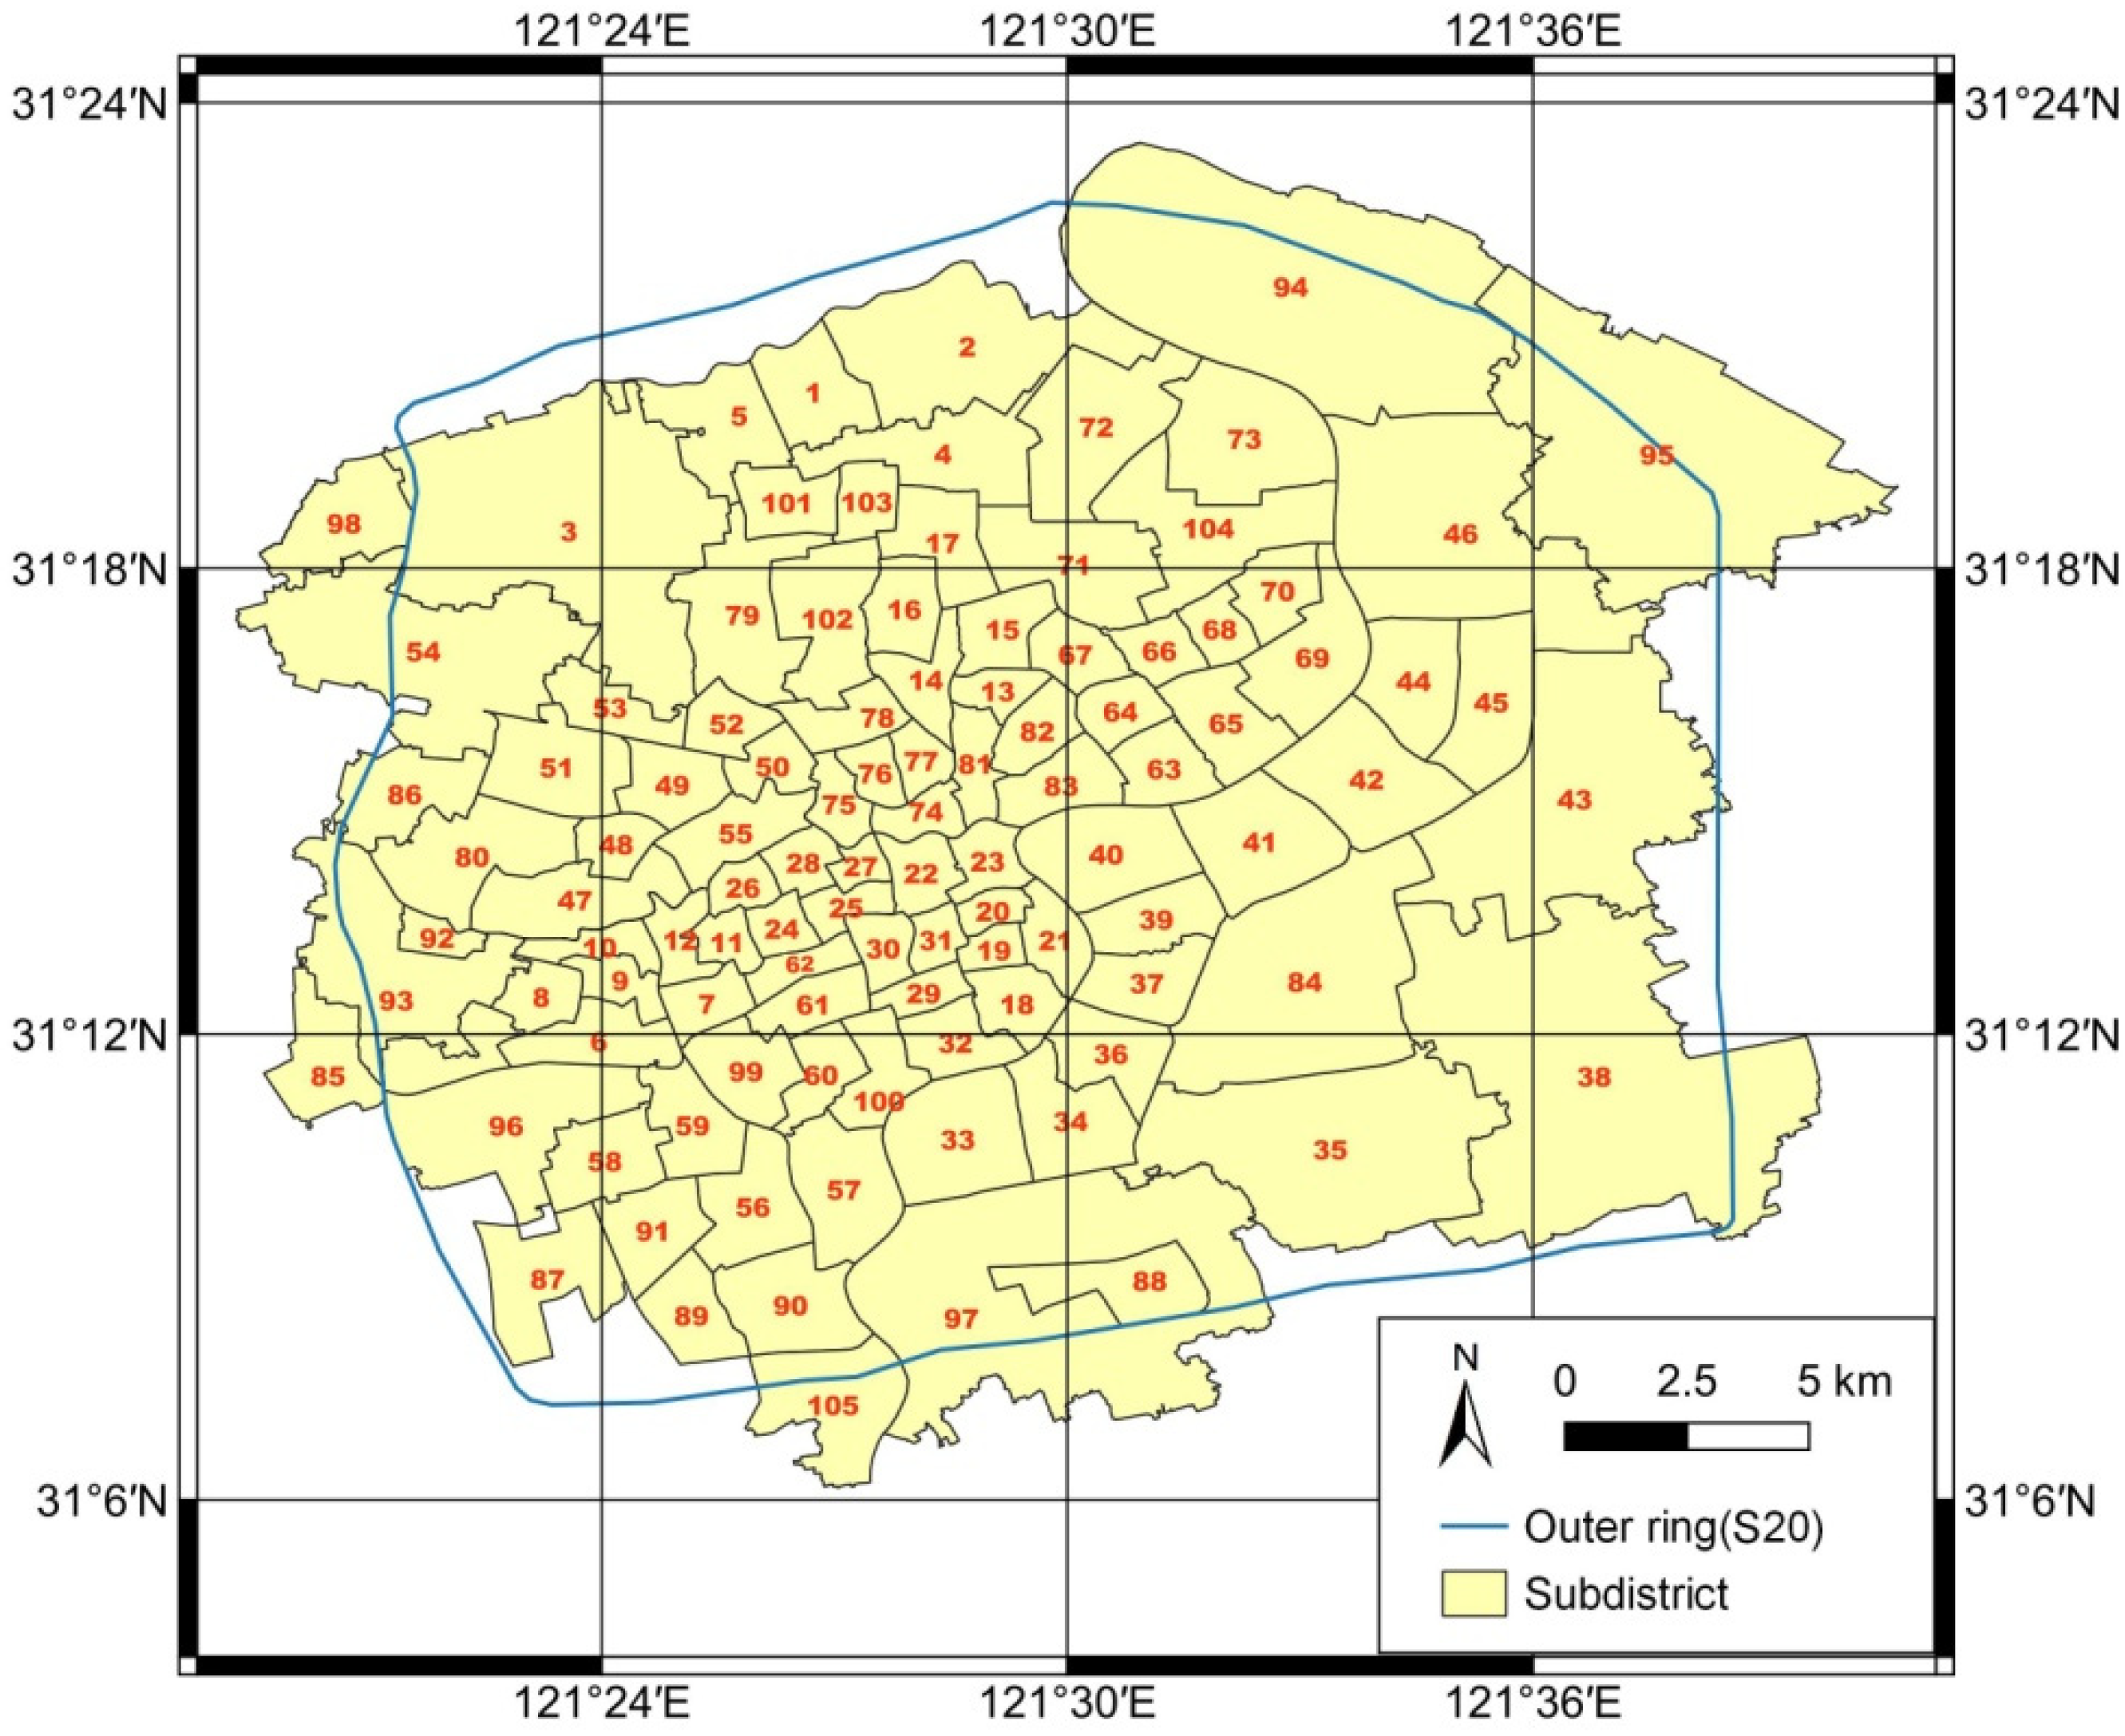
The main research area of this paper is the urban central area within the outer ring of Shanghai, which is located between 121°19′–121°40′ E and 31°6′–31°23′ N, as shown in Figure 3. For convenience, subdistrict (town) is chosen as the basic research unit in this paper. In the Shanghai Urban Master Plan (2017–2035), the area within the outer ring road is defined as a central city. The central urban area of an international metropolis is generally approximately 600–800 square kilometers. For example, central Tokyo is 628.7 square kilometers, Paris and its three suburbs (Seine-Saint-Denis, Valedmarne, and Haut-Seine) have a total area of 763.5 square kilometers, and New York City has a land area of 782.8 square kilometers. The size of Seoul Special City is 605.2 square kilometers. In this paper, 105 subdistricts (towns) (Figure 4), with a total area of 691.2 square kilometers, were determined as the research object, taking Shanghai outer ring expressway S20 as the reference.
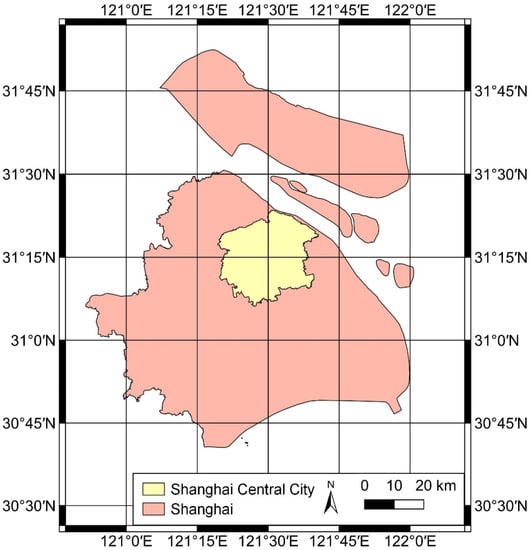
Figure 3.
Research area of this paper.
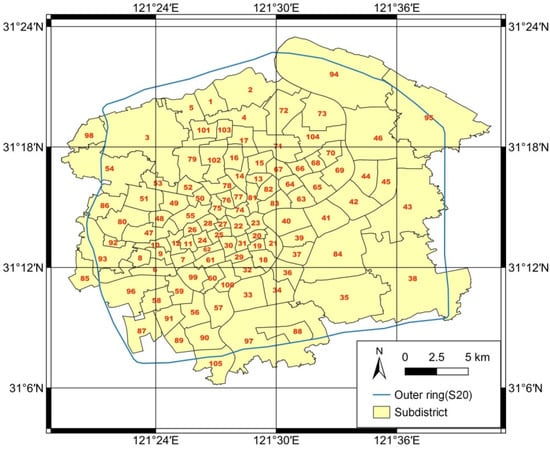
Figure 4.
The 105 subdistricts of the Shanghai central city.
3.2. Data Sources and Preprocessing
The data used in this paper mainly include urban spatial structure data and urban vitality data. The main data sources are shown in Table 2.

Table 2.
Research data sources.
The population spatial data include permanent population data and employment population data. The permanent population data adopt the data of the Sixth National Population Census in 2010. The number of employees in subdistricts of the Third Economic Census in 2013 is taken as the employed population. Land use spatial structure data include the land use data and green open space data and building bottom and height data, land use data from the Shanghai land use map in the “Shanghai Urban Master Plan (2017–2035)”, using the image classification tools in ArcMap 10.7 (Copyright © ESRI. www.esri.com, accessed on 19 March 2022), maximum likelihood classification, and manual correction. The final land use classification results include residential land, public facilities land, transportation land, industrial and storage land, urban green land, agricultural land, forestry land, water area, and other land. The data on open green spaces are drawn by hand from the base map of the Map World. Data on the building’s floor and floor height come from the data site “Urban Data Party”. Traffic spatial structure data include road network data and rail transit station data, of which road network data come from the OpenStreetMap website. This paper uses the Topology Builder module in FME Desktop 2018.0.1 software (Copyright © Safe Software Inc. www.safe.com, accessed on 19 March 2022) to build topology on the original data and obtain a set of road network data represented by edges and nodes. The rail transit station data are drawn manually based on the ground map of the Map World.
Urban vitality data include points of interest (POI) data, residential price data, nighttime light remote sensing data, and PM2.5 data. POI data come from a map API and are obtained by Python programming. The housing price data are the secondhand housing data of Shanghai in September 2018 extracted from the Lianjia website by the crawler tool. The Geocoder module in FME Desktop 2018.0.1 software is used to select ArcGIS Online geocoding service to geocode the secondhand housing address of Lianjia. To obtain the specific longitude and latitude information of secondhand housing, the inverse distance weight interpolation method is used for the spatial fitting of housing price data. The remote sensing data of nighttime light are the remote sensing data of Luojia No. 1 nighttime light. After the exponential transformation of the grey value of the image, the value of 1010 times the amplification of the radiation brightness value is obtained, which is used as the original value of urban vitality analysis. The PM2.5 data were based on the results of the Atmospheric Composition Analysis Group at Dalhousie University.
3.3. Methods
3.3.1. Comprehensive Evaluation Method of Urban Vitality
In this paper, the general weighted evaluation method with entropy weight and entropy weight–TOPSIS (technique for order of preference by similarity to ideal solution) methods are combined to comprehensively evaluate urban vitality. First, when determining the weight, there are subjective weights and objective weights. Subjective weight includes the Delphi method, direct scoring method, and simple multi-attribute scoring method. Subjective weight is easily affected by the subjective concept of researchers. The entropy weight method is an objective weight method that completely depends on the calculation of original data and can provide a more accurate weight value than the subjective weight method. The TOPSIS method is one of the most popular multiple-criteria decision-making (MCDM) approaches [66,67]. The TOPSIS method makes full use of data information, has no strict restrictions on the number of indicators, sample size, and data distribution, and can provide reliable evaluation results through simple calculation. However, for some complex multi-indicator decision-making methods, the sample size needs to be large, and the calculation process is relatively cumbersome [68]. Therefore, the entropy weight–TOPSIS method was chosen in this paper. Before calculating the entropy weight, both the ordinary entropy weight method and entropy weight–TOPSIS method need to standardize the data. The general weighted evaluation method with entropy weight uses the min–max standardization method, and the entropy weight–TOPSIS method uses the vector standardization method [67].
- (1)
- Standardization of decision matrix
Assuming m evaluation objects and n evaluation indexes, decision matrix D is constructed as follows:
Since the units of different evaluation indicators are different, in order to eliminate the influence of the dimension, it is necessary to standardize the decision matrix. The min–max normalization method used by the general entropy weight method is
where is the minimum value of the j-th evaluation index, and is the maximum value of the j-th evaluation index.
The vector normalization method used by entropy weight–TOPSIS method is
- (2)
- Calculating entropy weight
According to the definition of entropy in the information entropy theory, the entropy value of the j-th evaluation index is calculated as
where , and if , take .
Calculate the entropy weight of the j-th evaluation index :
- (3)
- General weighted evaluation method with entropy weight
The evaluation results of each evaluation object can be calculated as
where is calculated according to Equation (2).
- (4)
- TOPSIS method for comprehensive evaluation.
Determine positive ideal solution and negative ideal solution according to Equations (7) and (8):
where for benefit criteria, ; and for cost criteria, ; .
The distance between each evaluation object and the positive ideal solution and the negative ideal solution is calculated as and :
Calculate the proximity between each evaluation object and positive ideal solution :
where . The closer that is to 1, the closer the evaluation object is to the optimal level. The closer that is to 0, the closer the evaluation object is to the lowest level.
The specific steps for a comprehensive evaluation of urban vitality are the following:
- Step1:
- Input raw data to calculate second-level indicators of urban vitality of each subdistrict (town).
- Step2:
- Perform min–max standardization on the second-level indicators of urban vitality, calculate the entropy weight, and use the general weighted evaluation method with entropy weight to calculate the first-level indicators of urban vitality of each subdistrict (town).
- Step3:
- Perform vector standardization on the first-level indicators of urban vitality, calculate the entropy weight, and use the entropy weight–TOPSIS method to calculate the comprehensive urban vitality index of each subdistrict (town).
3.3.2. A Binary Correlation Analysis Method of Urban Spatial Structure and Urban Vitality
Since data distributions with different spatial distributions and correlation degrees may have the same Pearson correlation coefficient, a binary correlation coefficient considering the spatial correlation of data is needed. Lee [69] proposed a binary spatial correlation measure index that integrated the Pearson correlation coefficient and Moran index.
The Pearson correlation coefficients of variables and can be calculated according to the following Equation (12):
where is the Pearson correlation coefficients of variables and ; and are the i-th element and the mean of variable ; and and are the i-th element and the mean of variable .
is the binary connectivity matrix whose elements have a value of 1 for contiguous spatial units and 0 for the others. The global Moran’s I describes the correlation between a variable and the spatial weight matrix, which can be used to characterize the spatial aggregation or spatial dispersion of the observed variables [70]. Moran’s I is given by [71]:
where is an element of ; and are the i-th element and the mean of variable .
is a row-standardized version of (each element is divided by its row-sum).
The method of calculating spatial lag according to the spatial weight matrix is as follows:
where is the spatial lag of i-th spatial unit, is an element of , and is the i-th element of variable .
Lee [69] proposed an important tool for calculating binary spatial correlations: spatial smoothing scalars (SSS).
where is the element in the spatial weight matrix ; and are the i-th element and the mean of variable . If the spatial weight matrix is standardized as , then
The binary spatial correlation coefficient between variables can be calculated as follows:
where is a binary space smoothing scalar between variables.
3.3.3. Eigenvector Space Filtering Regression (ESF Regression)
Griffith [72] proposed a spatial autoregression based on eigenvector space filtering (ESF) and later extended this method to multivariate geographic regression. The method constructs multiple linear regression equations based on independent variables and selected eigenvector space filtering. ESF regression can eliminate the autocorrelation feature of the residuals of ordinary multiple linear regression (OLS regression) of geographic data and make the residuals appear randomly distributed [73].
Griffith [74] considered that geographically weighted regression has two defects; one is the loss of degrees of freedom, and the other is the high level of multicollinearity. For these two problems, ESF regression provides a better solution.
To perform ESF regression, first, eigenvector spatial filtering should be extracted. Based on the binary connectivity matrix and corresponding eigenvector , the following formula is satisfied:
where is an n × n identity matrix, is an n × n spatial weight matrix consisting of 0 and 1, and is a vector of n × 1, and is a diagonal matrix containing n eigenvalues. The computed n eigenvectors are orthogonal and independent of each other. The first eigenvector, i.e., E1, is the one with the largest Moran exponent among n eigenvectors, and the second eigenvector is the one with the largest Moran exponent unrelated to . This process continues until , which has the strongest negative spatial correlation and is not correlated with the previous (n − 1) eigenvectors [75]. According to the degree of spatial autocorrelation, eigenvectors can be divided into three groups: high spatial autocorrelation that involves global eigenvectors, medium spatial autocorrelation that involves regional eigenvectors, and low spatial autocorrelation that involves local eigenvectors. There is no strict boundary between the three groups of eigenvectors [76].
The geographically weighted regression model based on eigenvector space filtering can be expressed as follows:
where is the dependent variable, is the independent variable matrix, is K vectors selected from n eigenvectors, and are parameters, and is the random error.
Regarding determination of k eigenvectors, Chun et al. [77] proposed a new method to select candidate eigenvectors, using Equation (8) to determine the number of candidate eigenvectors .
where is the number of spatial positive correlation eigenvectors, and is the z score of the Moran index of Y.
4. Results
4.1. Data Distribution
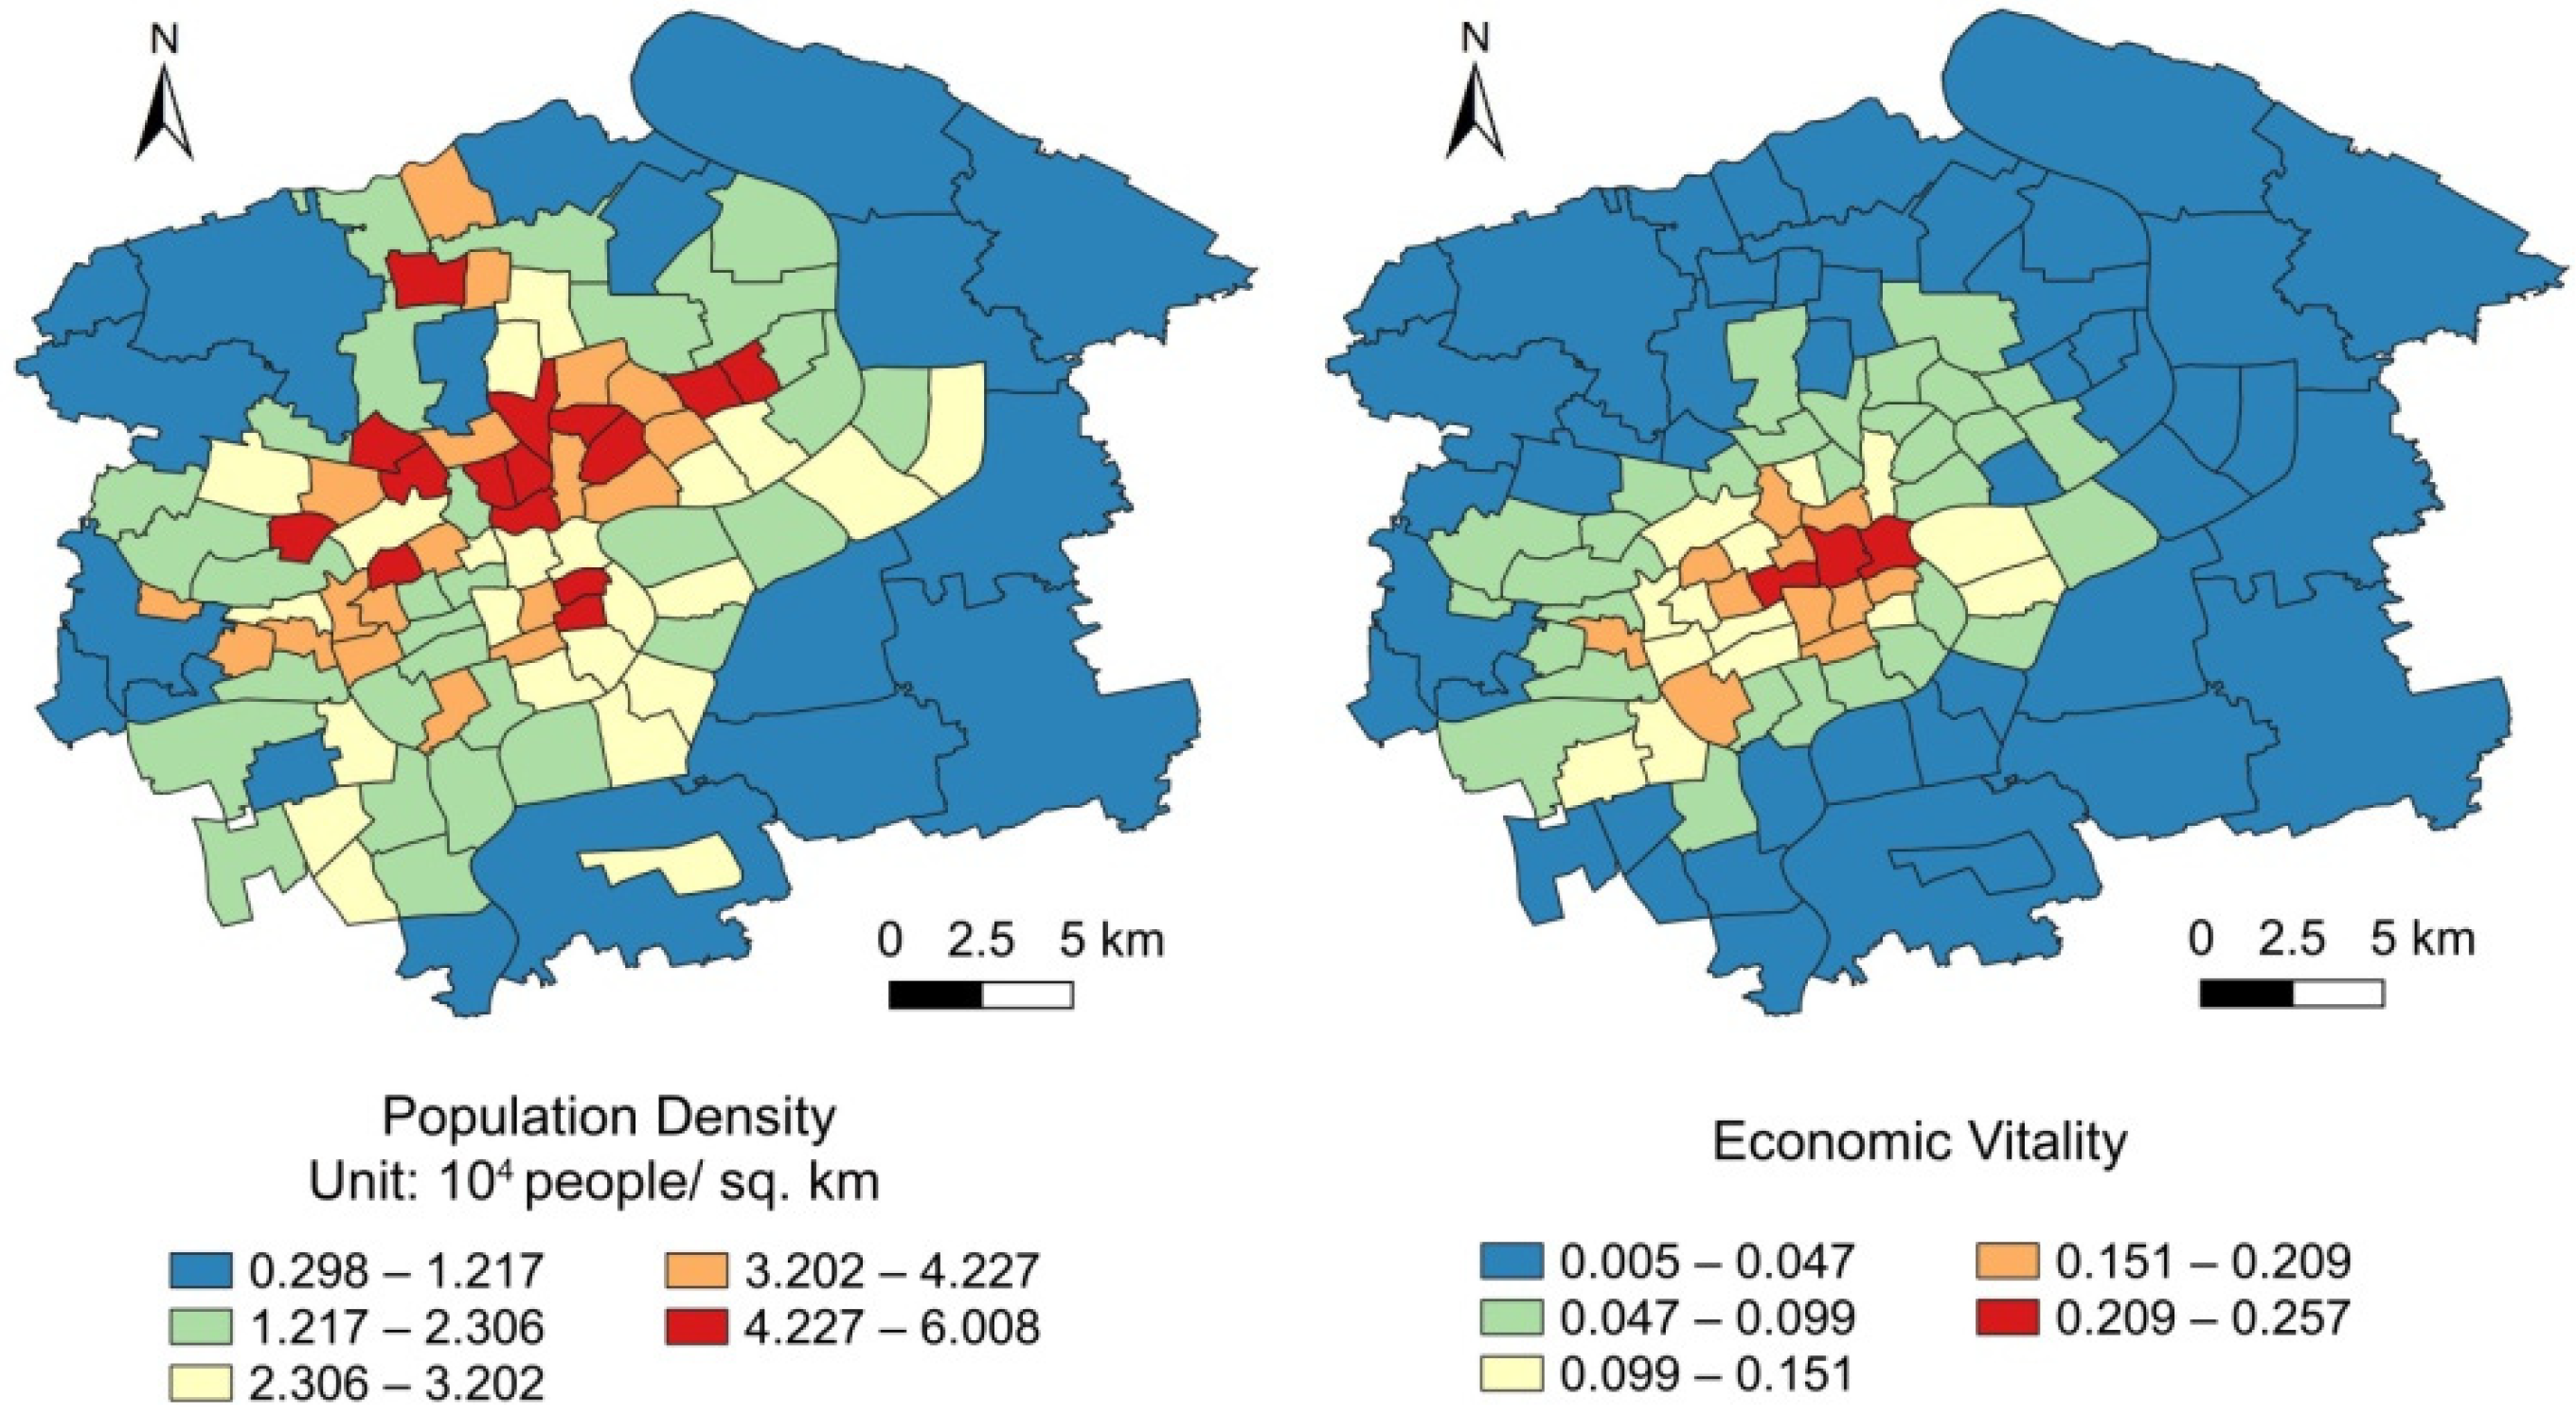
There are 105 research objects, as shown in Figure 4, so each indicator includes 105 values. For example, the population density of object 1, object 2, and object 105 are 3.601 × 10⁴, 0.906 × 10⁴, and 0.921 × 10⁴ people/km2. The minimum value, maximum value, and standard deviation of the 105 values of population density indicator are 0.298 × 10⁴, 6.008 × 10⁴, and 1.330 × 10⁴ people/km2. The descriptive statistical results of the urban spatial structure indicators are shown in Table 3, and the descriptive statistical results of the urban vitality indicators are shown in Table 4. We provide two examples of urban spatial structure indicators and urban vitality indicators in Figure 5.

Table 3.
Descriptive statistics of the urban spatial structure indicators.

Table 4.
Descriptive statistics of the urban vitality indicators.
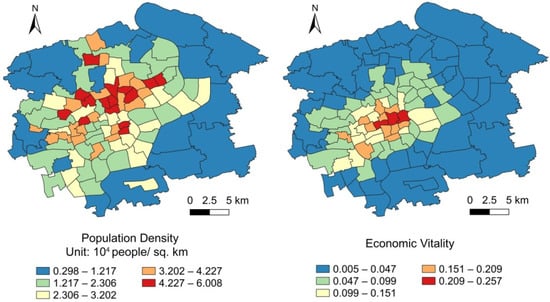
Figure 5.
The examples of urban spatial structure indicators and urban vitality indicators.
4.2. Correlation Analysis of Binary Space
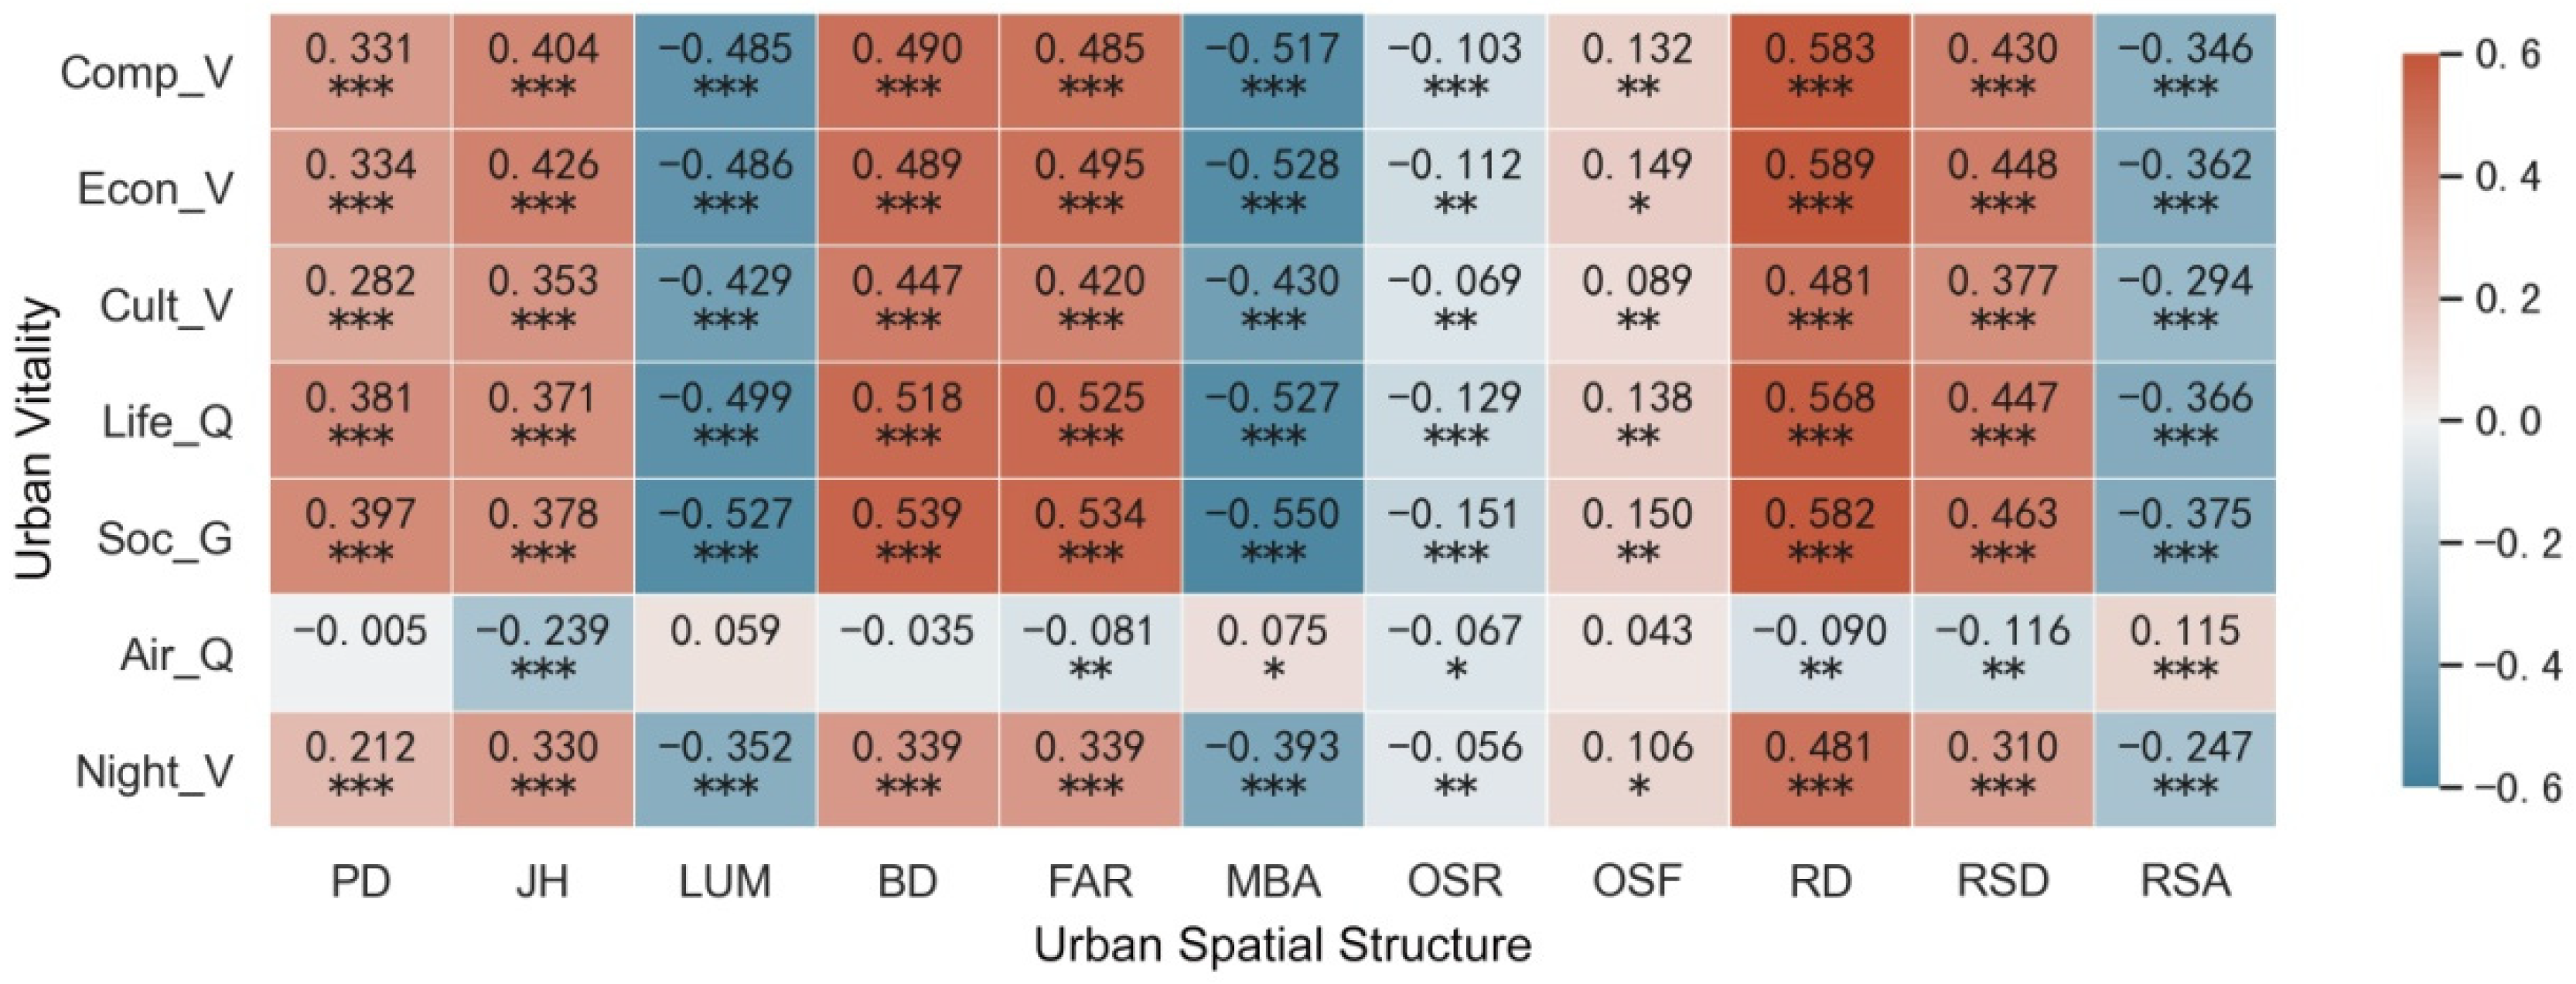
The calculation results of the binary spatial correlation coefficient L between each city’s vitality index and urban spatial structure index are shown in Figure 6. Among the indicators of urban vitality, air quality (Air_Q) has the weakest correlation with the indicators of urban spatial structure. The L values of air quality and job–housing balance (JH) and rail transit station density (RSD) are −0.239 and −0.116, respectively, showing a negative correlation. The L values of air quality and the nearest distance to rail transit stations (RSAs) are 0.115, showing a positive correlation. The absolute L values of air quality and other indicators of urban spatial structure are all less than 0.1. The correlation is not obvious. Among the 11 indicators of urban spatial structure, population density (PD), job–housing balance (JH), building density (BD), floor area ratio (FAR), open space fragmentation (OSF), road density (RD), and rail transit station density (RSD) are positively correlated with six indicators of urban vitality. The mixed degree of land use (LUM), average block area (MBA), open space ratio (OSR), and closest distance to rail transit stations (RSA) are negatively correlated with six city vitality indices. The positive correlation between road density and the urban vitality index was the strongest, followed by building density and floor area ratio, and the positive correlation between open space fragmentation and the urban vitality index was the weakest. The negative correlation between the average block area and the vitality index of each city is the strongest, followed by the mixed degree of land use and the nearest distance to the rail transit station, and the proportion of open space and the vitality index of each city is the weakest.
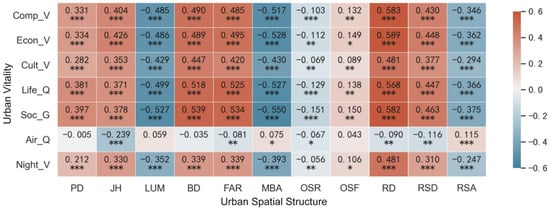
Figure 6.
Binary spatial correlation between urban spatial structure and urban vitality. Note: *, **, and *** indicate pseudo p-value not greater than 0.05, 0.01, and 0.001.
4.3. Combined Impact Analysis
4.3.1. Comprehensive Vitality
When choosing predictive variables according to the p value and VIF, first, the significance level was set at 95% (p < 0.05) to ensure a significant correlation between the predictive and response variables, and the threshold value of VIF was set at 4 to ensure that there was no obvious collinearity among all the predictive variables. Variables satisfying the above two conditions were selected as predictive variables. For the logarithmic processing of variables that did not meet the requirements, the predictive variables will still be selected. According to the p value and VIF value, population density (PD), land use mixed degree (LUM), logarithm of floor area ratio (ln(FAR)), open space ratio (OSR), road density (RD), and the nearest distance to rail transit stations (RSA) were selected as the predictive variables of the urban comprehensive vitality index. The log value of urban comprehensive vitality (ln(Comp_V)) was taken as the dependent variable. The regression results are shown in Table 5.

Table 5.
Comparison of OLS regression and ESF regression (ln(Comp_V) as the dependent variable).
During ESF regression, eigenvectors were selected according to two criteria: significance level of eigenvectors, namely, p value; and eigenvectors that do not significantly affect the correlation between predictive variables and response variables. According to Formula (8), the number of candidate eigenvectors is calculated as 35, and six eigenvectors, EV1, EV2, EV9, EV14, EV18, and EV24, are finally selected. The relevant information is shown in Table 6. The P values of EV1, EV2, EV9, and EV14 were less than 0.05, which were significantly correlated with urban comprehensive vitality. The p values of EV18 and EV24 were 0.054 and 0.055, respectively, which were not statistically significant but tended to be significant. We believe that eigenvectors with p values less than 0.055 are of practical significance when they tend to be significant. Therefore, in this paper, eigenvectors EV18 and EV24 are included in ESF regression. EV1, EV14, EV18, and EV24 were positively correlated with the urban comprehensive vitality index, while EV2 and EV9 were negatively correlated with the urban comprehensive vitality index.

Table 6.
Model test of OLS regression and ESF regression (ln(Comp_V) as dependent variable).
From the regression coefficient of predictive variables, it can be seen that FAR, OSR, and RD are positively correlated with the urban comprehensive vitality index; that is, the urban comprehensive vitality index will increase when the floor area ratio, open space ratio, and road density increase. Population density (PD), the mixed degree of land use (LUM), and the nearest distance to rail transit stations (RSA) are negatively correlated with the urban comprehensive vitality index.
The goodness-of-fit of OLS regression and ESF regression were calculated, and the results showed (Table 5) that the R2 of OLS regression was 0.880, the corrected red pool information criterion (AICc) was 69.827, the R2 of ESF regression was 0.922, and the AICc was 40.027. Compared with OLS regression, ESF regression showed significant improvement in the goodness-of-fit indexes R2 and AICc. According to the model test (Table 6), OLS regression cannot pass the Ramsey RESET test without considering the spatial relationship of research objects, indicating that the OLS regression model has setting errors. In addition, the Moran index test value of the OLS regression residual was 0.278 (p = 0.001), indicating that the residual term had significant spatial autocorrelation and did not meet the assumption of random distribution. In contrast, the test results of ESF regression showed that the regression model had no significant heteroscedasticity, no significant regression setting error, normal distribution of residuals, and no significant spatial autocorrelation. Therefore, the ESF regression model is an effective model.
4.3.2. Economic Vitality
According to the p value and VIF value, the job–housing balance (JH), floor area ratio (FAR), average block area (MBA), road density (RD), and the nearest distance to rail transit stations (RSA) were selected as the predictive variables of urban economic vitality, and the log value of economic vitality (ln(Econ_V)) was selected as the response variable. The results of OLS regression and ESF regression are shown in Table 7. In OLS regression, the Moran index of residuals is 0.105 (p = 0.032 < 0.05), indicating that residuals have spatial autocorrelation, and the OLS regression model is not a valid hypothesis. The Moran index of the residuals of ESF regression was −0.083 (p value was 0.114), and there was no significant spatial autocorrelation. Compared with OLS regression, it was greatly improved and passed the other three tests. Therefore, the ESF model was an effective regression model (Table 8). The R2 of OLS regression was 0.868, and the AICc was 64.299. In the ESF regression, R2 was 0.910, and AICc was 34.415. The goodness-of-fit of ESF regression was significantly better than that of OLS regression.

Table 7.
Comparison of OLS regression and ESF regression (ln(Econ_V) as the dependent variable).

Table 8.
Model test of OLS regression and ESF regression (ln(Econ_V) as the dependent variable).
The regression results of ESF show that job–housing balance (JH), floor area ratio (FAR), average block area (MBA), road density (RD), and the nearest distance to rail transit stations (RSA) are significantly correlated with the economic vitality of Shanghai’s urban central area. Among them, job–housing balance, floor area ratio, and road density are positively correlated with economic vitality, while average block area and the nearest distance to rail transit stations are negatively correlated with economic vitality. The log of economic vitality of the response variable (ln(Econ_V)) is positively correlated with EV1, EV14, and EV17, and negatively correlated with EV35.
4.3.3. Cultural Vitality
The log value ln(Cult_V) of cultural vitality was selected as the response variable. According to the p value and VIF value of the predictive variables, the population density squared (PD2), mixed degree of land use (LUM), floor area ratio (FAR), open space ratio (OSR), road density (RD), and the nearest distance to rail transit stations (RSA) were selected as the predictive variables of urban cultural vitality. The results of OLS regression and ESF regression are shown in Table 9. In OLS regression, the population density variable was not significant, but after considering the eigenvector space filtering, the population density variable was statistically significant. The R2 of the OLS regression was 0.792, and the AICc was 157.302. In the ESF regression considering eigenvector space filtering, R2 was 0.864, AICc was 124.860, and the goodness-of-fit of ESF regression was significantly better than OLS regression. According to Table 10, the white test value of ESF regression was 91.517 (p value 0.124), and the Ramsey RESET test value was 1.385 (p value 0.252), indicating that compared with the OLS regression model, the ESF regression model eliminated model heteroscedasticity and setting bias. The Moran index of the residuals of the ESF regression model was −0.004 (p = 0.457), eliminating the spatial autocorrelation of the residuals. This shows that the ESF regression model is an effective model.

Table 9.
Comparison of OLS regression and ESF regression (ln(Cult_V) as the dependent variable).

Table 10.
Model test of OLS regression and ESF regression (ln(Cult_V) as the dependent variable).
The regression results of ESF show that population density, the mixed degree of land use, and the nearest distance to rail transit stations are negatively correlated with cultural vitality, while floor area ratio, open space ratio, and road density are positively correlated with cultural vitality. The log value ln(Cult_V) of the response variable cultural vitality is positively correlated with the five eigenvectors.
4.3.4. Nocturnal Vitality
The log value ln(Night_V) of nocturnal vitality was selected as the response variable. Population density (PD), job–housing balance (JH), floor area ratio (FAR), road density (RD), and the nearest distance to rail transit stations (RSA) were selected as the predictive variables of urban nighttime vitality in terms of p and VIF values. The R2 of OLS regression was 0.779, and the AICc was 126.563. In the ESF regression considering eigenvector space filtering, R2 is 0.848, AICc is 99.688, and the goodness-of-fit of ESF regression is significantly better than that of OLS regression (Table 11). The Moran index of ESF regression residuals was −0.016 (p = 0.464), eliminating the spatial autocorrelation of residuals (Table 12). The test results show that the ESF regression model is a valid hypothesis.

Table 11.
Comparison of OLS regression and ESF regression (ln(Night_V) as the dependent variable).

Table 12.
Model test of OLS regression and ESF regression (ln(Night_V) as the dependent variable).
The regression results of ESF showed that the population density and the nearest distance to the rail transit stations were negatively correlated with nocturnal vitality, while the job–housing balance, floor area ratio, and road density were positively correlated with nocturnal vitality.EV1, EV4, EV7, and EV21 were positively correlated with the log value ln(Night_V) of the response variables and negatively correlated with EV11.
5. Discussion
5.1. Spatial Mismatches between Floor Area Ratio and Population Density
In this paper, the binary spatial correlation and ESF regression coefficients are compared, and it is found that the two coefficients of population density and open space ratio have different signs. For example, the ESF regression coefficient of population density is −0.071; that is, population density is negatively correlated with urban comprehensive vitality. The index of the binary spatial relationship between population density and comprehensive vitality was 0.331, indicating a significant positive correlation between them. The ratio of open space was similar. To explore the factors influencing the correlation between population density, open space ratio, and comprehensive vitality, this paper compared several ESF regression models, including different spatial structure factors. The trend of the correlation between population density (PD), open space ratio (OSR), and urban comprehensive vitality index was related to the FAR, so we designed an ESF model with the FAR and without the FAR, respectively, with the former called ESF model I, and the latter called ESF model II. The selected response variable was also log value of urban comprehensive vitality (ln(Comp_V)), and the predictive variables were log value of population density (ln(PD)), the mixed degree of land use (LUM), open space ratio (OSR), road density (RD), and the nearest distance to rail transit stations (RSA). The selected eigenvectors were EV1, EV5, EV8, EV14, EV21, and EV22. By comparing the goodness-of-fit between ESF model II and ESF model I (Table 5), it can be seen that ESF model I is slightly better than ESF model II (Table 13). According to the test results of ESF model II (Table 14), this model passes the white test, Ramsey RESET test, and Jarque–Bera test of residual terms, and the residual terms have no significant spatial autocorrelation, indicating that this model is an effective model.

Table 13.
Regression results of ESF model II (ln(Comp_V) as the dependent variable).

Table 14.
Test of ESF model II (ln(Comp V) as thedependent variable).
In ESF model II, which does not consider the floor area ratio, the regression coefficient of ln(PD) is 0.310, indicating a significant positive correlation between population density and urban comprehensive vitality. The regression coefficient of the open space ratio (OSR) was 0.010, and the p value was 0.271, indicating that there was no significant correlation between the open space ratio and urban comprehensive vitality in ESF model II. In ESF Model I and ESF model II, the difference in the regression coefficient between population density and the open space ratio indicates that the floor area ratio is an important factor affecting urban comprehensive vitality. In ESF Model I, under the control of floor area ratio, the mixed degree of land use, open space ratio, road density, and the nearest distance to rail transit stations, the urban comprehensive vitality decreases with the increase of the subdistrict resident population. The results show that the population density of each subdistrict in the downtown area of Shanghai has approached the theoretical “ceiling” under the current intensity of land development. Previous studies have suggested that the increase in population density has a positive impact on urban vitality [6], or they take this as a premise [5,78]. Shanghai city center, however, did not conform to this kind of situation. In the case of a constant plot ratio, especially for those subdistricts with higher population density, the permanent resident population was basically saturated; if the permanent resident population continues to increase, the new residential land will squeeze the other land use spaces (e.g., commercial and office spaces, open spaces, and land for public facilities). As a result, the land use in the subdistricts is not balanced, which leads to a series of urban problems such as employment and housing imbalance, road congestion, and reduced quality of life. In the process of urban planning, urban vitality can be improved by increasing open space, increasing road density, and planning new rail transit lines. Meanwhile, the total population of the urban central area can be controlled to avoid the negative impact of overpopulation on urban vitality.
5.2. The Difference in the Impact of Different Spatial Scales on Urban Vitality
The analysis of this paper mainly takes the subdistricts (towns) as the minimum research units. However, the area of each subdistrict (town) in the downtown area of Shanghai is quite different. Most of the subdistricts within the Puxi central area have an area of less than 10 square kilometers, while the subdistricts outside the Puxi central area and the subdistricts in Pudong are much larger. For example, the areas of Gaoqiao town, Gaodong town, and Zhangjiang town are all more than 30 square kilometers. Due to the differences in subdistrict scales, we speculate that the results of grid-scale analysis with the same area may be better than those of subdistrict-scale analysis. To verify this prediction, the nighttime vitality with the highest weight in urban comprehensive vitality evaluation was selected as the research object to analyze the influence of urban spatial structure on nighttime vitality at the grid scale. We divided the region into grids of 1 km × 1 km, excluding grids with an area of less than 0.75 square kilometers at the edge of the research area, and finally selected 659 grids as research objects. It can be seen from the above that urban spatial structure features significantly correlated with nocturnal vitality include population density (PD), job–housing balance (JH), floor area ratio (FAR), road density (RD), and the nearest distance to rail transit stations (RSA). Due to the lack of employment data at the grid scale, population density (PD), floor area ratio (FAR), road density (RD), and the nearest distance to rail transit stations (RSA) are selected to reflect the characteristics of urban spatial structure in this study. Among them, the population data at the grid scale come from the research results of the Chinese Academy of Sciences [79], and the data sources of the other indicators are the same as above. The log value (ln (Night_V)) of nighttime vitality was used as a response variable, and OLS regression was performed at the subdistrict scale and grid scale. The calculation results are shown in Table 15.

Table 15.
OLS regression results at the subdistrict scale and grid scale (ln(Night_V) as the dependent variable).
Table 15 shows that the R2 and AICc of the subdistrict scale are 0.758 and 133.959, respectively, and the R2 and AICc of the grid scale are 0.440 and 1507.785, respectively. The goodness-of-fit of the subdistrict scale is obviously better than that of the grid scale. In choosing the spatial scale of the study, the accessibility of data is considered, on the one hand, as employment data without a grid scale. On the other hand, from the perspective of the development status of different regions, the Puxi central area has higher road density, smaller average block area, less open space, and relatively delicate urban texture. Smaller research units can depict some basic spatial characteristics. However, the road network outside the Puxi central area and Pudong area is sparse, the average block area is large, and there are many large-scale open spaces. Smaller research units have difficulty reflecting the real appearance of urban spaces. Therefore, a 1 km grid is not used as the main research unit in this study. In addition, Ta et al. [7] studied the relationship between the built environment and urban vitality in the urban central area of Shanghai and conducted regression analysis on the subdistrict scale and block scale. The results showed that the goodness-of-fit of the subdistrict scale was significantly better than that of the block scale. In summary, we believe that it is appropriate to investigate the interaction between urban spatial structure and urban vitality at the subdistrict scale for the urban central area of Shanghai.
6. Conclusions
First, this paper studies the indicators of urban spatial structure in population, land use, and traffic and their influence on urban vitality. The results show that (1) According to the combined impact analysis, job–housing balance, floor area ratio, open space ratio, and road density are mainly positively correlated with urban vitality, while population density, the entropy coefficient in the mixed-use context, average block area, rail transit station density, and accessibility are mainly negatively correlated with urban vitality. (2) By comparing a variety of ESF regression models containing different spatial structure factors, we found that the correlation of population density and the urban comprehensive vitality index are related to the plot ratio. In the case of controlling floor area ratio, proportion of mixed land use, open space ratio, road density, the nearest distance from rail transit stations, and the increase in permanent resident population of subdistricts, the urban comprehensive vitality showed a decreasing trend, indicating that the population density of each subdistrict in the urban central area of Shanghai has approached the theoretical “ceiling” under the current intensity of land development. (3) Different spatial scales have heterogeneous impacts on urban vitality. For the central city of Shanghai, it is appropriate to study the interaction between urban spatial structure and urban vitality on a subdistrict scale.
According to the research results of this paper, population density is controlled, and increasing open space and adjusting the structure of land use can improve the urban vitality of central Shanghai. (1) A large number of permanent residents need a large amount of living space, which will occupy the high-end industrial land in the core area, physically cause the division of the industrial area, affect the concentration of high-end resources in finance, cultural, and creative industries, and impede the flow of economy and knowledge and other elements in the central business area. The urban central area should control the size of the permanent resident population, especially the size of the permanent resident population in the core area, adjust the spatial structure of employment, increase the proportion of employment in knowledge-intensive industries, and improve the skills of employees by absorbing senior talent and training employees in existing industries. (2) Most subdistricts with a higher entropy coefficient in the mixed-use context have a high proportion of industrial land, which leads to a negative correlation between the entropy coefficient in the mixed-use context and urban vitality. Therefore, the proportion of industrial land should be appropriately reduced, and the manufacturing links with large areas of land and high energy and water consumption should be gradually moved out of the urban central area, while the R&D links with high science and technology content and business services with high added value should be retained. The inefficient industrial land in the urban central area can be transformed into creative space dominated by cultural activities or adjusted to residential land or open spaces. (3) Due to the high-density living environment in Shanghai and the small open spaces and high fragmentation, it is difficult to meet the increasing needs of residents for high-quality life. Therefore, more pocket parks and sports venues should be planned to meet citizens’ demand for public open spaces.
Due to the complexity of the urban system itself, as well as the limitations of data acquisition and analysis methods, there are still some deficiencies in this paper. First, due to the limitations of data acquisition, the permanent population of each subdistrict has not adopted the data of the Seventh Population Census, and the employment population has not adopted the data of the Fourth Economic Census. In addition, dynamic “flow” elements have not been analyzed in this paper. Second, there is no analysis of spatiotemporal changes involving time series. Third, the theoretical framework of this paper is only used for the analysis of the urban central area of Shanghai and has not been applied to the comparative study of other cities. Future research should develop these three aspects.
Author Contributions
D.L.: manuscript writing, data acquisition and processing, visualization. Y.S.: manuscript revising, conceptual design and technical guidance, fund acquisition. All authors have read and agreed to the published version of the manuscript.
Funding
This research was supported by Shanghai Planning and Land Resource Administration Bureau (The one of key projects for Shanghai General Land Use Planning Revision (2015(D)-002(F)-11).
Institutional Review Board Statement
Not applicable.
Informed Consent Statement
Not applicable.
Data Availability Statement
Data and materials are available from the authors upon request.
Acknowledgments
The authors thank the anonymous reviewers for their valuable comments and suggestions on this article.
Conflicts of Interest
The authors declare no conflict of interest.
References
- Ritchie, H.; Roser, M. Urbanization. 2018. Available online: https://ourworldindata.org/urbanization (accessed on 15 November 2021).
- The World Bank. Urban Population (% of Total Population). 2020. Available online: https://data.worldbank.org/indicator/SP.URB.TOTL.IN.ZS (accessed on 1 December 2021).
- Wang, N. The spatial structure defects of megalopolises and the treatment of “urban diseases”. Reg. Econ. Rev. 2015, 30, 153–160. [Google Scholar]
- Shi, Y. The measurement index system of “urban disease” in China and its empirical analysis. Econ. Geogr. 2014, 34, 1–6. [Google Scholar]
- Jin, X.; Long, Y.; Sun, W.; Lu, Y.; Yang, X.; Tang, J. Evaluating cities’ vitality and identifying ghost cities in China with emerging geographical data. Cities 2017, 63, 98–109. [Google Scholar] [CrossRef]
- Liu, Y.; Zhao, P.; Liang, J. Urban vitality based on location service data: A case study of the Inner Sixth Ring Road of Beijing. Reg. Res. Dev. 2018, 37, 64–69, 87. [Google Scholar]
- Ta, N.; Zeng, Y.; Zhu, Q.; Wu, J. Analysis of the relationship between built environment and urban vitality in Central Shanghai based on big data. Sci. Geogr. Sin. 2020, 40, 60–68. [Google Scholar]
- Anas, A.; Arnott, R.; Small, K.A. Urban spatial structure. J. Econ. Lit. 1998, 36, 1426–1464. [Google Scholar]
- Arribas-Bel, D.; Sanz-Graica, F. The validity of the monocentric city model in a polycentric age: US metropolitan areas in 1990, 2000 and 2010. Urban Geogr. 2014, 35, 980–997. [Google Scholar] [CrossRef]
- Fujita, M.; Ogawa, H. Multiple equilibria and structural transition of non-monocentric urban configurations. Reg. Sci. Urban Econ. 1982, 12, 161–196. [Google Scholar] [CrossRef]
- Gordon, P.; Richardson, H.W.; Wong, H.L. The distribution of population and employment in a polycentric city: The case of Los Angeles. Environ. Plan. A Econ. Space 1986, 18, 161–173. [Google Scholar] [CrossRef]
- Song, S. Monocentric and Polycentric Density Functions and Their Required Commutes; Working Papers UCTC No. 198; The University of California Transportation Center: Berkeley, CA, USA, 1992. [Google Scholar]
- Li, Y.; Liu, X. How did urban polycentricity and dispersion affect economic productivity? A case study of 306 Chinese cities. Landsc. Urban Plan. 2018, 173, 51–59. [Google Scholar] [CrossRef]
- Li, Y.; Xiong, W.; Wang, X. Does polycentric and compact development alleviate urban traffic congestion? A case study of 98 Chinese cities. Cities 2019, 88, 100–111. [Google Scholar] [CrossRef]
- Botequilha-Leit, O.A. Eco-polycentric urban systems: An ecological region perspective for network cities. Challenges 2012, 3, 1–42. [Google Scholar] [CrossRef]
- Champion, A.G. A changing demographic regime and evolving poly centric urban regions: Consequences for the size, composition and distribution of city populations. Urban Stud. 2001, 38, 657–677. [Google Scholar] [CrossRef]
- Loibl, W.; Tötzer, T.; Köstl, M.; Steinnocher, K. Simulation of Polycentric Urban Growth Dynamics through Agents. In Modelling Land-Use Change; Koomen, E., Stillwell, J., Bakema, A., Scholten, H.J., Eds.; Springer: Dordrecht, The Netherlands, 2007; Volume 90, pp. 219–236. [Google Scholar]
- Wei, S.; Chen, Y.; Lu, S. Urban sprawl, polycentric agglomeration and productivity. China Ind. Econ. 2016, 30, 58–75. [Google Scholar]
- Yang, Q.; Shi, Y.; Zhou, L. Did industrial centralization strategy in Shanghai’s suburbs lead to economic growth? Sustainability 2022, 14, 856. [Google Scholar] [CrossRef]
- Scheer, B.C.; Petkov, M. Edge city morphology: A comparison of commercial centers. J. Am. Plan. Assoc. 1998, 64, 298–310. [Google Scholar] [CrossRef]
- Lee, J.; Kurisu, K.H.; An, K.; Hanaki, K. Development of the compact city index and its application to Japanese cities. Urban Stud. 2015, 52, 1054–1070. [Google Scholar] [CrossRef]
- Ibrahim, A. Investigation of the Relationship between Urban Spatial Structure and Travel Demand in the GTA. Master’s Thesis, University of Toronto, Toronto, ON, Canada, 1997. [Google Scholar]
- Clark, L.P.; Millet, D.B.; Marshall, J.D. Air quality and urban form in US urban areas: Evidence from regulatory monitors. Environ. Sci. Technol. 2011, 45, 7028–7035. [Google Scholar] [CrossRef]
- Lin, J.J.; Yang, A.T. Structural analysis of how urban form impacts travel demand: Evidence from Taipei. Urban Stud. 2009, 46, 1951–1967. [Google Scholar] [CrossRef]
- Bento, A.M.; Cropper, M.L.; Mobarak, A.M.; Vinha, K. The effects of urban spatial structure on travel demand in the United States. Rev. Econ. Stat. 2005, 87, 466–478. [Google Scholar] [CrossRef]
- Kenworthy, J.; Hu, G. Transport and urban form in Chinese cities: An international comparative and policy perspective with implications for sustainable urban transport in China. disP-Plan. Rev. 2002, 38, 4–14. [Google Scholar] [CrossRef]
- Holden, E.; Norland, I.T. Three challenges for the compact city as a sustainable urban form: Household consumption of energy and transport in eight residential areas in the greater Oslo region. Urban Stud. 2005, 42, 2145–2166. [Google Scholar] [CrossRef]
- Song, Y.; Knaap, G.J. Measuring urban form: Is Portland winning the war on sprawl? J. Am. Plan. Assoc. 2004, 70, 210–225. [Google Scholar] [CrossRef]
- Salomons, E.M.; Pont, M.B. Urban traffic noise and the relation to urban density, form, and traffic elasticity. Landsc. Urban Plan. 2012, 108, 2–16. [Google Scholar] [CrossRef]
- Li, C.; Wang, Z.; Li, B.; Peng, Z.R.; Fu, Q. Investigating the relationship between air pollution variation and urban form. Build. Environ. 2019, 147, 559–568. [Google Scholar] [CrossRef]
- Coogan, P.F.; White, L.F.; Evans, S.R.; Adler, T.J.; Hathaway, K.M.; Palmer, J.R.; Rosenberg, L. Longitudinal assessment of urban form and weight gain in African-American women. Am. J. Prev. Med. 2011, 40, 411–418. [Google Scholar] [CrossRef]
- Stone, B.; Hess, J.J.; Frumkin, H. Urban form and extreme heat events: Are sprawling cities more vulnerable to climate change than compact cities? Environ. Health Perspect. 2010, 118, 1425–1428. [Google Scholar] [CrossRef]
- Frank, L.; Bradley, M.; Kavage, S.; Chapman, J.; Lawton, T.K. Urban form, travel time, and cost relationships with tour complexity and mode choice. Transportation 2008, 35, 37–54. [Google Scholar] [CrossRef]
- Ma, J.; Liu, Z.; Chai, Y. The impact of urban form on CO2 emission from work and non-work trips: The case of Beijing, China. Habitat Int. 2015, 47, 1–10. [Google Scholar] [CrossRef]
- Asami, Y.; Kubat, A.S.; Istek, C. Characterization of the street networks in the traditional Turkish urban form. Environ. Plan. B Plan. Des. 2001, 28, 777–795. [Google Scholar] [CrossRef]
- Nass, P. Urban form, sustainability and health: The case of greater Oslo. Eur. Plan. Stud. 2014, 22, 1524–1543. [Google Scholar] [CrossRef]
- Gong, P.; Yang, J. Spatial structure of urban agglomerations in China based on Microblog data. Urban Dev. Res. 2020, 27, 1–8, 61, 181. [Google Scholar]
- Zhou, C.; Li, S.; Wang, S. Examining the impacts of urban form on air pollution in developing countries: A case study of China’s megacities. Int. J. Environ. Res. Public Health 2018, 15, 1565. [Google Scholar] [CrossRef] [PubMed]
- Hui, E.C.M.; Li, X.; Chen, T.; Lang, W. Deciphering the spatial structure of China’s megacity region: A new bay area—The Guangdong-Hong Kong-Macao greater bay area in the making. Cities 2020, 105, 102168. [Google Scholar] [CrossRef]
- Xue, B.; Xiao, Q.; Li, J.; Xie, X. Analysis of urban spatial structure in Northeast China based on point of interest (POI) big data. Sci. Geogr. Sin. 2020, 40, 691–700. [Google Scholar]
- Chen, Z.; Yu, B.; Song, W.; Liu, H.; Wu, Q.; Shi, K.; Wu, J. A new approach for detecting urban centers and their spatial structure with nighttime light remote sensing. IEEE Trans. Geosci. Remote Sens. 2017, 55, 6305–6319. [Google Scholar] [CrossRef]
- Sun, B.; Zhang, T.; He, Z.; Wang, R. Urban spatial structure and motorization in China. J. Reg. Sci. 2017, 57, 470–486. [Google Scholar] [CrossRef]
- Ding, L.; Song, X.; Niu, X. Discussion on the functional relation characteristics of urban spatial structure: A case study of central Shanghai. City Plan. Rev. 2019, 43, 107–116. (In Chinese) [Google Scholar]
- Lee, C. Impacts of two-scale urban form and their combined effects on commute modes in US metropolitan areas. J. Transp. Geogr. 2020, 88, 102821. [Google Scholar] [CrossRef]
- Ryu, H.; Park, I.K.; Chun, B.S.; Chang, S.I. Spatial statistical analysis of the effects of urban form indicators on road-traffic noise exposure of a city in South Korea. Appl. Acoust. 2017, 115, 93–100. [Google Scholar] [CrossRef]
- Jacobs, J. The Death and Life of Great American Cities; Random House: New York, NY, USA, 1961. [Google Scholar]
- Crull, S.R.; Cook, C.C. Housing and economic vitality in rural Midwestern counties. Hous. Soc. 2000, 27, 16–32. [Google Scholar] [CrossRef]
- Cao, J.; Zhao, B. Modelling of index system of economic vitality during the COVID-19 Epidemic. JOJ Wildl. Biodivers. 2021, 3, 91–112. [Google Scholar]
- Ravenscroft, N. The vitality and viability of town centres. Urban Stud. 2000, 37, 2533–2549. [Google Scholar] [CrossRef]
- Jackson, M.R.; Green, F.K.; Herranz, J. Cultural Vitality in Communities: Interpretation and Indicators; The Urban Institute: Washington, DC, USA, 2006. [Google Scholar]
- Ortega-Villa, L.M.; Ley-Garcia, J. Analysis of cultural indicators: A comparison of their conceptual basis and dimensions. Soc. Indic. Res. 2018, 137, 413–439. [Google Scholar] [CrossRef]
- Yang, Z.; Su, M.; Chen, B. Change of urban ecosystem development: A case study of Beijing, China. Procedia Environ. Sci. 2010, 2, 681–688. [Google Scholar] [CrossRef]
- Liu, G.; Yang, Z.; Chen, B.; Zhang, Y.; Zhang, L. Emergy-based urban ecosystem health assessment: A case study of Baotou city. Acta Ecol. Sin. 2008, 28, 1720–1728. [Google Scholar] [CrossRef]
- Scott, K. Community Vitality: Canadian Index of Wellbeing; University of Waterloo: Waterloo, ON, Canada, 2010. [Google Scholar]
- Etuk, L.E.; Acock, A. Toward a rural community vitality measurement practice. Community Dev. 2017, 48, 141–153. [Google Scholar] [CrossRef]
- Lan, F.; Gong, X.; Da, H.; Wen, H. How do population inflow and social infrastructure affect urban vitality? Evidence from 35 large-and medium-sized cities in China. Cities 2020, 100, 102454. [Google Scholar] [CrossRef]
- Pan, H.; Yang, C.; Quan, L.; Liao, L. A new insight into understanding urban vitality: A case study in the Chengdu-Chongqing area twin-city economic circle, China. Sustainability 2021, 13, 10068. [Google Scholar] [CrossRef]
- Li, Q.; Cui, C.; Liu, F.; Wu, Q.; Run, Y.; Han, Z. Multidimensional urban vitality on streets: Spatial patterns and influence factor identification using multisource urban data. ISPRS Int. J. Geo-Inf. 2021, 11, 2. [Google Scholar] [CrossRef]
- Wu, W.; Niu, X.; Li, M. Influence of built environment on street Vitality: A case study of West Nanjing Road in Shanghai based on mobile location data. Sustainability 2021, 13, 1840. [Google Scholar] [CrossRef]
- Liu, S.; Zhang, L.; Long, Y.; Long, Y.; Xu, M. A new urban vitality analysis and evaluation framework based on human activity modeling using multi-source big data. ISPRS Int. J. Geo-Inf. 2020, 9, 617. [Google Scholar] [CrossRef]
- Zhang, A.; Li, W.; Wu, J.; Lin, J.; Chu, J.; Xia, C. How can the urban landscape affect urban vitality at the street block level? A case study of 15 metropolises in China. Environ. Plan. B Urban Anal. City Sci. 2021, 48, 1245–1262. [Google Scholar] [CrossRef]
- Xia, C.; Yeh, A.G.O.; Zhang, A. Analyzing spatial relationships between urban land use intensity and urban vitality at street block level: A case study of five Chinese megacities. Landsc. Urban Plan. 2020, 193, 103669. [Google Scholar] [CrossRef]
- Long, Y.; Huang, C.C. Does block size matter? The impact of urban design on economic vitality for Chinese Cities. Environ. Plan. B Urban Anal. City Sci. 2019, 46, 406–422. [Google Scholar] [CrossRef]
- Mao, G.; Zhou, W.; Cai, A. Enterprise density, industrial association and industrial cluster transfer. J. Huaiyin Norm. Univ. Nat. Sci. Ed. 2015, 14, 323–330, 341. [Google Scholar]
- Shao, J. Research on the Collaborative Mechanism Construction of China’s Social Governance. Ph.D. Thesis, Jilin University, Jilin, China, June 2014. [Google Scholar]
- Zavadskas, E.K.; Mardani, A.; Turskis, Z.; Jusoh, A.; Nor, K.M. Development of TOPSIS method to solve complicated decision-making problems—An overview on developments from 2000 to 2015. Int. J. Inf. Technol. Decis. Mak. 2016, 15, 645–682. [Google Scholar] [CrossRef]
- Opricovic, S.; Tzeng, G.H. Compromise solution by MCDM methods: A comparative analysis of VIKOR and TOPSIS. Eur. J. Oper. Res. 2004, 156, 445–455. [Google Scholar] [CrossRef]
- Shi, Y.; Liu, D. Relationship between urban new business indexes and the business environment of Chinese cities: A study based on Entropy-TOPSIS and a Gaussian Process Regression model. Sustainability 2020, 12, 10422. [Google Scholar] [CrossRef]
- Lee, S.I. Developing a bivariate spatial association measure: An integration of Pearson’s r and Moran’s I. J. Geogr. Syst. 2001, 3, 369–385. [Google Scholar] [CrossRef]
- Dou, Y.; Luo, X.; Dong, L.; Wu, C.; Liang, H.; Ren, J. An empirical study on transit-oriented low-carbon urban land use planning: Exploratory Spatial Data Analysis (ESDA) on Shanghai, China. Habitat Int. 2016, 53, 379–389. [Google Scholar] [CrossRef]
- Fischer, M.M.; Getis, A. Handbook of Applied Spatial Analysis: Software Tools, Methods and Applications; Springer: Berlin/Heidelberg, Germany, 2010. [Google Scholar]
- Griffith, D.A. A linear regression solution to the spatial autocorrelation problem. J. Geogr. Syst. 2000, 2, 141–156. [Google Scholar] [CrossRef]
- Cao, J.; Chen, Y.; Wilson, J.P.; Tan, H.; Yang, J.; Xu, Z. Modeling China’s prefecture-level economy using VIIRS imagery and spatial methods. Remote Sens. 2020, 12, 839. [Google Scholar] [CrossRef]
- Griffith, D.A. Spatial-filtering-based contributions to a critique of geographically weighted regression (GWR). Environ. Plan. A 2008, 40, 2751–2769. [Google Scholar] [CrossRef]
- Griffith, D.A. Spatial Autocorrelation and Spatial Filtering: Gaining Understanding through Theory and Scientific Visualization; Springer Science & Business Media: Berlin/Heidelberg, Germany, 2003. [Google Scholar]
- Helbich, M.; Jokar Arsanjani, J. Spatial eigenvector filtering for spatiotemporal crime mapping and spatial crime analysis. Cartogr. Geogr. Inf. Sci. 2015, 42, 134–148. [Google Scholar] [CrossRef]
- Chun, Y.; Griffith, D.A.; Lee, M.; Sinha, P. Eigenvector selection with stepwise regression techniques to construct eigenvector spatial filters. J. Geogr. Syst. 2016, 18, 67–85. [Google Scholar] [CrossRef]
- Ge, W.; Yang, H.; Zhu, X.; Ma, M.; Yang, Y. Ghost city extraction and rate estimation in China based on NPP-VIIRS night-time light data. ISPRS Int. J. Geo-Inf. 2018, 7, 219. [Google Scholar] [CrossRef]
- Fu, J.; Jiang, D.; Huang, Y. China kilometer grid population distribution dataset. Acta Geogr. Sin. 2014, 69, 41–44. [Google Scholar]
Publisher’s Note: MDPI stays neutral with regard to jurisdictional claims in published maps and institutional affiliations. |
© 2022 by the authors. Licensee MDPI, Basel, Switzerland. This article is an open access article distributed under the terms and conditions of the Creative Commons Attribution (CC BY) license (https://creativecommons.org/licenses/by/4.0/).

