Article

Machine Learning Classification of Fused Sentinel-1 and Sentinel-2 Image Data towards Mapping Fruit Plantations in Highly Heterogenous Landscapes

1
School of Geography, Archaeology and Environmental Studies, University of the Witwatersrand, Johannesburg 2050, South Africa
2
Department of Geology and Environmental Geosciences, College of Charleston, Charleston, SC 29424, USA
*
Author to whom correspondence should be addressed.
Remote Sens. 2022, 14(11), 2621; https://doi.org/10.3390/rs14112621
Submission received: 2 February 2022 / Revised: 28 March 2022 / Accepted: 6 April 2022 / Published: 31 May 2022
(This article belongs to the Special Issue Remote Sensing of Agro-Ecosystems)

Abstract

:
Mapping smallholder fruit plantations using optical data is challenging due to morphological landscape heterogeneity and crop types having overlapping spectral signatures. Furthermore, cloud covers limit the use of optical sensing, especially in subtropical climates where they are persistent. This research assessed the effectiveness of Sentinel-1 (S1) and Sentinel-2 (S2) data for mapping fruit trees and co-existing land-use types by using support vector machine (SVM) and random forest (RF) classifiers independently. These classifiers were also applied to fused data from the two sensors. Feature ranks were extracted using the RF mean decrease accuracy (MDA) and forward variable selection (FVS) to identify optimal spectral windows to classify fruit trees. Based on RF MDA and FVS, the SVM classifier resulted in relatively high classification accuracy with overall accuracy (OA) = 0.91.6% and kappa coefficient = 0.91% when applied to the fused satellite data. Application of SVM to S1, S2, S2 selected variables and S1S2 fusion independently produced OA = 27.64, Kappa coefficient = 0.13%; OA= 87%, Kappa coefficient = 86.89%; OA = 69.33, Kappa coefficient = 69. %; OA = 87.01%, Kappa coefficient = 87%, respectively. Results also indicated that the optimal spectral bands for fruit trees mapping are green (B3) and SWIR_2 (B10) for S2, whereas for S1, the vertical-horizontal (VH) polarization band. Including the textural metrics from the VV channel improved crop discrimination and co-existing land use cover types. The fusion approach proved robust and well suited for accurate smallholder fruit plantation mapping.

1. Introduction

Timely and precise spatial information on crop types is crucial for managing and monitoring agricultural activities, especially in areas with increasing populations and rapidly growing food security demands [1]. Accurate location monitoring of agricultural land at a crop types level plays an essential role in precision agriculture and achieving a better understanding of farm management practices, forecasting crop yields, and facilitating an enhanced response to food insecurity [2,3]. Promoting good agricultural practices and achieving sustainable agricultural systems depend on detailed spatial information of the current cropping systems on small-field parcels, especially for South Africa [4]. The fruit-tree industry is a pillar that provides livelihoods, creates employment opportunities, and reduces poverty and food insecurity by generating income for local agricultural-based livelihoods while contributing to sub-tropical rural economic development [5,6]. Production of fruit-tree crops is increasing worldwide, and export sales have become more competitive [7]. Thus, there is a need to develop effective management to improve fruit-tree crop production and advance the competitive standing of small-scale farmers. One of the essential requirements for precise crop management is providing decision support tools that offer up-to-date spatial information on the tree crops systems and dynamics to maximize production and returns [8,9].
Historically, crop types were conventionally identified and mapped using field-based methods such as ground surveys and agricultural statistics as they work well at small local scales [10,11,12]. Although this method provides accurate spatial data about crop type distribution, many studies have shown the method is costly, time-consuming and labour intensive and is not feasible for large-scale crop mapping [13]. As such, the agricultural industry has undergone a digital revolution characterized by technologies such as artificial intelligence, remote sensing and geographical information systems specifically designed to advance the agricultural sector [14,15]. These technologies are promising tools for innovating agricultural operations, fostering the adoption of precision agriculture measures, and enhancing production [16,17].
Remote sensing has shown potential in overcoming the above mentioned limitations as it provides accurate crops information, as well as timely and cost-effective farming opportunities needed for site-specific crop management [18]. It is a tool used in conjunction with machine learning algorithms, big data analytics and artificial intelligence to extract useful information on fruit species regardless of the varieties [19]. The unprecedented availability of high-resolution spectral, spatial and temporal resolution images has advanced the use of remote sensing in crop mapping over various scales and geographic locations [20].
The application of different satellite technologies for decision making and precision agriculture in horticulture has been shown in various studies [12,21,22]. Among the various satellite types, MODIS data has been widely tested in crop mapping at regional and global scales due to its global coverage [23]. However, the efficacy of using MODIS data in crop types mapping is limited to commercial farming [24]. Its solutions for precision farming practices are challenging to envisage and implement due to MODIS spatial resolution resulting in mixed pixels and deteriorated classification accuracy when applied to heterogeneous terrains in which smallholder farmers operate [25].
Remote sensing data with intermediate spatial resolution < 30 m (Landsat 8) and high spatial resolution < 10 m, such as, Quickbird, Worldview, SPOT, and Sentinel-2 data, are used to overcome the problem of spectral mixing and improve crop classification in agricultural systems characterized by small fields [26]. The applicability of high spatial resolution data has been tested in producing accurate site-specific geospatial information for precision agriculture due to their resolutions being smaller than smallholder fields [27,28,29]. The regional and localized applications of high-resolution data include cropland mapping [30], identification of irrigated crops [31], and tree crops condition mapping [32]. However, the applicability of the above datasets for designing precise sustainable farming solutions in smallholder farming systems in sub-Saharan Africa is still limited due to various dimensions such as lack of modern hardware and network infrastructure, software, technological and technical skill gaps and lack of access to funding [25].
Optical data are weather-dependent and rely on the sun’s energy, and are mainly affected by clouds, thus, hampering their applicability in crop mapping in subtropical regions such as South Africa [33]. The synthetic aperture radar (SAR) data from the Copernicus program has unlimited availability and is a powerful tool that can be used to overcome the impact of optical data unavailability, as radar systems lack illumination and can penetrate cloud covers [34,35]. The SAR sensors can differentiate the crops geometric and structural features due to their ability to capture textural information consisting of pixel intensities characterized by spatial variations that can detect subtle structural plant traits [20]. The radar systems are sensitive to geometric and dielectric properties of the crops enabling the systems to transmit emissions and backscatter from the objects, rendering them viable for vegetation mapping [35]. However, the lack of spectral features and sensitivity to the surface parameters (e.g., vegetation, soil moisture, soil roughness) limit their applicability in crop mapping [36]. Conversely, the leaf structure and water content influence the reflected energy from optical sensors, rendering them effective for crop mapping [37].
In recent studies, the hypothesis of data fusion in increasing crop mapping accuracy by capturing vegetation structural information representations from SAR and optical has been supported [38,39]. Data fusion compensates for the limitations of single-source sensors by combining different sensor spectral, spatial and temporal characteristics offering broader information content of the target object [38,40]. The growing research on crop types mapping reflects the diverse nature of agricultural landscape locally, regionally and globally and its site-specific challenges such as spectral similarities and intra-class variability, crop diversity, environmental and weather conditions, and farming system [38,40,41,42]. Different approaches and earth observation data have been tested to improve crops classification. The combination of Sentinel-1 and Sentinel-2 is well investigated in various countries such as Belgium, Australia, India, and China [3,43,44]. These studies confirm that SAR data improve crop types classification accuracies and overcome the limitations of cloud cover. This is due to SAR data characteristics and signals sensitivity to plant canopies’ physical and structural properties, which complements optical information from multispectral sensors such as Sentinel-2 [44,45]. However, the potential for mapping smallholder farming systems, particularly in African countries, has not been thoroughly tested and remains challenging due to the high spatial and temporal dynamics of agricultural landscapes in Africa. For example, in rural areas of South Africa, the farmland depicts a small scale but very diverse mix of crops such as maize, fruit trees and vegetables. Fields are relatively small and often separated by woody vegetation or plantation; the growing conditions and mix crops phenology and canopies physical structure vary enormously [46,47]. The optical sensors’ observations show high spatial and temporal crop spectral variability, and therefore, they may not be adequate to map crop types in small farms accurately [26,34].
Accurate remote sensing depends not only on the data characteristic and the site specifications but also on the classification methods. The selection of classifiers in image classification depends on the size of the crop field, landscape complexities, management strategies, and the diversity of the crops [48]. Machine learning-based classifiers such as support vector machines (SVM), random forest (RF), decision trees, and k_nearest neighbors (KNN) have been used to create thematic maps from satellite images for different fruit-tree crops with reasonable accuracies [48,49,50,51,52].
Levubu is one of the sub-tropical farming areas that makes Limpopo Province a leading fruits export in South Africa [5]. Smallholder farming systems (defined here as farms under 2 ha) play a significant role in global food production and are the backbone of South Africa’s economy [4]. These agricultural systems create employment opportunities that generate income and ensure food security for the local agricultural-based livelihoods [5]. The Levubu farms are predominantly planted with fruit tree crops such as macadamia nut, avocado, banana, guava, mango, pine trees. The co-existing land-use types include water bodies, built-up areas, and woody vegetation. Hence, mapping these fruit trees with higher accuracy is necessary for precise agricultural management and improving food production. Despite being the most prominent fruit exporter in Limpopo Province, the management of these fruit tree crops relies on ground-based surveys that are time-consuming and often subjected to human error [26].
The European Space Agency (ESA) provides SAR and multispectral data with a high spatial resolution, giving ample opportunities for crop phenotyping in smallholder agriculture in sub-tropical regions [53]. Sentinel-1 is suitable for smallholder crop mapping due to different polarization channels (VH and VV), which interact with crops differently, providing increased data content to support decision-making in a cost-effective manner [54]. The potential for integrating the Sentinels products has been tested for mapping crop growth conditions, leaf area index, and crop types patterns in various landscapes [13,43,55]. However, the Sentinels products’ integrated use has not been tested in mapping smallholder fruit plantations in South Africa despite their free availability, consisting of suitable spatial and spectral resolutions that offer unlimited capabilities for mapping at the landscape level. There is limited research in South Africa that has integrated the SAR and optical data from Sentinel satellite sensors to map smallholder fruit-tree crops due to complex image processing and complex sensor interactions with target parameters [33]. Therefore, the study aims to address this problem by investigating the integrated use of Sentinel 1 and Sentinel-2 data in fruit-tree crops mapping using machine learning classifiers. The objectives of the research are:
  • To evaluate the effectiveness of RF and SVM in discriminating tree crops from each sensor separately;
  • To examine if the application of RF and SVM classifiers on fused data can improve the crop mapping accuracy at the landscape level;
  • Assess the use of selected important variables in improving the mapping accuracy of fruit tree crops at the landscape level.

2. Materials and Methods

2.1. Method Overview
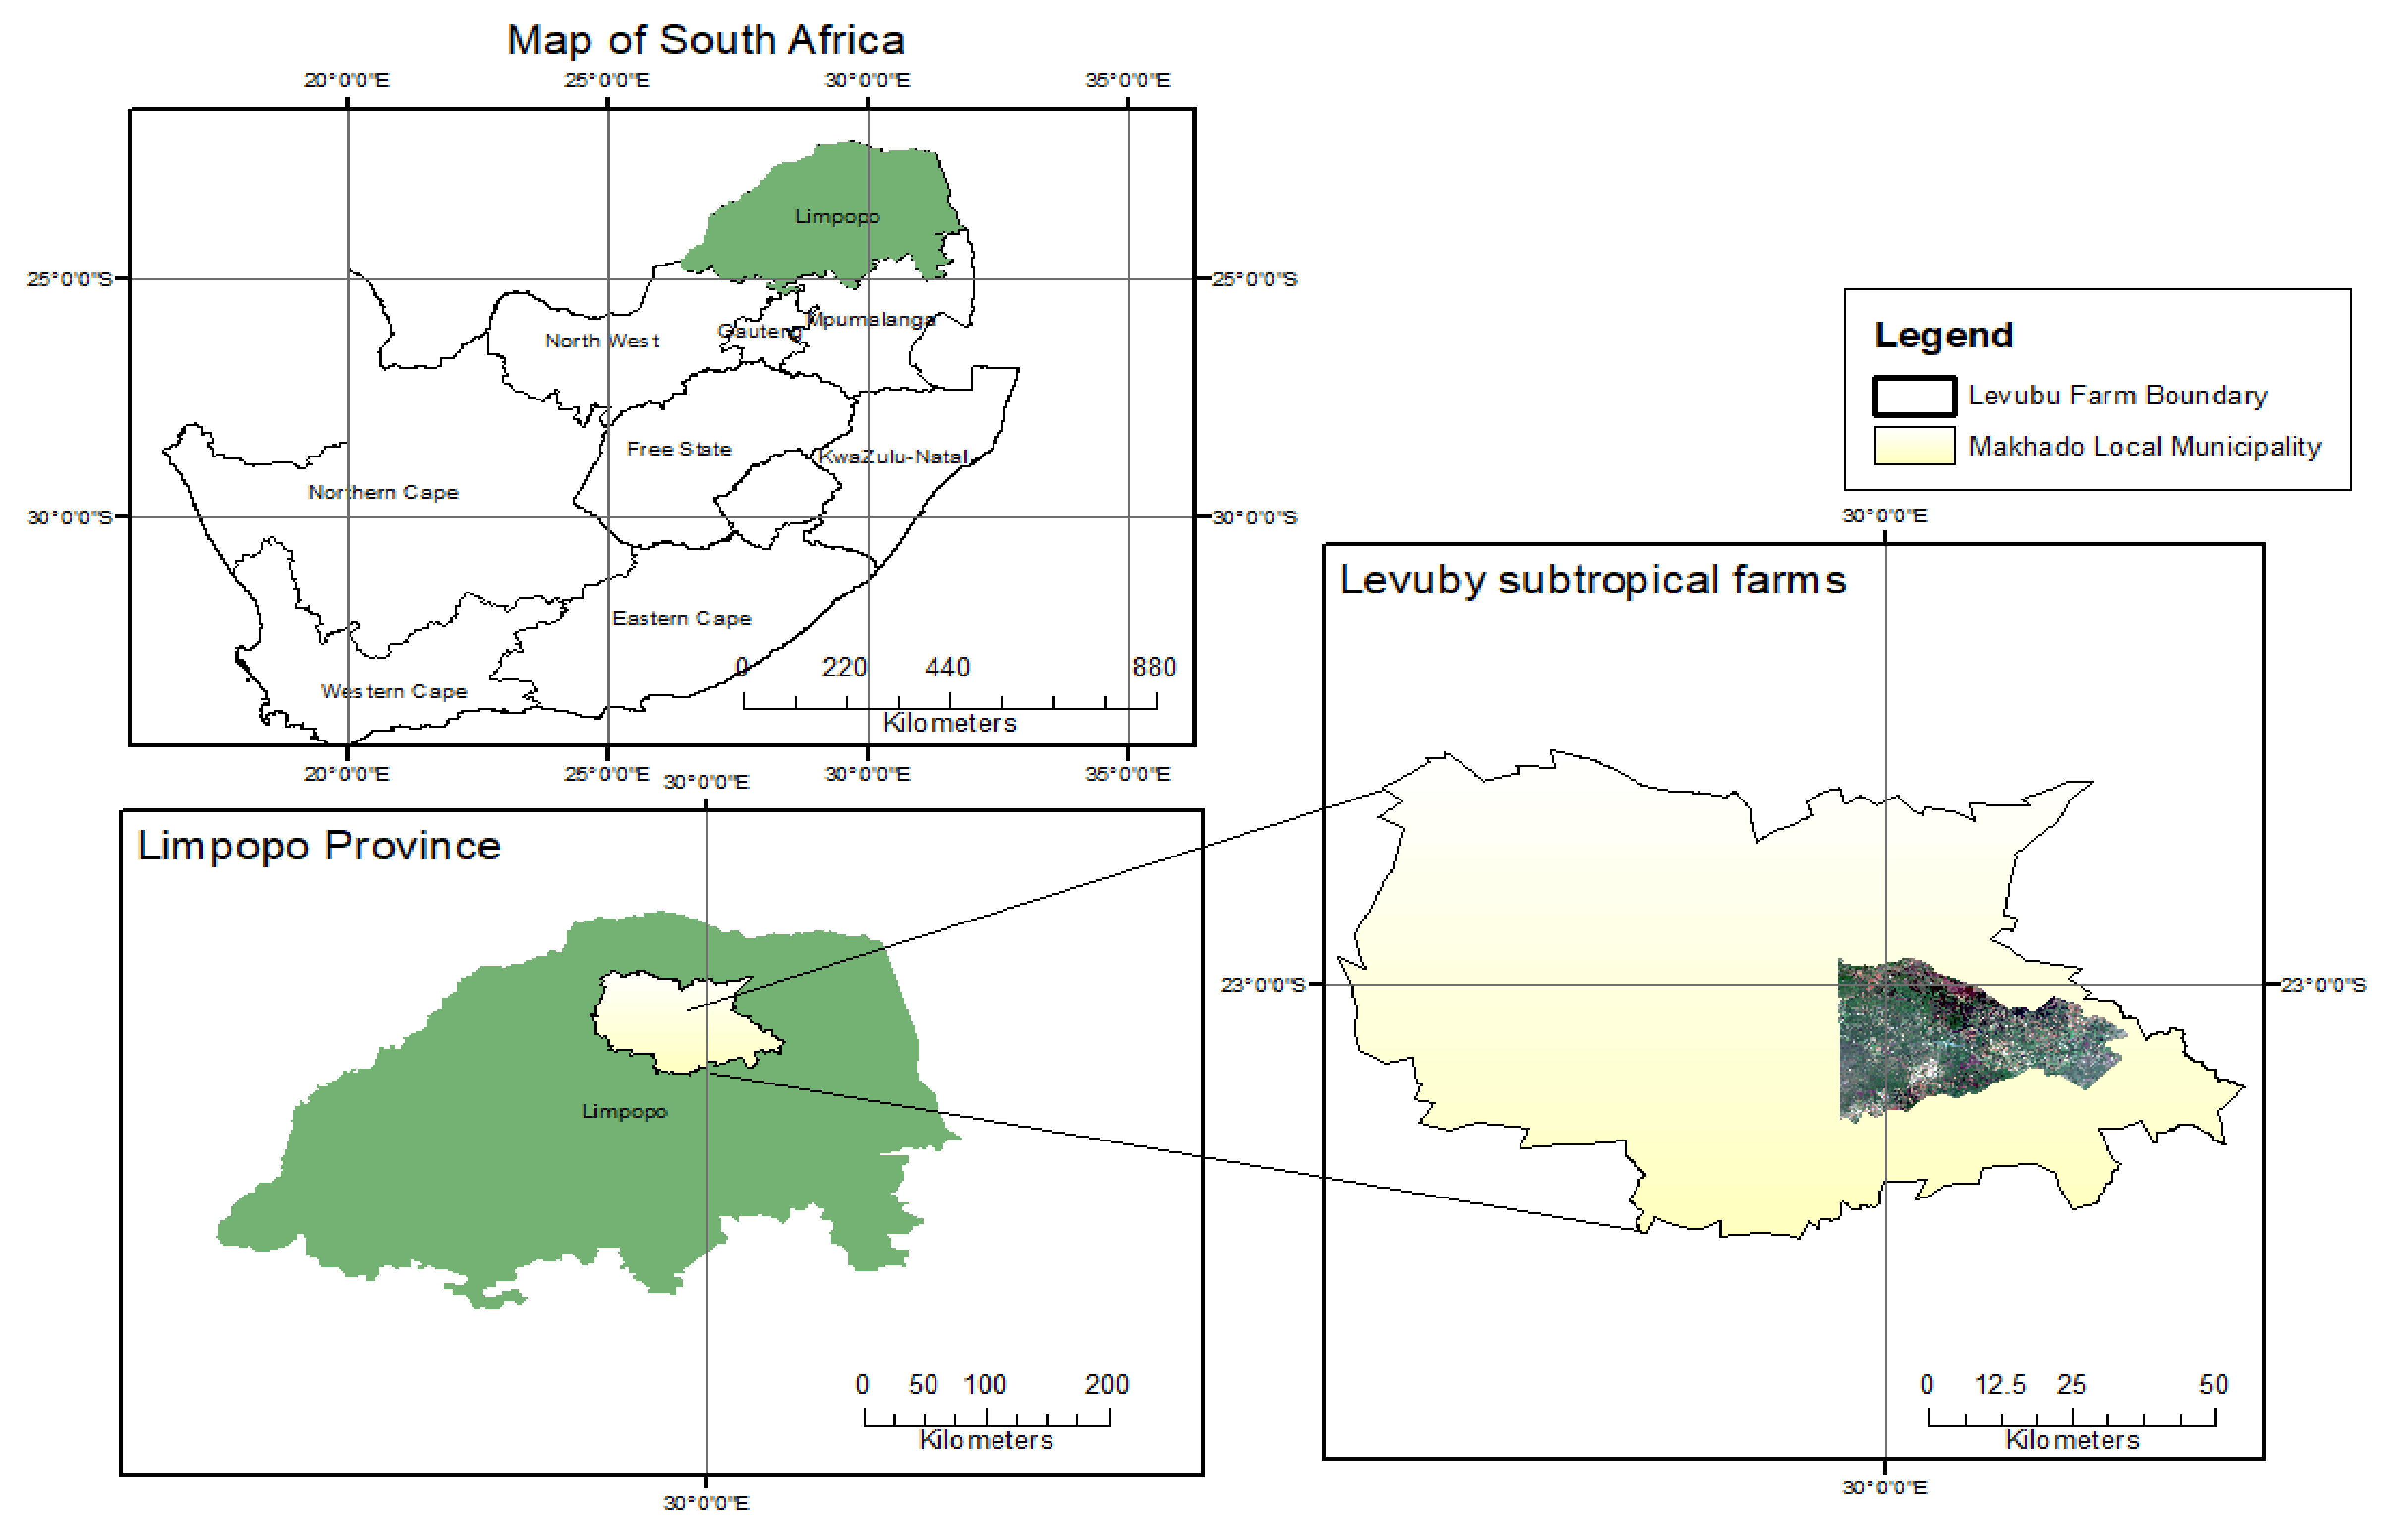
The proposed methodology shown in Figure 1 consists of the following steps: image pre-processing, converting Sentinel-1 (S1) image intensities (VV and VH) into decibels (dB), resampling six bands of Sentinel-2 data (i.e., rededge_1(B5), rededge_2(B6), rededge_3(B7), narrow NIR(B8A), SWIR_1(B11) and SWIR(B12)) were resampled from 20 m to 10 m spatial resolution using the Nearest Neighbor algorithm. After that, the resampled bands were combined with the 10 m resolution bands (i.e., Blue: B2, Red: B3, Green: B4, NIR: B8), and the resulting image composite consisted of 10 spectral bands. The image classification process involved the creation of image composite using S1 and S2, variable selection on the fused image (S1S2). The ground truth data were used to extract the image reflectance using four imageries (S1, S2, S1S2, S1S2 variable selection) and classify them using random forest (RF) and support vector machine (SVM). The accuracy assessment was carried out on the classified maps to evaluate the image that produced the best fruit trees and co-existing land-uses map.

2.2. The Study Area

The study site (41 hectares) covers the Levubu sub-tropical fruit-tree crops farming area in Vhembe District Municipality, Limpopo, South Africa (Figure 2). The study area is geographically located at latitudes 23°5′31.25″ S to 23°6′45.03″ S and longitudes 30°13′40.88″ E to 30°21′26.03″ E. The subtropical-farming area covers Tshakuma village, Mulangampuma, Levubu, Mukhuro, Valdezia and Ratondo. Levubu has a population of 207,000, in which white people account for 10.9% [56].
The area’s temperature is warm and wet from December to February, ranging from 16 to 40 °C, and the cool, dry season from May to August, ranging from 12 to 22 °C. The environmental, ecological, and biophysical environments are optimal for growing subtropical tree crops.
The Levubu area has two major rivers, namely the Luvuvhu (the main river) and the Lotonyanda River [5]. The Soutpanberg influences the annual rainfall distribution reaching 2000 mm at Entabeni, the middle part of the Soutpanberg and 340 mm in the western part peaking up during January and February. The precipitation season of the area hinders the acquisition of good quality optical data, which presents an ideal region to examine the potential for integrating SAR and optical data.

2.3. Remote Sensing Data Acquisition and Pre-Processing

The optical Sentinel-2A (S2) Level-1C and Interferometric Wide (IW) level-1 GRD (ground range detected) SAR Sentinel-1A (S1) were used in this study. The data were freely downloaded from the European Space Agency Portal, the Sentinel Scientific Hub (https://scihub.copernicus.eu/ (accessed on 16 January 2021). Both S1 and S2 images were acquired on 28 December 2019, which coincided with the data collection. The sentinel mission aims to provide data continuity to MSI from SPOT mission and continued supply of observations to be used in services such as land-cover mapping, food security, and forest monitoring, to name a few [57]. Sentinel-2 (S2) is a Multispectral Instrument (MSI) launched on 23 June 2015, with a wide- swath of 290 km providing data at 10 m to 60 m spatial resolution in 13 spectral bands ranging from visible to shortwave infrared regions with a revisit time of 5 days [58]. S2 contains three spectral bands strategically positioned in the red-edge position, crucial for improving crop condition mapping and retrieval of chlorophyll content [59].
S2 image was atmospherically corrected using a level 2A Prototype processor (SEN2COR) version 2.5.5, as stipulated on the Sentinel-2 processor for users [60]. All bands were resampled to 10 m resolution, and the corrected spectral bands were used in the analysis. The spectral configurations of the used sensors are presented in Table 1.
The Sentinel-1A (S1) is a synthetic aperture radar (SAR) satellite, launched on 3 April 2014. The data comprises two polar-orbiting instruments performing radar imaging through the C-band at 5.405 GHz operating in four imaging channels [61]. The sensor has a wide swath of 400 km, different spectral resolutions of down to 5 m and concise temporal resolution enabling rapid data collection. Sentinel-1 is in dual-polarization mode, and its data layers include the vertical transmit and horizontal polarized received (VH) and vertical transmit and vertical polarized received (VV) operating at 1 dB (3Σ) radiometric accuracy, sensitive to vegetation dynamics and crucial for crop mapping [62].
Sentinel-1 was atmospherically corrected using Sentinel-1 Kit Module in ESA SNAP and a python script configured to read digital elevation model (DEM) and the radiative transfer lookup tables during image processing using Anaconda (python 2.7) [60]. The image corrections include geometric correction, which is an essential step in quantitative analysis. In addition, we conducted radiometric calibration and speckle filtering to remove the sensor distortions and noise. The image speckles were reduced using a 5 × 5 m adaptive Lee filter commonly used for SAR data and have been proven to produce the best filtering results, especially in areas with high heterogeneity [37]. The image was terrain corrected using a Range Doppler STRM digital elevation model (DEM) 1Sec HGT (auto download) as an input and a pixel spacing of 10.0 m × 10.0 m with a line spacing of 10.0 m.
The analysis and interpretation of the Sentinel-1 SAR GRD product were enhanced by converting the processed image into Beta sigma naught (σ0), and the VH and VV units were converted into decibels (dB) based on Equation (1).
X = 10 log10 x
where x illustrates the pixel value.

2.4. Data Fusion

Integrating Sentinel-1 and Sentinel-2 is used to improve the textual, structural and spatial resolution for better crop type discrimination [40]. In this study, data fusion was performed using the Sentinel toolbox from SeNTinel Application Platform (SNAP) software at a pixel level using band combination. The images were first co-registered before the synergy. Sentinel-1 data were used as a master product since its geolocation accuracy was high after range doppler terrain correction.
The nearest neighbor model was used to resample and produce a fused image with 10 m pixel resolution using the Universal Transverse Mercator (UTM) at zone 36 South [63,64]. Sentinel-1 was used as master and Sentinel-2 as a slave, and the fused image was segmented using the collocation layer to aggregate the pixels with similar values.

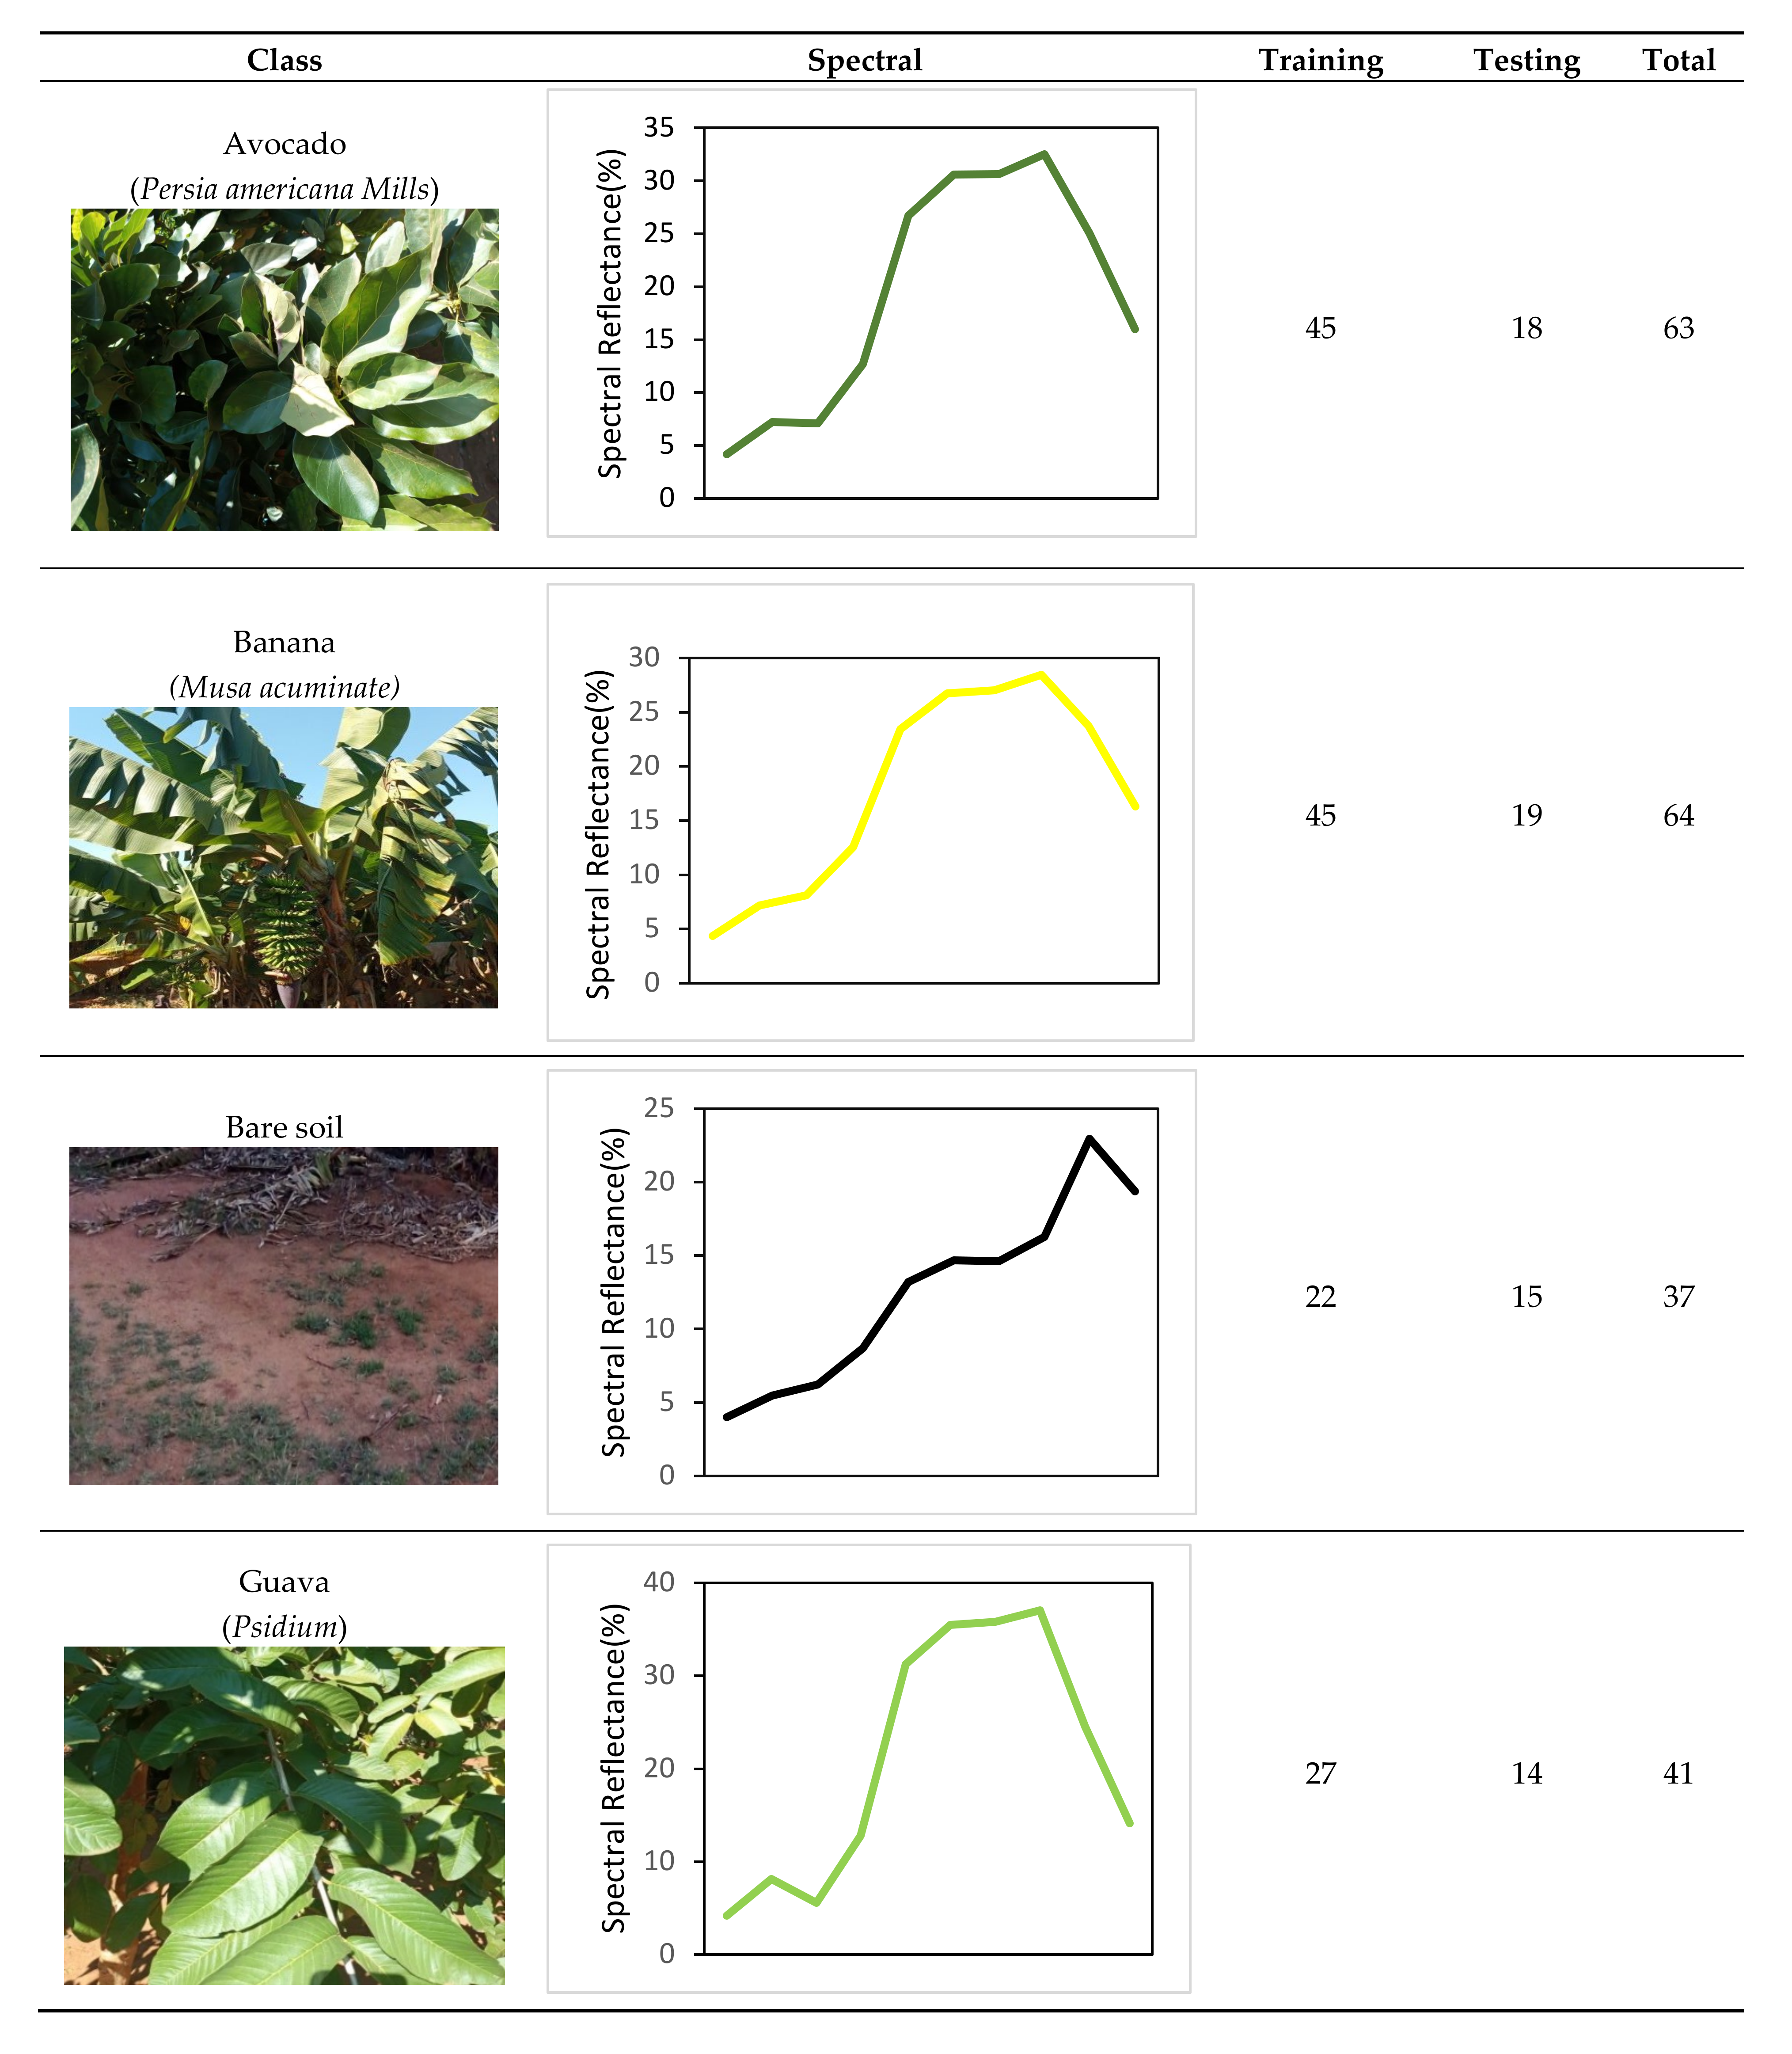
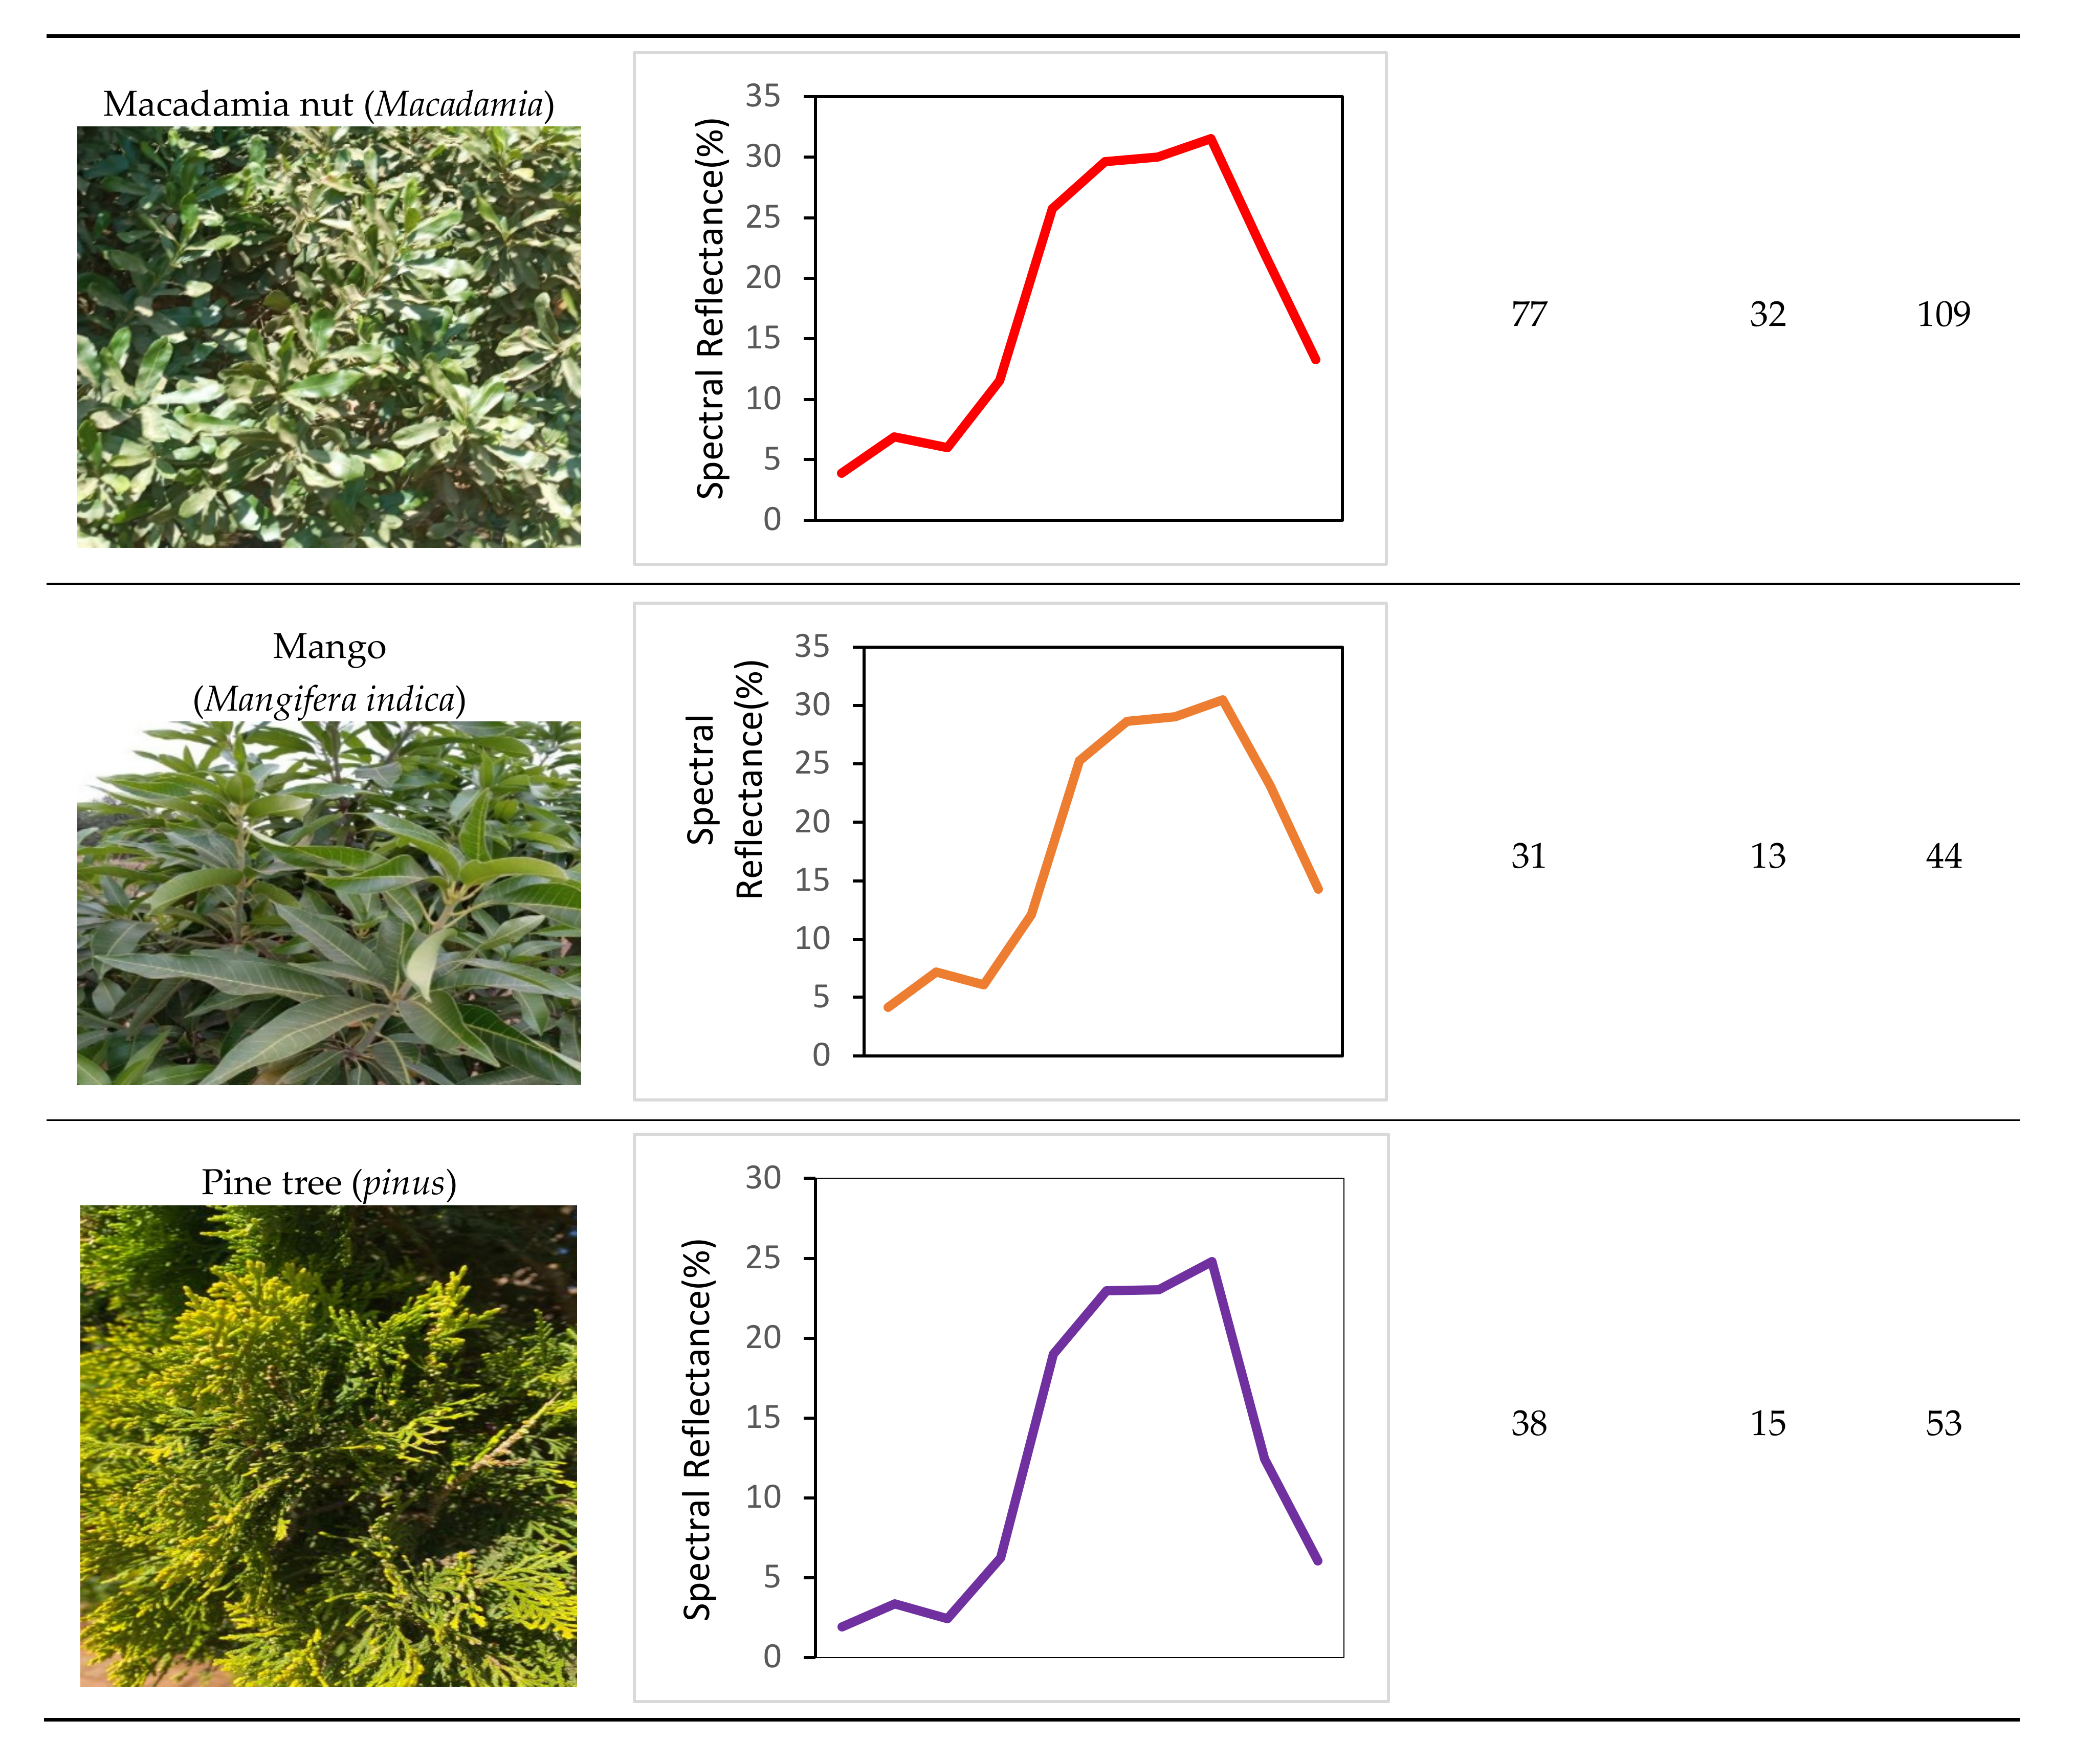
2.5. Field Data Collection

The training data were collected on 28, and 29 December 2019, as well as on 2 and 3 January 2020. The common fruit-tree crops were identified through extensive field surveys, interviewing people and consulting Google Earth Pro. Where there was accessibility, a roadside sampling method was used to capture points [65]. A handheld Global Position System (GPS), Garmin eTrex 20X, with a 5 m positional accuracy, was used to capture the coordinates systems of the samples at the center of the farms. At each point, metadata were captured, and a note was made on mixed cropping systems to ensure that these fields were avoided during digitizing. Using a 10 m distance to account for Sentinel-2 spatial resolution. A total number of 304 (n = 304) ground-truth points were captured from the dominant land cover classes; these include: avocado (n = 49), banana (n = 53), built-up (n = 7), guava (n = 12), macadamia nut (n = 95), mango (n = 18), pine tree (n = 22), water bodies (n = 4) and woody vegetation (n = 10). These points (n = 304) were then used to guide digitizing additional points where the field is big enough using informative observation on ArcGIS and Google Earth [66].

2.6. Assessing Spatial Autocorrelation

The ground truth data were evaluated for spatial autocorrelation using which produced a Moran’s Index of 1.004 with a Z-zcore of −24.76 indicating a dispersed pattern [67]. Furthermore, the points were spatially separated using “Spatially Rarerely Occurrence Data for Species Distribution Models (SDM) (reduce spatial autocorrelation)” function available in SDMPro Toolbox in ArcGIS Pro version 2.4. A Moran’s Index of 0.09 with a Z-zcore of 0.68 was obtained, which indicates a strong random pattern among the points [68].
The retained data were partitioned into 70% (387) train data and a 30% (176) validation set using SDM Random Select Points function to prevent biasness in the classification model [69]. Furthermore, purposeful sampling was employed to digitize additional samples for the underrepresented classes (i.e., bare soil, build-up, guava). The summary statistics of the most common fruit-tree crops and other land-use types identified in the field with their average reflectance, field photos, and the reference data are presented in Figure 3.

3. Image Classification

3.1. Machine learning Classification Algorithms

Two supervised machine learning algorithms, random forest (RF) and support vector machines (SVM), were evaluated in classifying the tree crop types using four dataset’s configurations at a pixel-based level. The models were tuned and were trained using the “caret package” in R studio, statistical software and programming language version 4.0 [70,71].

3.1.1. The Random Forest Algorithm (RF)

Random Forest (RF) is an ensemble machine learning algorithm that uses bagging to improve predictions by reducing the variance introduced by Breiman [72]. In this study, the RF model was optimized using two primary parameters, namely mtry and ntree, the former denotes the number of predictors tested at each tree node, and the latter illustrates the number of decision trees ran at each iteration, respectively [73]. The classification accuracy was improved by optimizing the number of grown trees (ntree) and variables at each tree split (mtry) based on the OOB error rate using a 10-fold cross-validation method and a grid search [74]. The optimal trees were searched at 500 intervals, using ntree parameters ranging from 500 to 10,000 [73]. On the other hand, the optimal mtry was searched using the square root of the total number of the explanatory variables as it has been proven to provide satisfactory results [48,75].
The RF model measures the importance of each explanatory variable applied in the classification using the OOB samples (unbiased estimates) and permutes the variables to calculate the mean decrease accuracy (MDA) and mean decrease Gini (MDG) [76].
The RF also builds trees using randomly replaced bootstrapped samples comprising two-thirds of the training dataset, decreasing the variance in classification errors [77,78]. The one-third of the training data excluded during the bootstrapped sample is referred to here as the out-of-bag (OOB) error rate. The OOB is used to internally evaluate the performance of the RF classification during the cross-validation process [79]. The model with the lowest OOB error is considered the best data fit for the RF model [4]. The equation used to define the OOB error in a classification framework is as follows [77].
errOOB = {1/n Card {i ∈ {1, …, n} | yi ≠yˆi}
where yˆi illustrates the predicted values aggregated by the number of trees t where (xi, yi) belongs to the OOB sample associated with it.
The RF algorithm has been commonly used to create crop types maps, as it has been shown to produce better accuracies [52]. The classifier is robust and suitable for heterogeneous landscapes and can handle the problem of noise and correlations that are intrinsically inherited in remote sensing data [77]. The crop types were classified using datasets generated from Sentinel-1 and Sentinel-2.

Assessing the Importance of Variables

The application of noisy bands has been reported to significantly impact classification conducted at the pixel level [80]. Selecting a set of optimal variables is essential to properly characterize objects and improve classification accuracy [81]. In this study, the RF algorithm’s out-of-bag (OOB) strategy was used to measure and rank the importance of variables from the training data using myImagePlorR in R studio from the data fusion model [72]. The RF model quantifies the variable importance (VI) using a mean decrease in accuracy (MDA) index, which ranks the ranks the importance of independent variables in predicting the dependent variable using a random permutation-based score [72,82]. The variables with lower MDA values indicates less association with the dependent variable, while the variables with higher MDA values are considered the most significant independent variables in classification [78,83,84,85].
The variable importance (VI) produced by each model differed significantly between the four dataset configurations. The spikes show the significance of each band per class in the band importance graphs. Standard bands for different datasets were identified for mapping the same crop types, but band importance inconsistencies amongst classes were observed [86].The selected optimal bands were used to form the model used to create the final crop maps.

Forward Variable Selection

A forward variable selection (FVS) is used to select relevant features that will yield lower misclassification error rates and use them to build multiple RF models [87]. FVS is based on a RF mean decrease accuracy (MDA) metric that ranks the variable importance of the remote sensing dataset [72,88,89]. Statistically, the objective of variable selection is to assist diagnostics, interpretation, as well as shorten the data processing time [77]. The data fusion comprised 12 spectral bands; hence, the FVS method was used to select a set of optimal variables to improve the overall accuracy. Six variables were selected and applied to the fused model using the training data to eliminate model overfitting, and used thereafter to classify crops using Random Forest (RF) [90,91].

3.1.2. The Support Vector Machines Algorithm (SVM)

The support vector machine (SVM) is a non-parametric supervised learning algorithm based on spectrally weighted kernel functions [92,93]. The method uses hyperplane to separate classes, which minimizes misclassifications [81].
The SVM consists of four types of kernels different types of kernels. However, only four kernels are commonly used to classify remote sensing data, which are linear, radial basis function (RBF), sigmoid, and polynomial kernels [94]. In this study, the SVM classifier was trained using the radial basis function (RBF) kernel in the Equation below:
K ( u , v ) = e x p γ × | u v | 2  
where γ denotes the kernel parameter in the RBF kernel.
In the SVM model, two parameters are used to tune the RBF kernel and select the best parameters, which are “C” cost and “gamma” (γ) [61]. The gamma and cost were optimized using 10-fold cross-validation to select the optimal C and γ parameters. The C parameter allows a trade-off between model complexity and training error. The optimal hyperplanes with sensitive spectral information are extracted and used to increase discrimination and classification accuracy [95]. Using a small C value increases the training errors while the large C value overfit the model [96]. The gamma (γ) is defined as a free parameter of the RBF; when the γ value is large, it indicates a small variance, which leads to a high-bias model [96].
The SVM has proven robust on imbalanced samples and is computationally fast [97,98]. The RBF is commonly used in remote sensing existing literature and has been proven to produce high overall accuracy compared to the other kernels, which depend on image resolution [76]. The RF based selected variables were again applied on SVM S1S2 variable selection model and used to classify crops.

3.2. Accuracy Assessment and Model Validation

Accuracy assessment was used to check how well the locations of the mapped crops correspond to the actual earth surface locations [99]. The method tests whether the sampling design and data analysis methods best fit the data [99]. Further, it validates the classified map based on location-specific data using the 30% test dataset. Previous studies have cited the confusion matrix as a widely used method for assessing the accuracy of thematic maps classified using the reference data [100]. The confusion matrixes were constructed, and the OOB error was used to identify the actual and misclassified class [87]. Further, different confusion matrix metrics such as the overall accuracy (OA), user accuracy (UA), producer accuracy (PA) and kappa coefficient (kappa) were computed to aid the explanations through Equations (4) and (5) [99,101].
O A = T P + T N T P + T N + F N + F P P r e c i s i o n = T P T P + F P R e c a l l = T P T P + F N
K i n d e x = 1 1 O A 1 P e
where TP, TN, are the samples predicted as true positive and true negatives while FP, FN is samples predicted as a false positive and false negative. At the same time, Pe indicates the probability of chance agreement.

4. Results

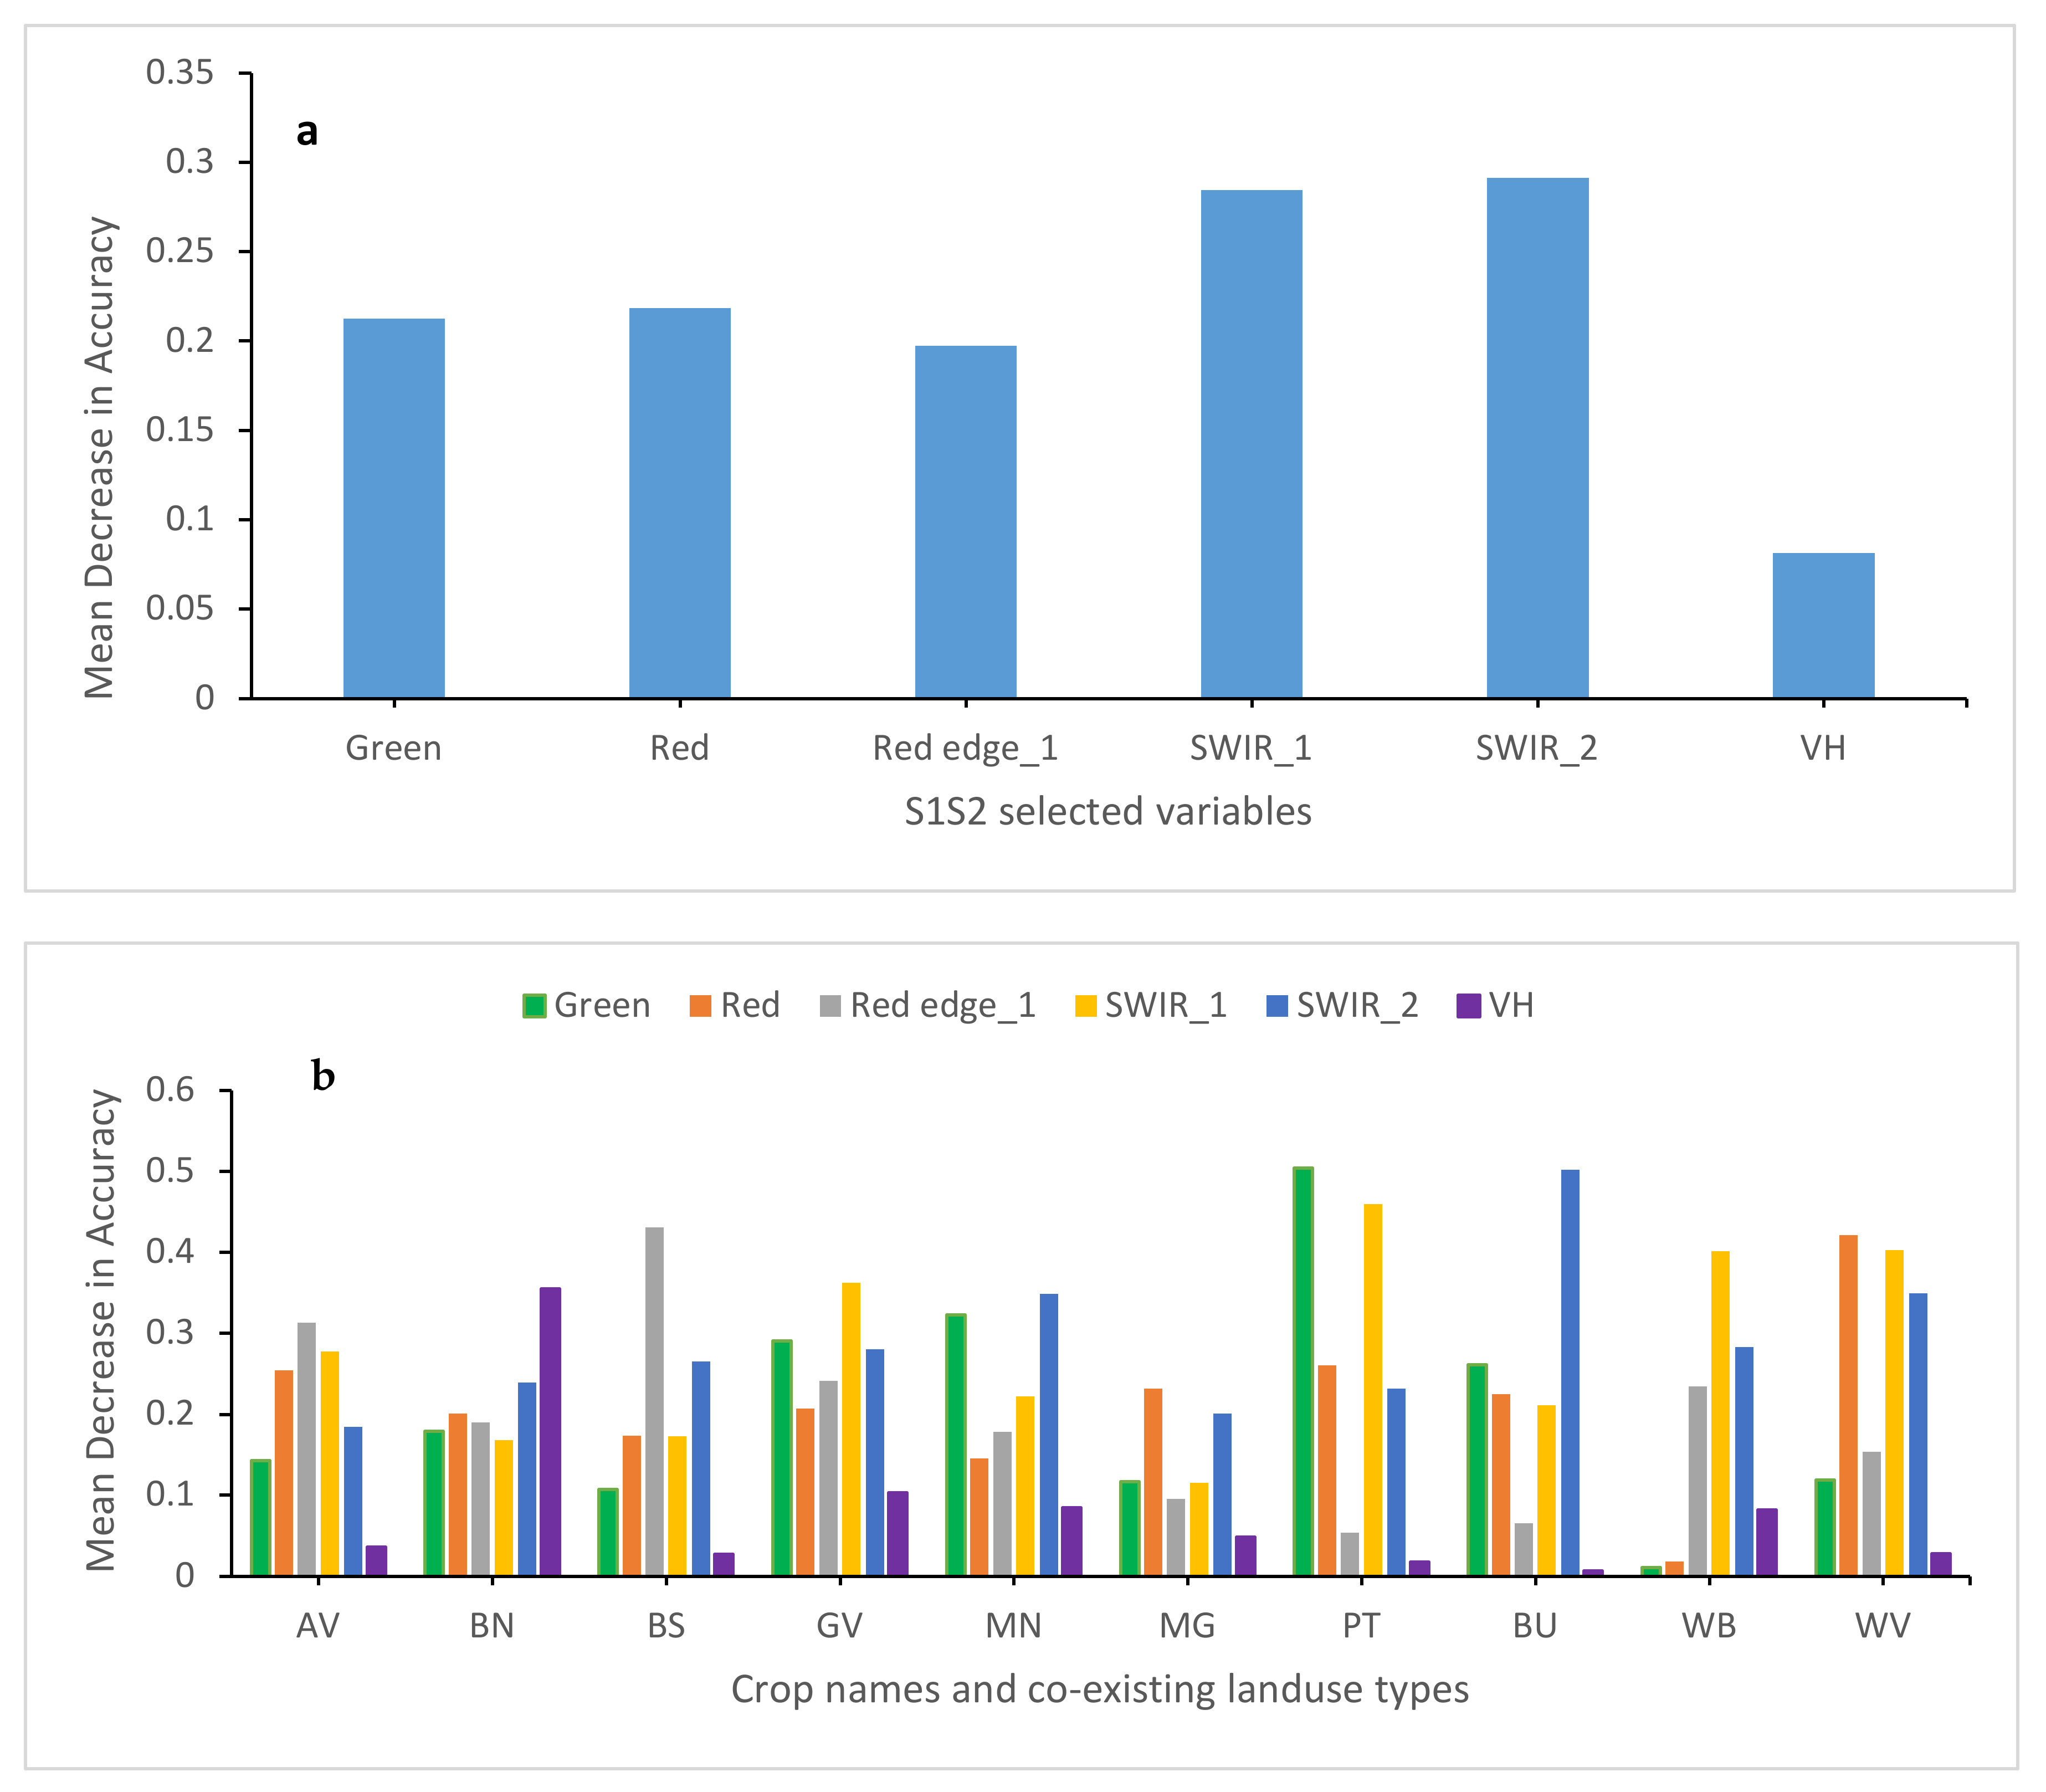
4.1. The Variable Importance

The variables selected as the most optimal for the data fusion model are shown in Figure 4a. In order of merit, these are the green (B3:560 nm), red (B4:665), rededge_1 (B5:705 nm), SWIR_1 (B11:1610 nm), SWIR_2 (B12:2190 nm) and the VH polarization. The significance of the SAR and optical bands in classifying classes was evaluated using the RF’s variable importance and mean decrease accuracy (MDA) consisting of spikes showing the most optimal bands as presented in Figure 4b. The contribution of each band is highly noticeable when data dimensionality is reduced.
The S2 Green band (B3) located in the visible region played a major role in differentiating between built-up areas, pine tree, guava and mango. The red band (B4) located at 650–680 wavelength played a significant role in distinguishing woody vegetation, guava and avocado, followed by the green band, which detected the pine trees, built-up areas, guava and mango, better. The SWIR_2 (B12:2190) was imperative in discriminating woody vegetation, pine tree, bare soil, and water bodies. Similarly, the built-up areas, pine trees and bare soil were better identified using the RedEdge_1 (B5:665). The SWIR_1 (B11:1610) played a significant role in distinguishing water bodies, pine trees, guava, avocado, and woody vegetation. For S1, the results highlight a vast contribution of VH polarization to discriminating the banana class.

4.2. The Variable Selection Using the Forward Feature Selection (FFS) Method

All fused Sentinel-1 and Sentinel-2 bands (n = 12) produced an OOB error of 14.29%. A forward feature selection (FFS) was used to select a set of optimal features combination that could lead to high mapping accuracy while mitigating high dimension and model over-fitting (Meyer et al., 2018). The FFS was carried out based on mean decrease accuracy (MDA) calculated during the training of the RF model. The MDA measure filters the explanatory variables based on their prediction strength (Kuhn and Johnson, 2013). The results indicate that the lowest OOB error is achievable with six variables, as the error rate increases from seven variables upwards (as shown in Figure 5).

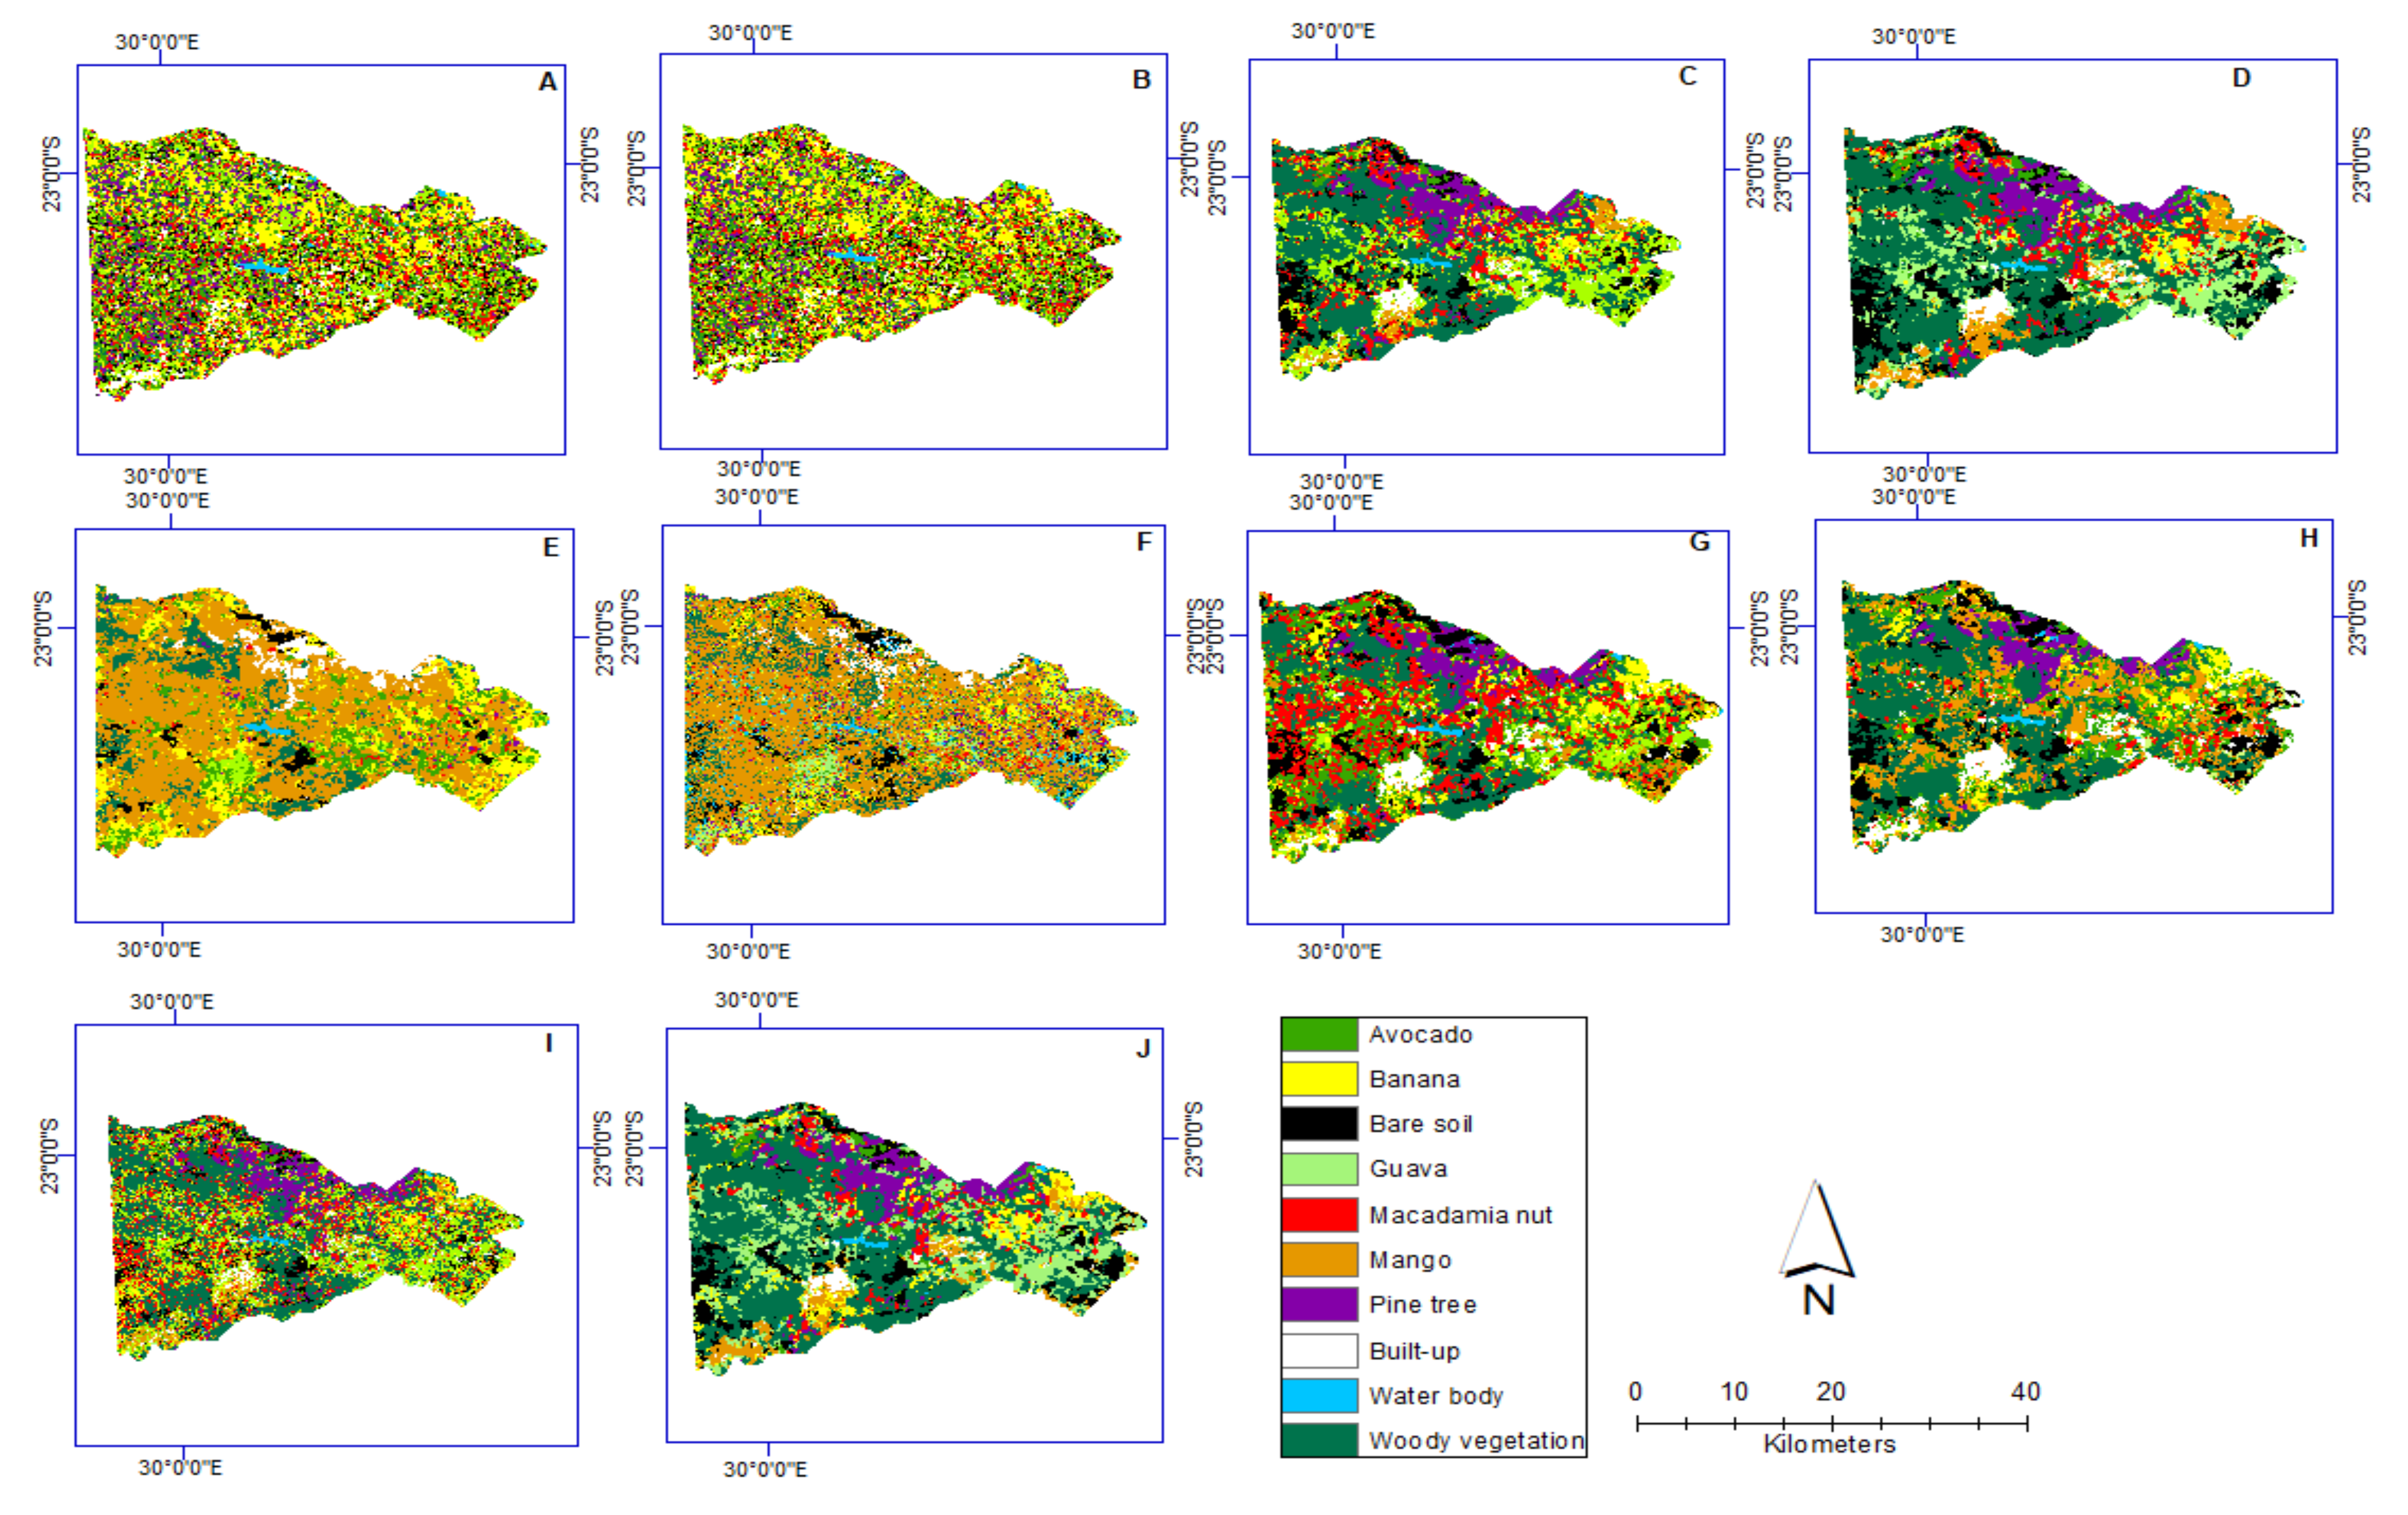
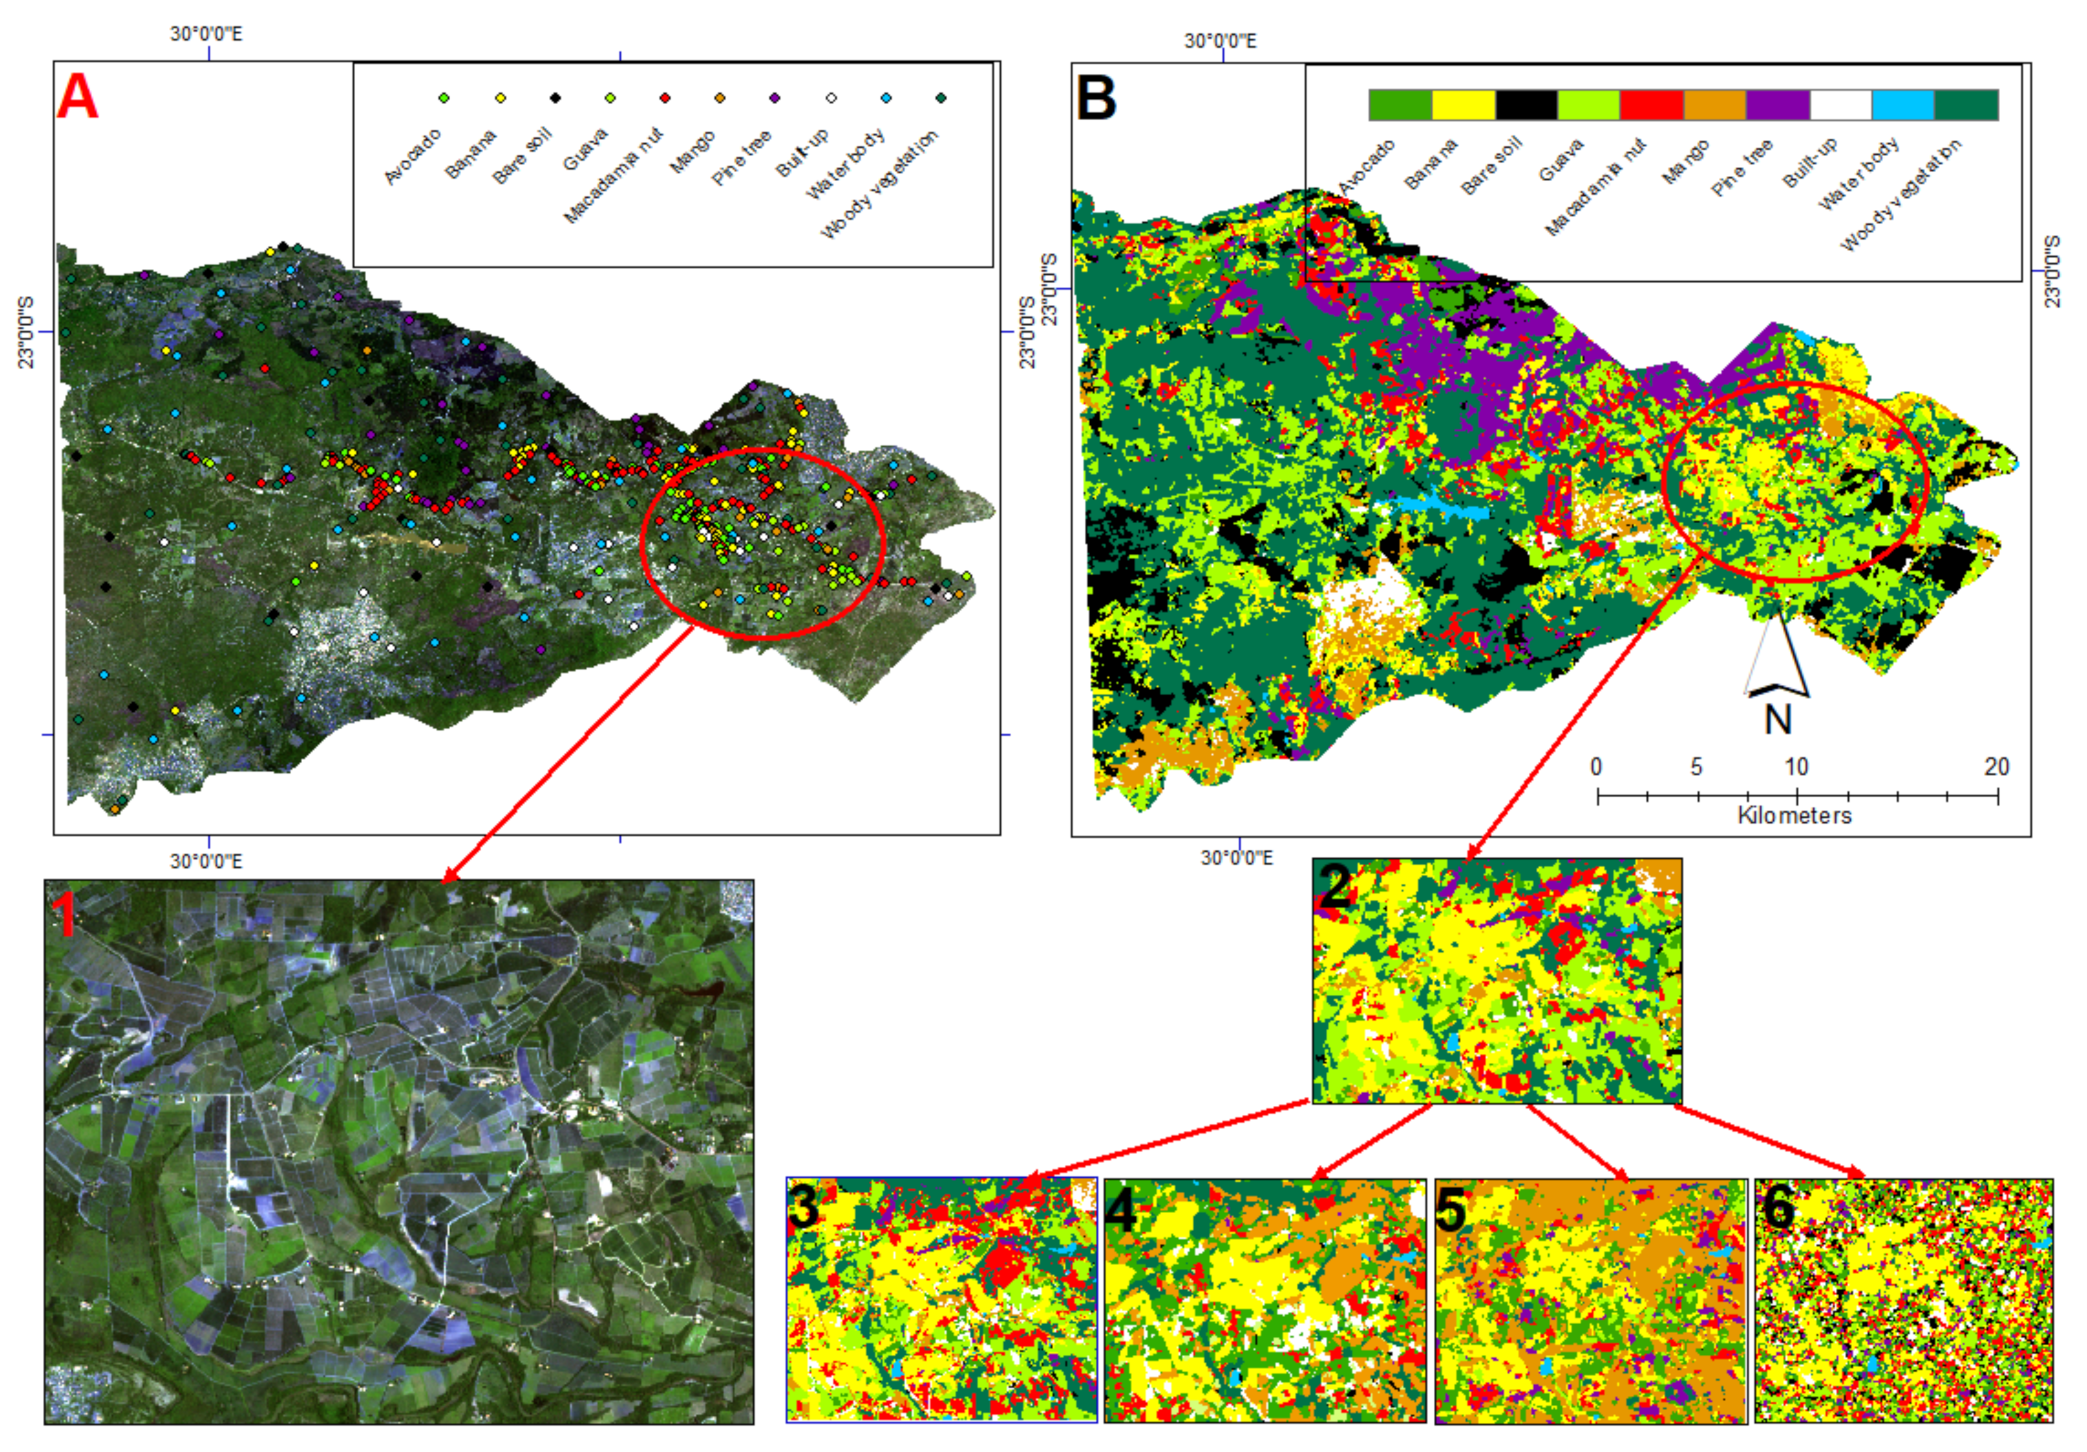
4.3. Mapping Outputs

The patterns of RF and SVM in mapping tree crop species and other existing land use types based on Sentinel-1 SAR data. Figure 6A,B) shows that the woody vegetation is the dominant land use in the radar scenes. The other land use types were not detected accurately, making it difficult to interpret the spatial distribution patterns.
The optical data classification shows a heterogeneous area of bananas mixed with guava. Most of the classes are incorrectly classified by optical scene compared to the radar scenes. The RF map presented in Figure 6C,D display the spatial distribution of classes showing misclassifications between avocado, bare soil and built-up areas. As a result, the bananas were misclassified as guavas and mangoes. The highest spectral confusions were reported between guava, banana, avocado, built-up regions, mango, and macadamia nut trees. Conversely, in Figure 6D and Table 2B, the SVM map displayed less spectral confusion between mangoes and banana, macadamia nuts and mangoes.
As depicted in Figure 7E,F, Table 1 and Table 2C, the RF maps shows the spectral confusion between avocado and mangoes. The avocado crop overlaps with banana, mango and macadamia nut, as shown in Table 1. Some mangoes were classified as macadamia nut, while some macadamia nut trees were classified as guavas. The SVM classifier recorded misclassifications between these classes (Figure 7F).
The addition of radar data to the optical data reduced the image speckles. The SVM map displayed spectral confusion for most of the classes except for avocado, mangoes, and bananas (Table 2D). The RF map shows less spectral, and a shift of spectral confusion towards the avocado and the guava, the mangoes and the banana class were noticed, Figure 6G and Figure 7B. As depicted in Table 1, the mango crop overlaps with avocado and macadamia classes. Hence, most of the areas of avocadoes were classified as mangoes, while a few macadamia nut trees were misclassified as guava in Figure 6H.
Accurate class separation was achieved based on selected six optical variables using 1 SAR and 1 Optical scene. There is a reduction in class confusion in a macadamia nut and avocado areas (Table 2), while a noticeable amount of mango pixels was still misclassified (Figure 6G), as well as some avocados being misclassified as guavas. The best classification model was based on the SVM algorithm (Figure 6H). The areal coverage from the map with the highest classification accuracy shows the woody vegetation as the largest class covering 36.3% of the south, northeast and past southeast of the study area. The Guava crop is the second largest, covering 16.80% and dominates in the eastern part of the study area compared to a water body and built-up, covering 0.8% and 2.6%, respectively.

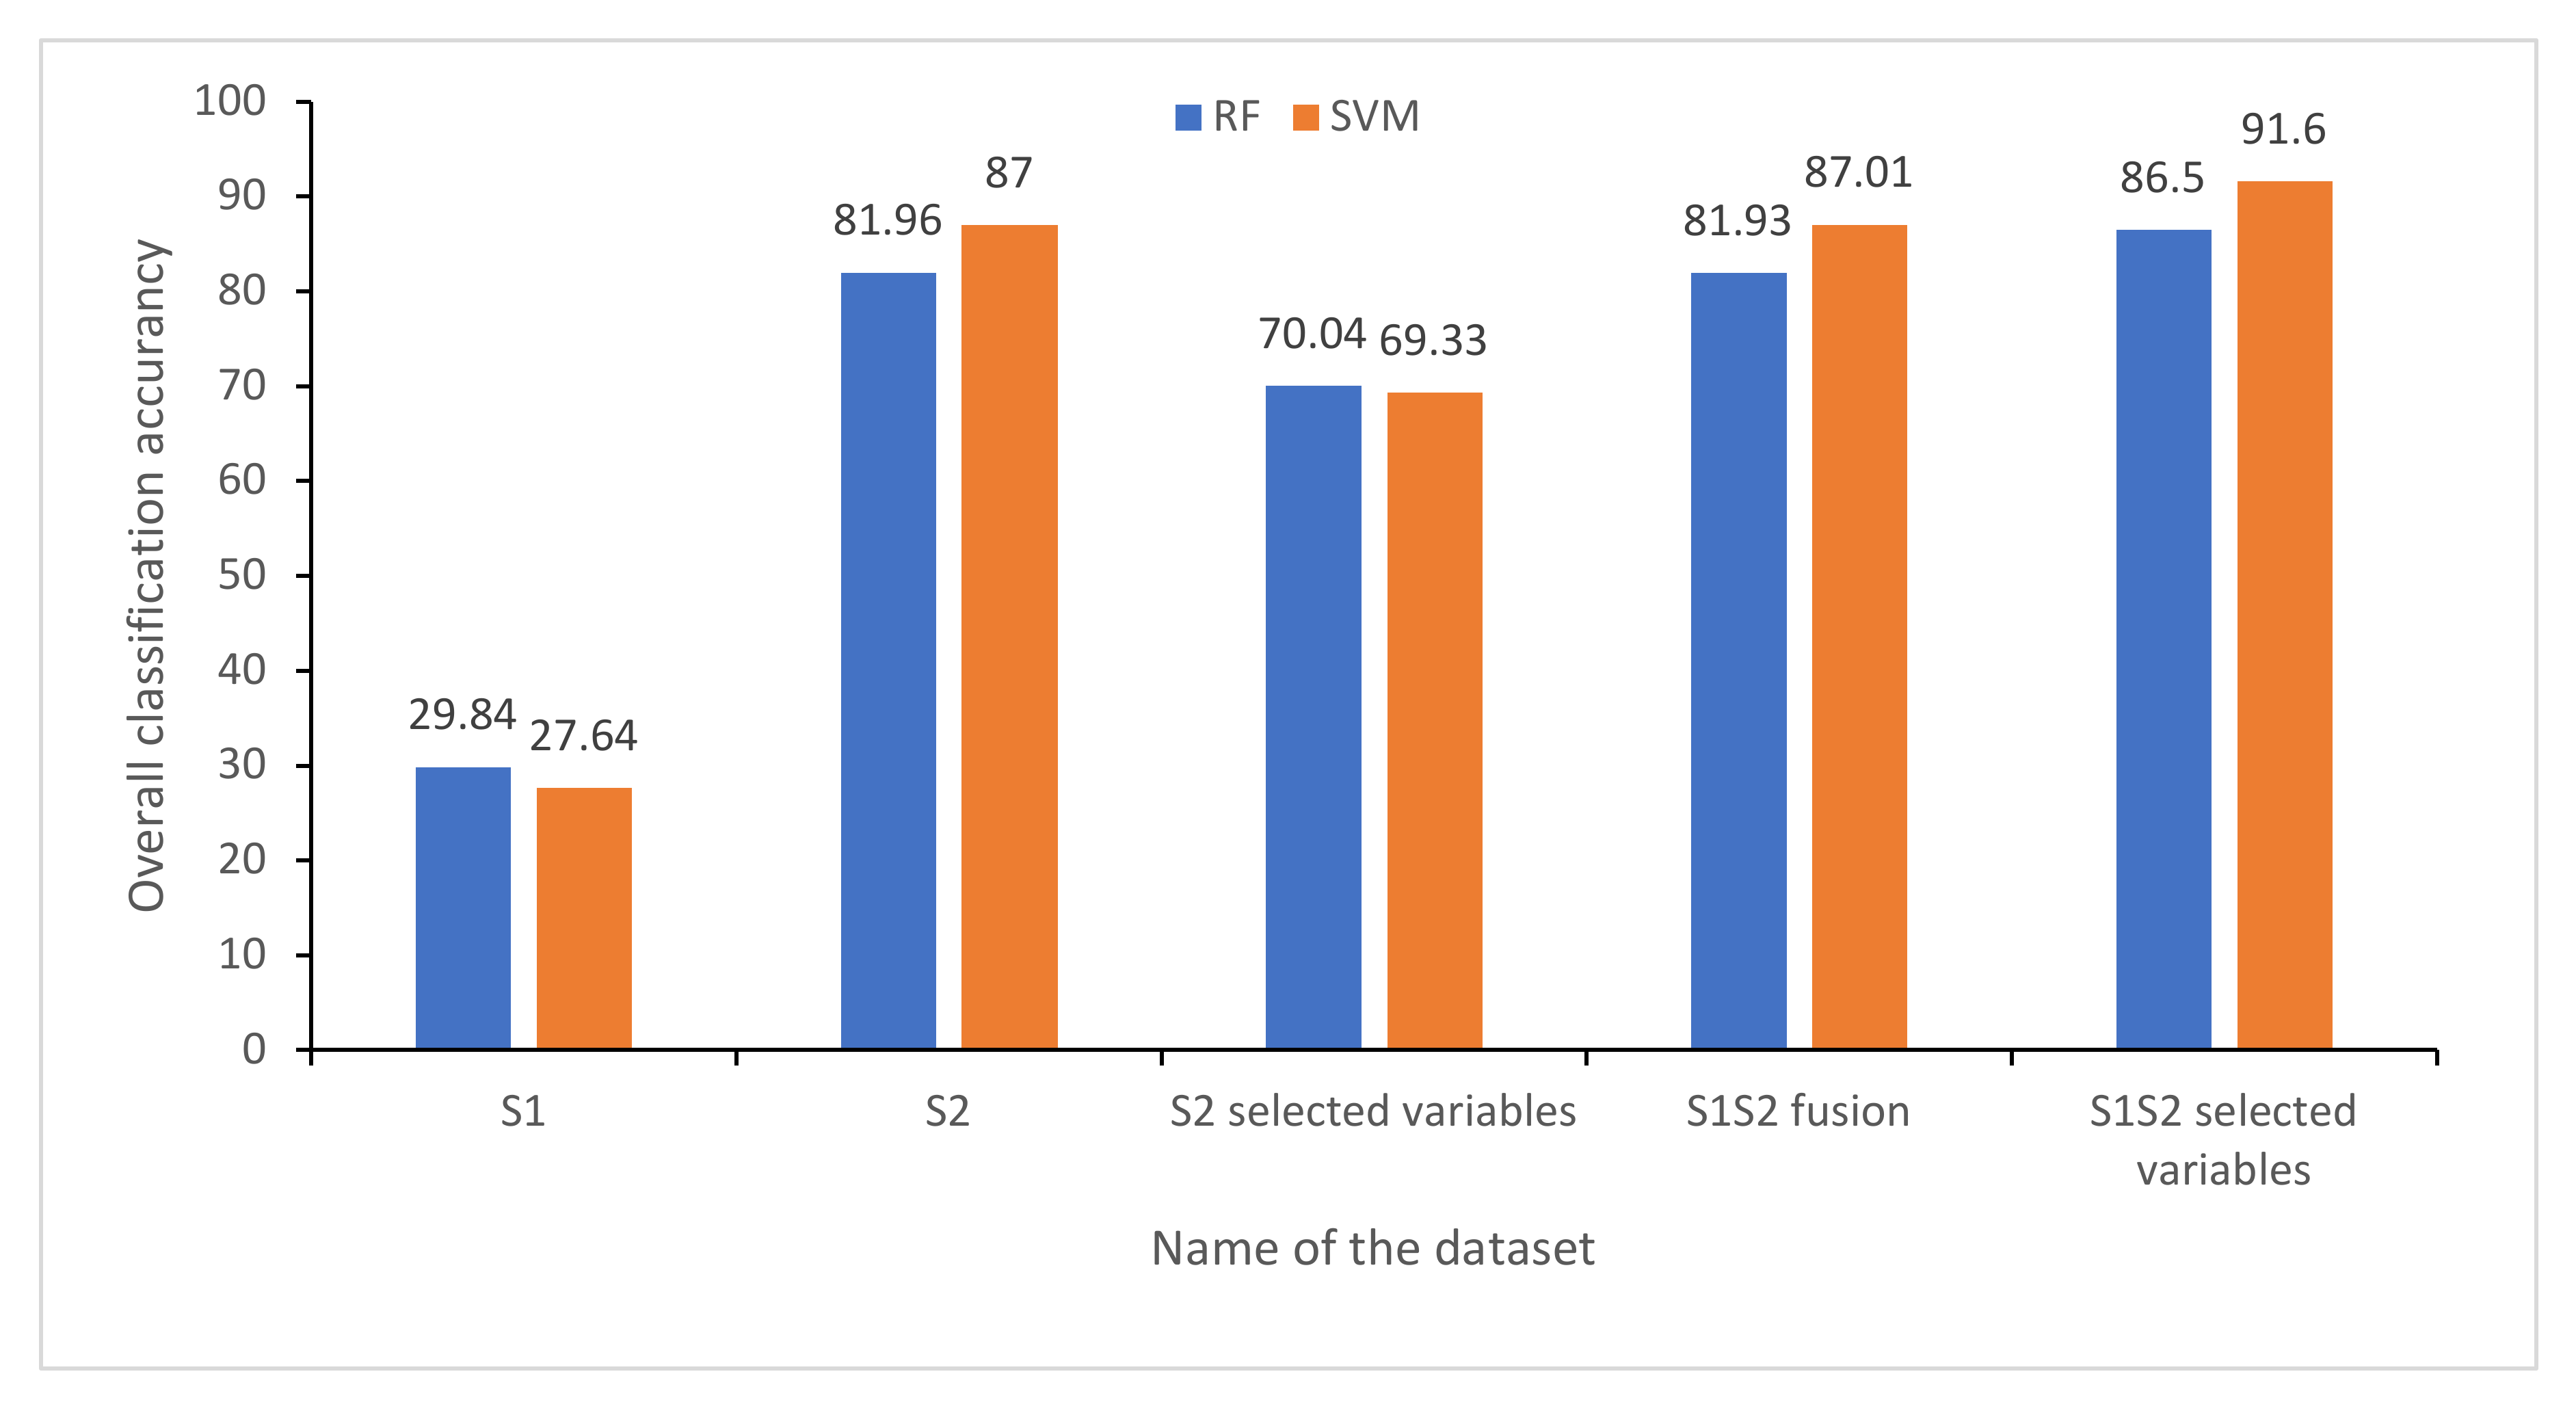
4.4. Classification Accuracy

In this study, the classification accuracy was assessed using testing data. Five different models comprising different variables, namely S1 (n = 2) (VV, VH); S2 (n = 10) (B3: Blue, B3: green, B4: red, B5: red edge_1, B6: red edge_2, B7: red edge_3, B8: NIR, B8a: Narrow NIR, B11: SWIR_1, B12: SWIR_2); S2 selected variables (n = 6)(B2: blue, B3:green, B4: red, B5: red edge_1, B11:SWIR_1S1S2, SWIR_2:B12); S1S2 (n = 12) (B2: blue, B3: green, B4: red, B5: red edge_1, B6: red edge_2, B7: red edge_3, B8: NIR, B8a: Narrow NIR, B11: SWIR_1, B12: SWIR_2, VV, VH), and S1S2 selected variables (n = 06) (B3: green, B4: red, B5: red edge_1, B11: SWIR_1, B12: SWIR_2, VH), were used and classified using RF and SVM. The S1S2 selected variable model using the SVM classifier obtained the highest classification accuracy compared to the RF classifier for the other models (S1, S2, S2 selected variables and S1S2), as shown in Figure 8. The S1 produced an overall classification accuracy of 28.04% and 27.64%, using the RF and SVM model. The S2 model had an overall classification accuracy of 81.96% and 87% for RF and SVM, while the S2 selected variables produced an overall accuracy of 70,04% and 69.33% using the RF and SVM, respectively. A steady accuracy was observed from the data fusion approach, wherein an overall classification of 81.93% and 87.01% was achieved. The combination of selected optimal variables produced an increased accuracy of 86.50 and 91.6% for RF and SVM, respectively, amounting to a 4% improvement over S2 data. A bar plot showing the highest classification accuracies from both models is presented in Figure 5.

4.5. Class Accuracies

The classification accuracies of the four datasets at a class-wise level were evaluated using the test dataset. The user’s accuracy (UA) and producer’s accuracy (PA) in Table 3 show the overall accuracies obtained by each model using RF and SVM. The producer’s and user’s accuracies give crucial insight into how each model contributed to detecting classes.
The produced UA’s and PA’s accuracies ranged from 17.74 to 100%. The sentinel-1 SAR data discriminated the water bodies and woody vegetation with an overall accuracy of 80% and above, while the other crops were below 40% for both classifiers. Optical data (S2) increased the UA’s and PA’s accuracies to above 70% for all classes using the RF. Conversely, the UA’s and PA’s accuracy scores were below 60% for avocado, guava, pine tree and mango using the SVM classifier. However, a decrease in UA’s and PA’s scores was recorded for the mango and pine tree classes. The model S2 selected variables recorded an increase of 5.81% in the UA for the mango class. The UA values for the built-up and woody vegetation classes increased by 2.98% and 0.40%. The PA values of the bare soil, macadamia nut, mango and water body increased by 2.21%, 12.41%,1 7.85% and 4%, respectively.
Using the selected optical variables from data fusion, the mango class recorded a 20–30% accuracy increase compared to the other models. Though the SVM proved superior to the RF model, the individual class accuracies for avocado, guava, mango, and macadamia nut are comparable. The RF improved the producer and user accuracy margins of areas identified as guava, pine tree, built-up, water bodies and woody vegetation by over 80%, including the mango class, which was challenging to detect in other models.

5. Discussion

The study evaluated the utility of using RF and SVM models using Sentinel-1 (SAR) and Sentinel-2 Optical, their synergy to map fruit-tree crop species and co-existing land-use types in a heterogeneous smallholder landscape. The study further tested the utility of feature selection by investigating the relevance of the Sentine-1 and Sentinel-2 bands by calculating the variable importance using a RF algorithm to eliminate data dimensionality and increase classification accuracy [89]. The free availability of SAR and multispectral data ESA Copernicus with suitable spectral, temporal and spatial resolution similar to SPOT-5 provides promising opportunities for mapping smallholder agriculture at the landscape level [102].
The results showed that Sentinel-1 data could not be used alone, as it could not differentiate between the studied fruit-tree crops and other existing land uses due to a limited number of channels [103]. As expected, the classification based on the SAR image produced an overall accuracy of 28.04% using RF and 27.64% using the SVM, respectively. Similar to findings by s, the VH polarization was optimal in distinguishing the fruit-tree crops due to its sensitivity to the structure and geometrical features of crops. The application of Sentinel-1 data alone resulted in false cropping patterns using both classifiers (RF and SVM). The findings concur with previous studies that mapping tree crops using single date images produced unsatisfactory results due to similarities in physiological and morphological characteristics that commonly exist in fruit-tree species [104,105]. It is even more challenging to obtain precise information when mapping crops at the landscape level [81]. The reason why Sentinel-1 SAR data report confused cropping patterns on all land cover classes, except the banana crop, is yet to be studied.
The Sentinel-2 data performed well in discriminating crops since they consist of spectral information, which is crucial in crop discrimination [106]. In contrast, the NIR has shown to be less critical to all models in discriminating tree crops, as [107] reported. The NIR band was noisy and less beneficial in crop discrimination [80]. The Individual class accuracy results showed some difficulties Sentinel optical data in discriminating banana, guava, and mango within built-up areas due to spectral overlapping, suggesting a high level of crop dependence on R.S. spatial resolution to be classified accurately. Hence, the success of crop mapping relies on the careful selection of remote sensing data with appropriate spectral and spatial characteristics to improve classification accuracy [104].
The use of 12 spectral bands yielded less accuracy than the selected six optimal bands due to noise contamination [48]. Similar to the existing literature on mapping fruit-tree parameters, the highest classification accuracy of 91.60% was achieved from the combination of selected variables from SAR and optical data, much better than results derived from high-resolution SAR and optical images [34,106,108]. Through the use of the SVM model, the classification accuracy improved by 4% showcasing the importance of using SAR-optical fusion in areas where landscape heterogeneity and climatic conditions challenge remote sensing data acquisition [105]. Data fusion is a promising approach in remote sensing that provides smallholder farmers with spatially explicit information while offering practical opportunities to achieve precision agriculture at the landscape level.
As reported in previous studies [109,110], including Sentinel-1 backscatter, improved crop separability and the overall classification accuracy due to its sensitivity to biomass and tree canopies. The class accuracy was improved for crops and other land-use types when radar data were integrated with optical data. The effect of variable selection for enhancing the class accuracy was high with regard to mango crops, where a 20–30% increase was recorded, which agrees with findings by [111]. The RF improved the producer and user accuracy margins of areas identified as guava, pine tree, built-up, water bodies and woody vegetation by over 80%, including the mango class, which was challenging to detect in other models. Heterogeneous classes such as avocado, guava, mango, and macadamia nut were distinguished correctly from the other crops using the variable selection. Although the SVM proved superior to the RF model in terms of overall accuracy, the implemented RF model using the selected variables was robust and informative.
The class-specific variable selection showed that the green band (B3:560 nm) was the most influential spectral band in discriminating pine trees, mango, and guava. The Sentinel-1 VH band was effective in detecting the banana crop, which corresponds with previous studies [112]. Sentinel-2 green band (B3: 560 nm) was crucial for mapping pine trees, mango, and guava. The red band was essential for detecting avocado and woody vegetation, while the red edge_1 (B5: 705 nm) distinguished avocado and bare soil. SWIR bands were critical in discriminating built-up areas, banana, mango, guava, pine tree, water bodies and woody vegetation. The model detected all crops well, including the small patches of mango and bananas hidden within built-up areas. Similar to [109], the data fusion model was a better discriminator for mango patches within built-up regions that could not be detected using S1 and S2 alone. The visible bands (green (B3:560 nm) and red (B4: 665 nm), SWIR_2 (B12: 2.190 nm), SWIR_1 (B11: 1.610 nm) and the rededge_1 (B5: 705 nm) were the most sensitive to chlorophyll content and leaf structure and contributed highly in distinguishing crops [113]. Using selected pivotal bands from the data fusion produced less spectral confusion and was suitable for mapping fruit-tree crops in a heterogeneous environment. The criticality of the SWIR bands in fruit-tree crop mapping was highlighted [40]. The maps depicting tree crops and co-existing land-use types show that the integrated approach discriminates subtle areas, which was not the case in optical and SAR models alone [114]. The selection of optimal variables proved to be a well-suited mapping approach for the study area, which agrees with the findings of [111,115].
The comparison of Sentinel-2 and data fusion showed good agreement in this study. As [61] reported, including the SAR data, particularly the VH polarization, increased the detection of smaller crop aggregations while the optical data overestimated the crop distribution in the study area. The Sentinel-2 method missed some small patches of mango and guava crops (Figure 6C,D). The data fusion model accurately captured the cropping dynamics in heterogeneous smallholder agriculture. The visual assessment of the final maps generated using the selected optimal variables showed enhanced interpretability [40] on SVM products while some noise in homogenous maps produced by the RF algorithm, similar to [73] findings. The data distinguished crops better due to the swath width and high spatial resolution, which account for crop patterns in small field sizes for heterogeneous areas. The noise depicted on maps produced using each dataset separately was reduced by the fused model. The radar data are sensitive to vegetation structure and texture, and it contributed much to discriminating banana, mango, and guava found within build-up areas, which was difficult to determine using single date images.
The contribution of SAR and optical data in crop mapping of smallholder agriculture in an African setting was ascertained. Further, the potential of S1S2 spectral discriminating power was analyzed. Although the results were not significantly increased, the model stability on fused data increased, demonstrating data fusion’s potential to enhance smallholder crop mapping. The combination of backscatter from Sentinel-1 (SAR) at C-band and spectral features from Sentinel-2 (optical) have proven to be a better approach in discovering complex distribution patterns of crops, including classes that are difficult to map using a single image. Integrating S1S2 provided spectral and textural information to detect different tree crops and co-existing land-use types better in a heterogeneous landscape [108]. To ascertain this, we further investigated the effect of variable selection on S2 data. The model produced an overall accuracy of 70.04% and 69.33% using RF and SVM, respectively. Although the levels of class accuracies were low on the S1S2 model compared to the S2 model, the results of this study proved that incorporating the SAR data enhanced the discrimination of the crop types. A clear trade-off was observed between S2 and data fusion, where the highest classification results were obtained using data fusion information. Due to the Sentinel-2 low geometric resolution, the crops from small farm parcels that belong to the same family were not accurately classified [104].
The approach provides opportunities to map sub-tropical smallholder agriculture with mixed cropping systems for field management, precision agriculture, decision-making by agronomists and government. However, the method was time-consuming and required advanced remote sensing and GIS skills and a high processing computer to accomplish the task. The study was limited to a single date image from each Sentinel platform to simplify the mapping process. The launch of Sentinel-1B with five days’ temporal resolution allows the application of SAR data in mapping heterogeneous landscapes. Although Sentinel-1 failed to detect crop types, it is still helpful to integrate its data with optical data as it offers opportunities to enhance the distribution patterns in heterogeneous landscapes.
Therefore, the study recommends testing this model on multi-time series data to improve crop detection using crop temporal behaviors from different phenological stages. Due to various cropping calendars, it is advisable to use multi-time series images to assess different vegetative stages and identify the optimum window relevant for accurate crop mapping for precision agriculture (PA) [80]. Further, the study recommends selecting a few optimal polarimetric images to reduce high data dimensionality and increase classification accuracy. Discriminating all crops with high accuracy, including minor crops, is essential. Hence, the study suggests an image fusing approach based on time-series data to identify temporal windows crucial for accurate crop mapping.

6. Conclusions

Overall, the use of single-source data (S1) proved unsuitable for mapping crops due to the lack of spectral characteristics. Although the optical data (S2) performed better than S1, it could not discriminate crops with spectral similarities (i.e., mango, macadamia, pine tree). Combining SAR (S1) and optical (S2) data into machine learning classifiers can be used to map fruit-tree crops in a sub-tropical heterogeneous landscape experiencing frequent cloud coverage. The results show that the SVM classifier provides the best classification results for fruit-tree crops and co-existing land use types by utilizing six key variables, of which five were S2 bands (i.e., green (B3), red (B5), rededge_1 (B5), SWIR_1 (B11), SWIR_2 (B12)) and one S1 channel (the VH polarization). The multi-source approach provides timely information for evidence-based decision making.

Author Contributions

Y.C.: Data collection, duration, conceptualization, methodology, analysis, writing and editing. E.A.: Supervision, conceptualization and review and editing. K.A.A.: review and editing. All authors have read and agreed to the published version of the manuscript.

Funding

This research received no external funding. The journal forms part of Yingisani Chabalala PhD.

Acknowledgments

The study was conducted at Levubu Sub-tropical farms. I want to thank my supervisor, Elhadi Adam and Ali Adem, for your unwavering support and guidance. Your input and advice is always noted and appreciated. I also extend my gratitude to Thivhafuni Tshigoli, Minkie Marima and Glory Mathonsi for their help during data collection. We are grateful to Gerry and John for providing access to your farms to collect data.

Conflicts of Interest

The authors declare no conflict of interest.

References

  1. Crommelinck, S.; Höfle, B. Simulating an autonomously operating low-cost static terrestrial LiDAR for multitemporal maize crop height measurements. Remote Sens. 2016, 8, 205. [Google Scholar] [CrossRef] [Green Version]
  2. Abdel-Rahman, E.M.; Ahmed, F.B. The application of remote sensing techniques to sugarcane (Saccharum spp. hybrid) production: A review of the literature. Int. J. Remote Sens. 2008, 29, 3753–3767. [Google Scholar] [CrossRef]
  3. Brinkhoff, J.; Vardanega, J.; Robson, A.J. Land cover classification of nine perennial crops using sentinel-1 and -2 data. Remote Sens. 2020, 12, 96. [Google Scholar] [CrossRef] [Green Version]
  4. Useya, J.; Chen, S. Exploring the potential of mapping cropping patterns on smallholder scale croplands using Sentinel-1 SAR data. Chin. Geogr. Sci. 2019, 29, 626–639. [Google Scholar] [CrossRef] [Green Version]
  5. Mukwada, G.; Mazibuko, S.; Moeletsi, M.; Robinson, G. Can famine be averted? A spatiotemporal assessment of the impact of climate change on food security in the Luvuvhu River Catchment of South Africa. Land 2021, 10, 527. [Google Scholar] [CrossRef]
  6. Abbott, P.; Checco, A.; Polese, D. Smart farming in sub-Saharan Africa: Challenges and opportunities. Sensornets 2021, 1, 159–164. [Google Scholar] [CrossRef]
  7. Amare, M.; Mariara, J.; Oostendorp, R.; Pradhan, M. The impact of smallholder farmers’ participation in avocado export markets on the labor market, farm yields, sales prices, and incomes in Kenya. Land Use Policy 2019, 88, 104168. [Google Scholar] [CrossRef]
  8. Johansen, K.; Duan, Q.; Tu, Y.-H.; Searle, C.; Wu, D.; Phinn, S.; Robson, A.; McCabe, M.F. Mapping the condition of macadamia tree crops using multi-spectral UAV and WorldView-3 imagery. J. Photogramm. Remote Sens. 2020, 165, 28–40. [Google Scholar] [CrossRef]
  9. Danylo, O.; Pirker, J.; Lemoine, G.; Ceccherini, G.; See, L.; McCallum, I.; Hadi; Kraxner, F.; Achard, F.; Fritz, S. A map of the extent and year of detection of oil palm plantations in Indonesia, Malaysia and Thailand. Sci. Data 2021, 8, 4–11. [Google Scholar] [CrossRef]
  10. Ge, Y.; Bai, G.; Stoerger, V.; Schnable, J.C. Temporal dynamics of maize plant growth, water use, and leaf water content using automated high throughput RGB and hyperspectral imaging. Comput. Electron. Agric. 2016, 127, 625–632. [Google Scholar] [CrossRef] [Green Version]
  11. Kolecka, N.; Ginzler, C.; Pazur, R.; Price, B.; Verburg, P.H. Regional scale mapping of grassland mowing frequency with Sentinel-2 time series. Remote Sens. 2018, 10, 1221. [Google Scholar] [CrossRef] [Green Version]
  12. Sinha, R.; Quirós, J.J.; Sankaran, S.; Khot, L.R. High resolution aerial photogrammetry based 3D mapping of fruit crop canopies for precision inputs management. Inf. Process. Agric. 2021, 9, 1–13. [Google Scholar] [CrossRef]
  13. Meroni, M.; D’Andrimont, R.; Vrieling, A.; Fasbender, D.; Lemoine, G.; Rembold, F.; Seguini, L.; Verhegghen, A. Comparing land surface phenology of major European crops as derived from SAR and multispectral data of Sentinel-1 and -2. Remote Sens. Environ. 2021, 253, 112232. [Google Scholar] [CrossRef] [PubMed]
  14. Wolfert, S.; Ge, L.; Verdouw, C.; Bogaardt, M.-J. Big data in smart farming—A review. Agric. Syst. 2017, 153, 69–80. [Google Scholar] [CrossRef]
  15. Segarra, J.; Buchaillot, M.L.; Araus, J.L.; Kefauver, S.C. Remote sensing for precision agriculture: Sentinel-2 improved features and applications. Agronomy. 2020, 10, 641. [Google Scholar] [CrossRef]
  16. Kellengere Shankarnarayan, V.; Ramakrishna, H. Paradigm change in Indian agricultural practices using Big Data: Challenges and opportunities from field to plate. Inf. Processing Agric. 2020, 7, 355–368. [Google Scholar] [CrossRef]
  17. Sishodia, R.P.; Ray, R.L.; Singh, S.K. Applications of remote sensing in precision agriculture: A review. Remote Sens. 2020, 12, 3136. [Google Scholar] [CrossRef]
  18. Böhler, J.E.; Schaepman, M.E.; Kneubühler, M. Crop separability from individual and combined airborne imaging spectroscopy and UAV multispectral data. Remote Sens. 2020, 12, 1256. [Google Scholar] [CrossRef] [Green Version]
  19. Yandún Narváez, F.J.; Salvo del Pedregal, J.P.; Prieto, A.; Torres-Torriti, M.; Auat Cheein, F.A. LiDAR and thermal images fusion for ground-based 3D characterisation of fruit trees. Biosyst. Eng. 2016, 151, 479–494. [Google Scholar] [CrossRef]
  20. Maimaitijiang, M.; Sagan, V.; Sidike, P.; Hartling, S.; Esposito, F.; Fritschi, F.B. Soybean yield prediction from UAV using multimodal data fusion and deep learning. Remote Sens. Environ. 2020, 237, 111599. [Google Scholar] [CrossRef]
  21. Bai, G.; Ge, Y.; Hussain, W.; Baenziger, P.S.; Graef, G. A multi-sensor system for high throughput field phenotyping in soybean and wheat breeding. Comput. Electron. Agric. 2016, 128, 181–192. [Google Scholar] [CrossRef] [Green Version]
  22. Bai, T.; Zhang, N.; Mercatoris, B.; Chen, Y. Improving jujube fruit tree yield estimation at the field scale by assimilating a single landsat remotely-sensed LAI into the WOFOST model. Remote Sens. 2019, 11, 1119. [Google Scholar] [CrossRef] [Green Version]
  23. Gilbertson, J.K.; Van Niekerk, A. Value of dimensionality reduction for crop differentiation with multi- temporal imagery and machine learning. Comput. Electron. Agric. 2017, 142, 50–58. [Google Scholar] [CrossRef]
  24. Qader, S.H.; Dash, J.; Alegana, V.A.; Khwarahm, N.R.; Tatem, A.J.; Atkinson, P.M. The role of earth observation in achieving sustainable agricultural production in arid and semi-arid regions of the world. Remote Sens. 2021, 13, 3382. [Google Scholar] [CrossRef]
  25. Aguilar, R.; Zurita-Milla, R.; Izquierdo-Verdiguier, E.; de By, R.A. A Cloud-Based Multi-Temporal Ensemble Classifier to Map Smallholder Farming Systems. Remote Sens. 2018, 10, 729. [Google Scholar] [CrossRef] [Green Version]
  26. Hong-xia, L.U.O.; Sheng-pei, D.A.I.; Mao-fen, L.I.; En-ping, L.I.U.; Qian, Z.; Ying-ying, H.U. Comparison of machine learning algorithms for mapping mango plantations based on Gaofen-1 imagery. J. Integr. Agric. 2020, 19, 2815–2828. [Google Scholar] [CrossRef]
  27. Lebourgeois, V.; Dupuy, S.; Vintrou, É.; Ameline, M.; Butler, S.; Bégué, A. A Combined random forest and OBIA classification scheme for mapping smallholder agriculture at different nomenclature levels using multisource data (simulated Sentinel-2 time series, VHRS and DEM). Remote Sens. 2017, 9, 259. [Google Scholar] [CrossRef] [Green Version]
  28. Veloso, A.; Mermoz, S.; Bouvet, A.; Le Toan, T.; Planells, M.; Dejoux, J.-F.; Ceschia, E. Understanding the temporal behavior of crops using Sentinel-1 and Sentinel-2-like data for agricultural applications. Remote Sens. Environ. 2017, 199, 415–426. [Google Scholar] [CrossRef]
  29. Rao, P.; Zhou, W.; Bhattarai, N.; Srivastava, A.; Singh, B.; Poonia, S.; Lobell, D.; Jain, M. Using Sentinel-1, Sentinel-2, and planet imagery to map crop type of smallholder farms. Remote Sens. 2021, 13, 1870. [Google Scholar] [CrossRef]
  30. Neigh, C.S.; Carroll, M.L.; Wooten, M.R.; McCarty, J.L.; Powell, B.F.; Husak, G.J.; Enenkel, M.; Hain, C.R. Smallholder crop area mapped with wall-to-wall WorldView sub-meter panchromatic image texture: A test case for Tigray, Ethiopia. Remote Sens. Environ. 2018, 212, 8–20. [Google Scholar] [CrossRef]
  31. Zheng, B.; Myint, S.W.; Thenkabail, P.S.; Aggarwal, R.M. A support vector machine to identify irrigated crop types using time-series Landsat NDVI data. Int. J. Appl. Earth Obs. Geoinf. 2015, 34, 03–112. [Google Scholar] [CrossRef]
  32. Chemura, A.; van Duren, I.; van Leeuwen, L.M. Determination of the age of oil palm from crown projection area detected from WorldView-2 multispectral remote sensing data: The case of Ejisu-Juaben district, Ghana. ISPRS J. Photogramm. Remote Sens. 2015, 100, 118–127. [Google Scholar] [CrossRef]
  33. Torbick, N.; Chowdhury, D.; Salas, W.; Qi, J. Monitoring rice agriculture across myanmar using time series Sentinel-1 assisted by Landsat-8 and PALSAR-2. Remote Sens. 2017, 9, 119. [Google Scholar] [CrossRef] [Green Version]
  34. Steinhausen, M.J.; Wagner, P.; Narasimhan, B.; Waske, B. Combining Sentinel-1 and Sentinel-2 data for improved land use and land cover mapping of monsoon regions. Int. J. Appl. Earth Obs. Geoinf. 2018, 73, 595–604. [Google Scholar] [CrossRef]
  35. Yang, H.; Pan, B.; Li, N.; Wang, W.; Zhang, J.; Zhang, X. A systematic method for spatio-temporal phenology estimation of paddy rice using time series Sentinel-1 images. Remote Sens. Environ. 2021, 259, 112394. [Google Scholar] [CrossRef]
  36. Faye, G.; Mbengue, F.; Coulibaly, L.; Sarr, M.A.; Mbaye, M.; Tall, A.; Tine, D.; Marigo, O.; Ndour, M.M.M. Complementarity of Sentinel-1 and Sentinel-2 data for mapping agricultural areas in Senegal. Adv. Remote Sens. 2020, 9, 101–115. [Google Scholar] [CrossRef]
  37. Moumni, A.; Lahrouni, A. Machine learning-based classification for crop-type mapping using the fusion of high-resolution satellite imagery in a semiarid area. Scientifica 2021, 2021, 8810279. [Google Scholar] [CrossRef]
  38. Ren, T.; Xu, H.; Cai, X.; Yu, S.; Qi, J. Smallholder crop type mapping and rotation monitoring in mountainous areas with Sentinel-1/2 imagery. Remote Sens. 2022, 14, 566. [Google Scholar] [CrossRef]
  39. Cai, Y.; Lin, H.; Zhang, M. Mapping paddy rice by the object-based random forest method using time series Sentinel-1/Sentinel-2 data. Adv. Space Res. 2019, 64, 2233–2244. [Google Scholar] [CrossRef]
  40. Orynbaikyzy, A.; Gessner, U.; Conrad, C. Crop type classification using a combination of optical and radar remote sensing data: A review. Int. J. Remote Sens. 2019, 40, 6553–6595. [Google Scholar] [CrossRef]
  41. Wardlow, B.D.; Egbert, S.L.; Kastens, J.H. Analysis of time-series MODIS 250 m vegetation index data for crop classification in the U.S. Central Great Plains. Remote Sens. Environ. 2007, 108, 290–310. [Google Scholar] [CrossRef] [Green Version]
  42. Ni, R.; Tian, J.; Xiaojuan, L.; Yin, D.; Li, J.; Gong, H.; Zhang, J.; Zhu, L.; Wu, D. An enhanced pixel-based phenological feature for accurate paddy rice mapping with Sentinel-2 imagery in Google Earth Engine. ISPRS J. Photogramm. Remote Sens. 2021, 178, 282–296. [Google Scholar] [CrossRef]
  43. Van Tricht, K.; Gobin, A.; Gilliams, S.; Piccard, I. Synergistic use of radar Sentinel-1 and optical Sentinel-2 imagery for crop mapping: A Case study for Belgium. Remote Sens. 2018, 10, 1642. [Google Scholar] [CrossRef] [Green Version]
  44. Ni, R.; Tian, J.; Xiaojuan, L.; Yin, D.; Li, J.; Gong, H.; Zhang, J.; Zhu, L.; Wu, D. Mapping sugarcane plantation dynamics in Guangxi, China, by time series Sentinel-1, Sentinel-2 and Landsat images. Remote Sens. Environ. 2020, 247, 111951. [Google Scholar] [CrossRef]
  45. Blickensdörfer, L.; Schwieder, M.; Pflugmacher, D.; Nendel, C.; Erasmi, S.; Hostert, P. Mapping of crop types and crop sequences with combined time series of Sentinel-1, Sentinel-2 and Landsat 8 data for Germany. Remote Sens. Environ. 2022, 269, 112831. [Google Scholar] [CrossRef]
  46. Lakshmanan, G.; Mathiyazhagan, K. Machine learning classifiers on Sentinel-2 satellite image for the classification of banana (Musa Sp.) plantations of Theni district, Tamil Nadu, India. Machine learning classifiers on sentinel-2 satellite image for the classification of banana (Musa Sp.). Int. J. Chem. Stud. 2019, 7, 1419–1425. Available online: https://www.researchgate.net/publication/344769033 (accessed on 13 March 2021).
  47. Gené-Mola, J.; Gregorio, E.; Cheein, F.A.; Guevara, J.; Llorens, J.; Sanz-Cortiella, R.; Escolà, A.; Rosell-Polo, J.R. Fruit detection, yield prediction and canopy geometric characterization using LiDAR with forced air flow. Comput. Electron. Agric. 2020, 168, 105121. [Google Scholar] [CrossRef]
  48. Conrad, Y.; Zhong, X.; Hu, L.W.; Zhang, L. Remote Sensing of Environment A robust spectral-spatial approach to identifying heterogeneous crops using remote sensing imagery with high spectral and spatial resolutions. Remote Sens. Environ. 2019, 239, 111605. [Google Scholar] [CrossRef]
  49. Bargiel, D. A new method for crop classification combining time series of radar images and crop phenology information. Elsevier Inc. Remote Sens. Environ. 2017, 198, 369–383. [Google Scholar] [CrossRef]
  50. Ouzemou, J.-E.; El Harti, A.; Lhissou, R.; El Moujahid, A.; Bouch, N.; El Ouazzani, R.; Bachaoui, E.M.; El Ghmari, A. Crop type mapping from pansharpened Landsat 8 NDVI data: A case of a highly fragmented and intensive agricultural system. Remote Sens. Appl. Soc. Environ. 2018, 11, 94–103. [Google Scholar] [CrossRef]
  51. Saini, R.; Ghosh, S.K. Crop classification in a heterogeneous agricultural environment using ensemble classifiers and single-date Sentinel-2A imagery. Geocarto Int. 2021, 36, 2141–2159. [Google Scholar] [CrossRef]
  52. Prins, A.J.; Van Niekerk, A. Crop type mapping using LiDAR, Sentinel-2 and aerial imagery with machine learning algorithms. Geo-Spat. Inf. Sci. 2021, 24, 215–227. [Google Scholar] [CrossRef]
  53. Sarzynski, T.; Giam, X.; Carrasco, L.; Lee, J.S.H. Combining radar and optical imagery to map oil palm plantations in Sumatra, Indonesia, using the google earth engine. Remote Sens. 2020, 12, 1220. [Google Scholar] [CrossRef] [Green Version]
  54. Qadir, A.; Mondal, P. Synergistic Use of Radar and Optical Satellite Data for Improved Monsoon Cropland Mapping in India. Remote Sens. 2020, 12, 522. [Google Scholar] [CrossRef] [Green Version]
  55. Kraaijvanger, R.; Singh, V.; Ajay, N.P.; Apurva, D.; Jaydipsinh, K.; Jignesh, S.K. Exploring the Potential of Mapping Cropping Patterns on Smallholder Scale Croplands Using Sentinel-1 SAR Data. Remote Sens. 2019, 11, 1–18. [Google Scholar] [CrossRef]
  56. VDM, “Vhembe District Municipality 2020 / 21 Idp Review. 2020. Available online: http://www.vhembe.gov.za (accessed on 16 December 2021).
  57. Berger, M.; Moreno, J.; Johannessen, J.A.; Levelt, P.F.; Hanssen, R.F. ESA’s sentinel missions in support of Earth system science. Remote Sens. Environ. 2012, 120, 84–90. [Google Scholar] [CrossRef]
  58. ESA. ESA’s Optical High-Resolution Mission for GMES Operational Services; ESA: Paris, France, 2015. [Google Scholar]
  59. Clevers, J.G.P.W.; Gitelson, A.A. Remote estimation of crop and grass chlorophyll and nitrogen content using red-edge bands on Sentinel-2 and -3. Int. J. Appl. Earth Observ. Geoinf. 2013, 23, 344–351. [Google Scholar] [CrossRef]
  60. Louis, J.; Debaecker, V.; Pflug, B.; Main-Knorn, M.; Bieniarz, J.; Mueller-Wilm, U.; Cadau, E.; Gascon, F. Sentinel-2 SEN2COR: L2A processor for users. In Proceedings of the Living Planet Symposium, Prague, Czech Republic, 9–13 May 2016; pp. 9–13. [Google Scholar]
  61. Haas, J.; Ban, Y. Sentinel-1A SAR and sentinel-2A MSI data fusion for urban ecosystem service mapping. Remote Sens. Appl. Soc. Environ. 2017, 8, 41–53. [Google Scholar] [CrossRef]
  62. Vreugdenhil, M.; Wagner, W.; Bauer-Marschallinger, B.; Pfeil, I.; Teubner, I.; Rüdiger, C.; Strauss, P. Sensitivity of Sentinel-1 backscatter to vegetation dynamics: An Austrian case study. Remote Sens. 2018, 10, 1396. [Google Scholar] [CrossRef] [Green Version]
  63. Zhang, M.; Wu, B.; Yu, M.; Zou, W.; Zheng, Y. Crop condition assessment with adjusted NDVI using the uncropped arable land ratio. Remote Sens. 2014, 6, 5774–5794. [Google Scholar] [CrossRef] [Green Version]
  64. Abubakar, G.A.; Wang, K.; Shahtahamssebi, A.; Xue, X.; Belete, M.; Gudo, A.J.A.; Shuka, K.A.M.; Gan, M. Mapping maize fields by using multi-temporal Sentinel-1A and Sentinel-2A images in Makarfi, Northern Nigeria, Africa. Sustainability 2020, 12, 2539. [Google Scholar] [CrossRef] [Green Version]
  65. Waldner, F.; Bellemans, N.; Hochman, Z.; Newby, T.; de Abelleyra, D.; Verón, S.R.; Bartalev, S.; Lavreniuk, M.; Kussul, N.; Le Maire, G.; et al. Roadside collection of training data for cropland mapping is viable when environmental and management gradients are surveyed. Int. J. Appl. Earth Obs. Geoinf. 2019, 80, 82–93. [Google Scholar] [CrossRef]
  66. Fowler, J.; Waldner, F.; Hochman, Z. All pixels are useful, but some are more useful: Efficient in situ data collection for crop-type mapping using sequential exploration methods. Int. J. Appl. Earth Obs. Geoinf. 2020, 91, 102114. [Google Scholar] [CrossRef]
  67. Ahmed, N.; Atzberger, C.; Zewdie, W. Species Distribution Modelling performance and its implication for Sentinel-2-based prediction of invasive Prosopis juliflora in lower Awash River basin, Ethiopia. Ecol. Process. 2021, 10, 1–16. [Google Scholar] [CrossRef]
  68. Abdulhafedh, A.A. Novel hybrid method for measuring the spatial autocorrelation of vehicular crashes: Combining Moran’s Index and Getis-Ord Gi* statistic. Open J. Civ. Eng. 2017, 7, 208–221. [Google Scholar] [CrossRef] [Green Version]
  69. Hansch, R.; Ley, A.; Hellwich, O. Correct and still wrong: The relationship between sampling strategies and the estimation of the generalization error. In Proceedings of the 2017 IEEE International Geoscience and Remote Sensing Symposium (IGARSS), Fort Worth, TX, USA, 23–28 July 2017; pp. 3672–3675. [Google Scholar]
  70. Kuhn, M. Futility Analysis in the Cross-Validation of Machine Learning Models. arXiv 2014, arXiv:1405.6974. [Google Scholar]
  71. Feyisa, G.L.; Palao, L.K.; Nelson, A.; Gumma, M.K.; Paliwal, A.; Win, K.T.; Nge, K.H.; Johnson, D.E. Characterizing and mapping cropping patterns in a complex agro-ecosystem: An iterative participatory mapping procedure using machine learning algorithms and MODIS vegetation indices. Comput. Electron. Agric. 2020, 175, 105595. [Google Scholar] [CrossRef]
  72. Breiman, L. Random forests. Mach. Learn 2001, 45, 5–32. [Google Scholar] [CrossRef] [Green Version]
  73. Tatsumi, K.; Yamashiki, Y.; Torres, M.A.C.; Taipe, C.L.R. Crop classification of upland fields using Random forest of time-series Landsat 7 ETM+ data. Comput. Electron. Agric. 2015, 115, 171–179. [Google Scholar] [CrossRef]
  74. Zhang, H.; Kang, J.; Xu, X.; Zhang, L. Accessing the temporal and spectral features in crop type mapping using multi-temporal Sentinel-2 imagery: A case study of Yi’an County, Heilongjiang province, China. Comput. Electron. Agric. 2020, 176, 105618. [Google Scholar] [CrossRef]
  75. Abdullah, A.Y.M.; Masrur, A.; Gani Adnan, M.S.; Baky, M.; Al, A.; Hassan, Q.K.; Dewan, A. Spatio-temporal patterns of land use/land cover change in the heterogeneous coastal region of Bangladesh between 1990 and 2017. Remote Sens. 2019, 11, 790. [Google Scholar] [CrossRef] [Green Version]
  76. Mashaba-Munghemezulu, Z.; Chirima, G.; Munghemezulu, C. Mapping smallholder maise farms using multi-temporal Sentinel-1 data in support of the sustainable development goals. Remote Sens. 2021, 13, 1666. [Google Scholar] [CrossRef]
  77. Genuer, R.; Poggi, J.-M.; Tuleau-Malot, C. VSURF: An R package for variable selection using random forests. R J. 2015, 7, 19–33. [Google Scholar] [CrossRef] [Green Version]
  78. Richard, K.; Abdel-Rahman, E.M.; Subramanian, S.; Nyasani, J.O.; Thiel, M.; Jozani, H.; Borgemeister, C.; Landmann, T. Maize cropping systems mapping using rapideye observations in agro-ecological landscapes in Kenya. Sensors 2017, 17, 2537. [Google Scholar] [CrossRef] [Green Version]
  79. Yu, Y.; Li, M.; Fu, Y. Forest type identification by random forest classification combined with SPOT and multitemporal SAR data. J. For. Res. 2018, 29, 1407–1414. [Google Scholar] [CrossRef]
  80. Zhao, W.; Qu, Y.; Chen, J.; Yuan, Z. Deeply synergistic optical and SAR time series for crop dynamic monitoring. Remote Sens. Environ. 2020, 247, 111952. [Google Scholar] [CrossRef]
  81. Cui, J.; Zhang, X.; Wang, W.; Wang, L. Integration of optical and SAR remote sensing images for crop-type mapping based on a novel object-oriented feature selection method. Int. J. Agric. Biol. Eng. 2020, 13, 178–190. [Google Scholar] [CrossRef]
  82. Chan, J.C.-W.; Paelinckx, D. Evaluation of random forest and Adaboost tree-based ensemble classification and spectral band selection for ecotope mapping using airborne hyperspectral imagery. Remote Sens. Environ. 2008, 112, 2999–3011. [Google Scholar] [CrossRef]
  83. Vuolo, F.; Neuwirth, M.; Immitzer, M.; Atzberger, C.; Ng, W.-T. How much does multi-temporal Sentinel-2 data improve crop type classification? Int. J. Appl. Earth Obs. Geoinf. 2018, 72, 122–130. [Google Scholar] [CrossRef]
  84. Schmidt, M.; Pringle, M.; Devadas, R.; Denham, R.; Tindall, D. A framework for large-area mapping of past and present cropping activity using seasonal landsat images and time series metrics. Remote Sens. 2016, 8, 312. [Google Scholar] [CrossRef] [Green Version]
  85. Zhang, P.; Hu, S.; Li, W.; Zhang, C. Parcel-level mapping of crops in a smallholder agricultural area: A case of central China using single-temporal VHSR imagery. Comput. Electron. Agric. 2020, 175, 105581. [Google Scholar] [CrossRef]
  86. Zhao, K.; Valle, D.; Popescu, S.; Zhang, X.; Mallick, B. Hyperspectral remote sensing of plant biochemistry using Bayesian model averaging with variable and band selection. Remote Sens. Environ. 2013, 132, 102–119. [Google Scholar] [CrossRef]
  87. Adam, E.M.; Mutanga, O.; Rugege, D.; Ismail, R. Discriminating the papyrus vegetation (Cyperus papyrus L.) and its co-existent species using random forest and hyperspectral data resampled to HYMAP. Int. J. Remote Sens. 2012, 33, 552–569. [Google Scholar] [CrossRef]
  88. Hu, Q.; Wu, W.-B.; Song, Q.; Lu, M.; Chen, D.; Yu, Q.; Tang, H.-J. How do temporal and spectral features matter in crop classification in Heilongjiang Province, China? J. Integr. Agric. 2017, 16, 324–336. [Google Scholar] [CrossRef]
  89. Loggenberg, K.; Strever, A.; Greyling, B.; Poona, N. Modelling water stress in a shiraz vineyard using hyperspectral imaging and machine learning. Remote Sens. 2018, 10, 202. [Google Scholar] [CrossRef] [Green Version]
  90. Morin, D.; Planells, M.; Guyon, D.; Villard, L.; Mermoz, S.; Bouvet, A.; Thevenon, H.; Dejoux, J.-F.; Le Toan, T.; Dedieu, G. Estimation and mapping of forest structure parameters from open access satellite images: Development of a generic method with a study case on coniferous plantation. Remote Sens. 2019, 11, 1275. [Google Scholar] [CrossRef] [Green Version]
  91. Wang, Q.; Zhang, J. A data transfer fusion method for discriminating similar spectral classes. Sensors 2016, 16, 1895. [Google Scholar] [CrossRef] [Green Version]
  92. Vapnik, N.V. The Nature of Statistical Learning Theory; Springer: New York, NY, USA, 1995; p. 334. Available online: https://ci.nii.ac.jp/naid/10020951890 (accessed on 18 November 2021).
  93. Vapnik, V.N. The Nature of Statistical Learning Theory, 2nd ed.; Springer: New York, NY, USA, 2000. [Google Scholar]
  94. Zhang, S.; Guo, J.; Luo, N.; Wang, L.; Wang, W.; Wen, K. Improving Wi-Fi fingerprint positioning with a pose recognition-assisted SVM algorithm. Remote Sens. 2019, 11, 652. [Google Scholar] [CrossRef] [Green Version]
  95. Wang, M.; Liu, Z.; Ali Baig, M.H.; Wang, Y.; Li, Y.; Chen, Y. Mapping sugarcane in complex landscapes by integrating multi-temporal Sentinel-2 images and machine learning algorithms. Land Use Policy. 2019, 88, 104190. [Google Scholar] [CrossRef]
  96. Kranjčić, N.; Medak, D.; Župan, R.; Rezo, M. Support vector machine accuracy assessment for extracting green urban areas in towns. Remote Sens. 2019, 11, 655. [Google Scholar] [CrossRef] [Green Version]
  97. Vluymans, S. Learning from imbalanced data. IEEE Stud. Comput. Intell. 2019, 807, 81–110. [Google Scholar] [CrossRef]
  98. Maldonado, W.; Barbosa, J.C. Automatic green fruit counting in orange trees using digital images. Comput. Electron. Agric. 2016, 127, 572–581. [Google Scholar] [CrossRef] [Green Version]
  99. Olofsson, P.; Foody, G.M.; Herold, M.; Stehman, S.V.; Woodcock, C.E.; Wulder, M.A. Good practices for estimating area and assessing accuracy of land change. Remote Sens. Environ. 2014, 148, 42–57. [Google Scholar] [CrossRef]
  100. Gómez, C.; White, J.C.; Wulder, M.A. Optical remotely sensed time series data for land cover classification: A review. ISPRS J. Photogramm. Remote Sens. 2016, 116, 55–72. [Google Scholar] [CrossRef] [Green Version]
  101. Taghizadeh-Mehrjardi, R.; Schmidt, K.; Eftekhari, K.; Behrens, T.; Jamshidi, M.; Davatgar, N.; Toomanian, N.; Scholten, T. Synthetic resampling strategies and machine learning for digital soil mapping in Iran. Eur. J. Soil Sci. 2020, 71, 352–368. [Google Scholar] [CrossRef]
  102. Mandanici, E.; Bitelli, G. Preliminary comparison of Sentinel-2 and Landsat 8 imagery for a combined use. Remote Sens. 2016, 8, 1014. [Google Scholar] [CrossRef] [Green Version]
  103. Zeyada, H.H.; Ezz, M.; Nasr, A.; Shokr, M.; Harb, H.M. Evaluation of the discrimination capability of full polarimetric SAR data for crop classification. Int. J. Remote Sens. 2016, 37, 2585–2603. [Google Scholar] [CrossRef]
  104. Conrad, C.; Dech, S.; Dubovyk, O.; Fritsch, S.; Klein, D.; Löw, F.; Schorcht, G.; Zeidler, J. Derivation of temporal windows for accurate crop discrimination in heterogeneous croplands of Uzbekistan using multitemporal RapidEye images. Comput. Electron. Agric. 2014, 103, 63–74. [Google Scholar] [CrossRef]
  105. Preidl, S.; Lange, M.; Doktor, D. Introducing APiC for regionalised land cover mapping on the national scale using Sentinel-2A imagery. Remote Sens. Environ. 2020, 240, 111673. [Google Scholar] [CrossRef]
  106. Sun, L.; Chen, J.; Han, Y. Joint use of time series Sentinel-1 and Sentinel-2 imagery for cotton field mapping in heterogeneous cultivated areas of Xinjiang, China. In Proceedings of the 2019 8th International Conference on Agro-Geoinformatics (Agro-Geoinformatics), Istanbul, Turkey, 16–19 July 2019; pp. 1–4. [Google Scholar] [CrossRef]
  107. Heckel, K.; Urban, M.; Schratz, P.; Mahecha, M.D.; Schmullius, C. Predicting forest cover in distinct ecosystems: The potential of multi-source Sentinel-1 and -2 data fusion. Remote Sens. 2020, 12, 302. [Google Scholar] [CrossRef] [Green Version]
  108. Clerici, N.; Calderón, C.A.V.; Posada, J.M. Fusion of Sentinel-1A and Sentinel-2A data for land cover mapping: A case study in the lower Magdalena region, Colombia. J. Maps 2017, 13, 718–726. [Google Scholar] [CrossRef] [Green Version]
  109. Mercier, A.; Betbeder, J.; Baudry, J.; Le Roux, V.; Spicher, F.; Lacoux, J.; Roger, D.; Hubert-Moy, L. Evaluation of Sentinel-1 & 2 time series for predicting wheat and rapeseed phenological stages. ISPRS J. Photogramm. Remote Sens. 2020, 163, 231–256. [Google Scholar] [CrossRef]
  110. Tavares, P.A.; Beltrão, N.E.S.; Guimarães, U.S.; Teodoro, A.C. Integration of Sentinel-1 and Sentinel-2 for classification and LULC mapping in the urban area of Belém, eastern Brazilian Amazon. Sensors 2019, 19, 1140. [Google Scholar] [CrossRef] [PubMed] [Green Version]
  111. Akbari, E.; Boloorani, A.D.; Samany, N.N.; Hamzeh, S.; Soufizadeh, S.; Pignatti, S. Crop mapping using random forest and particle swarm optimisation based on multi-temporal Sentinel-2. Remote Sens. 2020, 12, 1449. [Google Scholar] [CrossRef]
  112. Talema, T.; Hailu, B.T. Mapping rice crop using sentinels (1 SAR and 2 MSI) images in tropical area: A case study in Fogera wereda, Ethiopia. Remote Sens. Appl. Soc. Environ. 2020, 18, 100290. [Google Scholar] [CrossRef]
  113. Punalekar, S.; Verhoef, A.; Quaife, T.; Humphries, D.; Bermingham, L.; Reynolds, C. Application of Sentinel-2A data for pasture biomass monitoring using a physically based radiative transfer model. Remote Sens. Environ. 2018, 218, 207–220. [Google Scholar] [CrossRef]
  114. Muro, J.; Canty, M.; Conradsen, K.; Hüttich, C.; Nielsen, A.A.; Skriver, H.; Remy, F.; Strauch, A.; Thonfeld, F.; Menz, G. Short-term change detection in wetlands using Sentinel-1 time series. Remote Sens. 2016, 8, 795. [Google Scholar] [CrossRef] [Green Version]
  115. Kyere, I.; Astor, T.; Graß, R.; Wachendorf, M. Agricultural crop discrimination in a heterogeneous low-mountain range region based on multi-temporal and multi-sensor satellite data. Comput. Electron. Agric. 2020, 179, 105864. [Google Scholar] [CrossRef]
Figure 1. Flowchart of the methodology implemented for mapping fruit trees and co-existing land-use types in Levubu, Limpopo, South Africa.
Remotesensing 14 02621 g001
Figure 2. Map of South African provinces showing the location of Levubu sub-tropical farming area in Sentinel-2 RGB image located in Makhado Local Municipality.
Remotesensing 14 02621 g002
Figure 3. Average spectral reflectance profiles extracted from Sentinel-2 data on fruit-tree crops and co-existing land-use types, reference data, and field photos. The mapped classes are avocado (AV), banana (BN), bare soil (BS), guava (GV), macadamia nut (MN), mango (MG), pine tree (PT), built-up (BU), water body (WB), and woody vegetation (WV).
Remotesensing 14 02621 g003aRemotesensing 14 02621 g003bRemotesensing 14 02621 g003c
Figure 4. The variable importance in the RF classification model indicates the mean decrease accuracy (MDA) for (a) selected variable models. A high MDA importance indicates that the predictor variable plays a crucial role in the classification. (b) shows the mean decrease accuracy (MDA), indicating the relationship between S1S2 spectral bands and classes.
Remotesensing 14 02621 g004
Figure 5. Identification of the optimal variables based on RF MDA rankings produced using the forward variable selection (FVS). The arrow indicates the set of variables that have the lowest error rate.
Remotesensing 14 02621 g005
Figure 6. Mapping fruit-tree crops and other existing land use types based on Sentinel-1 data ((A): RF, (B): SVM), Sentinel-2 ((C): RF, (D): SVM), Sentinel-2 selected variables ((E): RF, (F): SVM), Sentinel-1 and Sentinel-2 ((G): RF, (H): SVM), and Sentinel-1 and Sentinel-2 selected variables ((I): RF, (J): SVM).
Remotesensing 14 02621 g006
Figure 7. The spatial distribution of fruit-tree crops and co-existing land use types for Levubu subtropical farming area using S1S2 selected variables and SVM, (B). (A) and zoom-in in (1) show the unclassified Sentinel-2 RGB image, including the collected ground truth data, respectively. (26) show the classified zoom-ins of the same area using different models. In order of merit, these are S1S2 selected variables, S1S2, S2, S2 selected variables and S1.
Remotesensing 14 02621 g007
Figure 8. The overall accuracy (OA) obtained by RF (blue) and SVM (orange) classifiers using Sentinel-1, Sentinel-2, Sentinel-2 selected variables, S1S2 fusion, and S1S2 selected variables in mapping tree crop species and other existing land uses.
Remotesensing 14 02621 g008
Table 1. Spectral configurations for Sentinel-1 and sentinel-2 data.
Sentinel 2 MSI Sentinel-1 SARWavelength
Band NameCentreWidthResolution(m)NameCentre
2Blue4906510VH polarizationC-band
3Green5603510VV polarizationC-band
4Red6653010
5Red edge7051520
6Red edge7401520
7Red edge7832020
8NIR84211510
8aNarrow NIR8652020
11SWIR16103020
12SWIR219018020
Table 2. Confusion matrices for the models that produced the models that produced the highest overall accuracy using RF and SVM algorithms. The mapped classes are avocado (AV), banana (BN), bare soil (BS), guava (GV), macadamia nut (MN), mango (MG), pine tree (PT), built-up (BU), water body (WB), and woody vegetation (WV).
(A) RF-S1
ClassAVBNBSGVMNMGPTSTWBWVTotal
AV421222120218
BN253223010119
BS114211211115
GV213412100014
MN483442221131
MG210224110013
PT100212810015
BU221002140113
WB1000000212015
WV2210011121323
Total21221618131917151619176
OA: 29.84%
kappa: 0.23%
(B) SVM = S2
ClassAVBNBSGVMNMGPTSTWBWVTotal
AV1600011000018
BN0160011000119
BS0014100000015
GV1101101000014
MN0110281000031
MG0001111000013
PT0100101300015
BU2011000100013
WB1000100013015
WV0100000002223
Total20201614331513101323176
OA: 87%
kappa: 86.89%
(C) RF-S2 SELECTED
ClassAVBNBSGVMNMGPTSTWBWVTotal
AV1500111000018
BN0160011000119
BS0012211000015
GV010751000014
MN0224185000031
MG010047100013
PT010021910015
BU200001190013
WB0000000312015
WV0101040001723
Total17221415322211131218176
OA = 69.33%
Kappa = 69%
(D) SVM-S1S2
ClassAVBNBSGVMNMGPTSTWBWVTotal
AV1600011000018
BN0170001000119
BS0013011000015
GV1101101000014
MN0011281000031
MG0002110000013
PT0100111200015
BU1000000120013
WB1000100013015
WV0100000002223
Total19201414331612121323176
OA = 87.01%
Kappa = 0.87
(E) SVM-S1S2 SELECTED
ClassAVBNBSGVMNMGPTSTWBWVTotal
AV1700001000018
BN0170001000119
BS0013011000015
GV1101101000014
MN0001291000031
MG0000112000013
PT0100101300015
BU1000000120013
WB0000000015015
WV0100000002223
Total19201312321713121523176
OA = 91.63%
Kappa = 0.91%
Table 3. The performance of RF and SVM over four datasets (S1, S2, S2 selected variables, S1S2, S1S2 selected variables importance (VI) in terms of user’s and producer’s accuracies in percentages (%). The mapped classes are avocado (AV), banana (BN), bare soil (BS), guava (GV), macadamia nut (MN), mango (MG), pine tree (PT), built-up (BU), water body (WB), and woody vegetation (WV).
(a) RF User’s Accuracy (%) (b) RF Producer’s accuracy (%)
Class S1 S2 S2 VI S1S2 S1S2 VI S1 S2 S2 VI S1S2 S1S2 VI
AV18.5787.3244.1671.0893.7519.1277.5049.2873.7575.00
BN40.0075.7162.578.7588.0628.5776.8167.9091.3085.51
BS18.1884.4882.3589.0990.7417.3989.0991.3089.0989.06
GV19.0580.0060.8786.5979.7924.0081.9366.6784.5290.36
MN15.2875.5850.0074.6785.9116.9279.2745.8368.2986.84
MG23.7374.1980.0065.9666.6729.1747.9261.5464.5875.56
PT27.6992.0650.0096.7293.7535.2995.0884.3196.7298.36
BU34.8879.2282.1493.3390.6327.7889.7182.1482.3586.57
WB93.8898.1196.0091.5396.3086.7995.6396.00100.0096.30
WV100.0099.06100.00100.00100.0017.6593.15100.0087.6794.52
(a) SVM User’s accuracy (%) (b) SVM Producer’s accuracy (%)
ClassS1S2S2 VIS1S2S1S2 VIS1S2S2 VIS1S2S1S2 VI
AV17.7438.7144.8783.7594.6732.3539.7150.7283.7594.67
BN38.9667.6564.7185.1488.7338.9659.7467.9091.3088.33
BS23.0884.9187.7694.6494.5513.0496.5393.4893.3690.00
GV23.8950.6784.3193.687.7850.0076.0076.7991.6796.3
MN14.5852.6355.1072.9494.5911.4845.4564.2975.6195.18
MG0.0057.5852.0080.0085.110.0039.5854.1766.6792.11
PT20.8385.1174.0795.0893.0029.4178.4376.7995.0888.89
BU29.0974.2491.1193.8595.0015.6990.7480.3989.7198.36
WB34.61100.0094.1294.7497.3634.9197.2688.8994.5285.07
WV0.00100.00100.00100.00100.000.0079.3374.07100.0098.63
Publisher’s Note: MDPI stays neutral with regard to jurisdictional claims in published maps and institutional affiliations.

