1. Introduction
In recent years, secondary metabolites obtained from marine-derived fungi have gained considerable attention, as many of them are structurally unique and possess interesting biological properties [
1]. Their structures have been successfully elucidated mainly by modern NMR techniques, and determination of the stereochemical relationships within every new molecule is generally one of the crucial points in structural determination. The configuration elucidation of natural products is of premiere importance because it provides essential information for both total synthesis and molecular mode of actions [
2]. For example, quinine, originally isolated from the bark of cinchona trees, has been used for the treatment of malaria for centuries [
3]. Quinidine, a stereoisomer of quinine, on the other hand, is used as a class Ι antiarrthythmic agent by prolonging the cardiac action potential [
4].
Penicilliumin A is a novel quinone-linked drimane sesquiterpene [
5,
6] produced by
Penicillium sp. F00120 isolated from deep sea sediment sample [
7], the absolute configuration of which has not been assigned yet. Our recent investigation on the secondary metabolites of
Myrothecium sp. SC0265 led to the isolation of two new meroterpenoids, named myrothecols G (
1) and H (
2), which are structurally related to penicilliumin A (
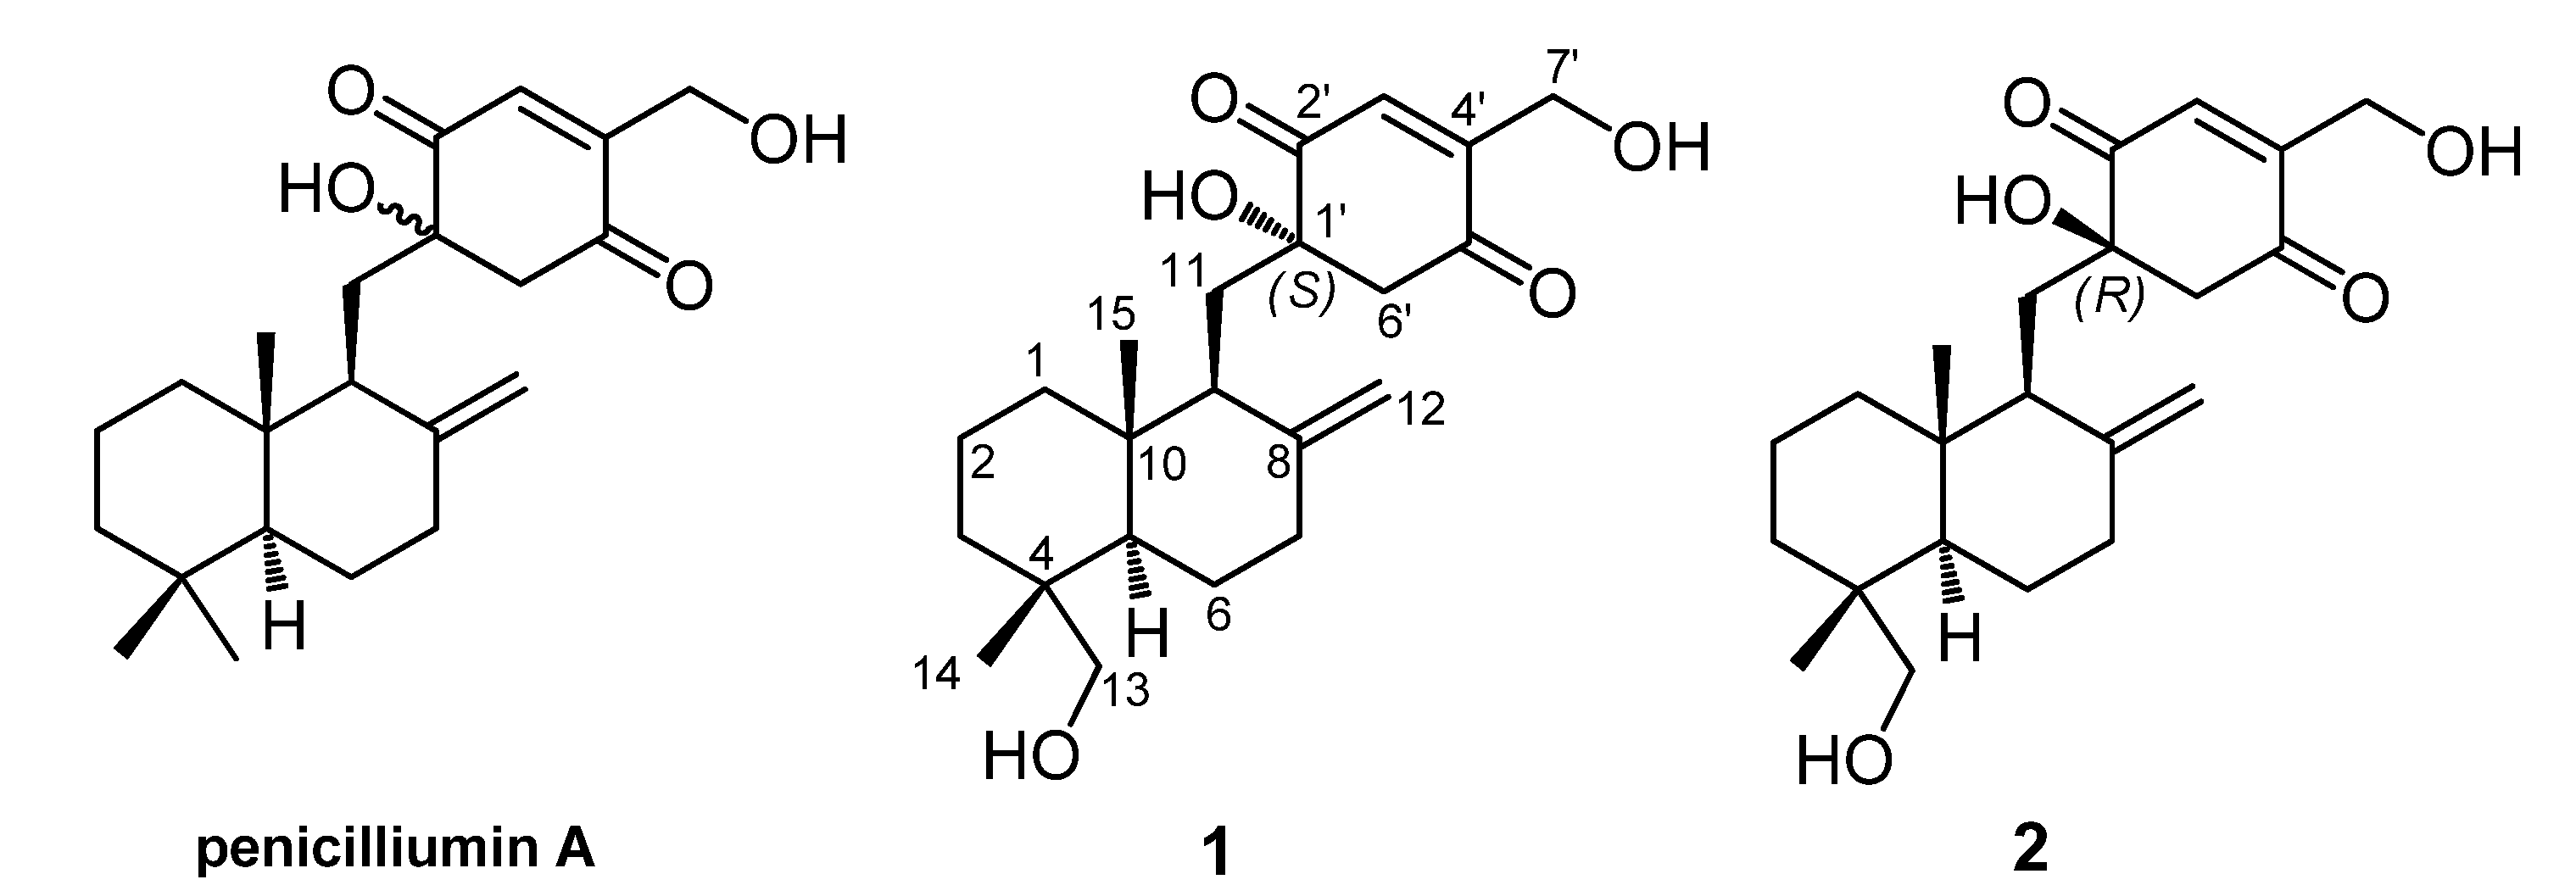
Figure 1). Herein, we presented the stereochemical assignment of the two new compounds by the detailed analysis of their spectroscopic data, especially 2D NMR spectra, combining with the theoretical conformational analysis.
Figure 1.
Penicilliumin A and two analogues (1 and 2) from Myrothecium sp. SC0265.
Figure 1.
Penicilliumin A and two analogues (1 and 2) from Myrothecium sp. SC0265.
2. Results and Discussion
Our previous investigation on the secondary metabolites of
Myrothecium sp. SC0265 led to the isolation of a series of myrothecols, displayed potent cytotoxic and antibacterial activities [
8]. This motivated us to search for minor components, and reinvestigation of this fungus yielded two new penicilliumin A analogues (
1 and
2) via an NMR-guided fractionation process.
Compound
1 was obtained as yellow viscous oil and its HRESIMS spectrum showed a peak at
m/
z 399.2145 [M + Na]
+ (calcd for C
22H
32NaO
5, 399.2142) corresponding to the molecular formula C
22H
32O
5 (seven unsaturations).
1H and
13C NMR spectra in combination with the HSQC analysis (
Table 1) revealed the presence of two methyl groups, nine sp
3 methylenes (two were oxygen-bearing), two sp
3 methines, three sp
3 quaternary carbons (one was oxygen-bearing), four olefinic carbons (one was terminally double-protonated) and two carbonyl carbons. In the
1H–
1H COSY spectrum (
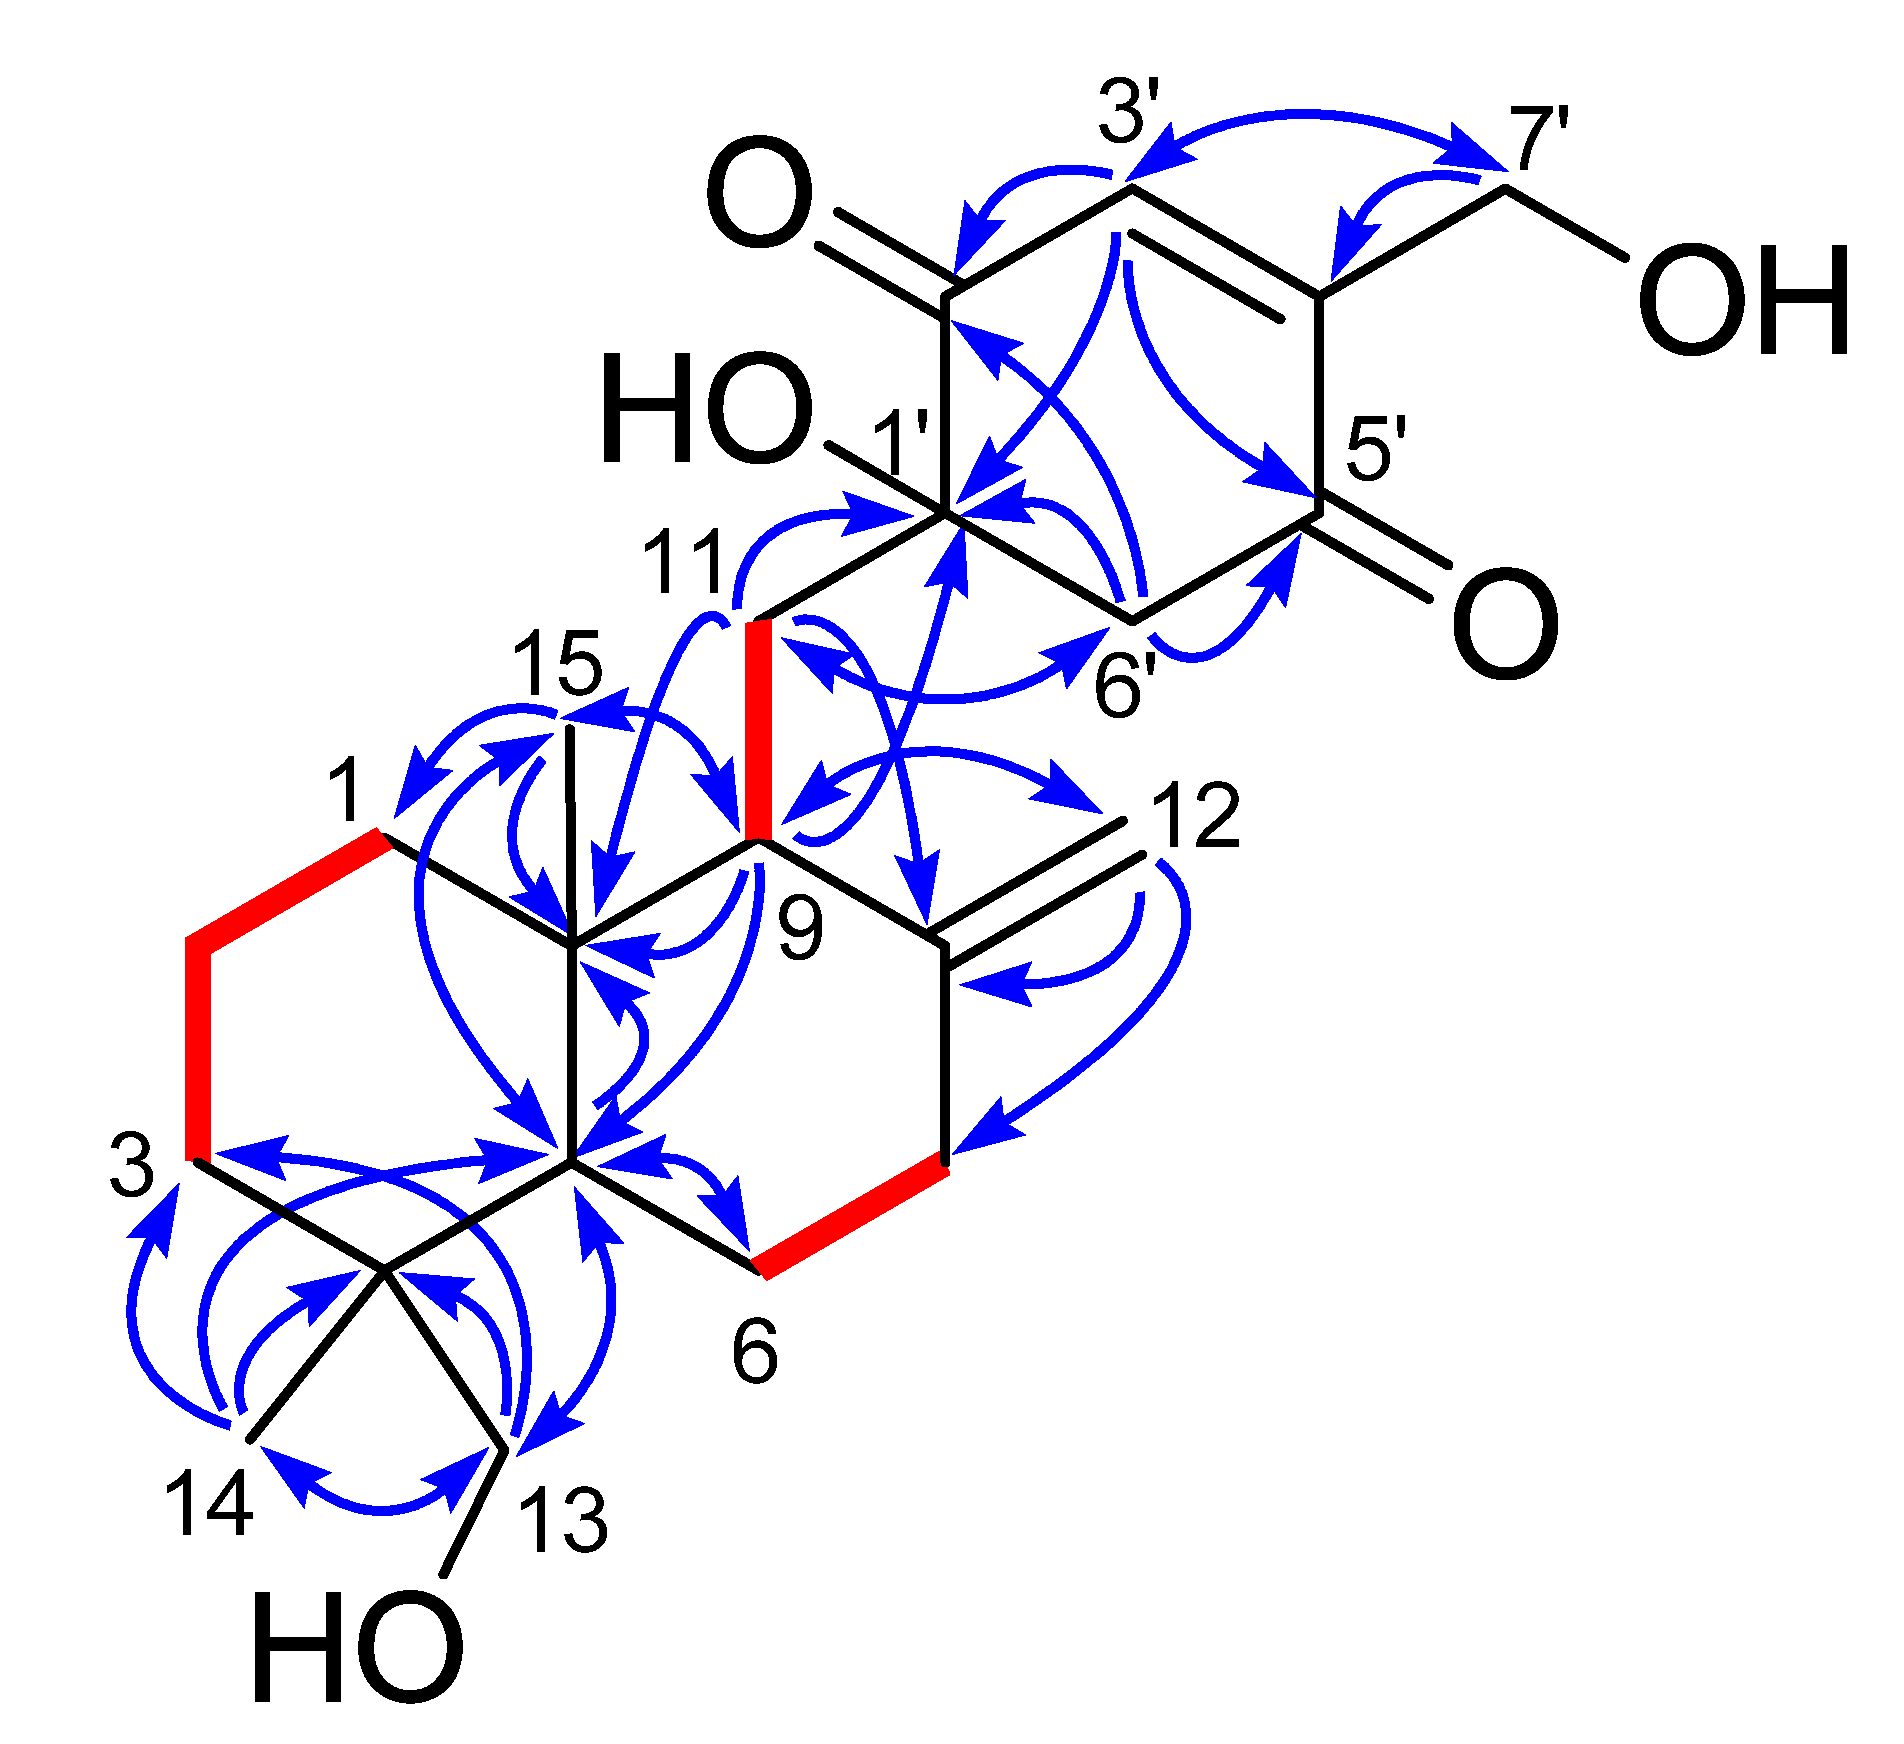
Figure 2), three spin systems were confirmed: from C-1 to C-3; from C-5 to C-7; and from C-9 to C-11, as shown in
Figure 2. The remaining degrees of unsaturation except two carbonyl groups and two olefinic bonds revealed the presence of three rings in 1. Only twenty-nine hydrogens directly connected to the carbon atoms in the HSQC spectrum indicated the existence of three hydroxyl groups, corresponding to the three oxygenated groups. HMBC correlations (
Figure 2) from H
3-14 to C-3, C-4, C-5 and C-13, and from H
2-13 to C-3, C-4, C-5 and C-14, and from H-5 to C-10 and C-15, and H
3-15 to C-1, C-5 and C-10 established a cyclohexane ring with a methyl group (Me-14) and an oxygenated methylene (δ
C 71.6, CH
2OH-13) substituted at C-4, and a methyl group (Me-15) at C-10. Combining with the HMBC correlations from H-5 to C-6, and from H-9 to C-5, C-10 and C-15, and from H
2-11 to C-8 and C-10, and H
2-12 to C-7, C-8 and C-9, a drimane sesquiterpene skeleton was identified. A
p-quinone moiety with a hydroxyl group at C-1ʹ (δ
C 78.1) and an oxygenated methylene (δ
C 58.7, CH
2OH-7ʹ) at C-4ʹ, was established based on the HMBC correlations from H-3ʹ to C-1ʹ, C-5ʹ and C-7ʹ, and from H
2-6ʹ to C-1ʹ, C-2ʹ and C-5ʹ, and H
2-7ʹ to C-3ʹ and C-4ʹ. The
p-quinone moiety was attached to the sesquiterpene ring at C-11 on account of the HMBC correlations from H-9 to C-1ʹ, and from H
2-11 to C-1ʹ and C-6ʹ. These spectroscopic features indicated that
1 was a
p-quinone-linked drimane sesquiterpene (
Figure 1), similar to penicilliumin A, except for an additional hydroxyl group at C-13 in
1.
Figure 2.
1H–1H COSY (bold lines) and key HMBC correlations (arrows) of 1 and 2.
Figure 2.
1H–1H COSY (bold lines) and key HMBC correlations (arrows) of 1 and 2.
The other co-isolated quinone sesquiterpene, named myrothecol H (
2) had the same molecular formula (C
22H
32O
5) as
1, which was determined from HRESIMS data. Analysis of 1D NMR (
Table 1), HSQC,
1H–
1H COSY and HMBC spectra (
Figure 2) of
2 revealed that
2 and
1 had the same planar structure. The main difference between
1 and
2 was the inconsistent
13C NMR data of C-11 (δ
C 32.5 in
1; 35.5 in
2) and C-6′ (δ
C 51.8 in
1; 55.0 in
2), suggested that
2 and
1 were a pair of epimers differing at the stereochemistry of C-1′.
The assignment of the relative configurations of the drimane sesquiterpene units in
1 and
2 were straightforward because of the observation of NOE correlations (NOEs) of H-5/H-9, H-5/H-13a (α-orientation) and H
3-15/H-11a (β-orientation) in both of the NOESY spectra of
1 and
2. The absolute configurations of the units in both compounds could be assigned to be the same as those of previously obtained myrothecols from the same strain by comparison with their NMR data and the biosynthesis consideration [
8]. However, the sesquiterpene unit and the
p-quinone moiety in
1 and
2 were connected by two single bonds (C-9–C-11 and C-11–C-1′), and the two compounds should exist as an equilibrium of multiple rotamers of the two bonds. Thus, the assignment of the configurational relationship between the sesquiterpene unit and the
p-quinone moiety become a critical matter for the stereochemical assignment of the two compounds.
The NOEs of H-11a/H3-15, H-11b/H-1β, H-12a/H-7β and H-11a/H-12b observed in both of the NOESY spectra of 1 and 2, and the J9,11a value (7.3 Hz in 1, 8.6 Hz in 2) indicated that H-9 was nearly in an anti relationship with H-11a and in a gauche relationship with H-11b, thus C-9–C-11 bond was relatively fixed, and the flexibilities of 1 and 2 were mainly due to the rotation of C-11–C-1′ bond.
Table 1.
NMR data (600/150 MHz, pyridine-d5) of compounds 1 and 2.
Table 1.
NMR data (600/150 MHz, pyridine-d5) of compounds 1 and 2.
| 1 | 2 |
|---|
| Position | δC, type | δH, mult. (J in Hz) | δC, type | δH, mult. (J in Hz) |
|---|
| 1α | 38.9, CH2 | 1.31–1.36 m | 38.9, CH2 | 1.47 dt (13.0, 3.0) |
| 1β | | 1.76 br d (12.9) | | 1.76–1.83 overlapped |
| 2α | 19.5, CH2 | 1.40–1.44 m | 19.6, CH2 | 1.52–1.57 m |
| 2β | | 1.57 qt (13.4, 3.0) | | 1.61 qt (13.3. 3.0) |
| 3α | 36.3, CH2 | 1.83 m | 36.5, CH2 | 1.79 overlapped |
| 3β | | 1.38 br d (12.3) | | 1.40 dt (12.8, 3.1) |
| 4 | 39.3, C | | 38.9, C | |
| 5 | 49.2, CH | 1.91 dd (12.9, 2.6) | 49.2, CH2 | 1.76–1.83 overlapped |
| 6α | 24.9, CH2 | 1.81–1.86 overlapped | 25.1, CH2 | 1.76–1.83 overlapped |
| 6β | | 1.27–1.31 overlapped | | 1.26 qd (12.3, 4.1) |
| 7α | 38.8, CH2 | 2.04 td (12.9, 4.5) | 38.8, CH2 | 2.02 td (12.5 5.0) |
| 7β | | 2.34 dt (12.6, 3.0) | | 2.23–2.28 overlapped |
| 8 | 150.5, C | | 149.7, C | |
| 9 | 51.5, CH | 2.43 br d (7.0) | 51.2, CH | 2.48 br d (8.5) |
| 10 | 40.9, C | | 40.6, C | |
| 11a | 32.5, CH2 | 2.25 dd (15.1, 7.3) | 35.5, CH2 | 2.27 dd (14.7, 8.7) |
| 11b | | 2.24 br d (15.1) | | 2.21 br d (14.7) |
| 12a | 108.3, CH2 | 4.94 br s | 107.5, CH2 | 4.81 br s |
| 12b | | 4.71 br s | | 4.64 br s |
| 13a | 71.6, CH2 | 3.62 d (10.7) | 71.7, CH2 | 3.54 d (10.6) |
| 13b | | 3.29 d (10.7) | | 3.27 d (10.6) |
| 14 | 18.4, CH3 | 0.79 s | 18.2, CH3 | 0.78 s |
| 15 | 15.9, CH3 | 0.72 s | 16.0, CH3 | 0.69 s |
| 1ʹ | 78.1, C | | 78.8, C | |
| 2ʹ | 202.2, C | | 201.8, C | |
| 3ʹ | 134.5, CH | 7.49 t (2.0) | 135.4, CH | 7.49 t (2.0) |
| 4ʹ | 154.9, C | | 153.7, C | |
| 5ʹ | 197.7, C | | 197.9, C | |
| 6ʹα | 51.8, CH2 | 3.24 d (16.3) | 55.0, CH2 | 3.41 d (15.7) |
| 6ʹβ | | 3.32 d (16.3) | | 3.47 d (15.7) |
| 7ʹa | 58.7, CH2 | 4.94 dd (18.6, 2.1) | 58.8, CH2 | 5.01 dd (18.4, 2.1) |
| 7′b | | 4.86 dd (18.6, 2.1) | | 4.85 dd (18.4, 2.1) |
In order to find out the dominant low-energy conformers of
1 and
2, 1′
S- and 1′
R-isomers were built and subjected to theoretical conformational analysis as previously described [
8]. As a result (
Table S1), 1′
S-isomer afforded three groups of low-energy conformers (
1a,
1b and
1c), of which the group
1a, represented by the global energy minimum
1a1 (
Figure 3) accounted for 52.6% equilibrium population of the compound in MeOH solution according to Boltzmann statistics and the group
1b, as represented by the second lowest energy minimum
1b1, accounted for 44.8% equilibrium population, whereas, 1′
R-isomer gave two groups of low-energy conformers (
2a and
2b) with the group
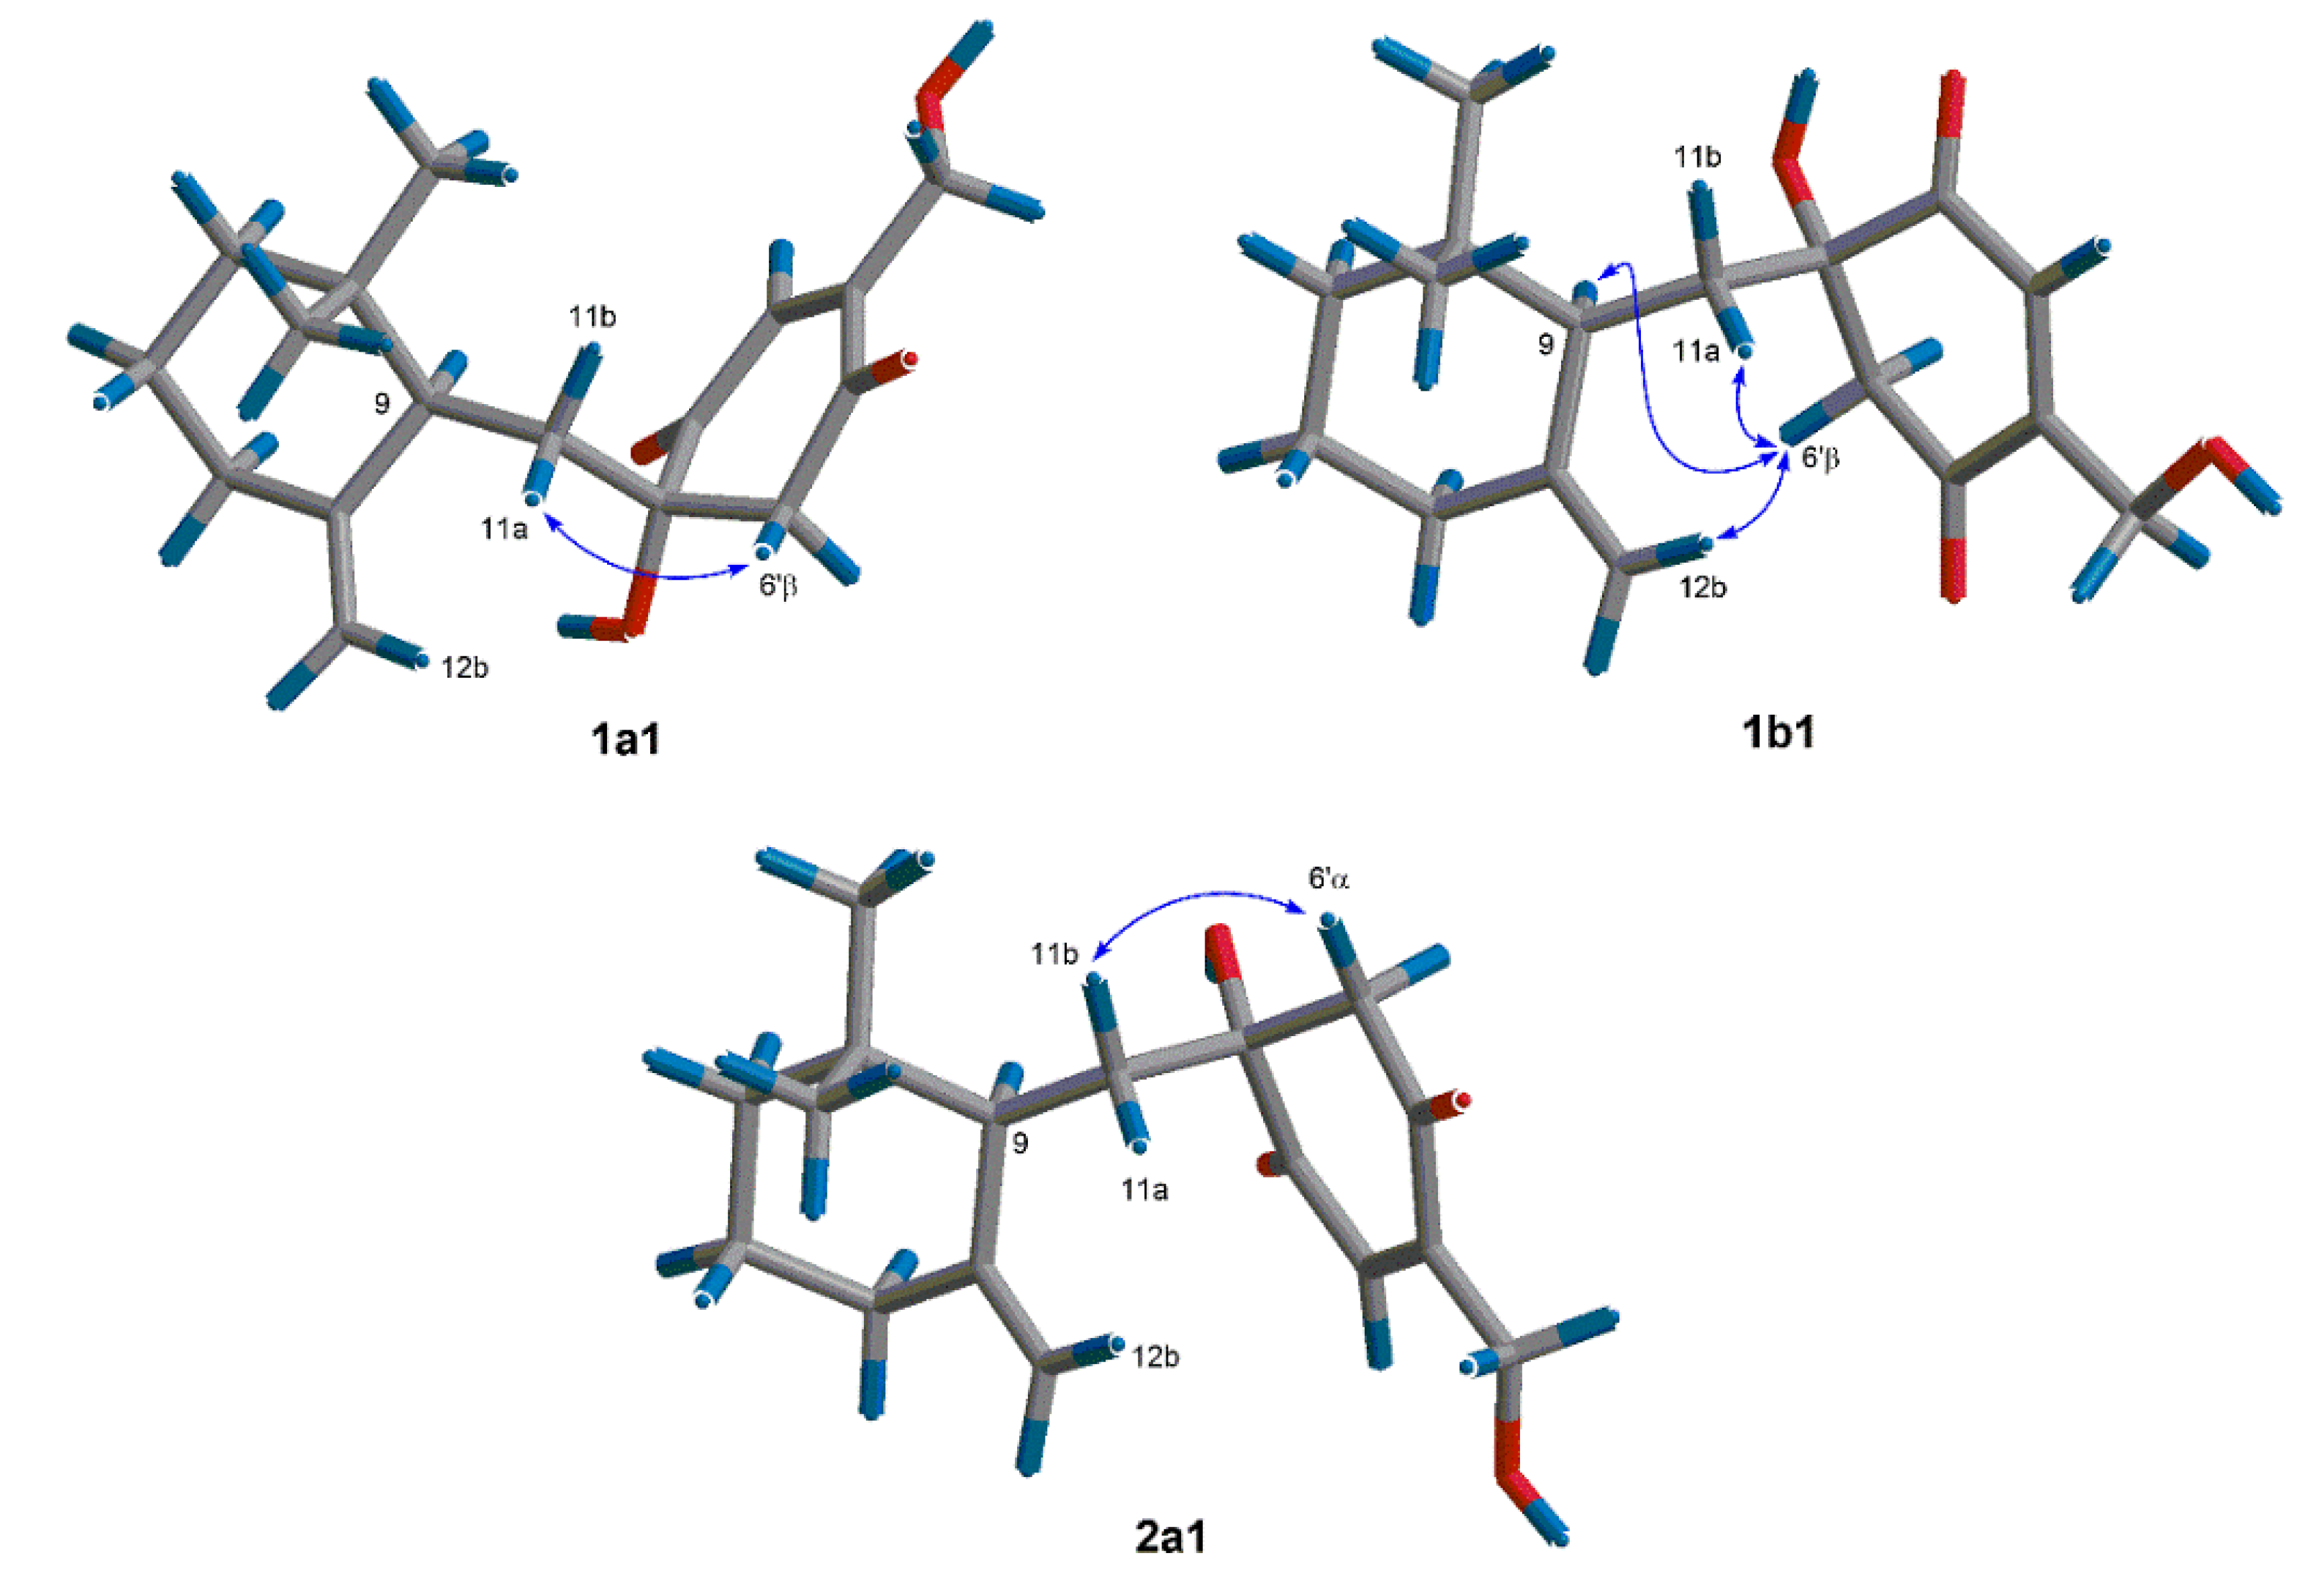
2a (accounting for 86.8% equilibrium population) being dominant minima. The NOE correlation of H-6ʹβ/H-11a observed in the NOESY spectrum of
1 was corresponding with both of the conformers
1a1 and
1b1, whereas the NOEs of H-6ʹβ/H-9 and H-6ʹβ/H-12b were distinctive of the conformer
1b1 (
Figure 3). The situation in the NOESY spectrum of compound
2, was that the NOE correlation of H-6ʹα/H-11b was clearly existed while the NOEs of H-6ʹα with H-12a and H-11a were absent, which was characteristic of the energy minima
2a as shown for conformer
2a1 in
Figure 3. Thus,
1 and
2 were assigned to have 1′
S and 1′
R configurations, respectively.
Considering that the main difference between 1 and 2 was the 13C NMR chemical shifts of C-11 and C-6′, the consistent 13C NMR data of C-11 (δC 34.7 in penicilliumin A; 35.5 in 2) and C-6′ (δC 53.0 in penicilliumin A; 55.0 in 2) suggested that the absolute configuration of penicilliumin A was the same as that of myrothecol H, although the NMR data of myrothecols G and H, and penicilliumin A were recorded in different deuterated solvents.
Since penicilliumin A showed cytotoxic activity against tumor cells [
7], compounds
1 and
2 were evaluated for
in vitro cytotoxicity against human lung adenocarcinoma A549, human hepatoma HepG2, and human cervical carcinoma HeLa cell lines by MTT method. Compounds
1 and
2 displayed weak cytotoxicity against the tested cell lines above. The IC
50 values were presented in
Table 2.
Figure 3.
Dominant low-energy conformers (1a1, 1b1 and 2a1) and key NOE correlations (curves) of 1 and 2.
Figure 3.
Dominant low-energy conformers (1a1, 1b1 and 2a1) and key NOE correlations (curves) of 1 and 2.
Table 2.
Cytotoxicity (IC50, μM) a of compounds 1 and 2.
Table 2.
Cytotoxicity (IC50, μM) a of compounds 1 and 2.
| Cell Lines |
|---|
| Compound | A549 | HeLa | HepG2 |
|---|
| 1 | 46.7 ± 0.8 | 15.9 ± 0.8 | 31.9 ± 0.9 |
| 2 | 40.2 ± 1.5 | 28.7 ± 0.8 | 25.7 ± 1.6 |
| Adriamycin b | 0.69 ± 0.06 | 0.47 ± 0.05 | 1.22 ± 0.02 |


