1. Introduction
Saliniquinones are renowned antibiotics featuring a typical anthraquinone-
γ-pyrone skeleton [
1] and a side chain with different substituents, such as methyl and allyl groups. Since being first described in 1956, [
2] more than 50 saliniquinone derivatives have been isolated from various genera, mainly
Streptomyces. As optically active metabolites, most of them featured
R configuration at C-15, with only six derivatives assigned as having
S configuration naturally. Saliniquinones show various biological activities, including cytotoxic [
3], antimicrobial [
4], and DNA synthesis inhibitory effects [
5], etc.
During our efforts in obtaining new bioactive metabolites from actinomycetes,
Nocardiopsis aegyptia HDN19-252 was selected for the intriguing UV absorption of EtOAc extract. A comprehensive examination of EtOAc extract using the Global Natural Product Social Molecular Networking (GNPS) platform [
6,
7], LC-MS-UV, and MarinLit database indicated that the strain
N. aegyptia HDN19-252 has potential saliniquinone derivatives in the metabolite profile. Moreover, a number of nodes that could not be retrieved in the GNPS platform [
6,
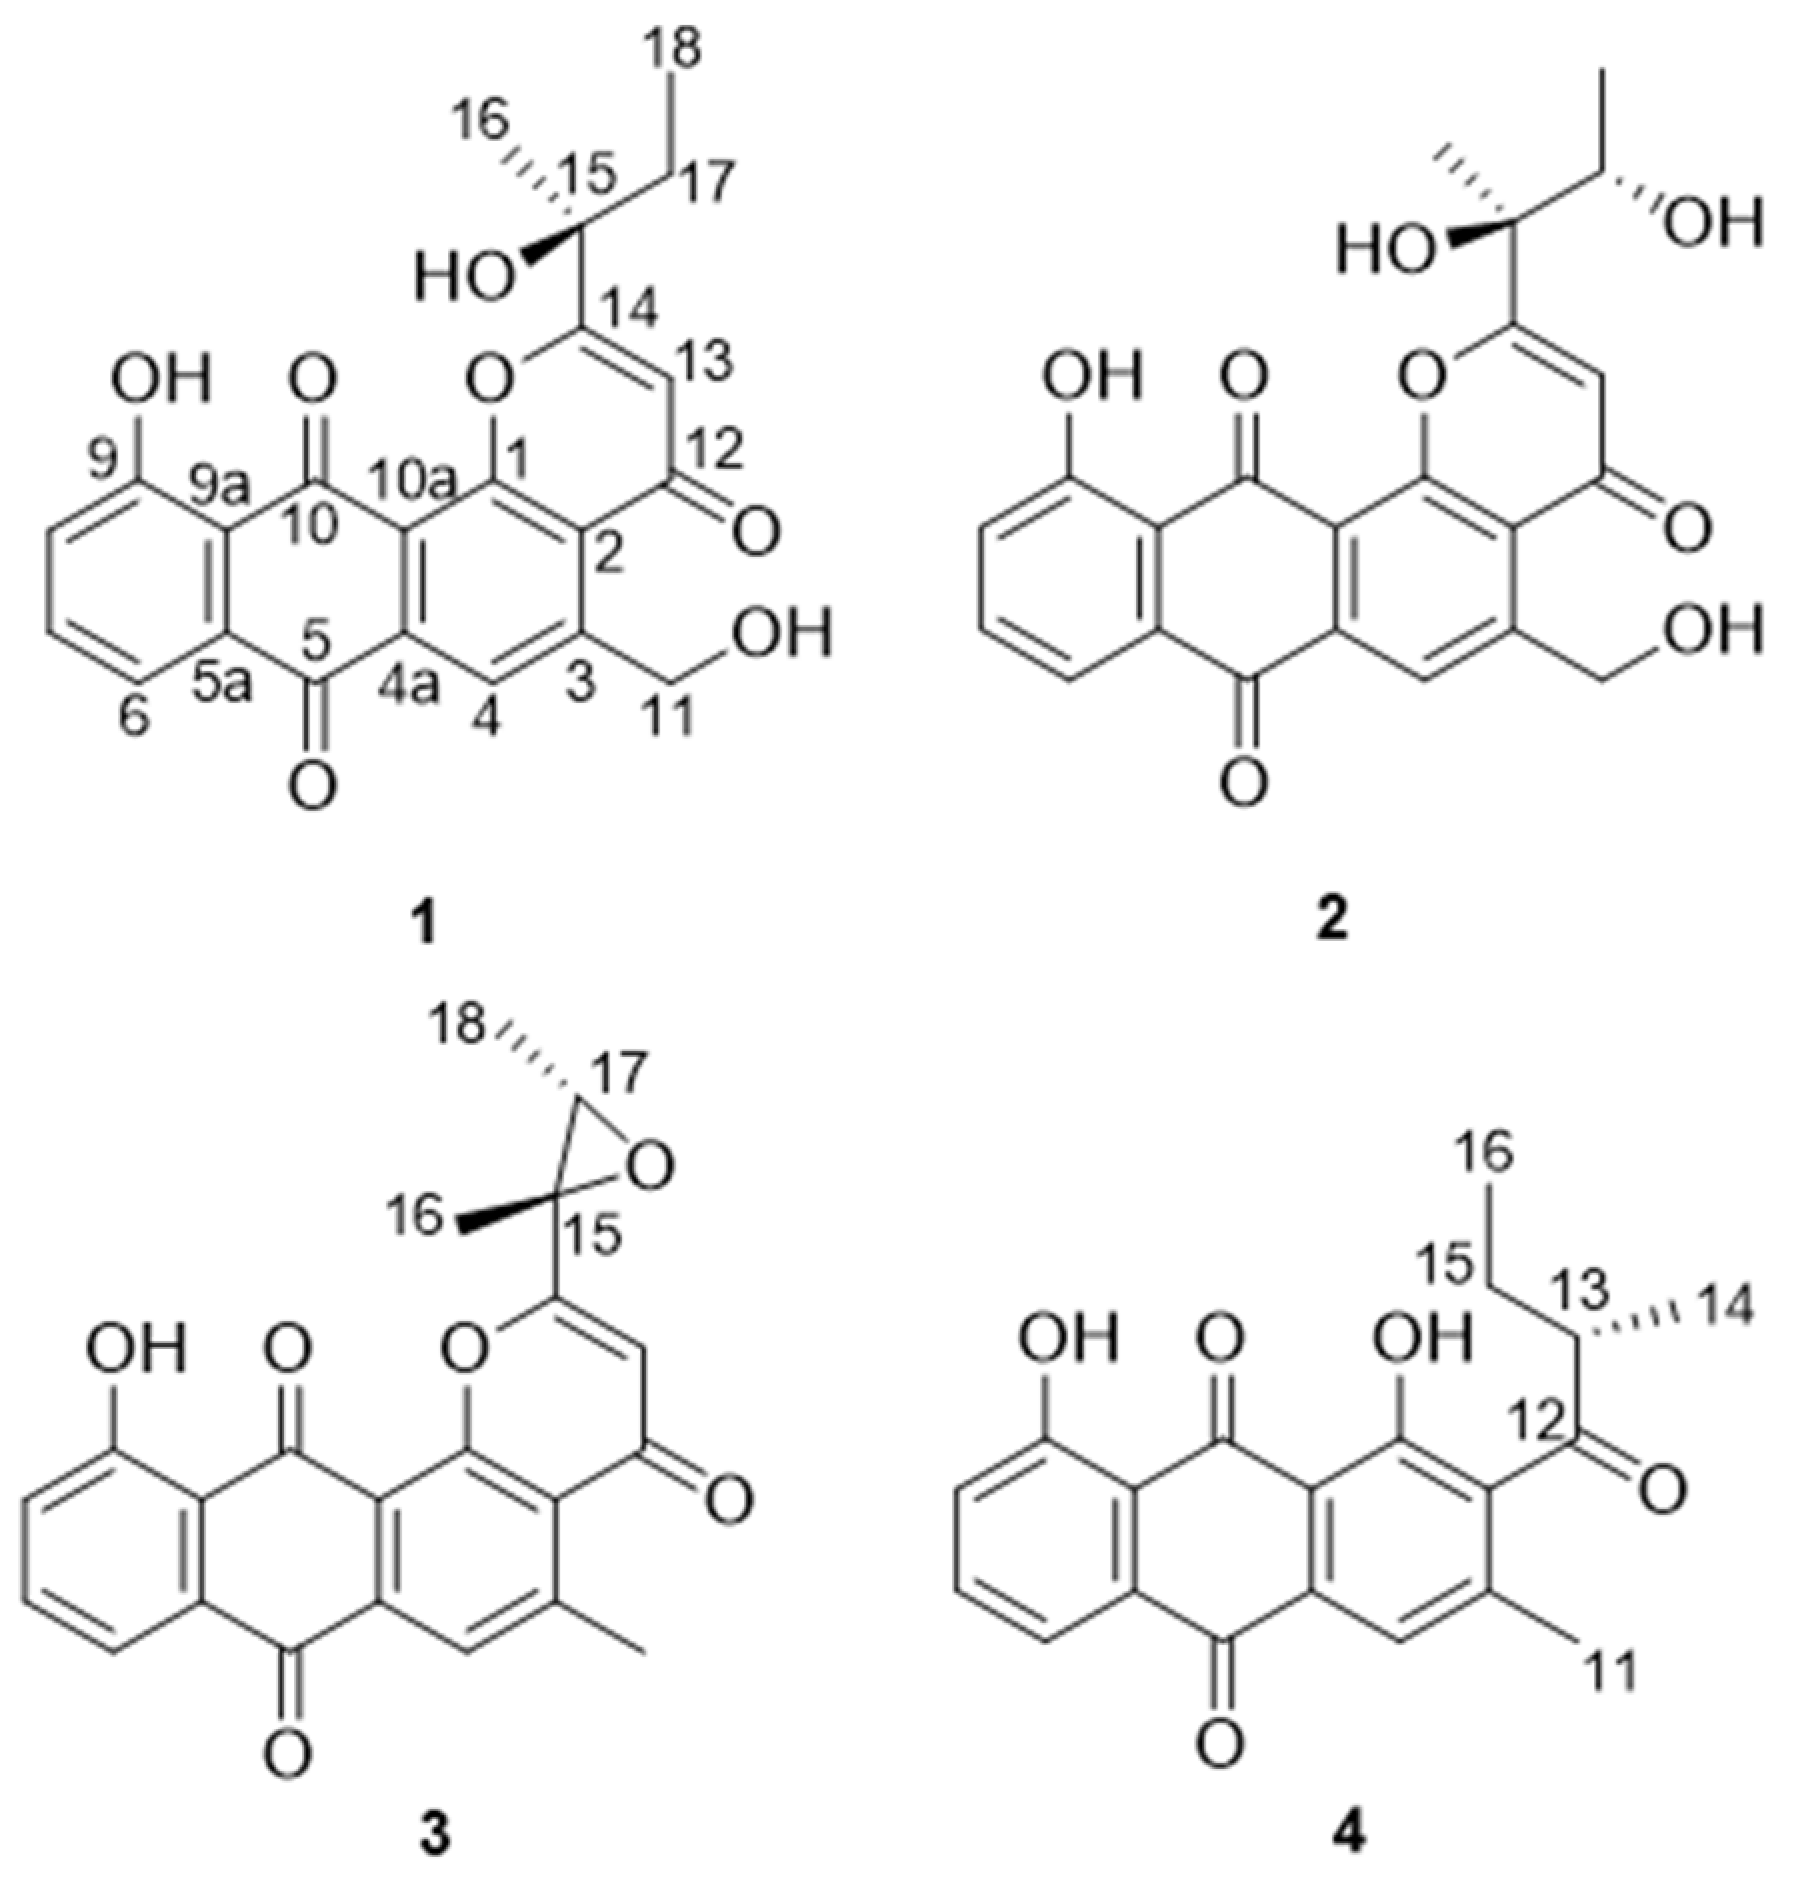
7] or other databases indicated the existence of new saliniquinone analogues. Followed up by HPLC-UV and LC-MS profiles, three saliniquinone derivatives and one new heraclemycin analogue (
Figure 1) were isolated from the crude extract of
N.
aegyptia HDN19-252. Among them,
1–
3 represent the first discovery of saliniquinones produced by
Nocardia sp., and all of them possess the rare
S configuration at C-15. Compounds
1–
4 were evaluated for antibacterial activity against six bacterial strains, including methicillin-resistant coagulase-negative
staphylococci (MRCNS),
B. subtilis,
Proteus sp.,
B. cereus,
Escherichia coli, and
Mycobacterium phlei. As a result, compounds
1 and
2 showed broad inhibitory effects. Herein, we report the details of the isolation, structure elucidation, and bioactivities of these compounds.
2. Results
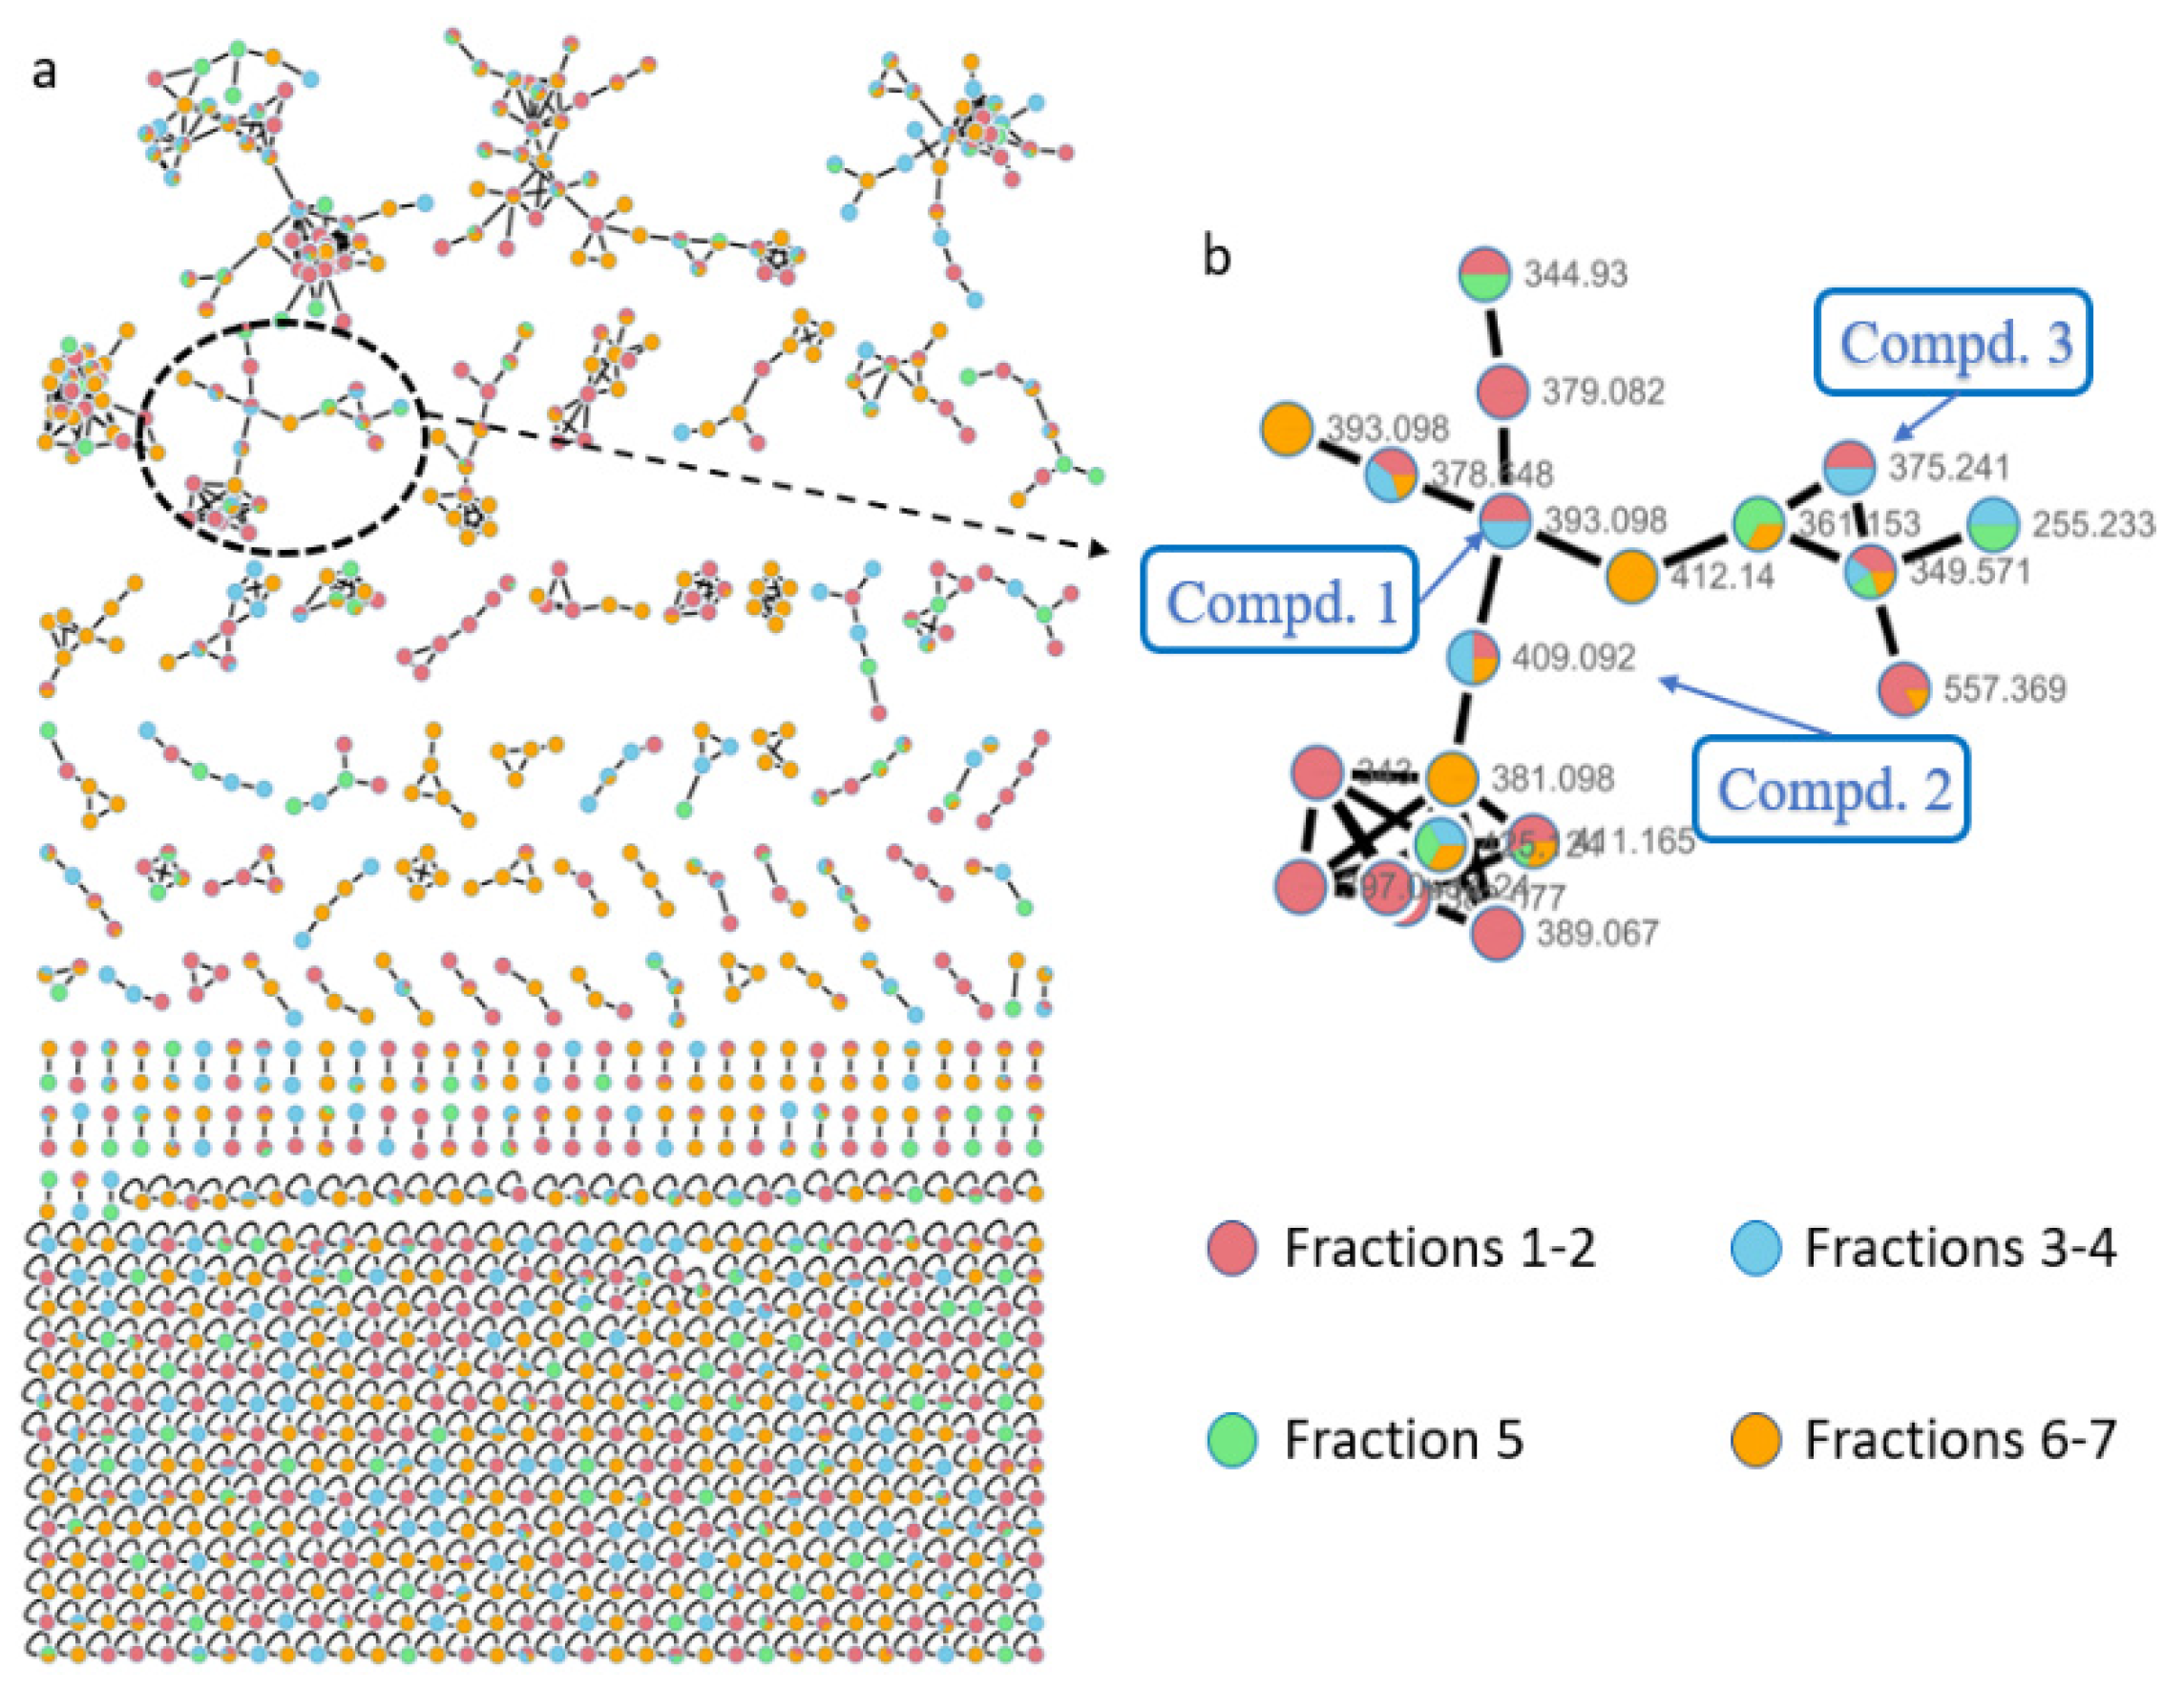
The actinomycete strain
N. aegyptia HDN19-252 was isolated from an unidentified animal (
Figure S1) collected form the Antarctic sea. The strain was cultured under static conditions, and the EtOAc extract (10.2 g) was fractionated by vacuum-liquid chromatography (VLC) using an ODS column to obtain seven subfractions, which were further analyzed via the GNPS web platform. A concentrated cluster with nodes attributed to subfractions 1–7 was spotted within the whole molecular network (
Figure 2a). Combining LC-MS-UV analysis and the MarinLit database retrieval (
http://pubs.rsc.org/marinlit, 15 June 2021) using the
m/
z values of 389.067 and 425.124 suggested the reasonable candidate molecules heraclemycin B [
8] and bleomycin B [
9]. Further analysis of the related molecular cluster indicated a series of putative new saliniquinone-related analogues through MarinLit database and SciFinder searches. Guided by LC-MS-UV, three undescribed saliniquinones, named saliniquinones G-I (
1–
3), and a new heraclemycin E (
4) were obtained by repeated separation by column chromatography using silica gel, LH-20, and HPLC with an ODS column.
Saliniquinone G (
1) was obtained as yellow powder with a molecular formula of C
22H
18O
7 deduced by HRESIMS, indicating fourteen degrees of unsaturation. The 1D NMR data of
1 (
Table 1 and
Table 2) are similar to those of saliniquinone F. [
1] The difference was the replacement of methyl at C-5 in saliniquinone F [
1] by a hydroxymethyl (C-11,
δC 62.8, H
2-11
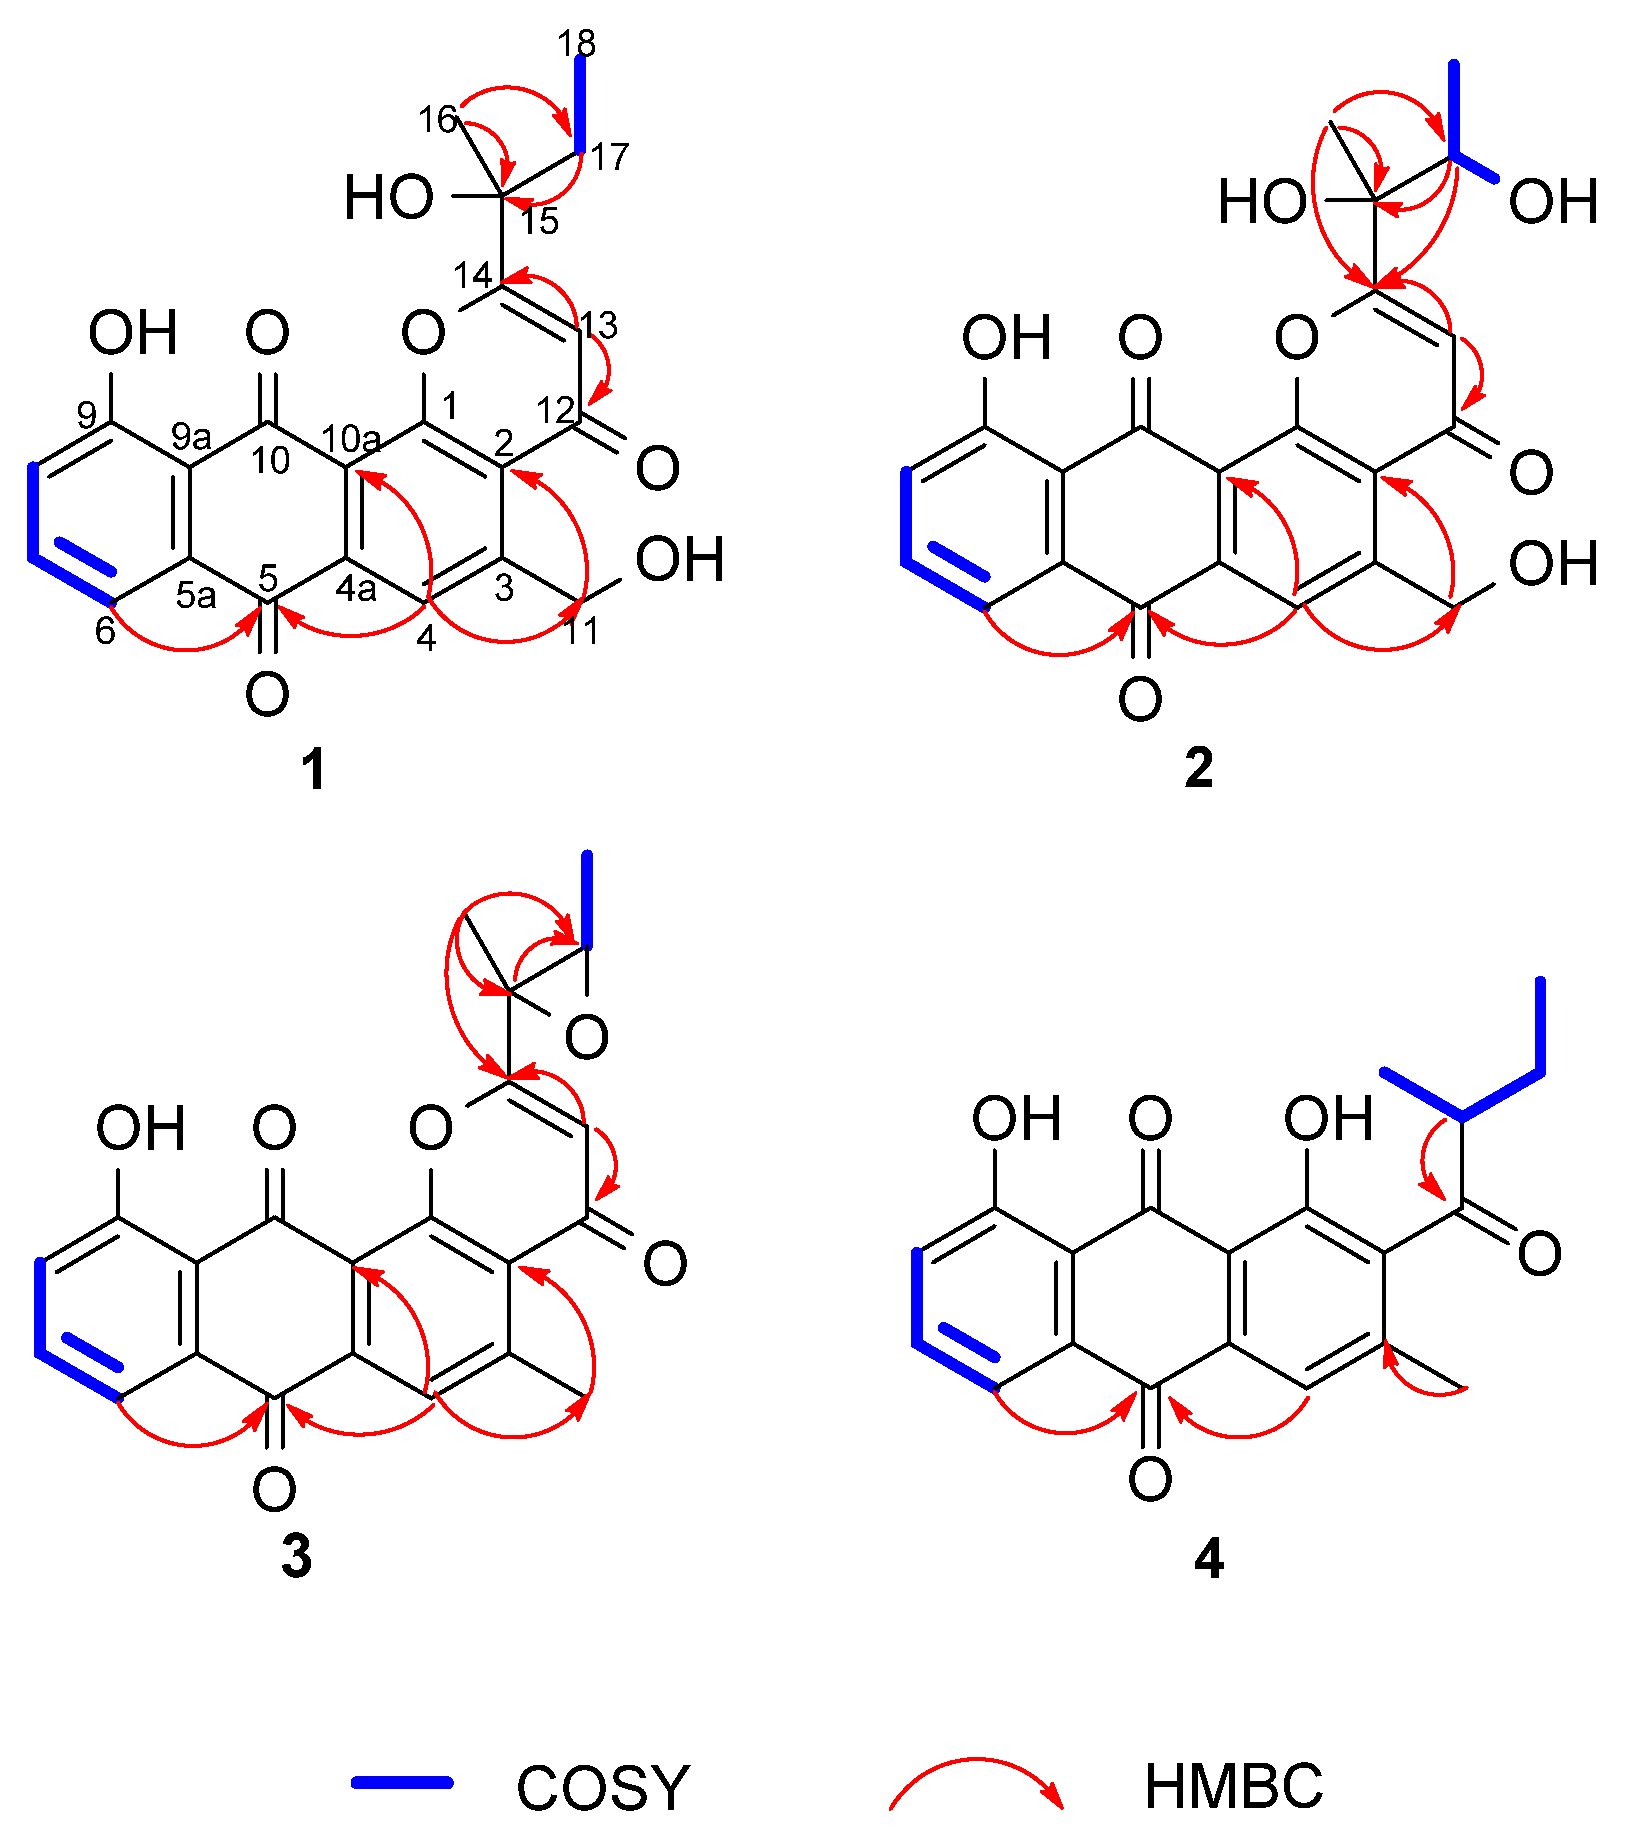
δH 5.18) group, which was supported by the COSY correlation from OH-11 (
δH 5.74) to H-11 (
δH 5.18) and the HMBC correlation from H-11 to C-3 (
δC 153.9), as well as the replacement of an allyl group on C-15 by an ethyl group (
Table 1 and
Table 2,
Figure 3). The absolute configuration of C-15 was determined as 15
S based on the CD data, which showed two negative Cotton effects at 267 nm and 372 nm (
Figure S4), similar to those of saliniquinone F [
1].
Saliniquinone H (
2), obtained as red-yellow powder, has a molecular formula of C
22H
18O
8, according to the (−)-HRESIMS
m/
z 409.0931 [M−H]
− (calcd. for C
22H
17O
8, 409.0929). Examination of the NMR data (
Table 1 and
Table 2) showed considerable resemblance to those of
1. The differences between
2 and
1 were the presence of an additional hydroxyl group at C-17 (
δC 70.9) and the absence of one methylene on the side chain at C-15 (
δC 76.5), which was supported by the downfield shift of C-17 (
Table 2) and the COSY correlation from 17-OH (
δH 4.67)/H-17(
δH 4.20)/H
3-18 (
δH 1.20) (
Table 1,
Figure 3), as well as HMBC correlations from H-18 to C-15 (
δC 76.5) and C-17, H-17 to C-14 (
δC 174.9), C-15, and C-16 (
δC 23.7), and H
3-16 (
δH 1.51) to C-14, C-15, and C-17. However, it was a challenge to determine the absolute configurations of C-15 and C-17 due to a free rotation of the C15–C17 single bond. Detailed analysis the ECD curve of
1 and saliniquinone C [
1] allowed us to draw the conclusion that the negative Cotton effect around 263 nm and 372 nm indicated an
S configuration. Accordingly, the hydroxy stereocenter at C-15 was an
S configuration due to its negative Cotton effect around 263 nm and 372 nm. Hence, there are two relative configurations, named (15
S*, 17
S*)-
2a and (15
S*, 17
R*)-
2b, theoretically. The
13C NMR chemical shifts for the two possible isomers were calculated at the B3LYP/6-31+G(d)//B3LYP/6-311+G(d,p) levels and further checked by DP4+ probability [
10,
11]. The (15
S, 17
S)-
2a isomer showed a striking predominance (100% probability) over the (15
S, 17
R)-
2b isomer (
Figure S6), which allowed us to assign the relative configuration of
2 as 15
S*, 17
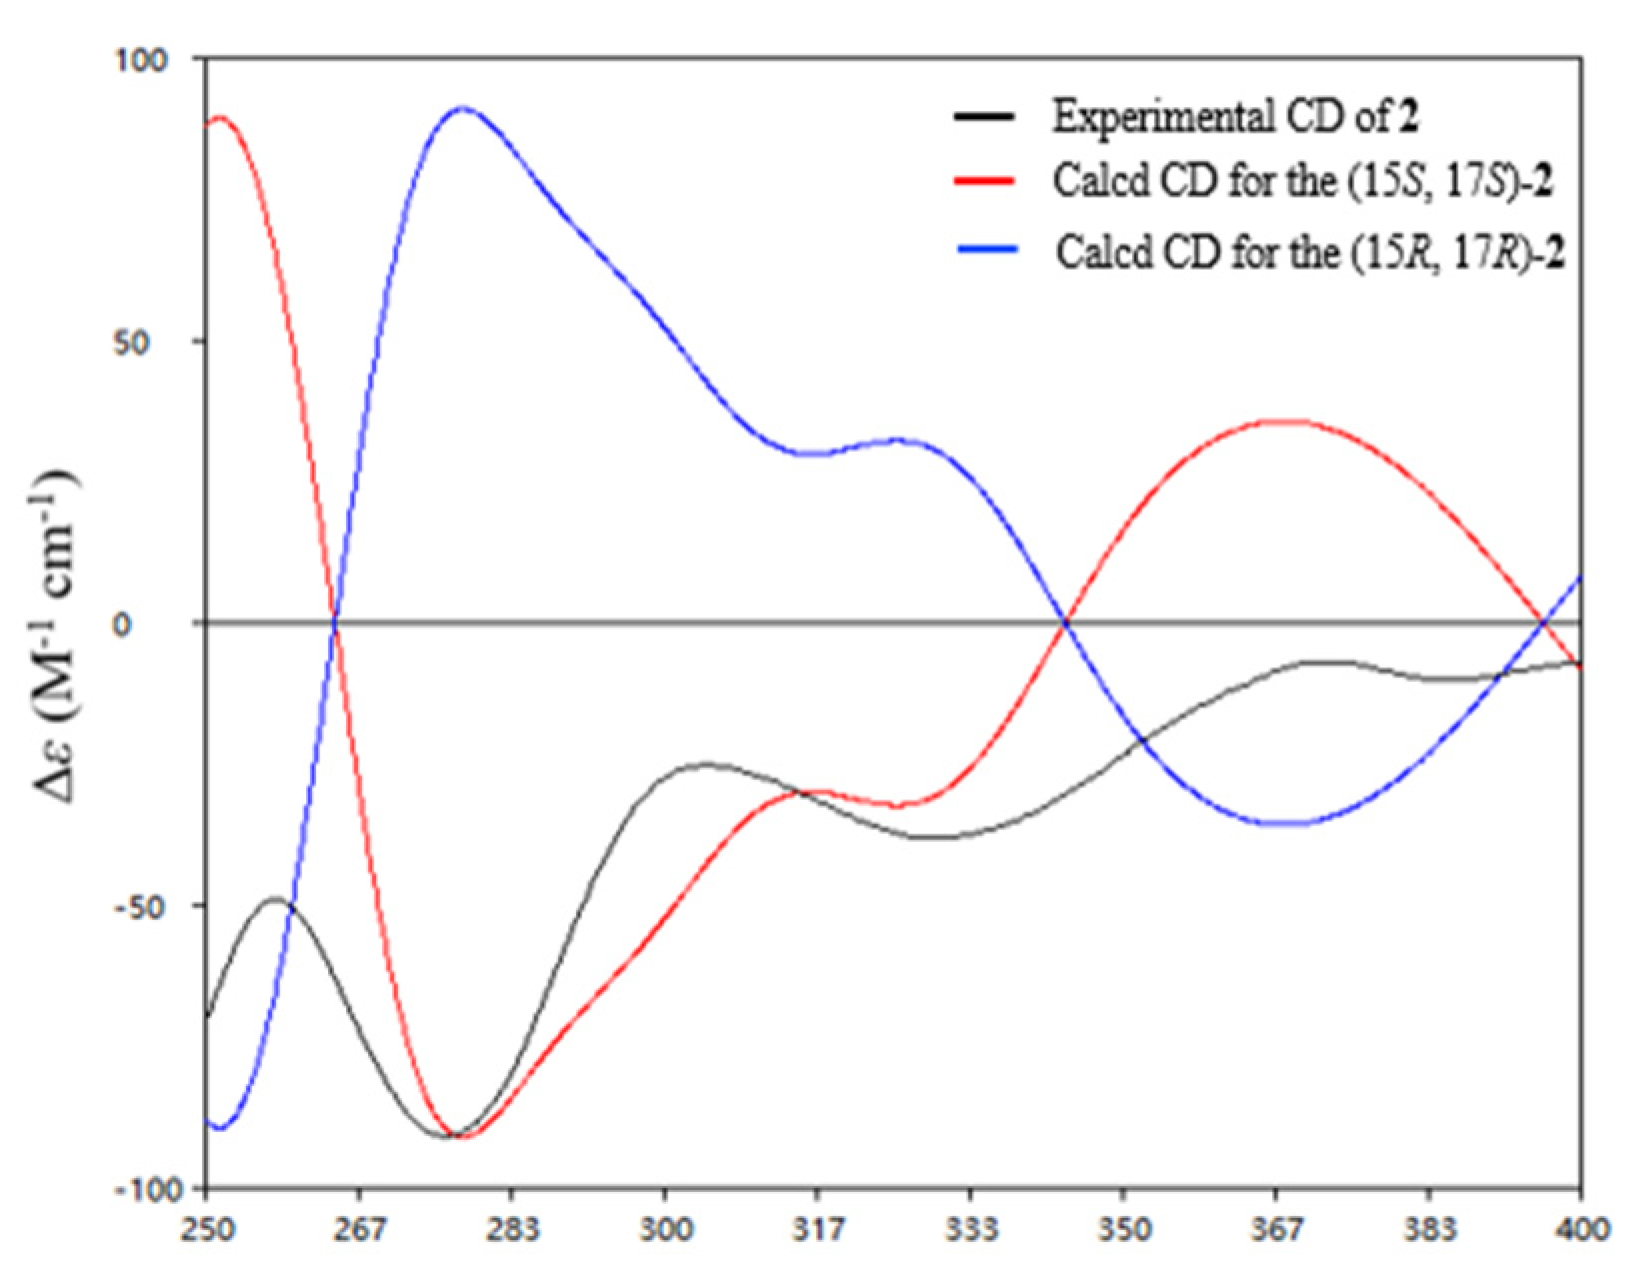
S*. To determine the absolute configuration of C-15 and C-17 in
2, the ECD calculations of the optimized conformation of (15
S, 17
S)-
2 obtained at the B3LYP/6-31+G(d) level were performed. The overall pattern of the experimental ECD spectrum was in reasonable agreement with the calculated one of (15
S, 17
S)-
2 (
Figure 4), indicating the absolute configuration of C-15 and C-17 in
2 as 15
S, 17
S.
Saliniquinone I (
3) was obtained as yellow powder with a molecular formula of C
22H
16O
6 by HRESIMS. The 1D (
Table 1 and
Table 2) and 2D NMR (
Figure 3) data indicated that
3 shares the same skeleton as
2. Instead of the hydroxymethyl group in
2,
3 has a methyl group (C-11,
δC 24.1) at C-3, which was supported by HMBC correlation from H
3-11 (
δH 2.93) to C-3 (
δC 156.4) (
Figure 3), and possesses an epoxide ring between C-15 (
Figure 3) and C-17, which is in agreement with the molecular formula as well as higher chemical shift values of C-17 (
δC 62.2 in
3 vs. 70.9 in
2) and C-15 (
δC 59.9 in
3 vs. 76.5 in
2). The relative configurations of C-15 and C-17 in
3 was evidenced by the NOESY correlations from H-17 (
δH 3.48) to H
3-16 (
δH 1.85), which indicated 15
S* and 17
S* relative configurations of
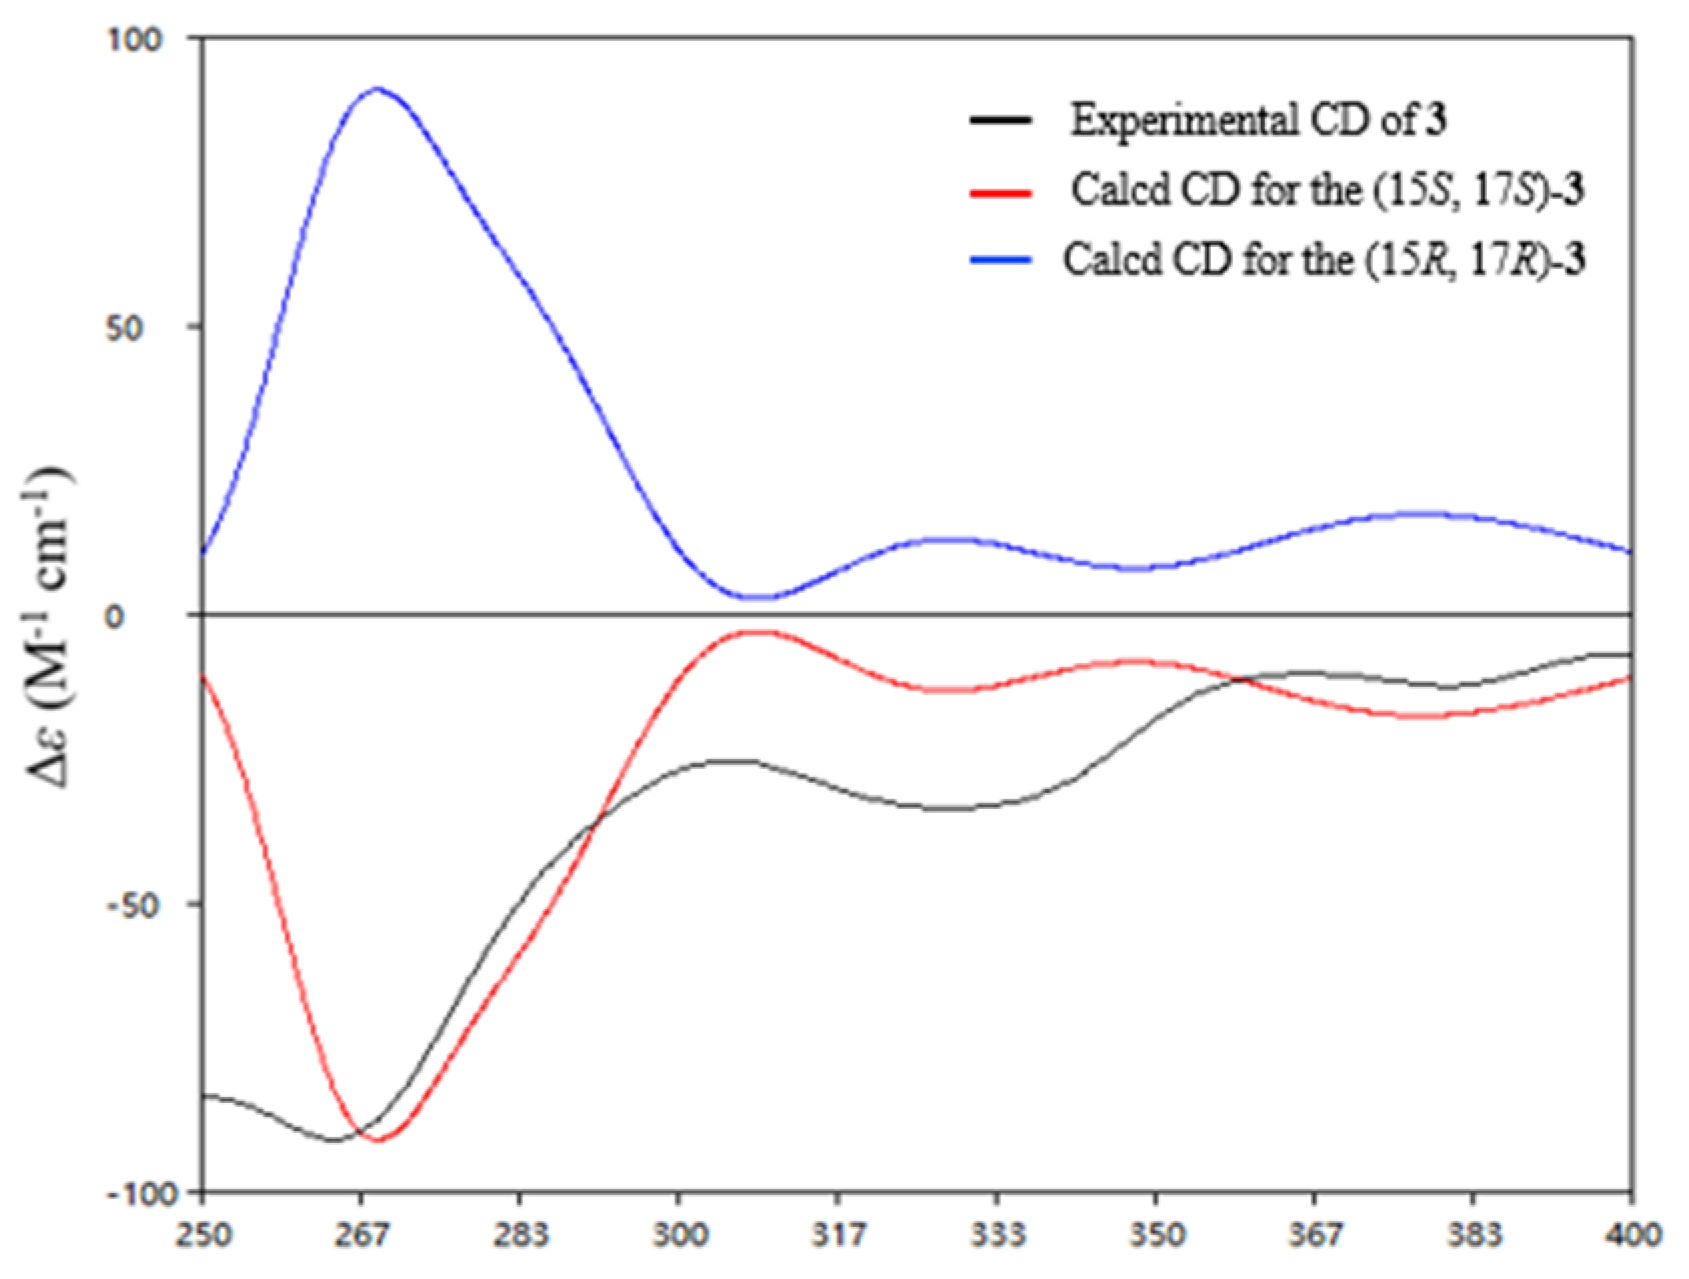
3. To determine the absolute configurations of C-15 and C-17, the optimized conformations of (15
S, 17
S)-
3 were obtained at the B3LYP/6-31+G(d) level and used for ECD calculations. The agreement of the experimental and calculated ECD curves (
Figure 5) indicated the 15
S and 17
S absolute configurations of
3.
Heraclemycin E (
4) was obtained as a brownish oil with a molecular formula of C
20H
18O
5, as evidenced by HRESIMS. Comparison of the
1H and
13C NMR data of
4 with those of the reported heraclemycin C [
4] revealed that they shared a similar anthraquinone skeleton. The difference between heraclemycin C and
4 is the substituent on C-2, being 2-methylhexanoyl in the former and 2-methylbutanoyl in the latter. This was confirmed by the COSY correlations from H-14 (
δH 1.07)/H-13 (
δH 3.00)/H-15 (
δH 1.73, 1.34)/H-16 (
δH 0.88) and HMBC correlations from H-13, H-14, and H-15 to C-12 (
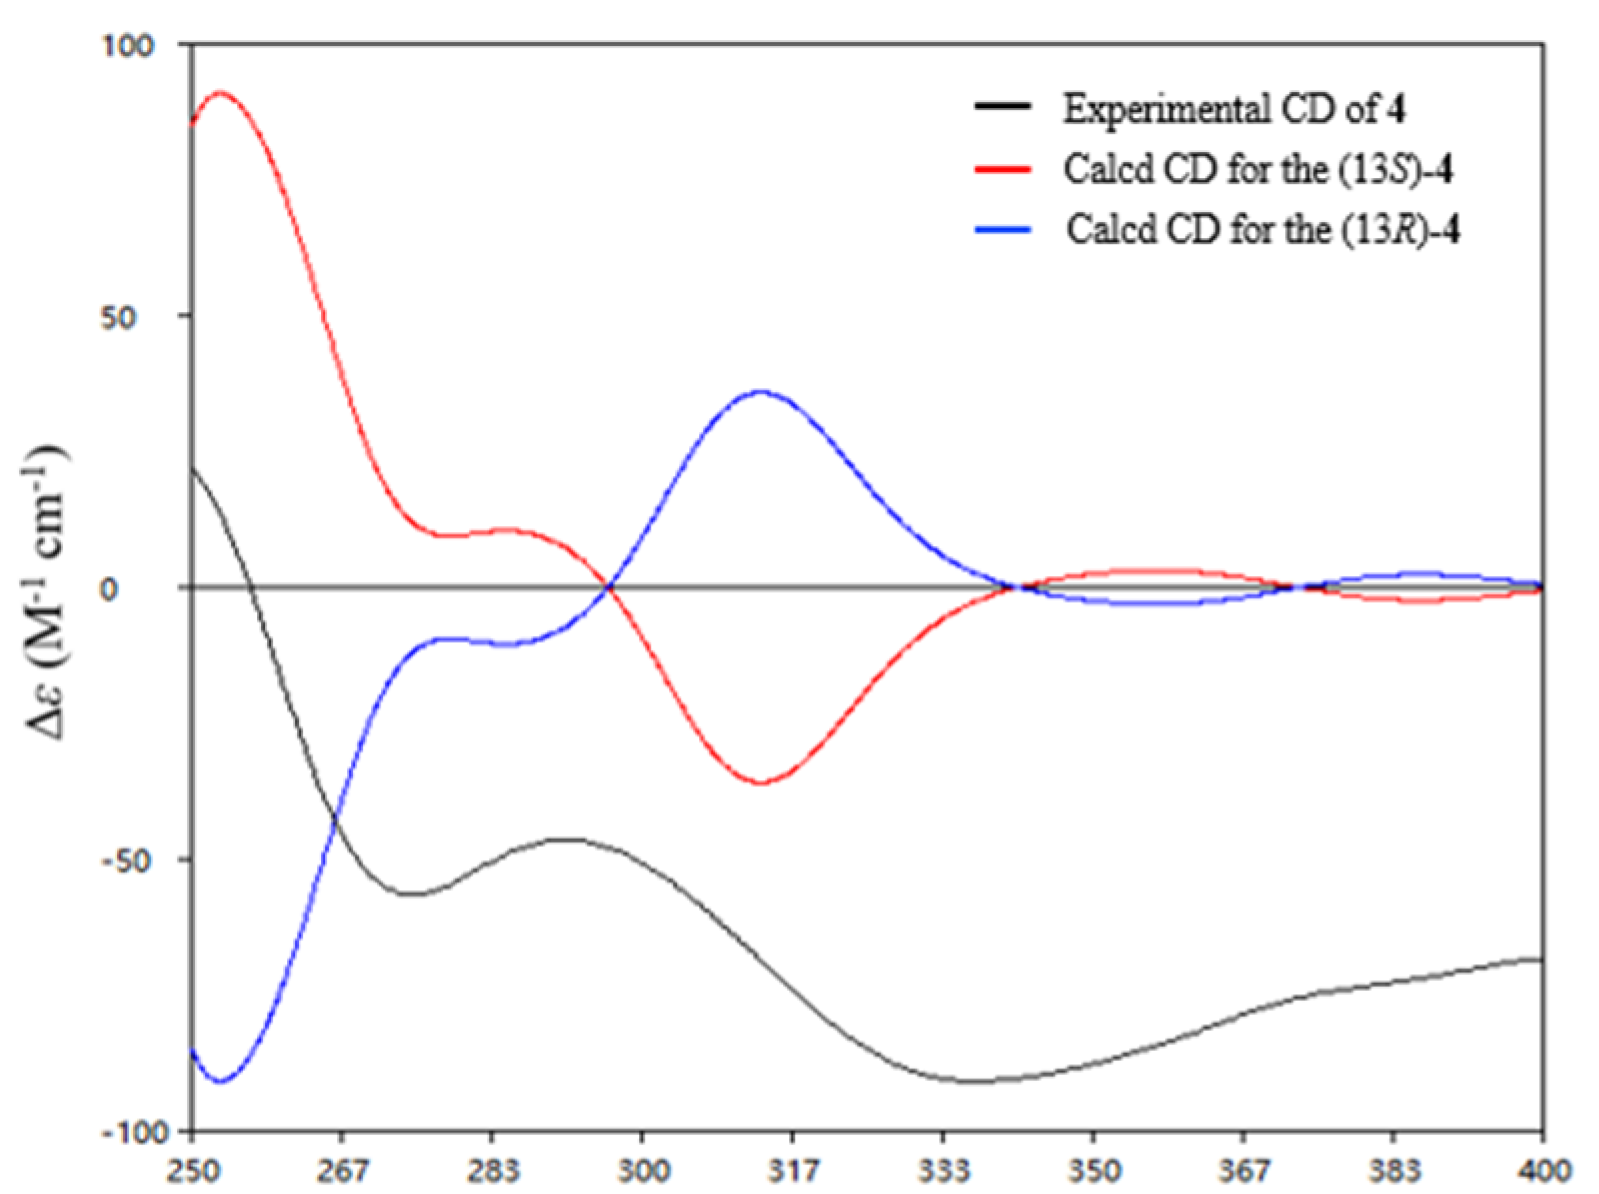
δC 208.9). The absolute configuration of C-13 was determined to be
S in
4 by comparison of the calculated and experimental ECD spectra of 13
S-
4 (
Figure 6).
The new compounds (
1–
4) were evaluated for antibacterial activity against six bacterial strains, including methicillin-resistant coagulase-negative
staphylococci (MRCNS),
B. subtilis,
Proteus sp.,
B. cereus,
Escherichia coli, and
Mycobacterium phlei [
12]. Compounds
1 and
2 showed inhibitory effects against six strains, with MIC values ranging from 3.1 to 12.5 μM (
Table 3). The structure activity relationship indicated the extra hydroxyl group at C-17 seems to play an important role for the inhibition activity (
1 vs.
2). It was noted that the MIC values of
1 and
2 against MRCNS were 8-fold stronger than that of the positive control, ciprofloxacin (CPFX) [
13].
3. Materials and Methods
3.1. General Experimental Procedures
The UV spectra were recorded on a Hitachi 5430 spectrophotometer (Hitachi Ltd., Tokyo, Japan). The ECD spectra and optical rotations were measured on a JASCO J-715 spectropolarimeter and a JASCOP-1020 digital (JASCO Corporation, Tokyo, Japan) polarimeter, respectively. IR spectra were obtained on a Bruker Tensor-27 (Bruker Corporation, Billerica, MA, USA). spectrophotometer in KBr discs. HRESIMS data were measured on a Thermo Scientific LTQ Orbitrap XL mass spectrometer (Thermo Fisher Scientific, Waltham, MA, USA). NMR spectra were collected on JEOLJN M-ECP 600 (JEOL Ltd., Tokyo, Japan and Agilent 500 MHz DD2 spectrometers (Agilent Technologies, Palo Alto, CA, USA), and tetramethylsilane was used as an internal standard. Sephadex LH-20 (Amersham Biosciences, NJ, USA) and silica gel (Qingdao Marine Chemical Factory, Qingdao, China) were used as stationary phases in column chromatography. An ODS column (YMC-Pack ODS-A, 10 × 250 mm, 5 μm, 3 mL/min, YMC Co., Ltd., Kyoto, Japan) was used for HPLC.
3.2. Actinomycete Material and Fermentation
Nocardiopsis aegyptia HDN19-252 (GenBank No. MN822699) was isolated from an animal sample collected from Antarctica (61°42′28″ S, 57°38′22″ W). The strain was aerobic and Gram-positive and produced beige to light-yellow aerial mycelium, brown substrate mycelium, and straight to flexuous hyphae but no specific spore chains [
14]. It was deposited at the Key Laboratory of Marine Drugs, the Ministry of Education of China, School of Medicine and Pharmacy, Ocean University of China, Qingdao, People’s Republic of China.
Nocardiopsis aegyptia HDN19-252 was cultured in 1 L Erlenmeyer flasks containing 200 g of culture medium composed of 80 g of rice and 120 g of seawater, pH = 7.0 (in seawater collected from Huiquan Bay, Yellow Sea) at 28 °C for 25 days on stable fermentation. A total of 130 bottles of the culture medium were extracted with EtOAc (3 × 20 L) to generate a crude extract (10.2 g).
3.3. LC-MS/MS and Molecular Networking Analysis
LC-MS/MS analysis was performed using a UHPLC system (Ultimate 3000, Thermo Scientific) combined with a hybrid Quadrupole-Orbitrap mass spectrometer (QExactive, Thermo Scientific). As a mobile phase, 0.1% formic acid in H2O (A) and HPLC-grade MeCN (B) were used in negative-ionization conditions. The elution gradient conditions of LC-MS/MS were as follows, based on times (t): t = 0–1 min, hold at 10% B; t = 1–23 min, increased to 100% B linearly; t = 23–26 min, hold at 100% B; t = 26–30 min, returned to initial conditions and hold at 10% B to re-equilibrate the column. The elution velocity and injection volume were 0.25 mL/min and 3 μL, respectively. All MS/MS data were converted to mzXML format files by MSConvert software (Ver. 3.0.20169, MSConvert, ProteoWizard). Molecular networking was established by GNPS data analysis workflow and algorithms. The spectral network files were visualized through Cytoscape (Ver. 3.8.0, Cytoscape, NRNB.)
3.4. Isolation and Purification of Compounds
The crude extract was applied over a VLC column and eluted with mixtures of CH2Cl2-MeOH to give nine fractions (Fr.1–Fr.9). Fr.3–Fr.7 was combined as Fr.A, which was separated by HPLC using an ODS column to obtain ten subfractions (Fr.A.1–Fr.A.10). Fr.A.6 was purified by semi-preparative HPLC to obtain 2 (3 mg, tR = 15 min). Fr.A.7 was purified by semi-preparative HPLC to afford 4 (2.5 mg, tR = 13 min). Fr.A.8 was separated on the LH-20 column to obtain three subfractions (Fr.A.8.1–Fr.A.8.5). Fr.A.8.3 was purified by semi-preparative HPLC using a stepped gradient elution to obtain 1 (1.5 mg, tR = 25 min). Fr.A.8.2 was purified by semi-preparative HPLC to afford 3 (2.1 mg, tR = 27 min).
Saliniquinone G (
1): yellow powder, [
α]
−12 (MeOH); UV (MeOH)
λmax 240 (1.6), 417 (0.3) nm; IR (KBr)
νmax 3414, 2926, 1679, 1211, 1139 cm
−1; ECD (
c 1.5mM, DMSO
λmax (Δ
ε) 264 (−1.01), 372 (−0.22) nm;
1H and
13C NMR data,
Table 1 and
Table 2; HRESIMS
m/
z 393.0978 [M−H]
− (calcd for C
22H
17O
7, 393.0980).
Saliniquinone H (
2): red-yellow powder, [
α]
−83 (MeOH); UV (MeOH)
λmax (log
ε) 240 (1.8), 419 (0.3) nm; IR (KBr)
νmax 3409, 2927, 1687, 1210, 1138 cm
−1; ECD (
c 1.5mM, DMSO
λmax (Δ
ε) 264 (−8.63), 335 (−3.32) nm, 385 (−1.02) nm;
1H and
13C NMR data,
Table 1 and
Table 2; HRESIMS
m/
z 409.0931 [M−H]
− (calcd for C
22H
17O
8, 409.0929).
Saliniquinone I (
3): yellow powder, [
α]
−83 (MeOH); UV (MeOH)
λmax 241 (1.5), 417 (0.3) nm; IR (KBr)
νmax 3437, 2925, 1679, 1215, 1140 cm
−1; ECD (
c 1.5mM, DMSO
λmax (Δ
ε) 264 (−4.00), 335 (−1.37) nm, 385 (−0.53) nm;
1H and
13C NMR data,
Table 1 and
Table 2; HRESIMS
m/
z 375.0881 [M−H]
− (calcd for C
22H
15O
6, 375.0874).
Heraclemycin E (
4): brownish oil, [
α]
−12 (MeOH); UV (MeOH)
λmax 225 (0.5), 380 (0.3) nm; IR (KBr)
νmax 3435, 2929, 1696, 1210, 1156 cm
−1; ECD (
c 1.5mM, DMSO
λmax (Δ
ε) 264 (−0.91), 335 (−0.86) nm;
1H and
13C NMR data,
Table 1 and
Table 2; HRESIMS
m/
z 337.1075 [M−H]
− (calcd for C
20H
17O
5, 337.1081).
3.5. Computation Section
Conformational searches were run, employing Spartan’14, [
15] based on the MMFF (Merck Molecular Force Field). All conformers were further optimized with DFT calculations at the B3LYP/6-31+G(d) level by using the Gaussian 09 program [
16]. TDDFT calculations were performed on the five lowest-energy conformations for
2, the lowest-energy conformation for
3, and the six lowest-energy conformations for
4 (>5% population). ECD spectra were obtained on the program SpecDis 1.71 software [
17] by using a Gaussian band shape with a 0.25 eV width for
2, a 0.3 eV width for
3, and a 0.25 eV width for
4 from dipole-length rotational strengths. The calculated spectra were shifted by −25 nm for
2, 32 nm for
3, and 0 nm for
4 to facilitate comparison to the experimental data.
3.6. Assay of Antimicrobial Activity
Antibacterial activity of
1–
4 was evaluated against MRCNS,
B. subtilis,
Proteus sp.,
B. cereus,
Escherichia coli,
Mycobacterium phlei by a conventional broth dilution assay. Six strains were cultured in 100 mL Erlenmeyer flasks at 28 °C for 24 h. Then, the culture medium was diluted to a concentration of 10
6 cfu/mL and added into 96-well plates. Ciprofloxacin was used as a positive control. The detailed methodologies for biological testing have been described in previous reports [
14].


 ,
, 


