Abstract
Six new fusarin derivatives, fusarins G–L (1–6), together with five known compounds (5–11) were isolated from the marine-derived fungus Fusarium solani 7227. The structures of the new compounds were elucidated by means of comprehensive spectroscopic methods (1D and 2D NMR, HRESIMS, ECD, and ORC) and X-ray crystallography. Compounds 5–11 exhibited potent anti-inflammatory activity by inhibiting the production of NO in RAW264.7 cells activated by lipopolysaccharide, with IC50 values ranging from 3.6 to 32.2 μM. The structure–activity relationships of the fusarins are discussed herein.
1. Introduction
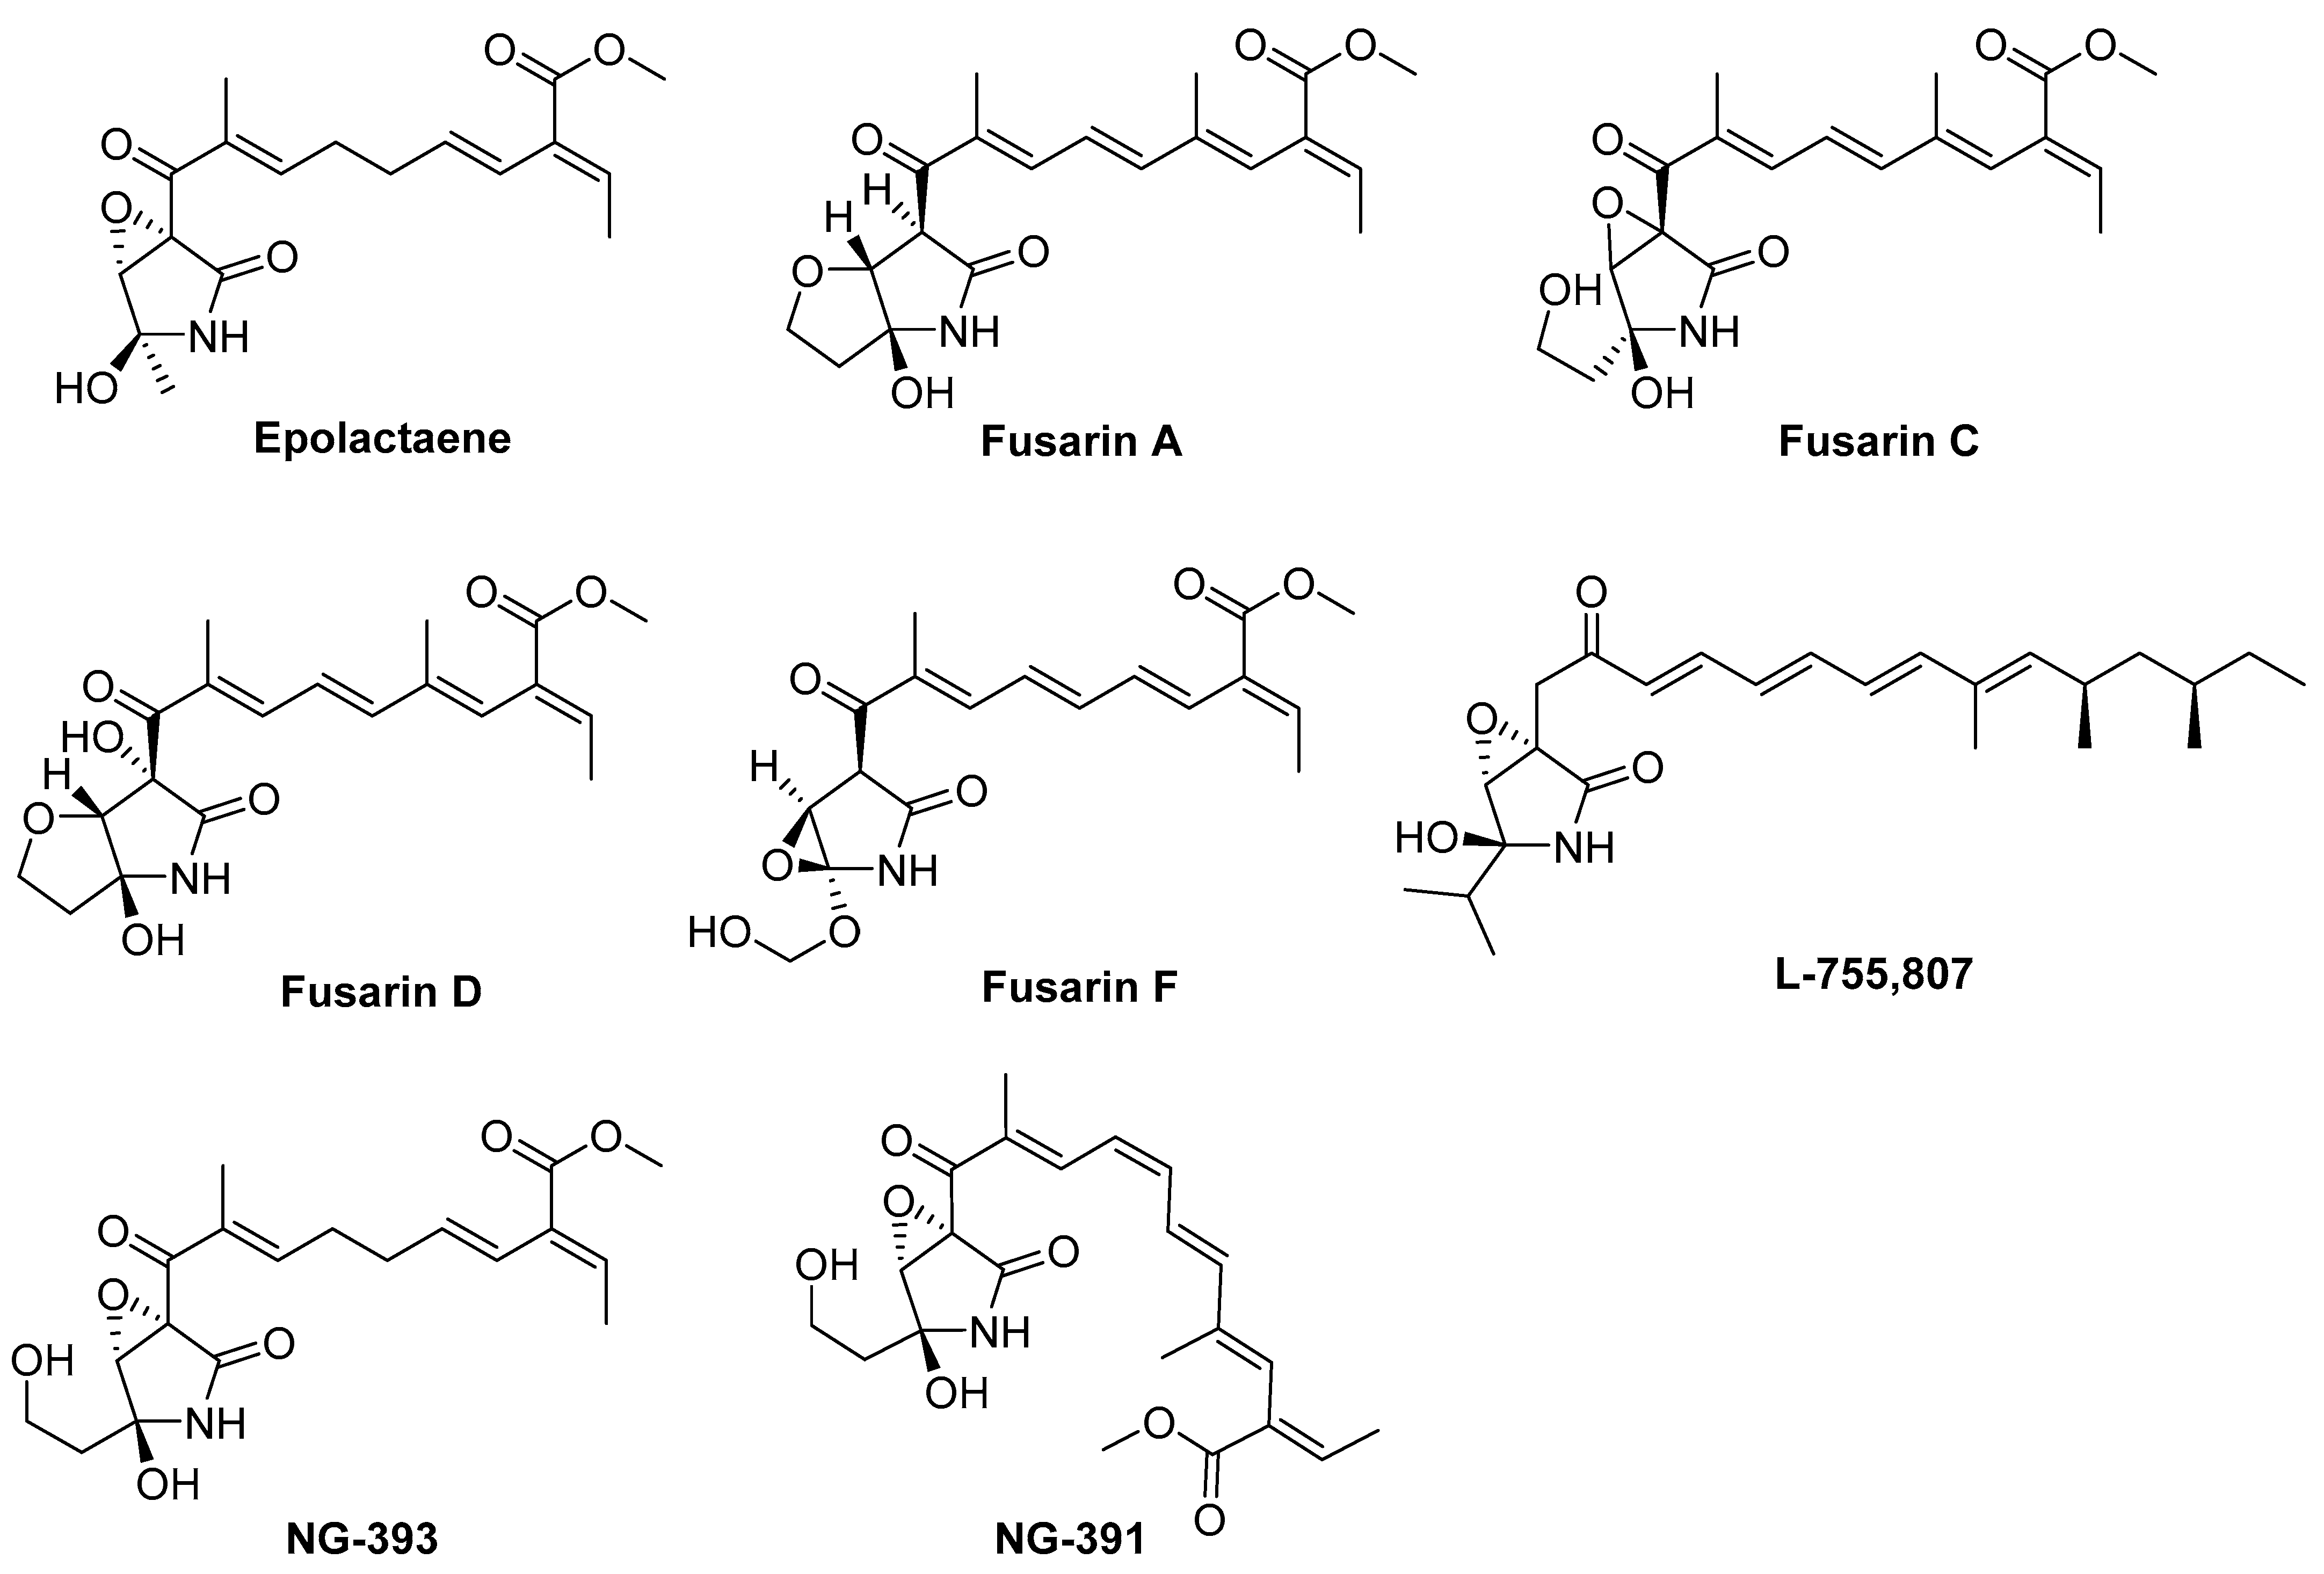
Fusarium species are widely distributed in plants and soils worldwide. They have been proven to be an important source of plant pathogens in agriculture [1,2] and are also excellent sources of bioactive natural products. Among these, fusarin-related compounds are representative of Fusarium natural products, including epolactaene [3]; fusarins A, C, D, and F [4]; L-755,807 [5]; and NG-393 and NG-391 [6] (Figure 1), which possess a γ-lactam nucleus with a polyunsaturated side chain. Fusarium species have also received widespread attention in terms of both total chemical synthesis and biosynthesis [7,8]. For example, lucilactaene has been considered as a cell cycle inhibitor in p53-transfected cancer cells, which could arrest cell-cycle progression in a p53-independent manner in cells possessing a temperature-sensitive p53 protein, isolated from a strain of Fusarium species [9]. L-755,807 was reported as a bradykinin binding inhibitor, displaying bradykinin B2 receptor antagonist activity with an IC50 of 71 μM [5]. NG-391 has displayed the impairment of nucleic acid formation, while translation remains unaffected, in K-562 human cancer cells [10].
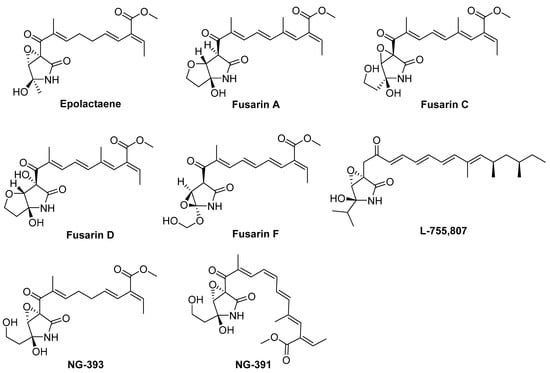
Figure 1.
Structures of fusarin analogs.
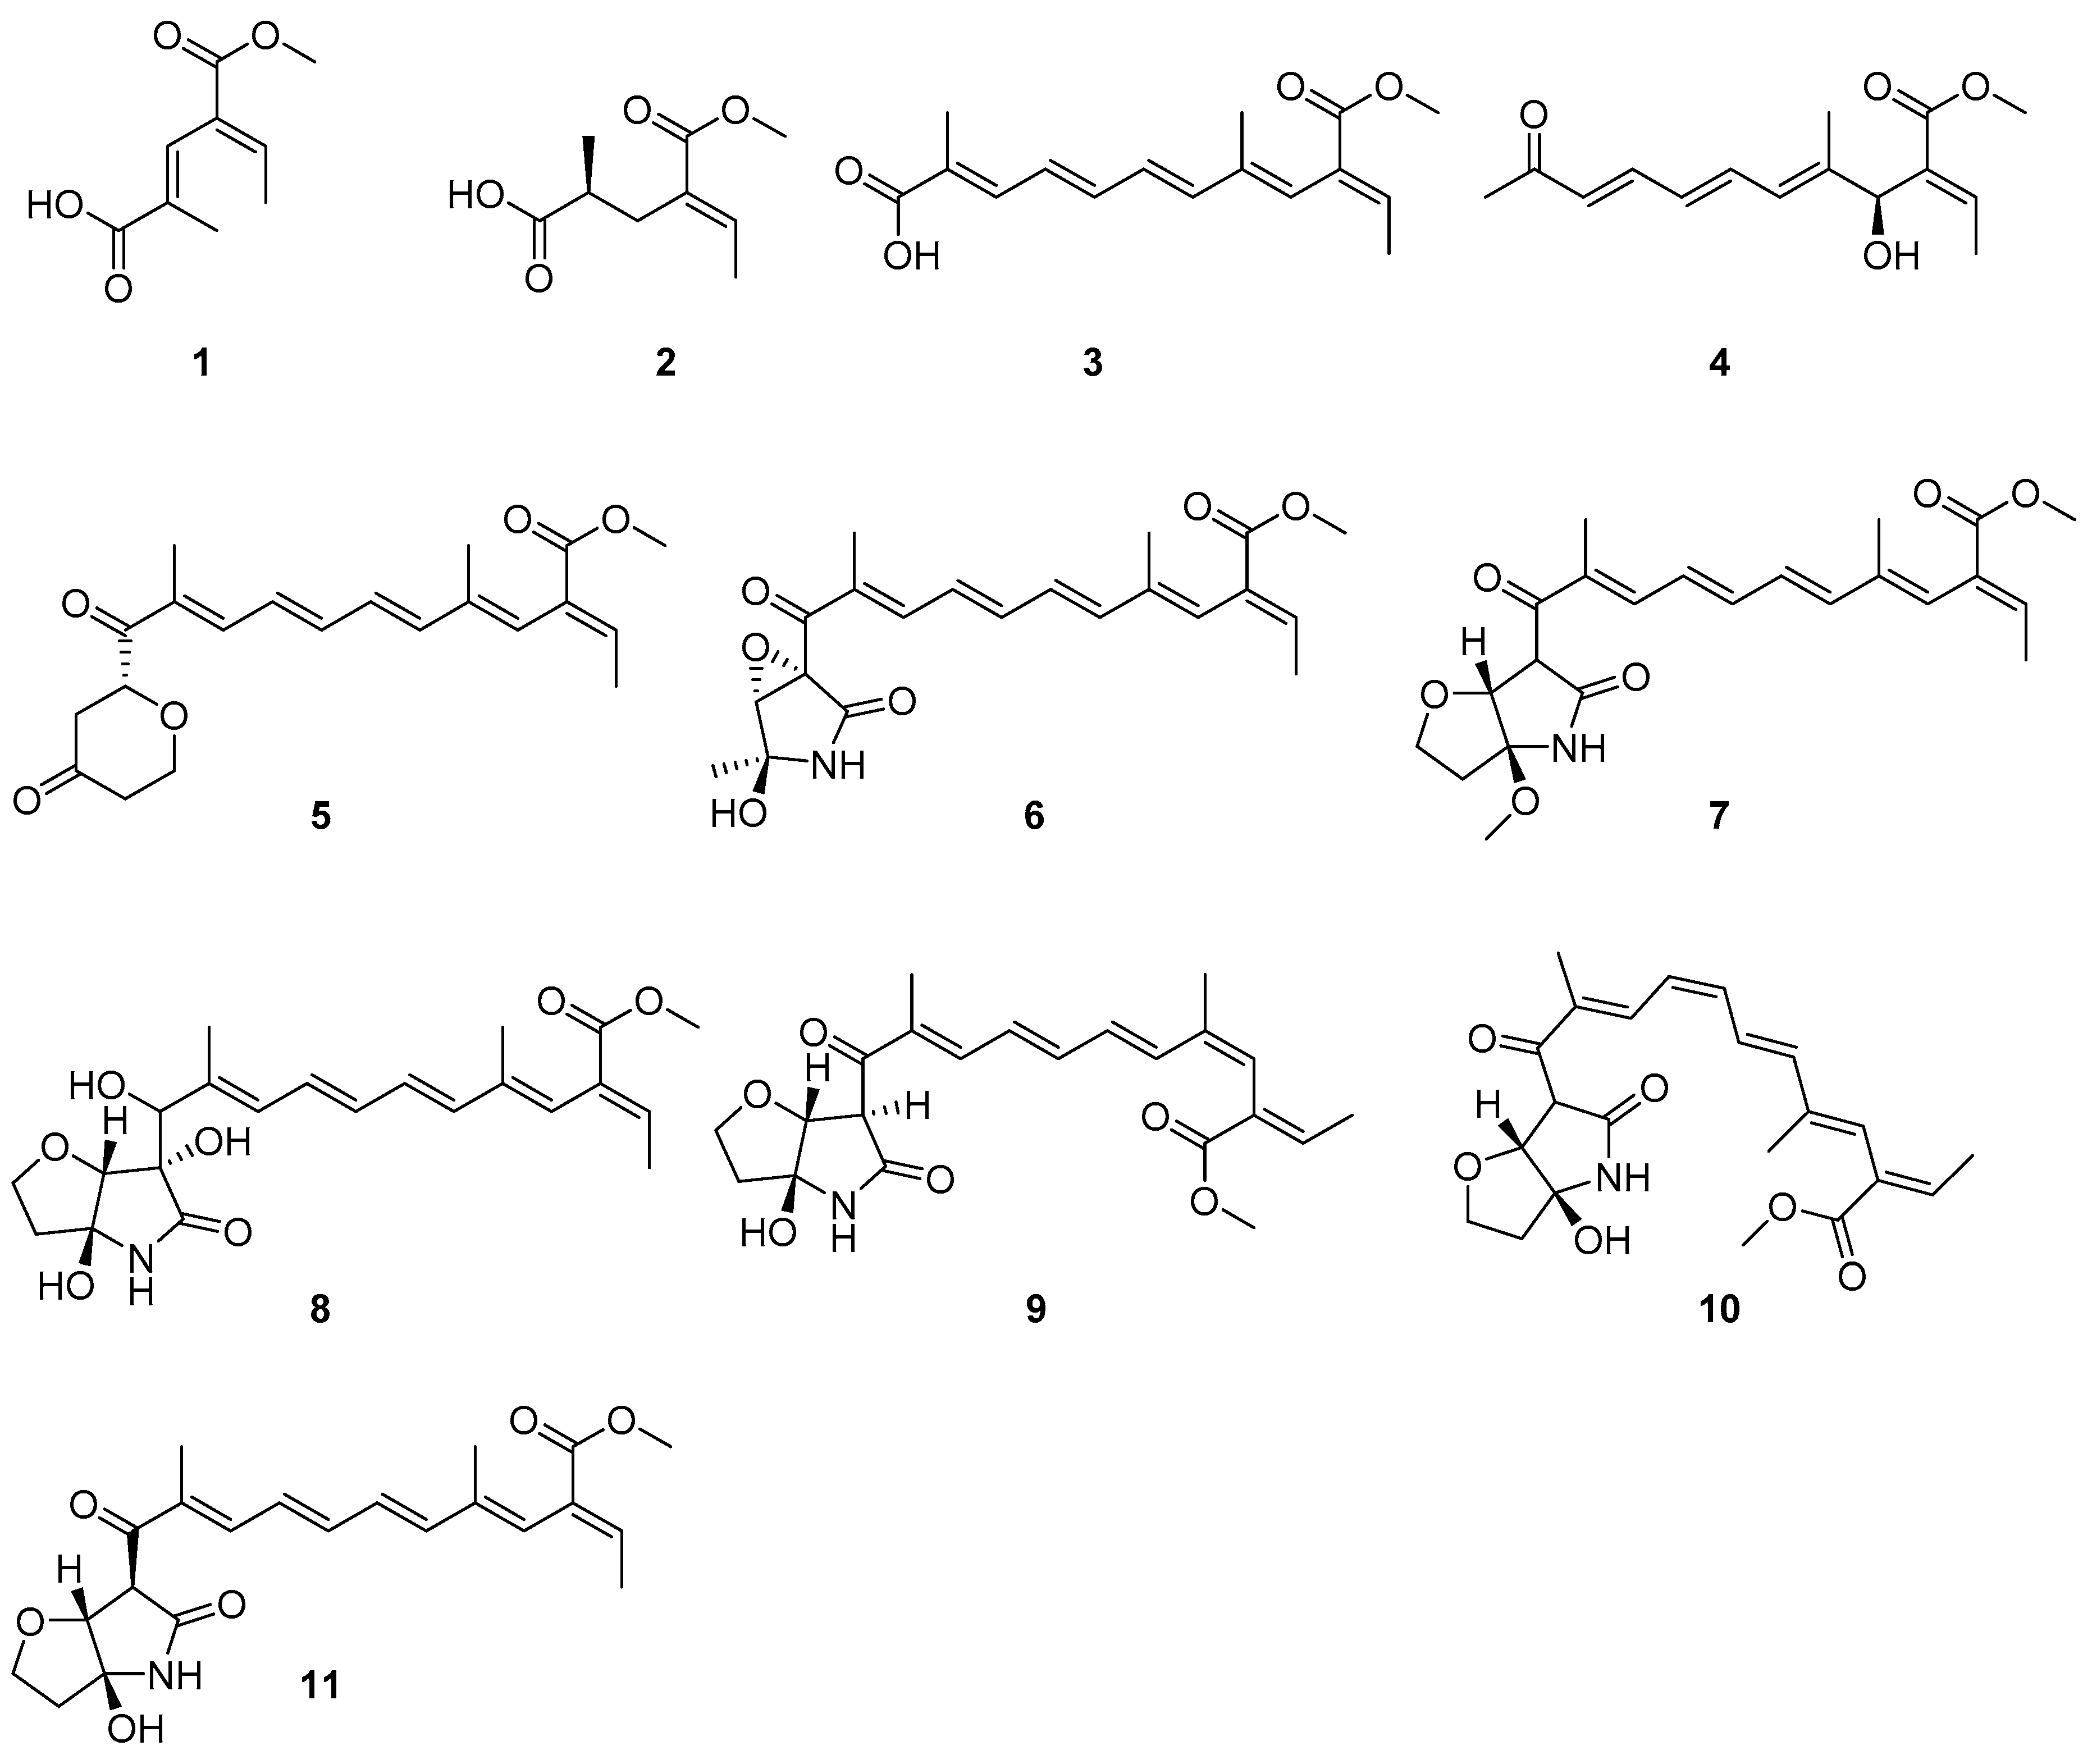
To date, thirteen fusarin-related compounds (belonging to 3-oligoenoyltetramic acids) with a 1-oxopentadienyl substituent at C-3 in the tetramate ring have been discovered in marine microorganisms [11]. In fact, fusarin derivatives have rarely been reported in marine-derived fungi. Recently, the examination of extracts of Fusarium solani 7227, a seawater-derived fungus obtained from the South China Sea, led to the discovery of fusarin-related compounds. Further chemical investigation of this extract led to the isolation of six new fusarin derivatives (1–6) with a polyunsaturated side chain. According to the detailed spectroscopic analysis and by comparison with the reported literature data, the known compounds were identified as 3,5,7,9-undecatetraenoate (7) [12], methyl (2E,3E,5E,7E,9E)-11-((3aS,6S,6aR)-3a,6-dihydroxy-5-oxohexahydro-2H-furo[3,2-b]pyrrol-6-yl)-2-ethylidene-11-hydroxy-4,10-dimethylundeca-3,5,7,9-tetraenoate (8) [13], 4Z-lucilactaene (9), 8Z-lucilactaene (10), and lucilactaene (11) [14], as shown in Figure 2. Herein, we report the isolation, bioactive evaluation, and structure–activity relationships of compounds 1–11 from the marine-derived fungus Fusarium solani 7227.
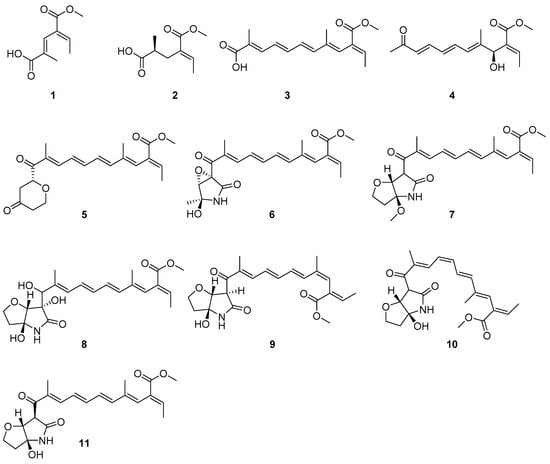
Figure 2.
Structures of compounds 1–11..
2. Results
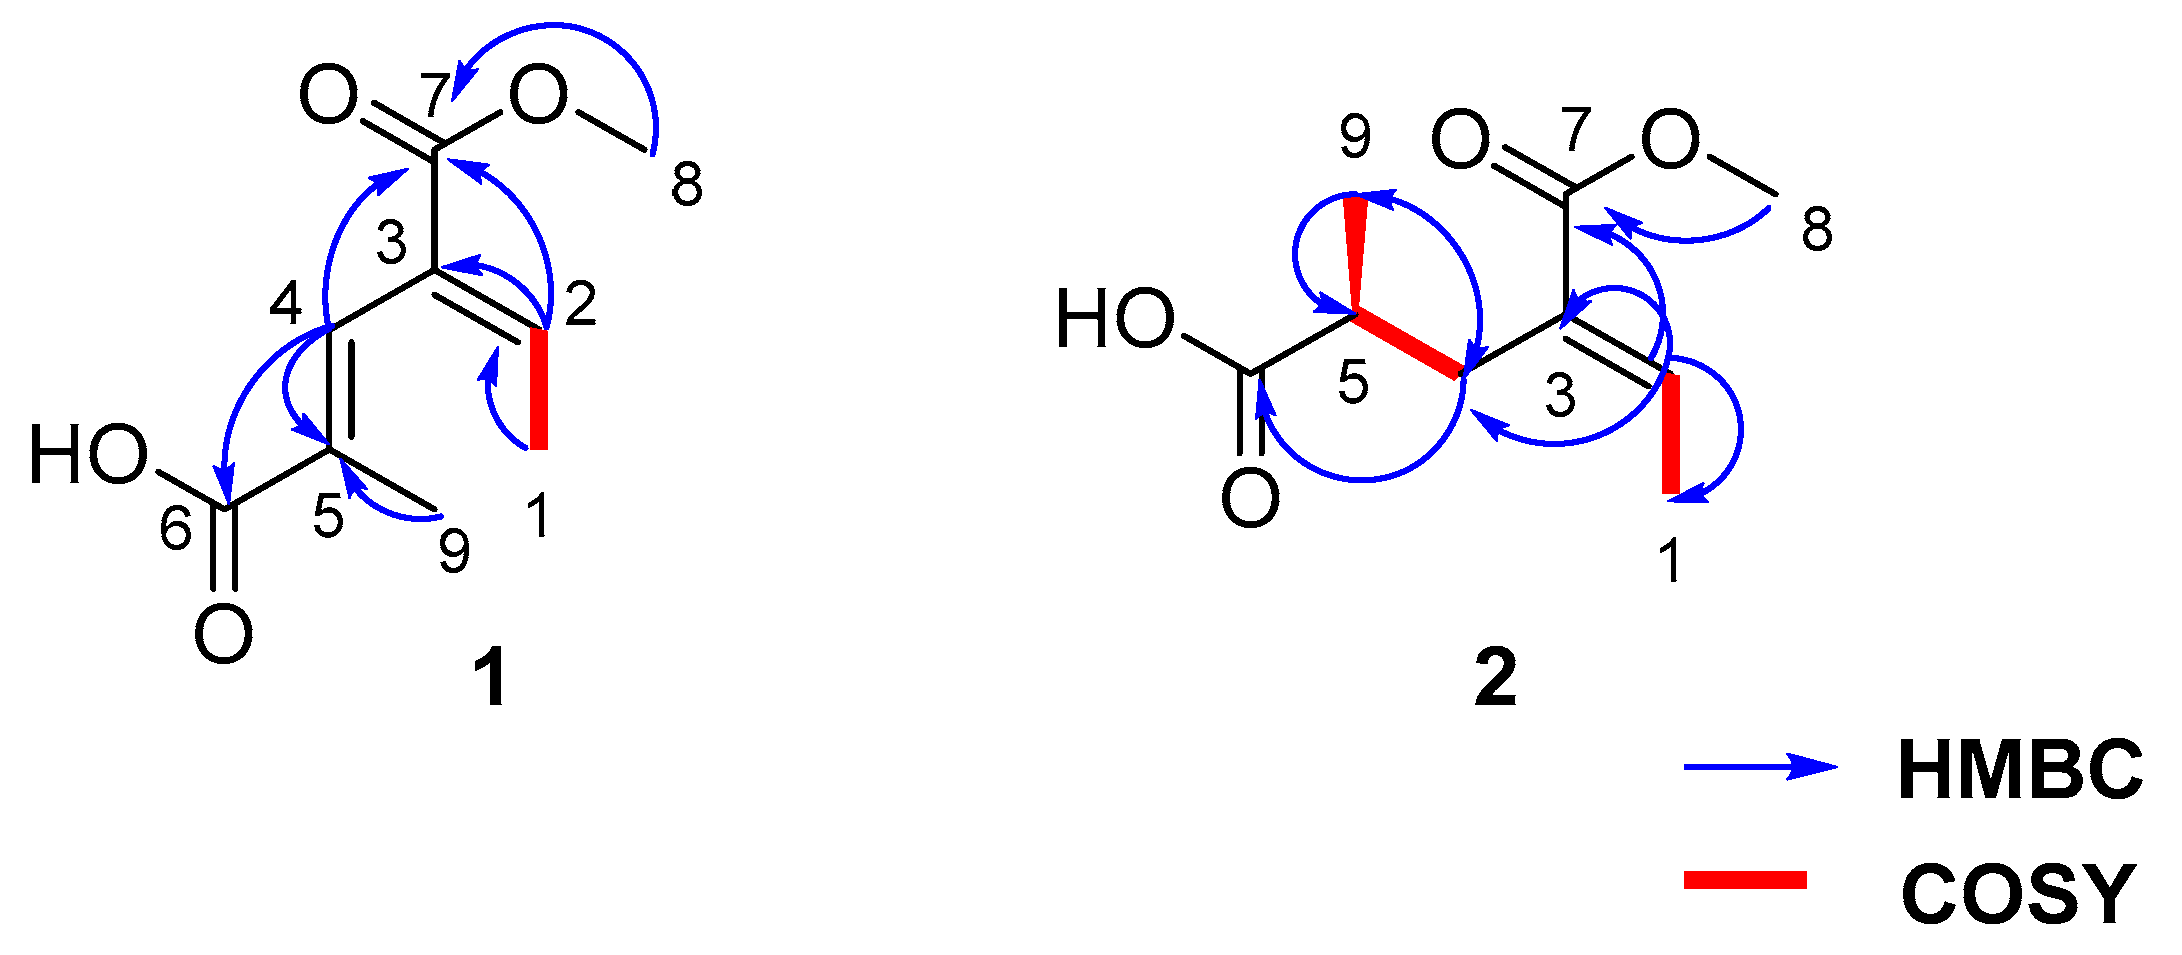
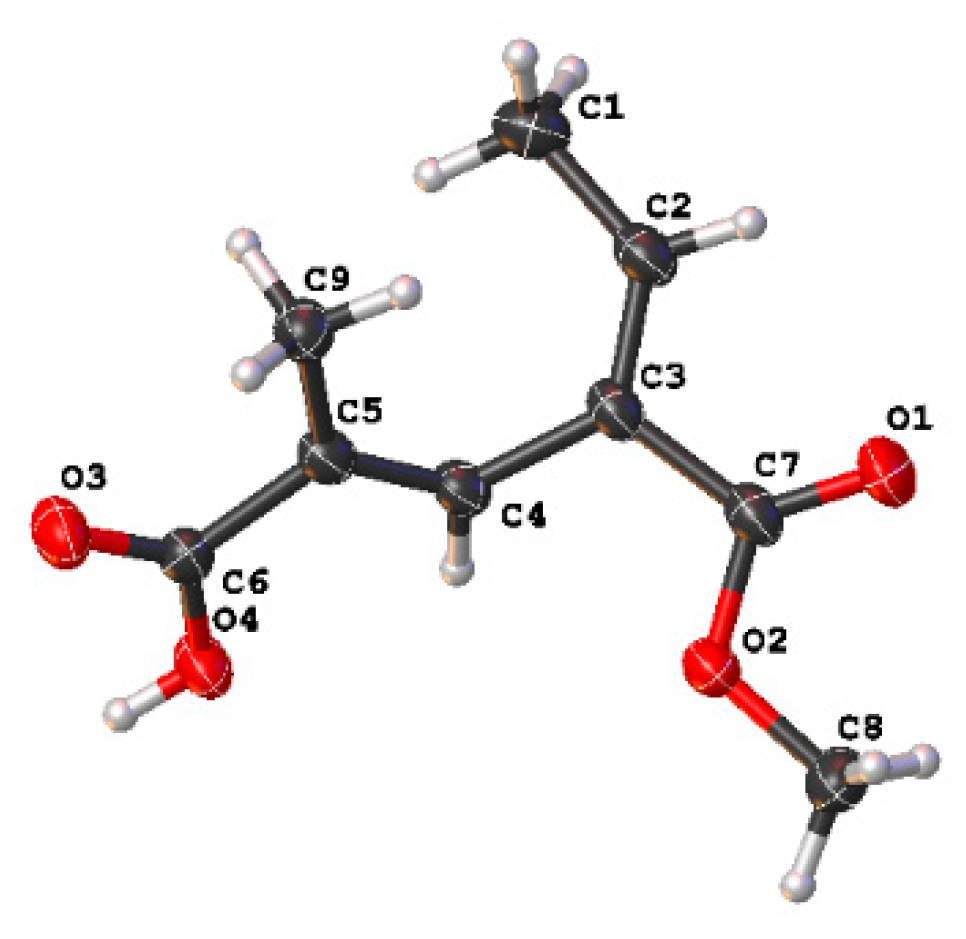
Fusarin G (1) was isolated as a white solid, and 6.4 mg was obtained from 197.9 g of crude extract. HRESIMS gave a molecular formula of C9H11O4, implying four degrees of unsaturation. Based on analysis of the 1H NMR data of 1 (Table 1), there were two olefinic proton signals, δH 7.08 (1H, qd, J = 7.2, 1.1 Hz) and 7.7 (1H, m); two methyls, δH 1.78 (3H, d, J = 1.4 Hz) and 1.76 (3H, d, J = 1.4 Hz); and one methoxy, H-8 δH 3.76 (3H, s). The planar structure of 1 was identified through 1H-1H COSY and HMBC analysis (Figure 3). The core moiety of compound 1, a hexadienoic acid with a 5-substituted methyl, was established by means of HMBC correlations from H-4 to C-2, C-5, and C-6; H-9 to C-4, C-5, and C-6; and H-1 to C-2 and C-3; together with 1H-1H COSY data from H-1 and H-2. A methyl ester was linked to C-3, which was deduced from the HMBC correlation from H-8, H-4 and H-2 to C-7. The structure was further confirmed using X-ray crystallography. The X-ray structure (Figure 4) clearly showed that the geometric configurations were both E; two methyl groups on olefinic carbon were located on the same side but not on the same face with a small angle. The chemical shift of H-2 (δH 7.08) and H-4 (δH 7.36) were downfield shifts, due to the de-shielding effect of carbonyl C-7 (δC 166.7). This suggests that H-2 and H-4 are located on the same side as carbonyl C-7 in liquid.

Table 1.
1H NMR (400 MHz) and 13C NMR (100 MHz) data for 1 and 2 in CDCl3.
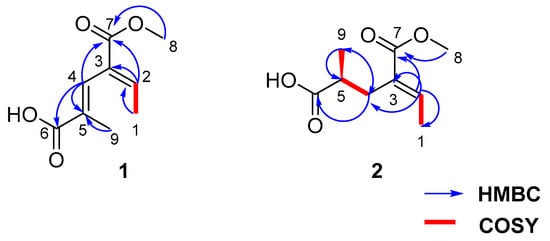
Figure 3.
Structures of 1 and 2 with key COSY and HMBC correlations.
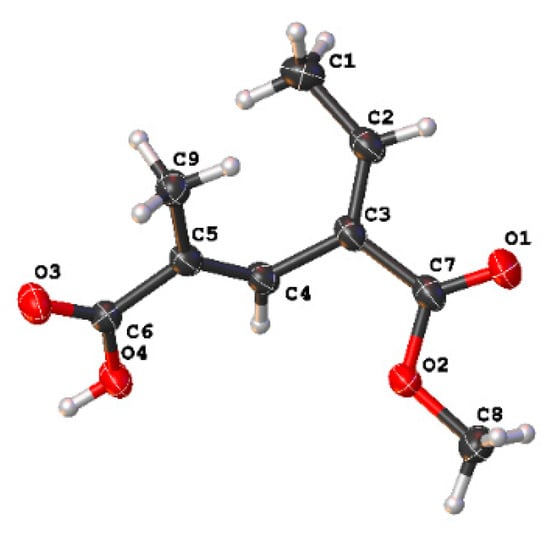
Figure 4.
ORTEP representation of the X-ray crystal structure of 1.
Compound 2 was isolated as a white solid, and 7.3 mg was obtained from 197.9 g of crude extract. HRESIMS provided a molecular formula of C9H14O4. Analysis of the 1H NMR data (Table 1) indicated that the planar structure of 2 was similar to that of 1. This was further supported by HMBC correlations (Figure S15) from H-2 to C-3, C-4, and C-7 and H-4 to C-5, C-6, and C-9, which also revealed the methyl C-9 to be connected to C-5. HMBC correlations also identified a methyl ester at C-3. Based on these data, the structure of 2 was determined as shown in Figure 2. To further identify the absolute configurations of compound 2, we compared the calculated optical rotation of (5S)-2 (+127.5) with the experimental data (+3.7), which indicated that the absolute configuration of 2 was (5S)-2. Compound 2 was named fusarin H.
Compound 3 was obtained as a yellow oil, and 9.8 mg was obtained from 197.9 g of crude extract. The molecular formula of C16H20O4 was deduced from its HRESIMS data. Compared with the NMR data (Table 2) of 2 and 3, compound 3 shares a methyl butenoate fragment. The structural differences were apparent in the 1H-1H COSY NMR data (Figure S25) of 3. These data revealed a spin system comprised of five olefinic hydrogens, H-6, H-7, H-8, H-9, and H-10, indicating that an unsaturated chain existed. HMBC (Figure S24) correlations from H-16 to C-10, C-11, and C-12 and from H-15 to C-6 and C-5 suggested that 3 had a dimethylundecatetraenoic acid chain linked to C-5. At the same time, HMBC correlations from H-4 to C-5 and C-13 were observed. This suggested that C-4 connected with the methyl butyrate moiety at C-3. Therefore, the structure of compound 3 was identified and named fusarin I.

Table 2.
1H NMR (400 MHz) and 13C NMR (100 MHz) data for fusarins I (3) and J (4) in CDCl3.
Compound 4 was isolated as a yellow amorphous solid, and 5.1 mg was obtained from 197.9 g of crude extract. The molecular formula was assigned as C15H20O4 based on HRESIMS data. Compared to the NMR data of 3 (Table 2), 4 showed similar spectroscopic features to 3, which had an unsaturated chain and methyl butyrate moiety. The main difference in compound 4 was the absence of one olefinic proton and carboxyl acid, and the presence of an additional keto carbonyl and a secondary oxygenated carbon. HMBC correlations from H-12 to C-11, C-10, and C-9 revealed that keto carbonyl was located on C-11. In addition, a secondary alcohol was attached to C-4, determined on the basis of the chemical shift of C-4 (δC 71.8, δH 5.06) and the HMBC correlation of H-15 and H-1 with C-4. Hence, the planar structure of compound 4 was deduced, as shown in Figure 5. To further identify the absolute configurations of compound 4, the calculated optical rotation of (4S)-4 (+226.63) was compared with the experimental data (+25.2), which indicated the absolute configuration of 4 was S. Finally, compound 4 was named fusarin J.

Figure 5.
Structures of fusarins I (3) and J (4) with key COSY and HMBC correlations.
Compound 5 was obtained as a yellow amorphous substance, and 1.7 mg was obtained from 197.9 g of crude extract. The molecular formula was assigned as C26H26O5 based on HRESIMS data. The 1D NMR data (Table 3) indicated that compounds 5 and 3 had common fragments, except for the change in the carboxyl group C-12 (δC 196.94), replaced with a γ-pranone unit, which was supported by the 1H-1H COSY (Figure 6) of H-13, H-14 and H-16, H-17, with two spin systems and HMBC correlations (Figure 6) from H-14 to C-12, C-13, and C-15; H-16 to C-15; and H-17 to C-13. To further identify the absolute configurations of compound 5, the calculated optical rotation of (13S)-5 (−309.39) was compared with the experimental data (+1.8), which indicated the absolute configuration of 5 was R. Compound 5 was named fusarin K.

Table 3.
1H NMR (400 MHz) and 13C NMR (100 MHz) data for fusarins K (5) and L (6) in CDCl3.

Figure 6.
Structures of fusarins K (5) and L (6) with key COSY and HMBC correlations.
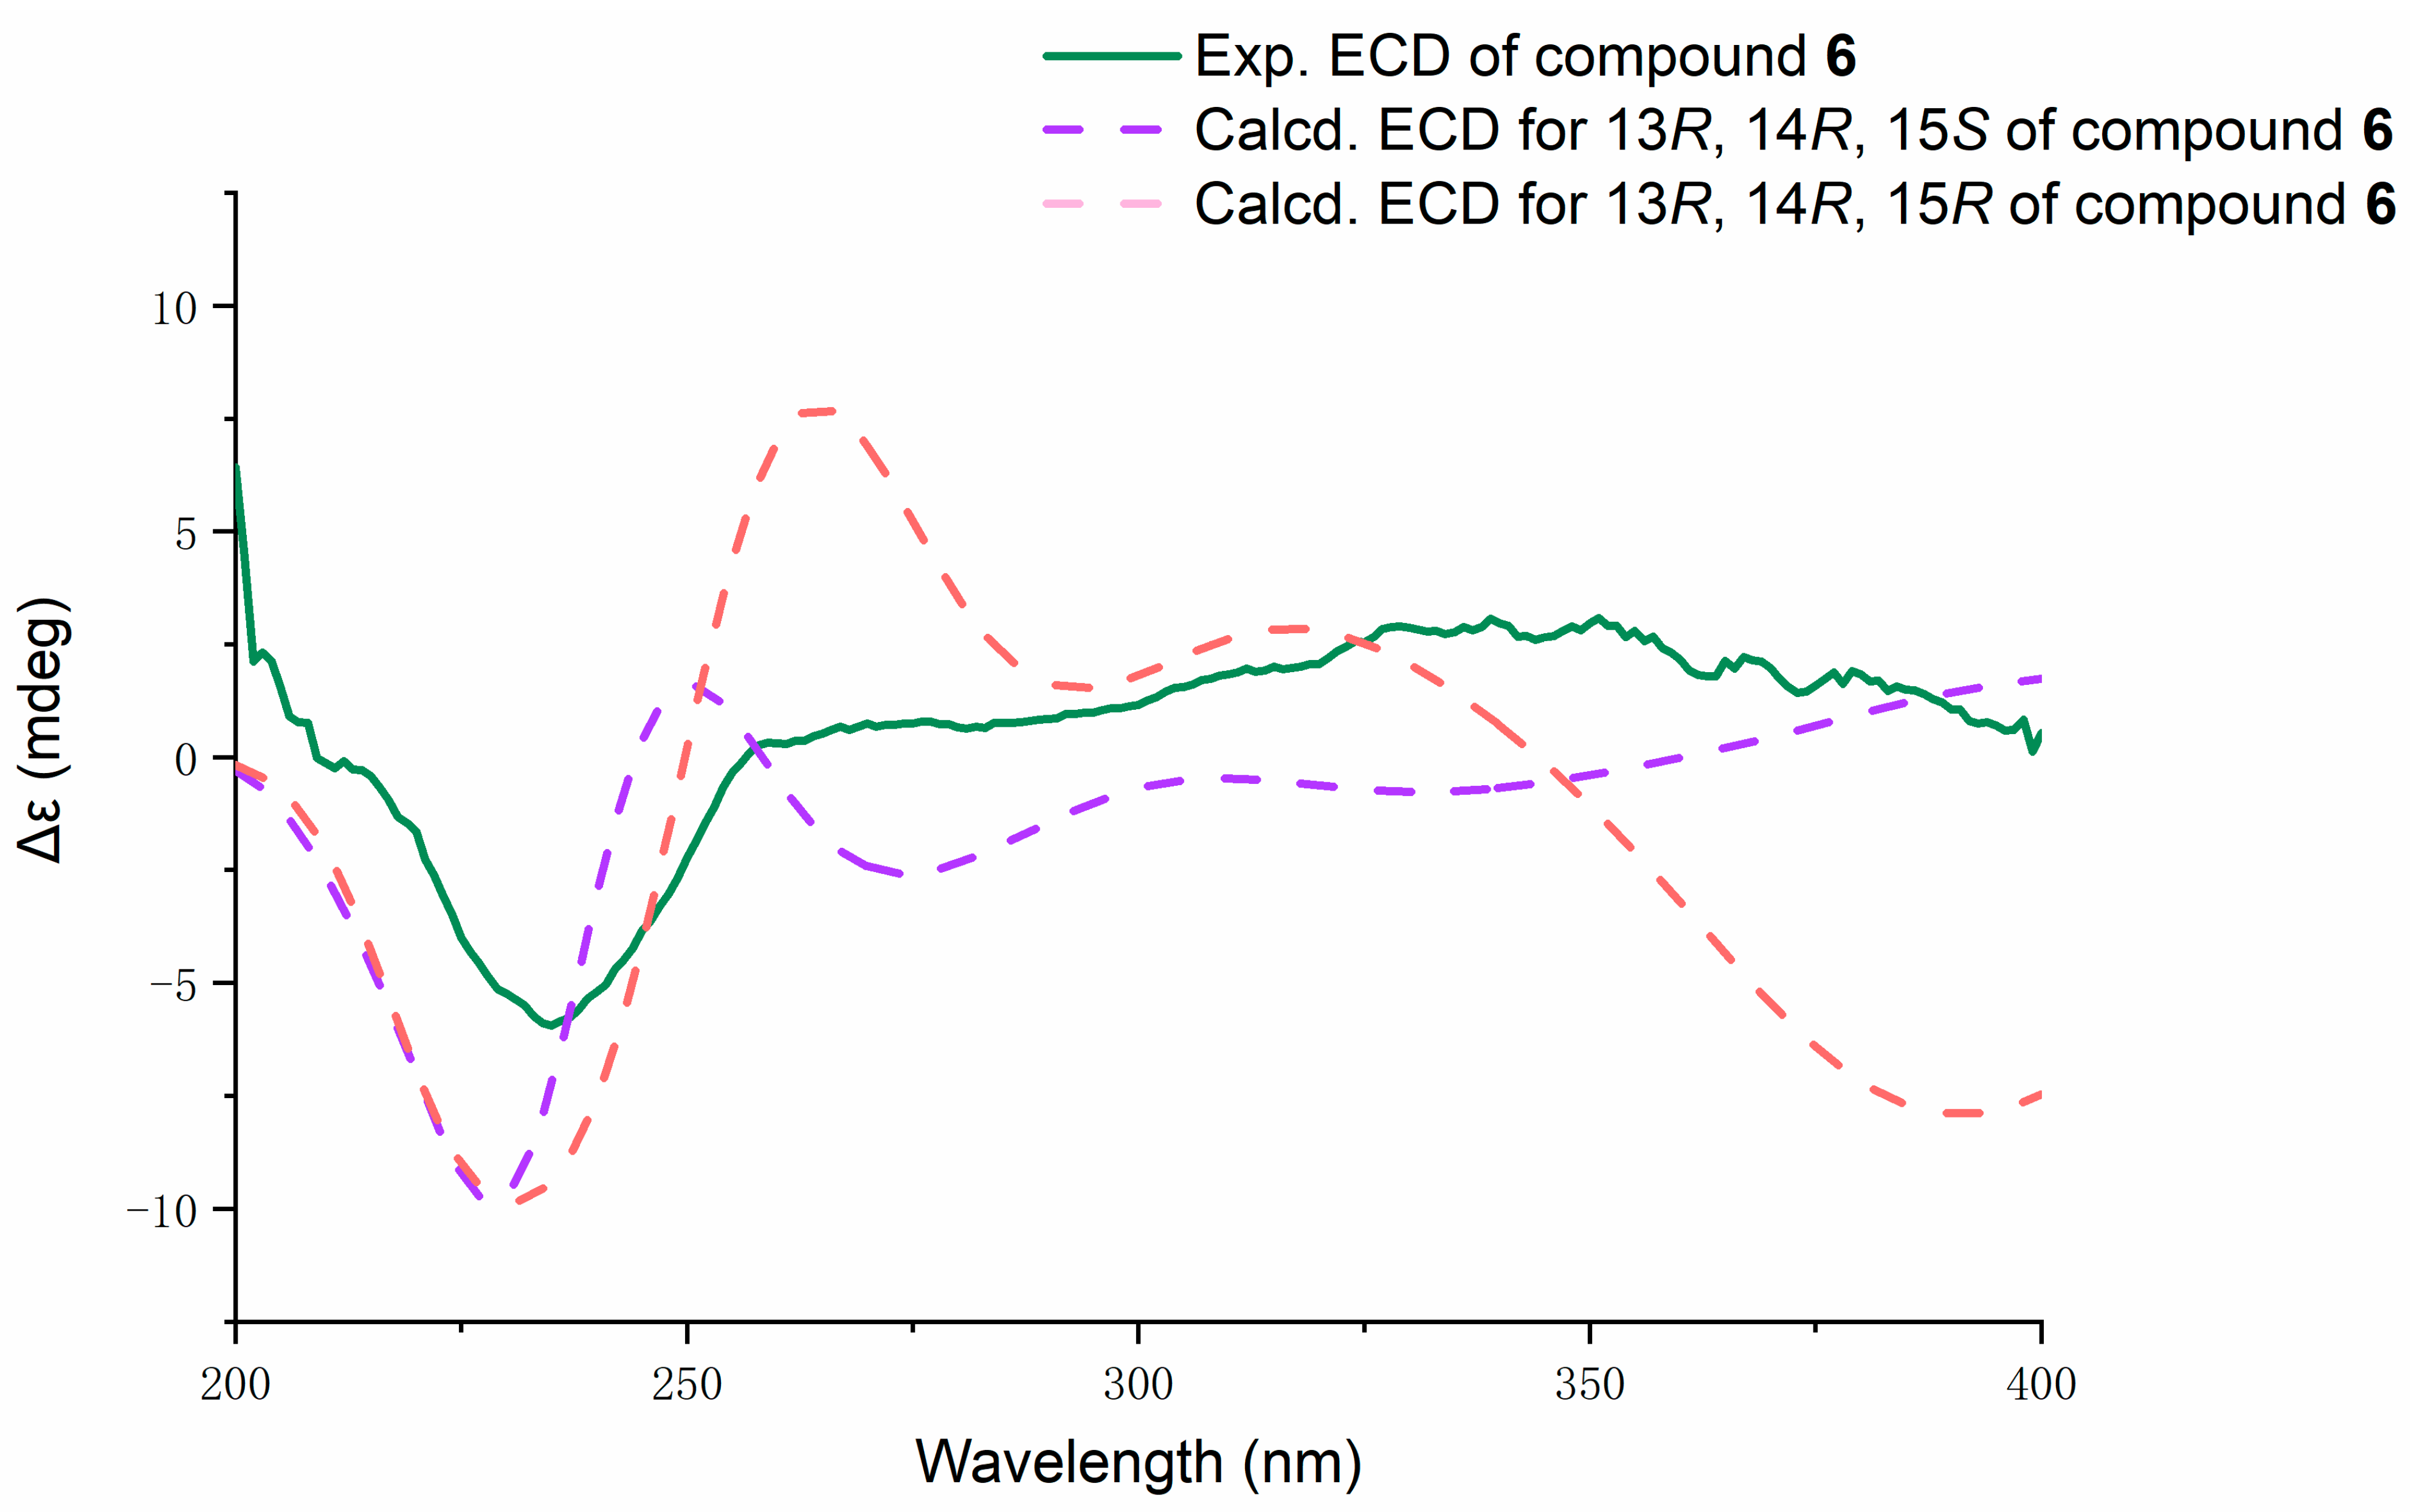
Fusarin L (6) was obtained as a yellow amorphous substance, and 11.3 mg was obtained from 197.9 g of crude extract. HRESIMS analysis gave a molecular formula of C21H24NO6 with 10 degrees of unsaturation. Based on the analysis of 1D and 2D NMR data (Table 3), compound 6 belongs to a fusarin derivative and has a similar structure to that of 5 in the comparison of their NMR data. The HMBC correlations from methyl proton H-17 to C-15 and C-14 and from H-14 to C-13 and C-16 indicated an epoxy-γ-lactam ring with a methyl at C-15, which was linked to keto carbonyl C-11 in compound 6, which replaced a pyrone moiety in compound 5. Hence, the planar structure of 6 was confirmed. The theoretical ECD spectra (Figure 7) of compound 6 were calculated by means of a quantum chemical method at the [b3lyp/6-31+g(d,p)] level for a pair of configurations—13R, 14R, and 15S and 13R, 14R, and 15R. The computed configurations of 13R, 14R, and 15S were well in agreement with the experimental results. Furthermore, the computed optical rotation of (13R, 14R, 15S)-6 with +351.83 was consistent with the experimental value (+44.95). Thus, combined with ECD, ORC, and the literature [13], the absolute configuration of 6 was proposed, with stereochemical assignments of 13R, 14R, and 15S.
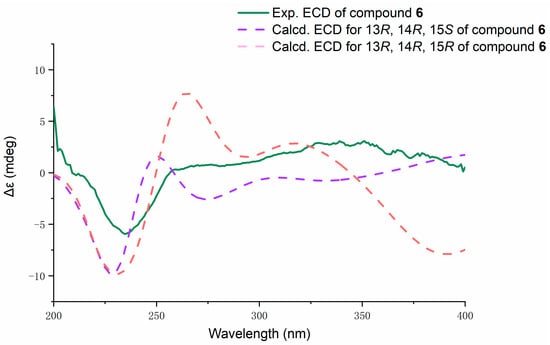
Figure 7.
Experimental ECD spectrum of 6 (green) in methanol with computed spectra of the enantiomers 13R, 14R, and 15R and 13R, 14R, and 15S at the b3lyp/6-31+g(d,p) level of theory. Red dotted line: 13R, 14R, and 15R; purple dotted line: 13R, 14R, and 15S.
All the compounds were evaluated for their inhibition of nitric oxide (NO) production in RAW264.7 cells activated by lipopolysaccharide (LPS) using the Griess assay with indomethacin as a positive control (Table 4). Compounds 9, 10, and 11 displayed strong inhibition of nitric oxide (NO) production, with IC50 values of 7.6, 3.6, and 8.4 μM, respectively, whereas compounds 2, 3, 4, and 5 showed moderate anti-inflammatory activity, with IC50 values of 22.3, 13.1, 13.9, and 21.9 μM. In comparing the anti-inflammatory activity of fusarins G and H, 2 showed much stronger activity than that of 1, indicating that the double bond (C4–C5) of 1 is a disadvantage in terms of anti-inflammatory activity. Compound 5 exhibited stronger anti-inflammatory effects than those of 6, indicating that the pyrone moiety made a more positive contribution to the anti-inflammatory activity than the epoxy-γ-lactam ring.

Table 4.
Inhibitory activity of all compounds 1–11 against lipopolysaccharide (LPS)-induced NO production in the murine macrophage cell line (RAW 264.7 cells).
3. Materials and Methods
3.1. General Experimental Procedures
One-dimensional and two-dimensional NMR spectra were acquired in CDCl3 with a Bruker Avance 400 MHz NMR spectrometer (Fällanden, Switzerland). HR–ESI–MS data were measured using a maXis Q-TOF mass spectrometer in positive ion mode (Bruker, Fällanden, Switzerland). UV and CD spectra were acquired using a JASCO J-810 circular dichroism spectrometer (JASCO International Co. Ltd., Hachioji, Tokyo, Japan). X-ray diffraction intensity data were recorded on an XtalLAB PRO single-crystal diffractometer, using Cu-Kα radiation (Rigaku, Japan). The data were corrected for absorption, using CrysAlisPro 1.171.39.33c (Rigaku Oxford Diffraction, 2017). Optical rotations were acquired using an MCP-500 polarimeter with a 1.0 mL cell (Anton, Austria). HPLC was performed on the Hitachi Primaide with the YMC ODS SERIES column (YMC-Pack ODS-A, YMC Co. Ltd., Kyoto, Japan, 250 × 10 mm I.D., S-5 μm, 12 nm). Column chromatography (CC) was carried out on silica gel (200–300 mesh, Qingdao Marine Chemical Factory, Qingdao, China) and Sephadex LH-20 (40–70 μm, Amersham Pharmacia Biotech AB, Uppsala, Sweden). TLC plates with silica gel GF254 (0.4–0.5 mm, Qingdao Marine Chemical Factory, Qingdao, China) were used for the analyses.
3.2. Fungal Isolation and Fermentation
Fusarium solani 7227 was isolated from a seawater sample collected in February 2018 from the South China Sea. The fungus was identified as Fusarium solani by morphological observation and analysis of the internal transcribed spacer (ITS) regions of its rDNA, the sequence data of which were deposited in GenBank with the accession number MN922526. The strain was grown on PDA plates at 28 °C for 5 days; then it was cut into small pieces and inoculated into 1.5 L of PDA medium as a seed liquid at 28 °C for 2 days in a shaker; then poured in 5–10 mL of seed liquid into 180 6-inch plates of sterilized rice medium (rice 60 g, 0.3% salinity water 60 mL) for fermentation at 28 °C for 28 days.
3.3. Extraction and Isolation
The fermented material was extracted with EtOAc under ultrasonication, then concentrated under reduced pressure to afford 197.9 g of a crude extract. The crude extract was subjected to silica gel column chromatography (CC) (9 × 40 cm, 700 g), using gradient mixtures of PE (petroleum ether)/EtOAc (60:1 to 1:9), followed by 100% CH3OH, to afford 4 major subfractions (Fr. 1–Fr. 4).
Fr. A was fractionated using CC on silica gel (300–400 mesh) and eluting with PE/EA (from 9:1 to 1:1), to afford 2 fractions, Fr. A-1 and Fr. A-2. Those two fractions were further separated on Sephadex LH-20 (CH2Cl2/MeOH v/v, 1:1). Fr. A-1 was purified by means of NP-HPLC (n-hexane: IPA (isopropyl alcohol) v/v, 99:1, flow rate 2.0 mL/min) to obtain 1 (tR 24.5 min, 4.6 mg) and 2 (tR 21.9 min, 7.3 mg). Fr. A-2 was purified by means of NP-HPLC (n-hexane: IPA v/v, 97:3, flow rate 2.0 mL/min) to obtain 3 (tR 21.2 min, 9.8 mg). Fr. B was separated with Sephadex LH-20 (CH2Cl2/MeOH v/v, 1:1) to afford Fr. B-1 and Fr. B-2. Fr. B-1 was further purified by means of NP-HPLC (n-hexane: IPA v/v, 94:6, flow rate 2.0 mL/min) to obtain 4 (tR 21.2 min, 5.1 mg), and Fr. B-2 was purified by means of NP-HPLC (n-hexane: IPA v/v, 9:1, flow rate 2.0 mL/min) to obtain 5 (tR 19.1 min, 1.7 mg). Compounds 1–5 were purified by means of analytical NP-HPLC (Venusil XBP Silica column 4.6 × 250 mm, 5 μm). Fr. C was subjected to Sephadex LH-20 (CH2Cl2/MeOH v/v, 1:1) to obtain Fr. C-1 and Fr. C-2. Fr. C-1 was subjected to silica gel CC with PE/EA (from 4:1 to 2:3), resulting in two further subfractions, Fr. C-1-1 and Fr. C-1-2. Compound 6 (tR 14.0 min, 11.3 mg) was separated by means of semipreparative NP-HPLC (Venusil XBP Silica column 10 × 250 mm, 5 μm) and eluted with n-hexane: IPA v/v, 94:6 with flow rate 2.0 mL/min from Fr. C-1-1. The purification of Fr.1-2 was performed by means of RP-HPLC (H2O: MeOH v/v, 3:7, flow rate, 4.0 mL/min), affording compounds 9 (tR 10.2 min, 2.8 mg) and 10 (tR 8.2 min, 5.3 mg). Fr. C-2 was subjected to the same process as that used for Fr. C-1, affording Fr. C-2-1 and Fr. C-2-2. Fr. C-2-1 was purified by means of RP-HPLC (H2O: MeOH v/v, 34:66, flow rate 4.0 mL/min), affording compounds 7 (tR 13.8 min, 6.9 mg) and 11 (tR 11.0 min, 6.1 mg). Fr. C-2-2 was purified by means of RP-HPLC (H2O: MeOH v/v, 4:1, flow rate 3.0 mL/min), affording compound 6 (tR 9.5 min, 11.3 mg). Compounds 6–11 were purified by means of analytical NP-HPLC (Venusil XBP Silica column 4.6 × 250 mm, 5 μm).
Compound 1: colorless crystal; UV (MeOH) λmax (log ε) 203 (4.2) nm; IR (neat) νmax 723, 761, 817, 904, 943, 979, 1025, 1060, 1135, 1267, 1328, 1384, 1438, 1637, 1718, 2954 cm−1 (Figure S1); 1H NMR (CDCl3, 400 MHz) and 13C NMR (CDCl3, 100 MHz), see Table 1; HRESIMS m/z 183.0662 [M − H]− (calcd. for C9H11O4, 183.0663).
Compound 2: Yellow amorphous solid; [α +3.7 (c 0.1, MeOH); UV (MeOH) λmax (log ε) 212 (3.6) nm; IR (neat) νmax 767, 825, 860, 892, 952, 993, 1026, 1093, 1213, 1249, 1272, 1378, 1405, 1438, 1459, 1712, 2854, 2925, 3438 cm−1 (Figure S18); 1H NMR (CDCl3, 400 MHz) and 13C NMR (CDCl3, 100 MHz), see Table 1; HRESIMS m/z 185.08198 [M − H]− (calcd. for C9H13O4, 185.08193).
Compound 3: Yellow amorphous solid; UV (MeOH) λmax (log ε) 335(3.8), 212(3.5) nm; IR (neat) νmax 1413, 1467, 1629, 1652, 2844, 2914, 3180, 3349 cm−1 (Figure S27); 1H NMR (CDCl3, 400 MHz) and 13C NMR (CDCl3, 100 MHz), see Table 2; HRESIMS m/z 275.12920 [M − H]− (calcd. for C16H19O4, 276.12888).
Compound 4: Yellow amorphous solid; [α +25.2 (c 0.1, MeOH); UV (MeOH) λmax (log ε) 208(3.5), 270(3.2), 323(3.3) nm; IR (neat) νmax 763, 902, 964, 998, 1045, 1072, 1133, 1191, 1255, 1294, 1361, 1436, 1515, 1573, 1602, 1637, 1664, 1708, 2852, 2917, 2952, 3457 cm−1 (Figure S36); 1H NMR (CDCl3, 400 MHz) and 13C NMR (CDCl3, 100 MHz), see Table 2; HRESIMS m/z 287.1250 [M + Na]+ (calcd. for C15H20NaO4, 287.1254).
Compound 5: Yellow amorphous solid; [α +1.8 (c 0.1, MeOH); UV (MeOH) λmax (log ε) 207(3.85) nm; IR (neat) νmax 732, 765, 838, 883, 995, 1033, 1058, 1093, 1151, 1255, 1376, 1400, 1436, 1589, 1660, 1716, 1754, 2854, 2925, 2950, 3473 cm-1 (Figure S45); 1H NMR (CDCl3, 400 MHz) and 13C NMR (CDCl3, 100 MHz), see Table 3; HRESIMS m/z 359.18512 [M − H]− (calcd. for C21H27O5, 358.1853).
Compound 6: Yellow amorphous solid; [α +44.95 (c 0.1, MeOH); UV (MeOH); CD (MeOH) λmax (Δε) 235 (−5.9); λmax (log ε) 365(3.47) nm; IR (neat) νmax 729, 765, 881, 948, 997, 1029, 1066, 1128, 1155, 1261, 1324, 1380, 1434, 1714, 2854, 2923, 3398 cm−1 (Figure S54); 1H NMR (CDCl3, 400 MHz) and 13C NMR (CDCl3, 100 MHz), see Table 3; HRESIMS m/z 386.16132 [M − H]− (calcd. for C21H24NO6, 387.16091).
3.4. Computational Detail
In optical rotation and ECD calculations, conformational analysis of compounds was performed using Spartan’14 software (Wavefunction Inc., Irvine, CA, USA) in the MMFF force field and the b3lyp/6-31+g(d,p) level was used to optimize the conformers, using this approach with the solvent model for MeOH [15,16]. Conformers with Boltzmann distributions over 5% were selected for ECD and OR calculations in methanol at the b3lyp/6-31+g(d,p) level. The ECD and OR spectra were generated using the programs SpecDis 1.71 (University of Würzburg, Würzburg, Germany) and OriginPro 2021 (OriginLab, Ltd., Northampton, MA, USA) based on dipole-length rotational strengths by applying Gaussian band shapes with sigma = 0.30 ev [17,18]. The optical rotations were calculated using time-dependent density functional theory. The b3lyp/6-31+g(d,p) level was employed in methanol for calculating optical rotations at A = 589.3 nm. All the calculations were performed using Tianhe-2 in the National Super Computer Center in Guangzhou.
3.5. Crystal Structure Analysis
Colorless crystals of compound 1 were obtained from a solvent of chloroform. Crystal data were acquired using the hemisphere technique on a Rigaku Oxford Diffraction diffractometer with graphite-monochromated Cu-Kα (radiation λ = 1.54178 Å). The structure was solved by means of direct methods using SHELXT; refinement was carried out by full-matrix least squares on F2, using the SHELXT program suite on Olex2 Launcher [19,20].
Crystal Data of 1—C9H10O4 (M = 182.17 g/mol): monoclinic, space group P21/c (no. 14), a = 6.4187(2) Å, b = 28.6008(9) Å, c = 4.7982(2) Å, β = 99.313(3)°, V = 869.24(5) Å3, Z = 4, T = 150.01(11) K, μ(Cu-Kα) = 0.935 mm−1, Dcalc = 1.392 g/cm3, 3075 reflections measured (12.38° ≤ 2θ ≤ 147.79°), 1688 unique (Rint = 0.0306, Rsigma = 0.0447), which were used in all calculations. The final R1 was 0.0439 (I > 2σ(I)) and wR2 was 0.1396 (all data). Crystallographic data for 1 have been deposited in the Cambridge Crystallographic Data Center as supplementary publication number CCDC 1989670.
3.6. Anti-Inflammatory Activity
Evaluation of their inhibition of nitric oxide (NO) production in RAW264.7 cells activated by lipopolysaccharide (LPS) was carried out using the Griess assay with indomethacin as a positive control, according to a previous report [21]. RAW264.7 cells were purchased from the cell bank of the Chinese Academy of Sciences.
4. Conclusions
In this study, a chemical investigation on the secondary metabolites of Fusarium solani 7227, isolated from seawater in the South China Sea, led to the isolation of compounds 1–11. Among the isolates, compounds 1 and 2 were found to be possible precursor compounds and compounds 3–6 were a series of new fusarin-related compounds with a polyunsaturated side chain. Together with the known compounds 7–11, all compounds were evaluated for their inhibition of NO production in RAW264.7 cells activated by LPS. Compounds 2–5 and 7–11 displayed potent anti-inflammatory activity, with IC50 values ranging from 3.6 to 32.2 μM. A preliminary structure–activity relationship analysis indicated that the anti-inflammatory activities depend on the double bonds between C-4 and C-5 for compounds 1 and 2 and on the substitution group of the polyunsaturated chain for compounds 3–11.
Supplementary Materials
The following are available online at https://www.mdpi.com/article/10.3390/md19060305/s1, Figures S1–S54: 1H NMR, 13C NMR, DEPT, HSQC, HMBC, COSY, IR, and HRESIMS spectra of compounds 1−6. Figures S55–S59: The optimized low energy conformers of compounds 2, 4, 5, and 6. Tables S1–S5 Energy analysis for the conformers of compounds (5S)-2, (4S)-4, (13S)-5, and (13R, 14R, 15S)-6 and (13R, 14R, 15R)-6.
Author Contributions
Conceptualization, J.L.; methodology, G.L.; formal analysis, G.L., S.C., Q.W., and J.L.; investigation, G.L. and L.Z.; resources, G.L.; data curation, G.L. and Q.W.; writing—original draft preparation, G.L.; writing—review and editing, S.C.; visualization, G.L.; supervision, J.L.; funding acquisition, J.L. and L.L. All authors have read and agreed to the published version of the manuscript.
Funding
This work was supported by the National Key R&D Program of China (grant no. 2019YFC0312501), the National Natural Science Foundation of China (no. 41606167), and the Guangdong Marine Economy Promotion Projects Fund (no. GDOE[2019]A21).
Institutional Review Board Statement
Not applicable.
Informed Consent Statement
Not applicable.
Data Availability Statement
Data is contained within the article or supplementary material.
Acknowledgments
We are grateful to the staff of the instrumental analysis and research center (Ling Fang, Xinhai Zhu, et al.) at Sun Yat-Sen University and the analytical facilities (Aijun Sun, Xuan Ma, et al.) at SCSIO.
Conflicts of Interest
The authors declare no conflict of interest.
References
- Nash, S.M.; Snyder, W.C. Quantitative and qualitative comparisons of Fusarium populations in cultivated fields and noncultivated parent soils. Can. J. Bot. 1965, 43, 939–945. [Google Scholar] [CrossRef]
- Thrane, U. Screening for Fusarin C production by European isolates of Fusarium species. Mycotoxin Res. 1988, 4, 2–10. [Google Scholar] [CrossRef]
- Kakeya, H.; Takahashi, I.; Okada, G.; Isono, K.; Osada, H. Epolactaene, a novel neuritogenic compound human neuroblastoma-cells, produced by a marine fungus. J. Antibiot. 1995, 48, 733–735. [Google Scholar] [CrossRef] [PubMed]
- Kleigrewe, K.; Aydin, F.; Hogrefe, K.; Piecuch, P.; Bergander, K.; Wuerthwein, E.-U.; Humpf, H.-U. Structure Elucidation of New Fusarins Revealing Insights in the Rearrangement Mechanisms of the Fusarium Mycotoxin Fusarin C. J. Agric. Food Chem. 2012, 60, 5497–5505. [Google Scholar] [CrossRef]
- Lam, Y.T.; Hensens, O.; Ransom, R.; Giacobbe, R.; Polishook, J.; Zink, D. L-755,807, A new non-peptide bradykinin binding inhibitor from an endophytic Microsphaeropsis sp. Tetrahedron 1996, 52, 1481–1486. [Google Scholar] [CrossRef]
- Krasnoff, S.B.; Sommers, C.H.; Moon, Y.-S.; Donzelli, B.G.G.; Vandenberg, J.D.; Churchill, A.C.L.; Gibson, D.M. Production of mutagenic metabolites by Metarhizium anisopliae. J. Agric. Food Chem. 2006, 54, 7083–7088. [Google Scholar] [CrossRef] [PubMed]
- Coleman, R.S.; Walczak, M.C.; Campbell, E.L. Total synthesis of lucilactaene, a cell cycle inhibitor active in p53-inactive cells. J. Am. Chem. Soc. 2005, 127, 16038–16039. [Google Scholar] [CrossRef] [PubMed]
- Kato, S.; Motoyama, T.; Futamura, Y.; Uramoto, M.; Nogawa, T.; Hayashi, T.; Hirota, H.; Tanaka, A.; Takahashi-Ando, N.; Kamakura, T.; et al. Biosynthetic gene cluster identification and biological activity of lucilactaene from Fusarium sp. RK97-94. Biosci. Biotechnol. Biochem. 2020, 84, 1303–1307. [Google Scholar] [CrossRef] [PubMed]
- Kakeya, H.; Kageyama, S.; Nie, L.; Onose, R.; Okada, G.; Beppu, T.; Norbury, C.J.; Osada, H. Lucilactaene, a new cell cycle inhibitor in p53-transfected cancer cells, produced by a Fusarium sp. J. Antibiot. 2001, 54, 850–854. [Google Scholar] [CrossRef] [PubMed][Green Version]
- Hayashi, Y.; Yamaguchi, J.; Shoji, M. The diastereoselective asymmetric total synthesis of NG-391, a neuronal cell-protecting molecule. Tetrahedron 2002, 58, 9839–9846. [Google Scholar] [CrossRef]
- Jiang, M.; Chen, S.; Li, J.; Liu, L. The Biological and Chemical Diversity of Tetramic Acid Compounds from Marine-Derived Microorganisms. Mar. Drugs 2020, 18, 114. [Google Scholar] [CrossRef] [PubMed]
- Yamaguchi, J.; Kakeya, H.; Uno, T.; Shoji, M.; Osada, H.; Hayashi, Y. Determination by asymmetric total synthesis of the absolute configuration of lucilactaene, a cell-cycle inhibitor in p53-transfected cancer cells. Angew. Chem. Int. Ed. 2005, 44, 3110–3115. [Google Scholar] [CrossRef] [PubMed]
- Kyekyeku, J.O.; Kusari, S.; Adosraku, R.K.; Bullach, A.; Golz, C.; Strohmann, C.; Spiteller, M. Antibacterial secondary metabolites from an endophytic fungus, Fusarium solani JK10. Fitoterapia 2017, 119, 108–114. [Google Scholar] [CrossRef] [PubMed]
- Maharjan, S.; Lee, S.B.; Kim, G.J.; Cho, S.J.; Nam, J.-W.; Chin, J.; Choi, H. Isolation of Unstable Isomers of Lucilactaene and Evaluation of Anti-Inflammatory Activity of Secondary Metabolites Produced by the Endophytic Fungus Fusarium sp. QF001 from the Roots of Scutellaria baicalensis. Molecules 2020, 25, 923. [Google Scholar] [CrossRef] [PubMed]
- Li, X.-C.; Ferreira, D.; Ding, Y. Determination of absolute configuration of natural products: Theoretical calculation of electronic circular dichroism as a tool. Curr. Org. Chem. 2010, 14, 1678–1697. [Google Scholar] [CrossRef] [PubMed]
- Stephens, P.; Devlin, F.; Cheeseman, J.; Frisch, M.; Rosini, C. Determination of absolute configuration using optical rotation calculated using density functional theory. Org. Lett. 2002, 4, 4595–4598. [Google Scholar] [CrossRef] [PubMed]
- Bruhn, T.; Schaumlöffel, A.; Hemberger, Y.; Bringmann, G. SpecDis: Quantifying the comparison of calculated and experimental electronic circular dichroism spectra. Chirality 2013, 25, 243–249. [Google Scholar] [CrossRef] [PubMed]
- Frisch, M.J.; Trucks, G.W.; Schlegel, H.B.; Scuseria, G.E.; Robb, M.A.; Cheeseman, J.R.; Scalmani, G.; Barone, V.; Petersson, G.A.; Nakatsuji, H.; et al. Gaussian 16 Rev. B.01. 2016. Available online: https://gaussian.com/citation/ (accessed on 25 May 2021).
- Dolomanov, O.V.; Bourhis, L.J.; Gildea, R.J.; Howard, J.A.; Puschmann, H. OLEX2: A complete structure solution, refinement and analysis program. J. Appl. Cryst. 2009, 42, 339–341. [Google Scholar] [CrossRef]
- Sheldrick, G.M. SHELXT–Integrated space-group and crystal-structure determination. Acta Crystallogr. Sect. A Found. Adv. 2015, 71, 3–8. [Google Scholar] [CrossRef]
- Chen, S.; Deng, Y.; Yan, C.; Wu, Z.; Guo, H.; Liu, L.; Liu, H. Secondary Metabolites with Nitric Oxide Inhibition from Marine-Derived Fungus Alternaria sp. 5102. Mar. Drugs 2020, 18, 426. [Google Scholar] [CrossRef] [PubMed]
Publisher’s Note: MDPI stays neutral with regard to jurisdictional claims in published maps and institutional affiliations. |
© 2021 by the authors. Licensee MDPI, Basel, Switzerland. This article is an open access article distributed under the terms and conditions of the Creative Commons Attribution (CC BY) license (https://creativecommons.org/licenses/by/4.0/).

