
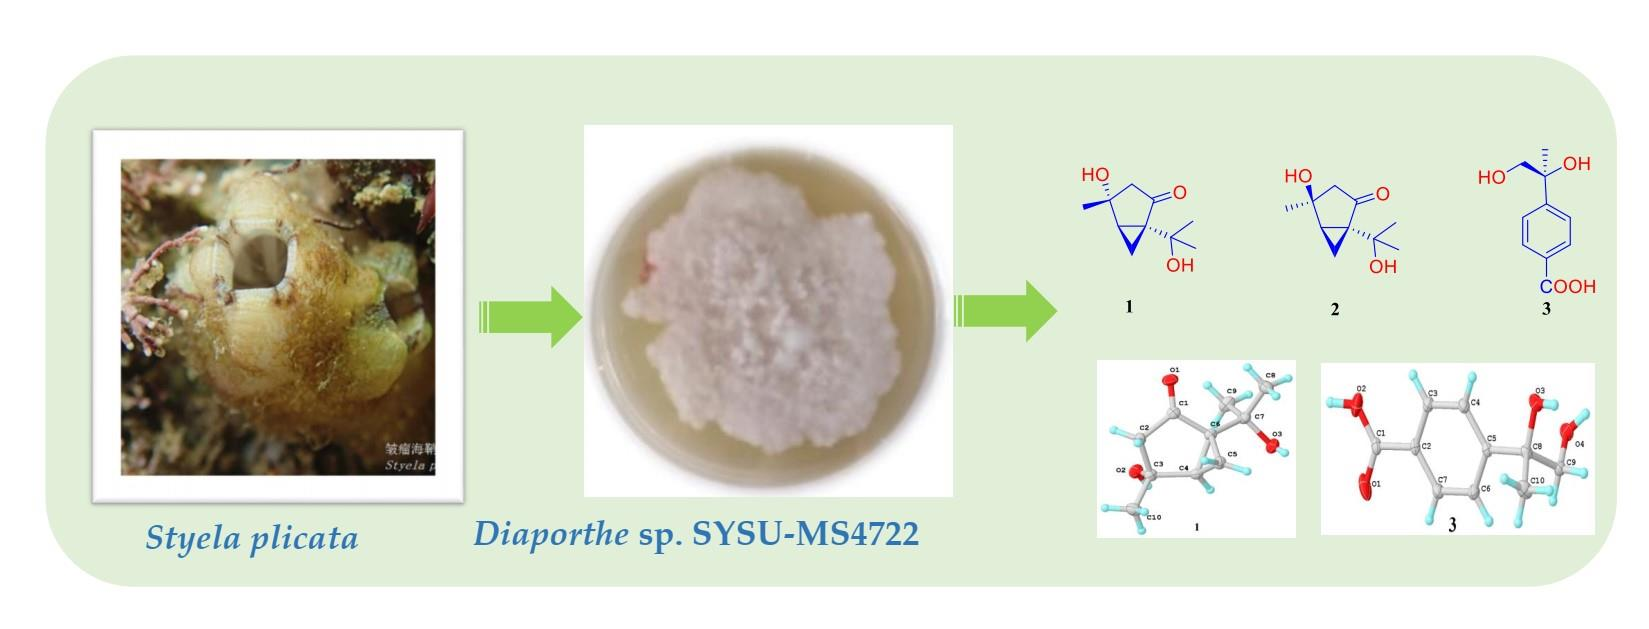
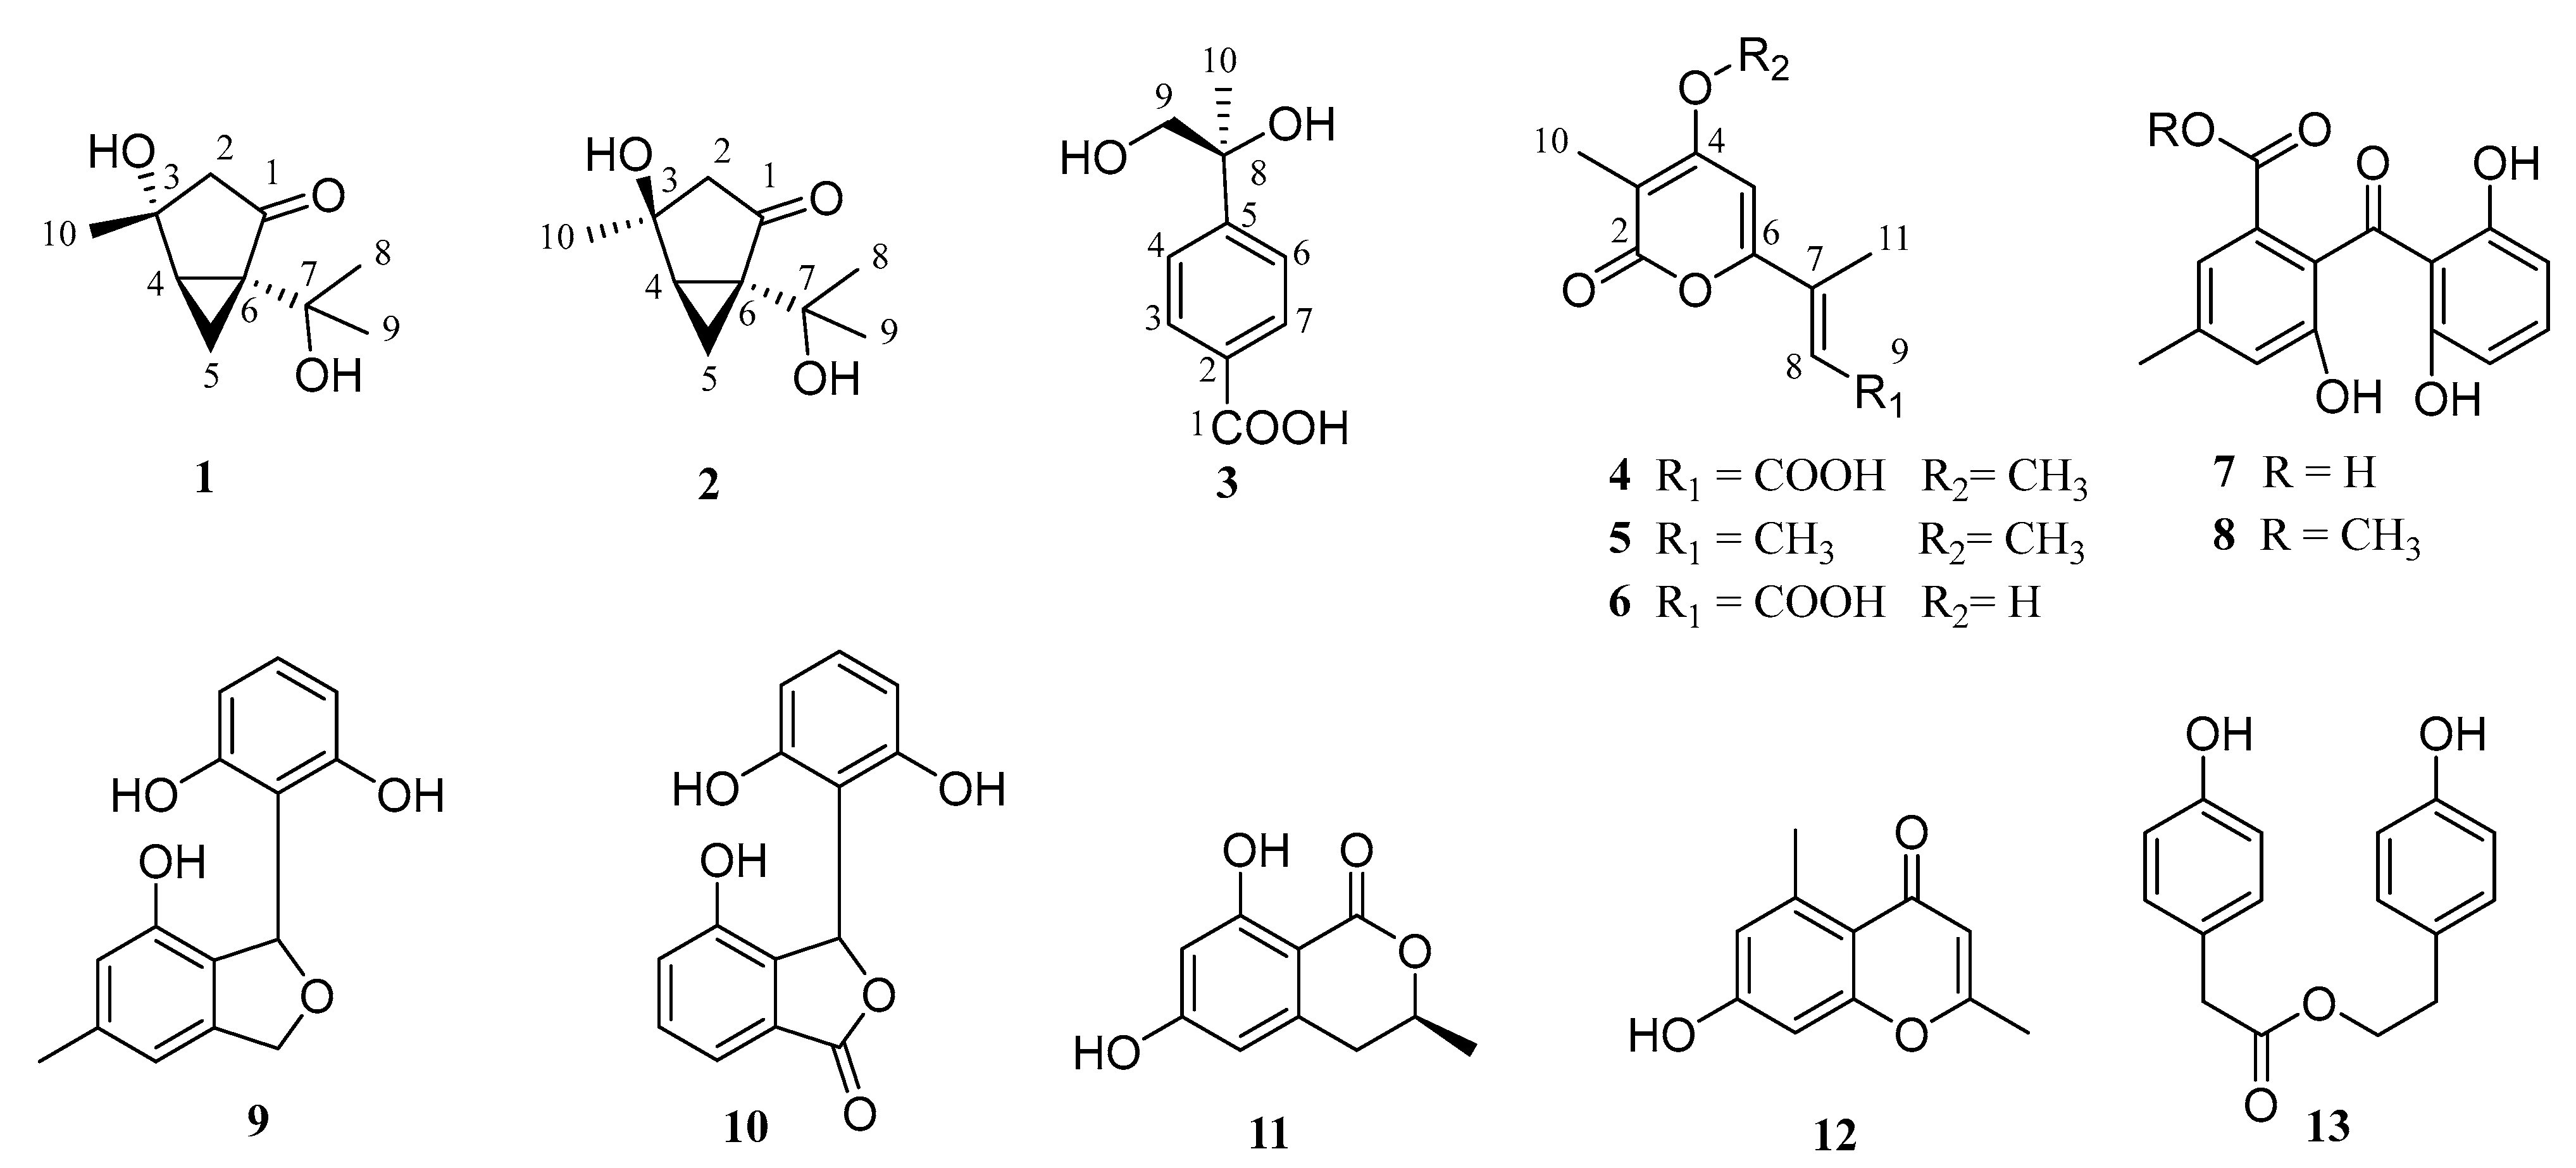
Bioactive Monoterpenes and Polyketides from the Ascidian-Derived Fungus Diaporthe sp. SYSU-MS4722

 , and
, and 
Abstract
:
1. Introduction
2. Results and Discussion
3. Materials and Methods
3.1. General Experimental Procedures
3.2. Fungal Material
3.3. Extraction and Isolation
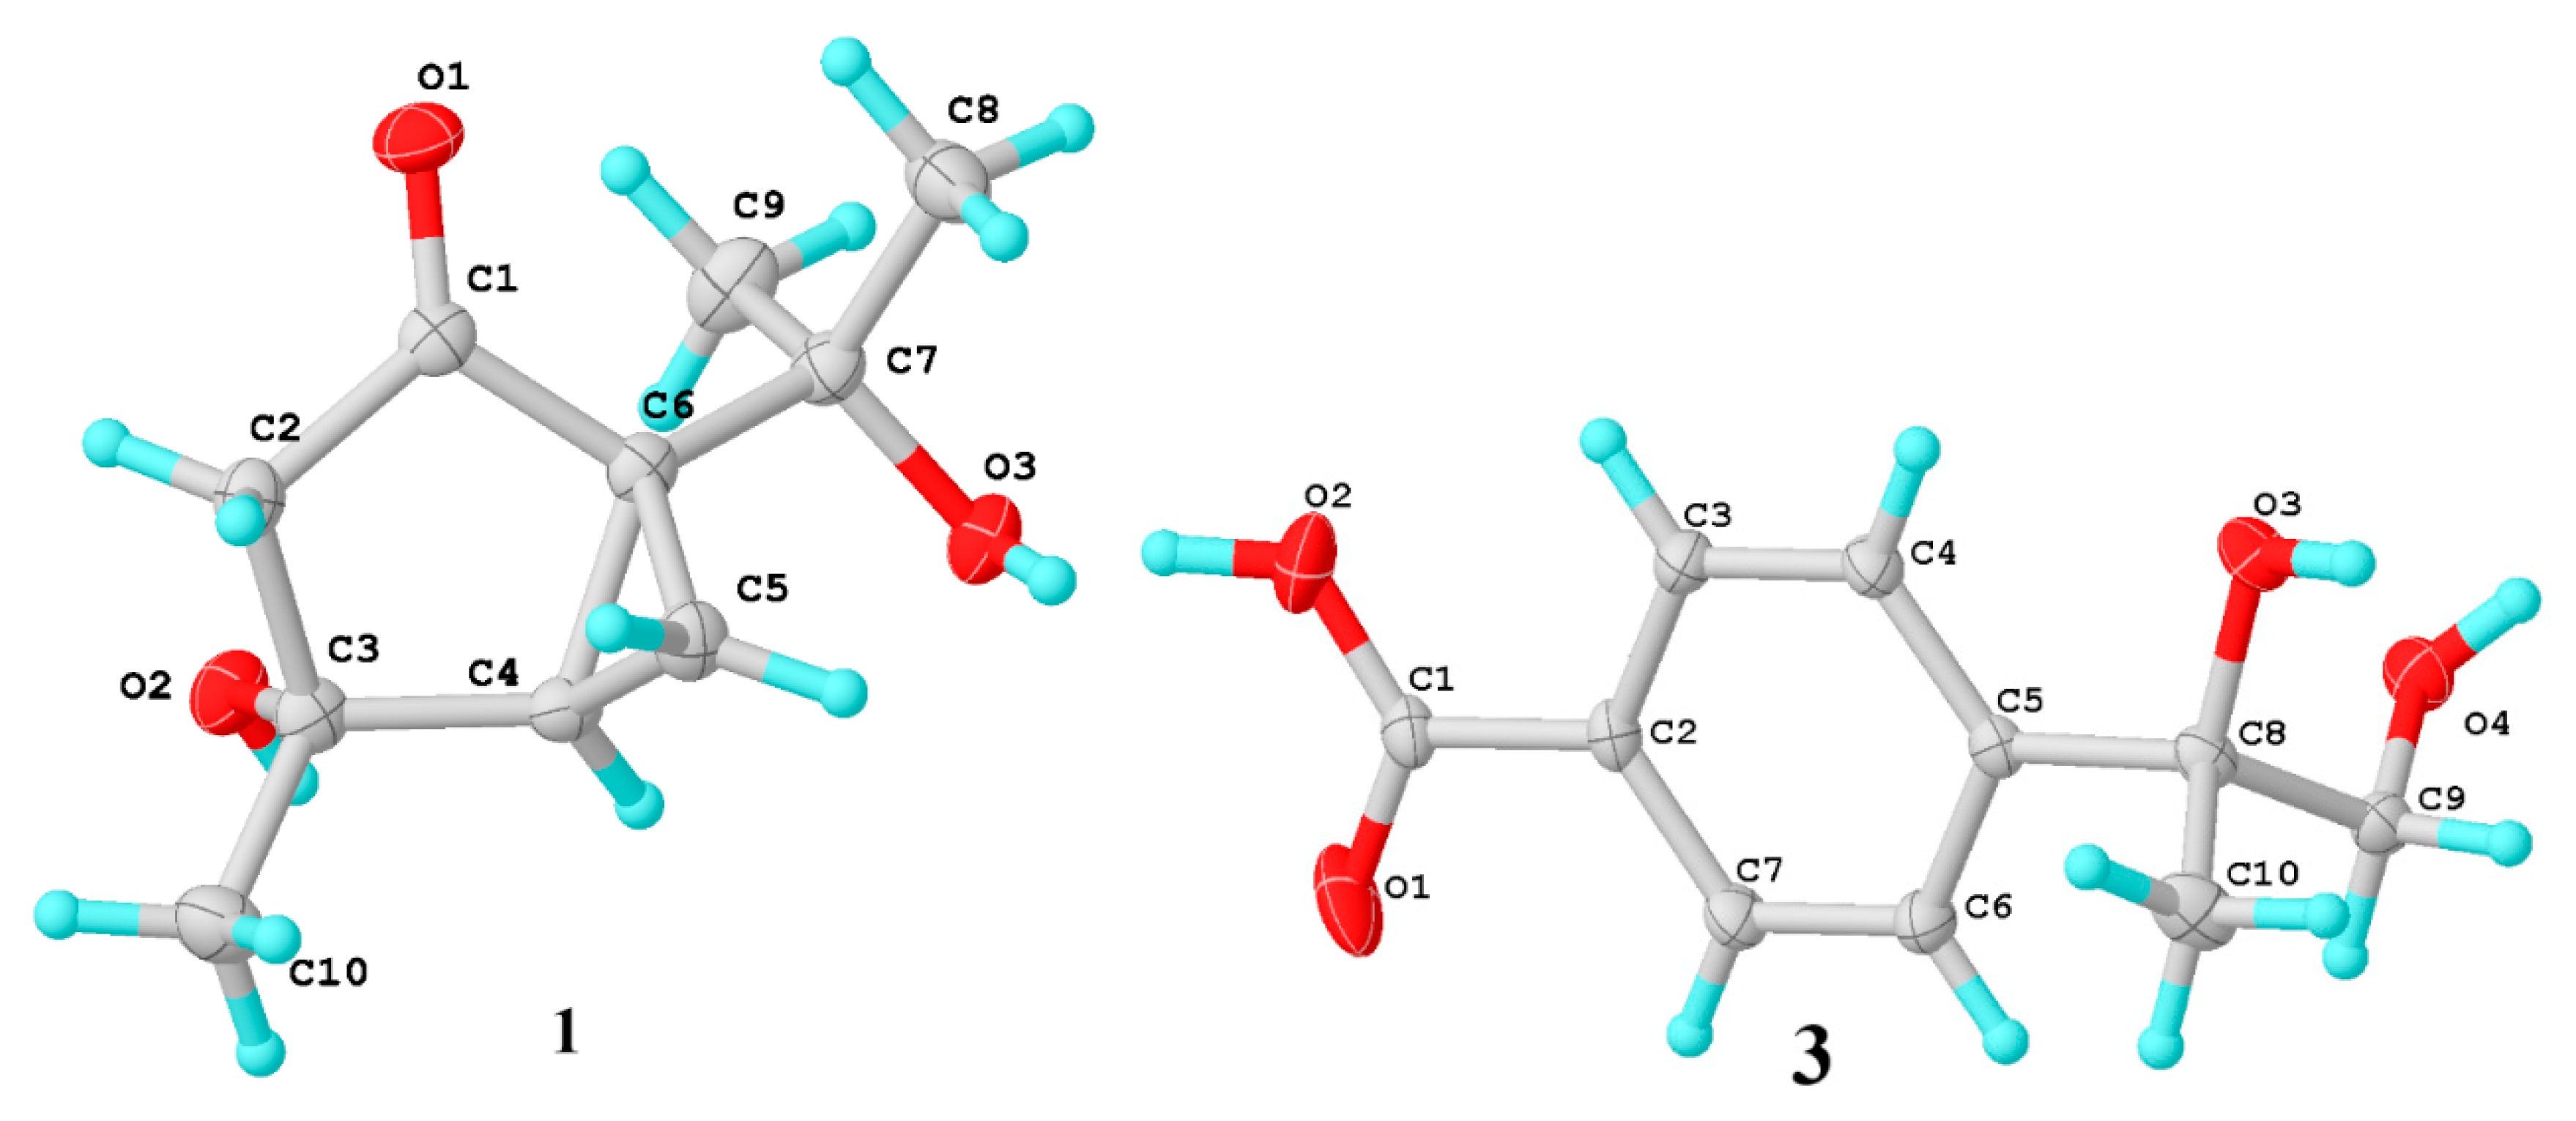
3.4. X-ray Crystallographic Analysis
3.5. Calculation of the ECD Spectra
3.6. Anti-Glioma Activity
3.7. Anti-Inflammatory Activity
3.8. Total Antioxidant Capacity Assay
4. Conclusions
Supplementary Materials
Author Contributions
Funding
Institutional Review Board Statement
Informed Consent Statement
Acknowledgments
Conflicts of Interest
References
- Jiang, M.; Wu, Z.; Guo, H.; Liu, L.; Chen, S. A Review of terpenes from marine-derived fungi: 2015–2019. Mar. Drugs 2020, 18, 321. [Google Scholar] [CrossRef]
- Chen, S.; Cai, R.; Liu, Z.; Cui, H.; She, Z. Secondary metabolites from mangrove-associated fungi: Source, chemistry and bioactivities. Nat. Prod. Rep. 2022, 39, 560–595. [Google Scholar] [CrossRef]
- Elissawy, A.M.; El-Shazly, M.; Ebada, S.S.; Singab, A.B.; Proksch, P. Bioactive terpenes from marine-derived fungi. Mar. Drugs 2015, 13, 1966–1992. [Google Scholar] [CrossRef] [PubMed]
- Ebel, R. Terpenes from marine-derived fungi. Mar. Drugs 2010, 8, 2340–2368. [Google Scholar] [CrossRef]
- Huang, H.-R.; Xia, X.-K.; She, Z.-G.; Lin, Y.-C.; Vrijmoed, L.; Gareth Jones, E. A new chloro-monoterpene from the mangrove endophytic fungus Tryblidiopycnis sp. (4275). J. Asian Nat. Prod. Res. 2006, 8, 609–612. [Google Scholar] [CrossRef]
- Li, X.-D.; Li, X.-M.; Yin, X.-L.; Li, X.; Wang, B.-G. Antimicrobial sesquiterpenoid derivatives and monoterpenoids from the deep-sea sediment-derived fungus Aspergillus versicolor SD-330. Mar. Drugs 2019, 17, 563. [Google Scholar] [CrossRef]
- Cheng, Z.; Xu, W.; Wang, Y.; Bai, S.; Liu, L.; Luo, Z.; Yuan, W.; Li, Q. Two new meroterpenoids and two new monoterpenoids from the deep sea-derived fungus Penicillium sp. YPGA11. Fitoterapia 2019, 133, 120–124. [Google Scholar] [CrossRef]
- Liu, H.-X.; Zhang, L.; Chen, Y.-C.; Sun, Z.-H.; Pan, Q.-L.; Li, H.-H.; Zhang, W.-M. Monoterpenes and sesquiterpenes from the marine sediment-derived fungus Eutypella scoparia FS46. J. Asian Nat. Prod. Res. 2017, 19, 145–151. [Google Scholar] [CrossRef]
- Gong, T.; Zhen, X.; Li, B.-J.; Yang, J.-L.; Zhu, P. Two new monoterpenoid α-pyrones from a fungus Nectria sp. HLS206 associated with the marine sponge Gelliodes carnosa. J. Asian Nat. Prod. Res. 2015, 17, 633–637. [Google Scholar] [CrossRef]
- Song, Y.-P.; Miao, F.-P.; Fang, S.-T.; Yin, X.-L.; Ji, N.-Y. Halogenated and nonhalogenated metabolites from the marine-alga-endophytic fungus Trichoderma asperellum cf44-2. Mar. Drugs 2018, 16, 266. [Google Scholar] [CrossRef] [Green Version]
- Yun, K.; Kondempudi, C.M.; Leutou, A.S.; Son, B.W. New Production of a Monoterpene Glycoside, 1-O-(α-D-Mannopyranosyl) geraniol, by the Marine-derived Fungus Thielavia hyalocarpa. Bull. Korean Chem. Soc. 2015, 36, 2391–2393. [Google Scholar] [CrossRef]
- Chepkirui, C.; Stadler, M. The genus Diaporthe: A rich source of diverse and bioactive metabolites. Mycol. Prog. 2017, 16, 477–494. [Google Scholar] [CrossRef]
- Huang, F.; Hou, X.; Dewdney, M.M.; Fu, Y.; Chen, G.; Hyde, K.D.; Li, H. Diaporthe species occurring on citrus in China. Fung. Divers. 2013, 61, 237–250. [Google Scholar] [CrossRef]
- Luo, X.; Lin, X.; Tao, H.; Wang, J.; Li, J.; Yang, B.; Zhou, X.; Liu, Y. Isochromophilones A–F, Cytotoxic Chloroazaphilones from the Marine Mangrove Endophytic Fungus Diaporthe sp. SCSIO 41011. J. Nat. Prod. 2018, 81, 934–941. [Google Scholar] [CrossRef]
- Cui, H.; Lin, Y.; Luo, M.; Lu, Y.; Huang, X.; She, Z. Diaporisoindoles A–C: Three isoprenylisoindole alkaloid derivatives from the mangrove endophytic fungus Diaporthe sp. SYSU-HQ3. Org. Lett. 2017, 19, 5621–5624. [Google Scholar] [CrossRef]
- Guo, L.; Niu, S.; Chen, S.; Liu, L. Diaporone A, a new antibacterial secondary metabolite from the plant endophytic fungus Diaporthe sp. J. Antibiot. 2020, 73, 116–119. [Google Scholar] [CrossRef]
- Chen, S.; Shen, H.; Zhang, P.; Cheng, H.; Dai, X.; Liu, L. Anti-glioma trichobamide A with an unprecedented tetrahydro-5H-furo [2,3-b]pyrrol-5-one functionality from ascidian-derived fungus Trichobotrys effuse 4729. Chem. Commun. 2019, 55, 1438–1441. [Google Scholar] [CrossRef]
- Chen, S.; Shen, H.; Deng, Y.; Guo, H.; Jiang, M.; Wu, Z.; Yin, H.; Liu, L. Roussoelins A and B: Two phenols with antioxidant capacity from ascidian-derived fungus Roussoella siamensis SYSU-MS4723. Mar. Life Sci. Technol. 2021, 3, 69–76. [Google Scholar] [CrossRef]
- Jiang, M.; Wu, Z.; Wu, Q.; Yin, H.; Guo, H.; Yuan, S.; Liu, Z.; Chen, S.; Liu, L. Amphichoterpenoids A–C, unprecedented picoline-derived meroterpenoids from the ascidian-derived fungus Amphichorda felina SYSU-MS7908. Chin. Chem. Lett. 2021, 2021, 1893–1896. [Google Scholar] [CrossRef]
- Chen, S.; Jiang, M.; Chen, B.; Salaenoi, J.; Niaz, S.-I.; He, J.; Liu, L. Penicamide A, A Unique N, N′-Ketal Quinazolinone Alkaloid from Ascidian-Derived Fungus Penicillium sp. 4829. Mar. Drugs 2019, 17, 522. [Google Scholar] [CrossRef] [Green Version]
- Chen, S.; Guo, H.; Jiang, M.; Wu, Q.; Li, J.; Shen, H.; Liu, L. Mono- and Dimeric Xanthones with Anti-Glioma and Anti-Inflammatory Activities from the Ascidian-Derived Fungus Diaporthe sp. SYSU-MS4722. Mar. Drugs 2022, 20, 51. [Google Scholar] [CrossRef]
- Hammerschmidt, L.; Debbab, A.; Ngoc, T.D.; Wray, V.; Hemphil, C.P.; Lin, W.; Broetz-Oesterhelt, H.; Kassack, M.U.; Proksch, P.; Aly, A.H. Polyketides from the mangrove-derived endophytic fungus Acremonium strictum. Tetrahedron Lett. 2014, 55, 3463–3468. [Google Scholar] [CrossRef]
- Avent, A.G.; Hanson, J.R.; Truneh, A. Two pyrones from Gliocladium vermoesenii. Phytochem. Lett. 1992, 31, 1065–1066. [Google Scholar] [CrossRef]
- Krick, A.; Kehraus, S.; Gerhäuser, C.; Klimo, K.; Nieger, M.; Maier, A.; Fiebig, H.-H.; Atodiresei, I.; Raabe, G.; Fleischhauer, J. Potential cancer chemopreventive in vitro activities of monomeric xanthone derivatives from the marine algicolous fungus Monodictys putredinis. J. Nat. Prod. 2007, 70, 353–360. [Google Scholar] [CrossRef]
- Liu, B.; Wang, H.-F.; Zhang, L.-H.; Liu, F.; He, F.-J.; Bai, J.; Hua, H.-M.; Chen, G.; Pei, Y.-H. Isolation of a new compound from Penicillium oxalicum. Chem. Nat. Comp. 2016, 52, 821–823. [Google Scholar] [CrossRef]
- Harper, J.K.; Arif, A.M.; Ford, E.J.; Strobel, G.A.; Porco Jr, J.A.; Tomer, D.P.; Oneill, K.L.; Heider, E.M.; Grant, D.M. Pestacin: A 1, 3-dihydro isobenzofuran from Pestalotiopsis microspora possessing antioxidant and antimycotic activities. Tetrahedron 2003, 59, 2471–2476. [Google Scholar] [CrossRef]
- Li, W.-S.; Hu, H.-B.; Huang, Z.-H.; Yan, R.-J.; Tian, L.-W.; Wu, J. Phomopsols A and B from the mangrove endophytic fungus Phomopsis sp. xy21: Structures, neuroprotective effects, and biogenetic relationships. Org. Lett. 2019, 21, 7919–7922. [Google Scholar] [CrossRef]
- Kendall, J.K.; Fisher, T.H.; Schultz, H.P.; Schultz, T.P. An improved synthesis of 6, 8-dimethoxy-3-methylisocoumarin, a fungal metabolite precursor. J. Org. Chem. 1989, 54, 4218–4220. [Google Scholar] [CrossRef]
- Wang, H.-H.; Li, G.; Peng, X.-P.; Lou, H.-X. Secondary metabolites from Colletotrichum fioriniae F18, an endophytic fungus isolated from the medicinal plant Mahonia fortunei. Acta Pharm. Sin. 2018, 12, 1862–1867. [Google Scholar]
- Dimitrios, B. Sources of natural phenolic antioxidants. Trends Food Sci. Technol. 2006, 17, 505–512. [Google Scholar] [CrossRef]
- Frisch, M.J.; Trucks, G.W.; Schlegel, H.B.; Scuseria, G.E.; Robb, M.A.; Cheeseman, M.A.; Scalmani, G.; Barone, V.; Mennucci, B.; Petersson, G.A.; et al. Gaussian 09; Gaussian, Inc.: Wallingford, CT, USA, 2009. [Google Scholar]
- Chai, J.-D.; Head-Gordon, M. Long-range corrected hybrid density functionals with damped atom–atom dispersion corrections. Phys. Chem. Chem. Phys. 2008, 10, 6615–6620. [Google Scholar] [CrossRef] [Green Version]
- Schäfer, A.; Huber, C.; Ahlrichs, R. Fully optimized contracted Gaussian basis sets of triple zeta valence quality for atoms Li to Kr. J. Chem. Phys. 1994, 100, 5829–5835. [Google Scholar] [CrossRef]
- Zhao, Y.; Truhlar, D.G. The M06 suite of density functionals for main group thermochemistry, thermochemical kinetics, noncovalent interactions, excited states, and transition elements: Two new functionals and systematic testing of four M06-class functionals and 12 other functionals. Theor. Chem. Acc. 2008, 120, 215–241. [Google Scholar]
- Weigend, F.; Ahlrichs, R. Balanced basis sets of split valence, triple zeta valence and quadruple zeta valence quality for H to Rn: Design and assessment of accuracy. Phys. Chem. Chem. Phys. 2005, 7, 3297–3305. [Google Scholar] [CrossRef]
- Lu, T.; Chen, Q. Shermo: A general code for calculating molecular thermochemistry properties. Comput. Theor. Chem. Acc. 2021, 1200, 113249. [Google Scholar] [CrossRef]
- Bruhn, T.; Schaumlöffel, A.; Hemberger, Y.; Bringmann, G. SpecDis: Quantifying the comparison of calculated and experimental electronic circular dichroism spectra. Chirality 2013, 25, 243–249. [Google Scholar] [CrossRef]
- Guo, H.; Wu, Q.; Chen, D.; Jiang, M.; Chen, B.; Lu, Y.; Li, J.; Liu, L.; Chen, S. Absolute configuration of polypropionate derivatives: Decempyrones A-J and their MptpA inhibition and anti-inflammatory activities. Bioorg. Chem. 2021, 115, 105156. [Google Scholar] [CrossRef]


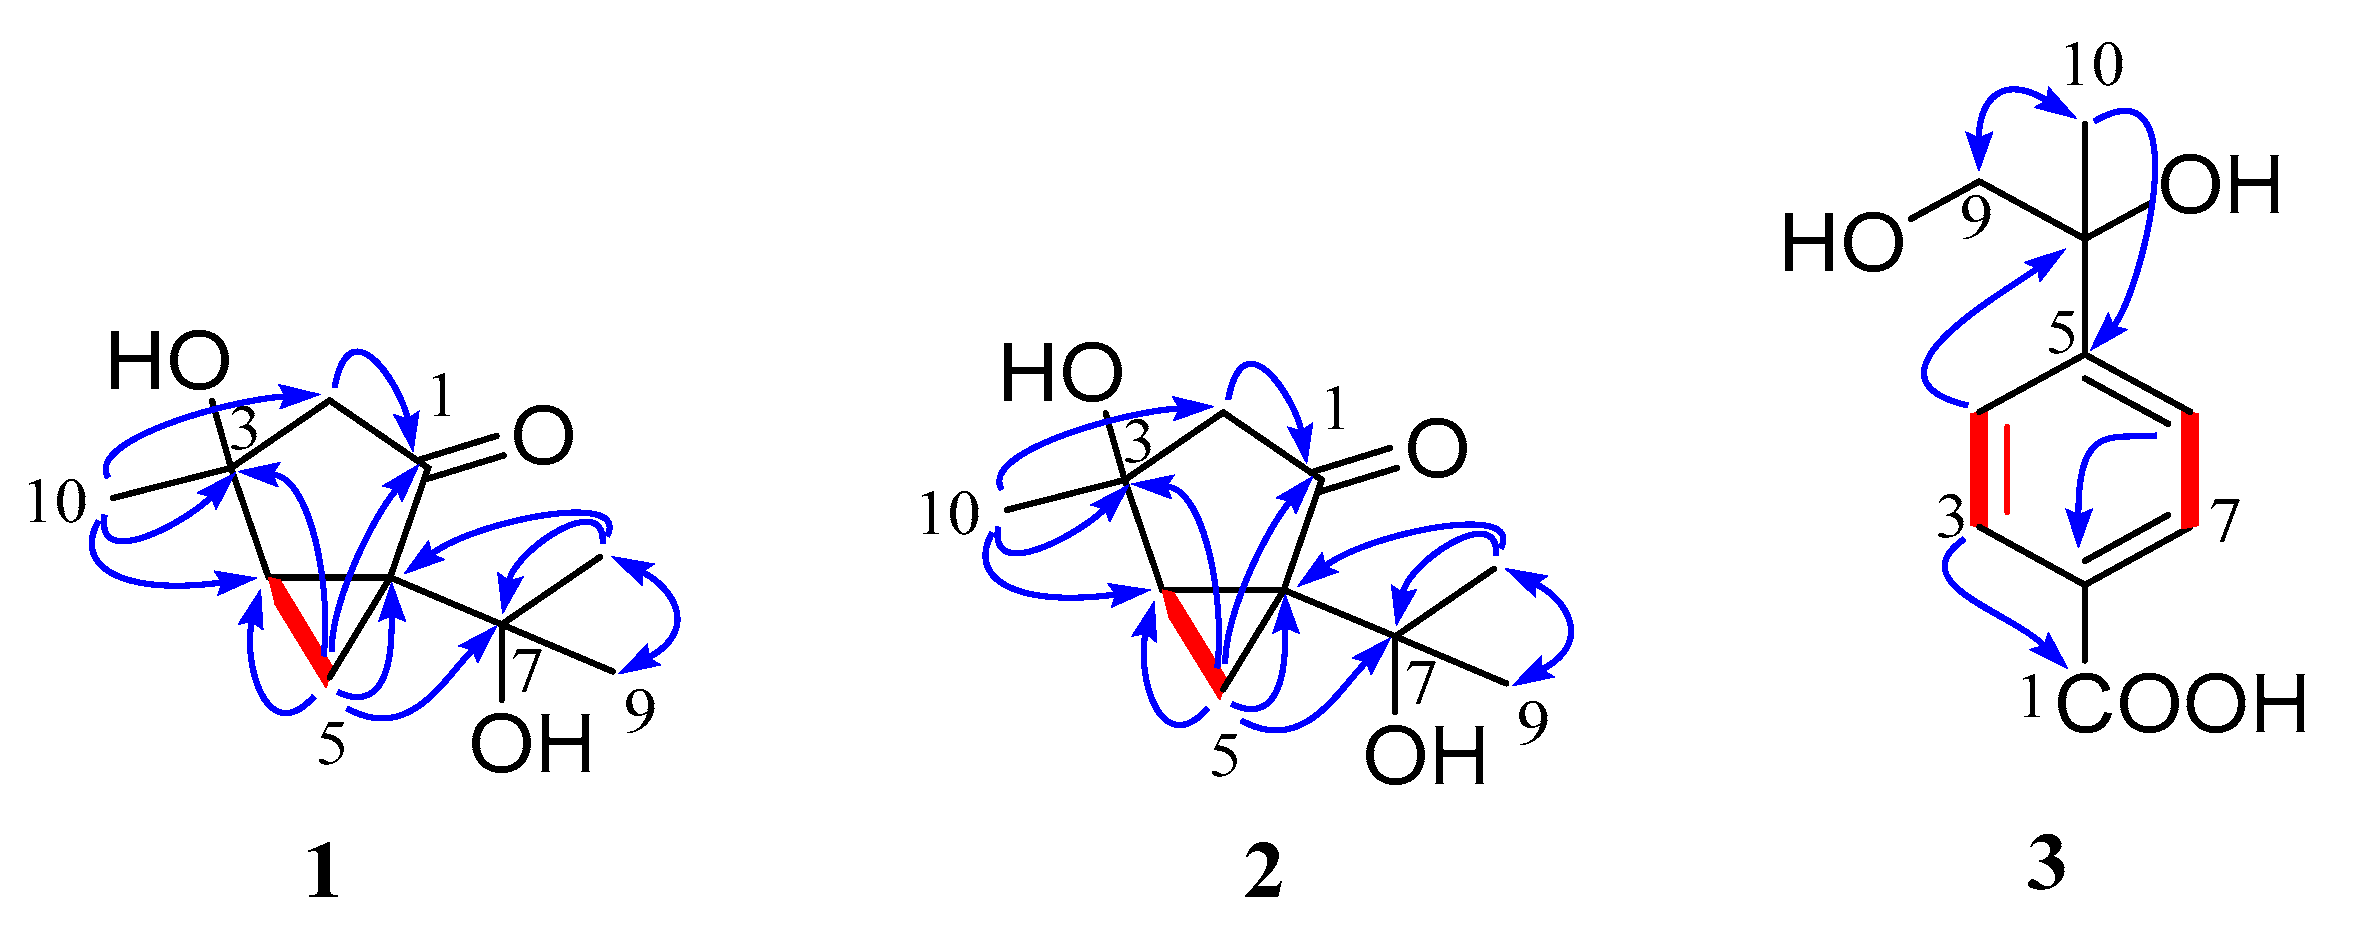
| No. | 1 | 2 | 3 | |||
|---|---|---|---|---|---|---|
| δC, type | δH, mult (J in Hz) | δC, type | δH, mult (J in Hz) | δC, type | δH, mult (J in Hz) | |
| 1 | 214.3, C | 211.9, C | 170.1, C | |||
| 2 | 50.0, CH2 | 1.97, dd (0.6, 18.1) 2.38, dd (2.1, 18.1) | 49.6, CH2 | 1.97, d (17.7) 2.44, d (17.7) | 108.9, C | |
| 3 | 73.9, C | 71.9, C | 130.4, CH | 7.88, d (8.4) | ||
| 4 | 39.0, CH | 2.23, dd (4.3, 8.1) | 38.1, CH | 2.24, dd (4.4, 7.8) | 126.7, CH | 7.49, d (8.4) |
| 5 | 16.1, CH2 | 0.96, dd (4.6, 4.7) 1.48, ddd (2.1, 5.0 8.1) | 15.7, CH2 | 1.32, dd (4.6, 4.7) 1.52, ddd (1.6, 4.8, 7.6) | 152.9, C | |
| 6 | 47.7, C | 50.3, C | 126.7, CH | 7.49, d (8.4) | ||
| 7 | 68.9, C | 68.5, C | 130.4, CH | 7.88, d (8.4) | ||
| 8 | 27.2, CH3 | 1.32, s | 29.2, CH3 | 1.28, s | 75.7, C | |
| 9 | 27.8, CH3 | 1.40, s | 28.0, CH3 | 1.39, s | 71.6, CH2 | 3.52, q (11.2) |
| 10 | 25.6, CH3 | 1.40, s | 27.2, CH3 | 1.41, s | 26.0, CH3 | 1.42, s |
| No. | 6 | |
|---|---|---|
| δC, type | δH, mult (J in Hz) | |
| 2 | 167.2, C | |
| 3 | 102.8, C | |
| 4 | 166.8, C | |
| 5 | 103.3, CH | 6.45, s |
| 6 | 158.1, C | |
| 7 | 142.7, C | |
| 8 | 121.4, CH | 6.60, d (1.3) |
| 9 | 169.7, C | |
| 10 | 8.7, CH3 | 1.88, s |
| 11 | 13.5, CH3 | 2.30, s |
| 12 | OH | |
Publisher’s Note: MDPI stays neutral with regard to jurisdictional claims in published maps and institutional affiliations. |
© 2022 by the authors. Licensee MDPI, Basel, Switzerland. This article is an open access article distributed under the terms and conditions of the Creative Commons Attribution (CC BY) license (https://creativecommons.org/licenses/by/4.0/).
Share and Cite
Zhai, G.; Chen, S.; Shen, H.; Guo, H.; Jiang, M.; Liu, L. Bioactive Monoterpenes and Polyketides from the Ascidian-Derived Fungus Diaporthe sp. SYSU-MS4722. Mar. Drugs 2022, 20, 553. https://doi.org/10.3390/md20090553
Zhai G, Chen S, Shen H, Guo H, Jiang M, Liu L. Bioactive Monoterpenes and Polyketides from the Ascidian-Derived Fungus Diaporthe sp. SYSU-MS4722. Marine Drugs. 2022; 20(9):553. https://doi.org/10.3390/md20090553
Chicago/Turabian StyleZhai, Guifa, Senhua Chen, Hongjie Shen, Heng Guo, Minghua Jiang, and Lan Liu. 2022. "Bioactive Monoterpenes and Polyketides from the Ascidian-Derived Fungus Diaporthe sp. SYSU-MS4722" Marine Drugs 20, no. 9: 553. https://doi.org/10.3390/md20090553
APA StyleZhai, G., Chen, S., Shen, H., Guo, H., Jiang, M., & Liu, L. (2022). Bioactive Monoterpenes and Polyketides from the Ascidian-Derived Fungus Diaporthe sp. SYSU-MS4722. Marine Drugs, 20(9), 553. https://doi.org/10.3390/md20090553