

Sulfated Polyhydroxysteroid Glycosides from the Sea of Okhotsk Starfish Henricia leviuscula spiculifera and Potential Mechanisms for Their Observed Anti-Cancer Activity against Several Types of Human Cancer Cells
 , , , and
Abstract
:
1. Introduction
2. Results and Discussion
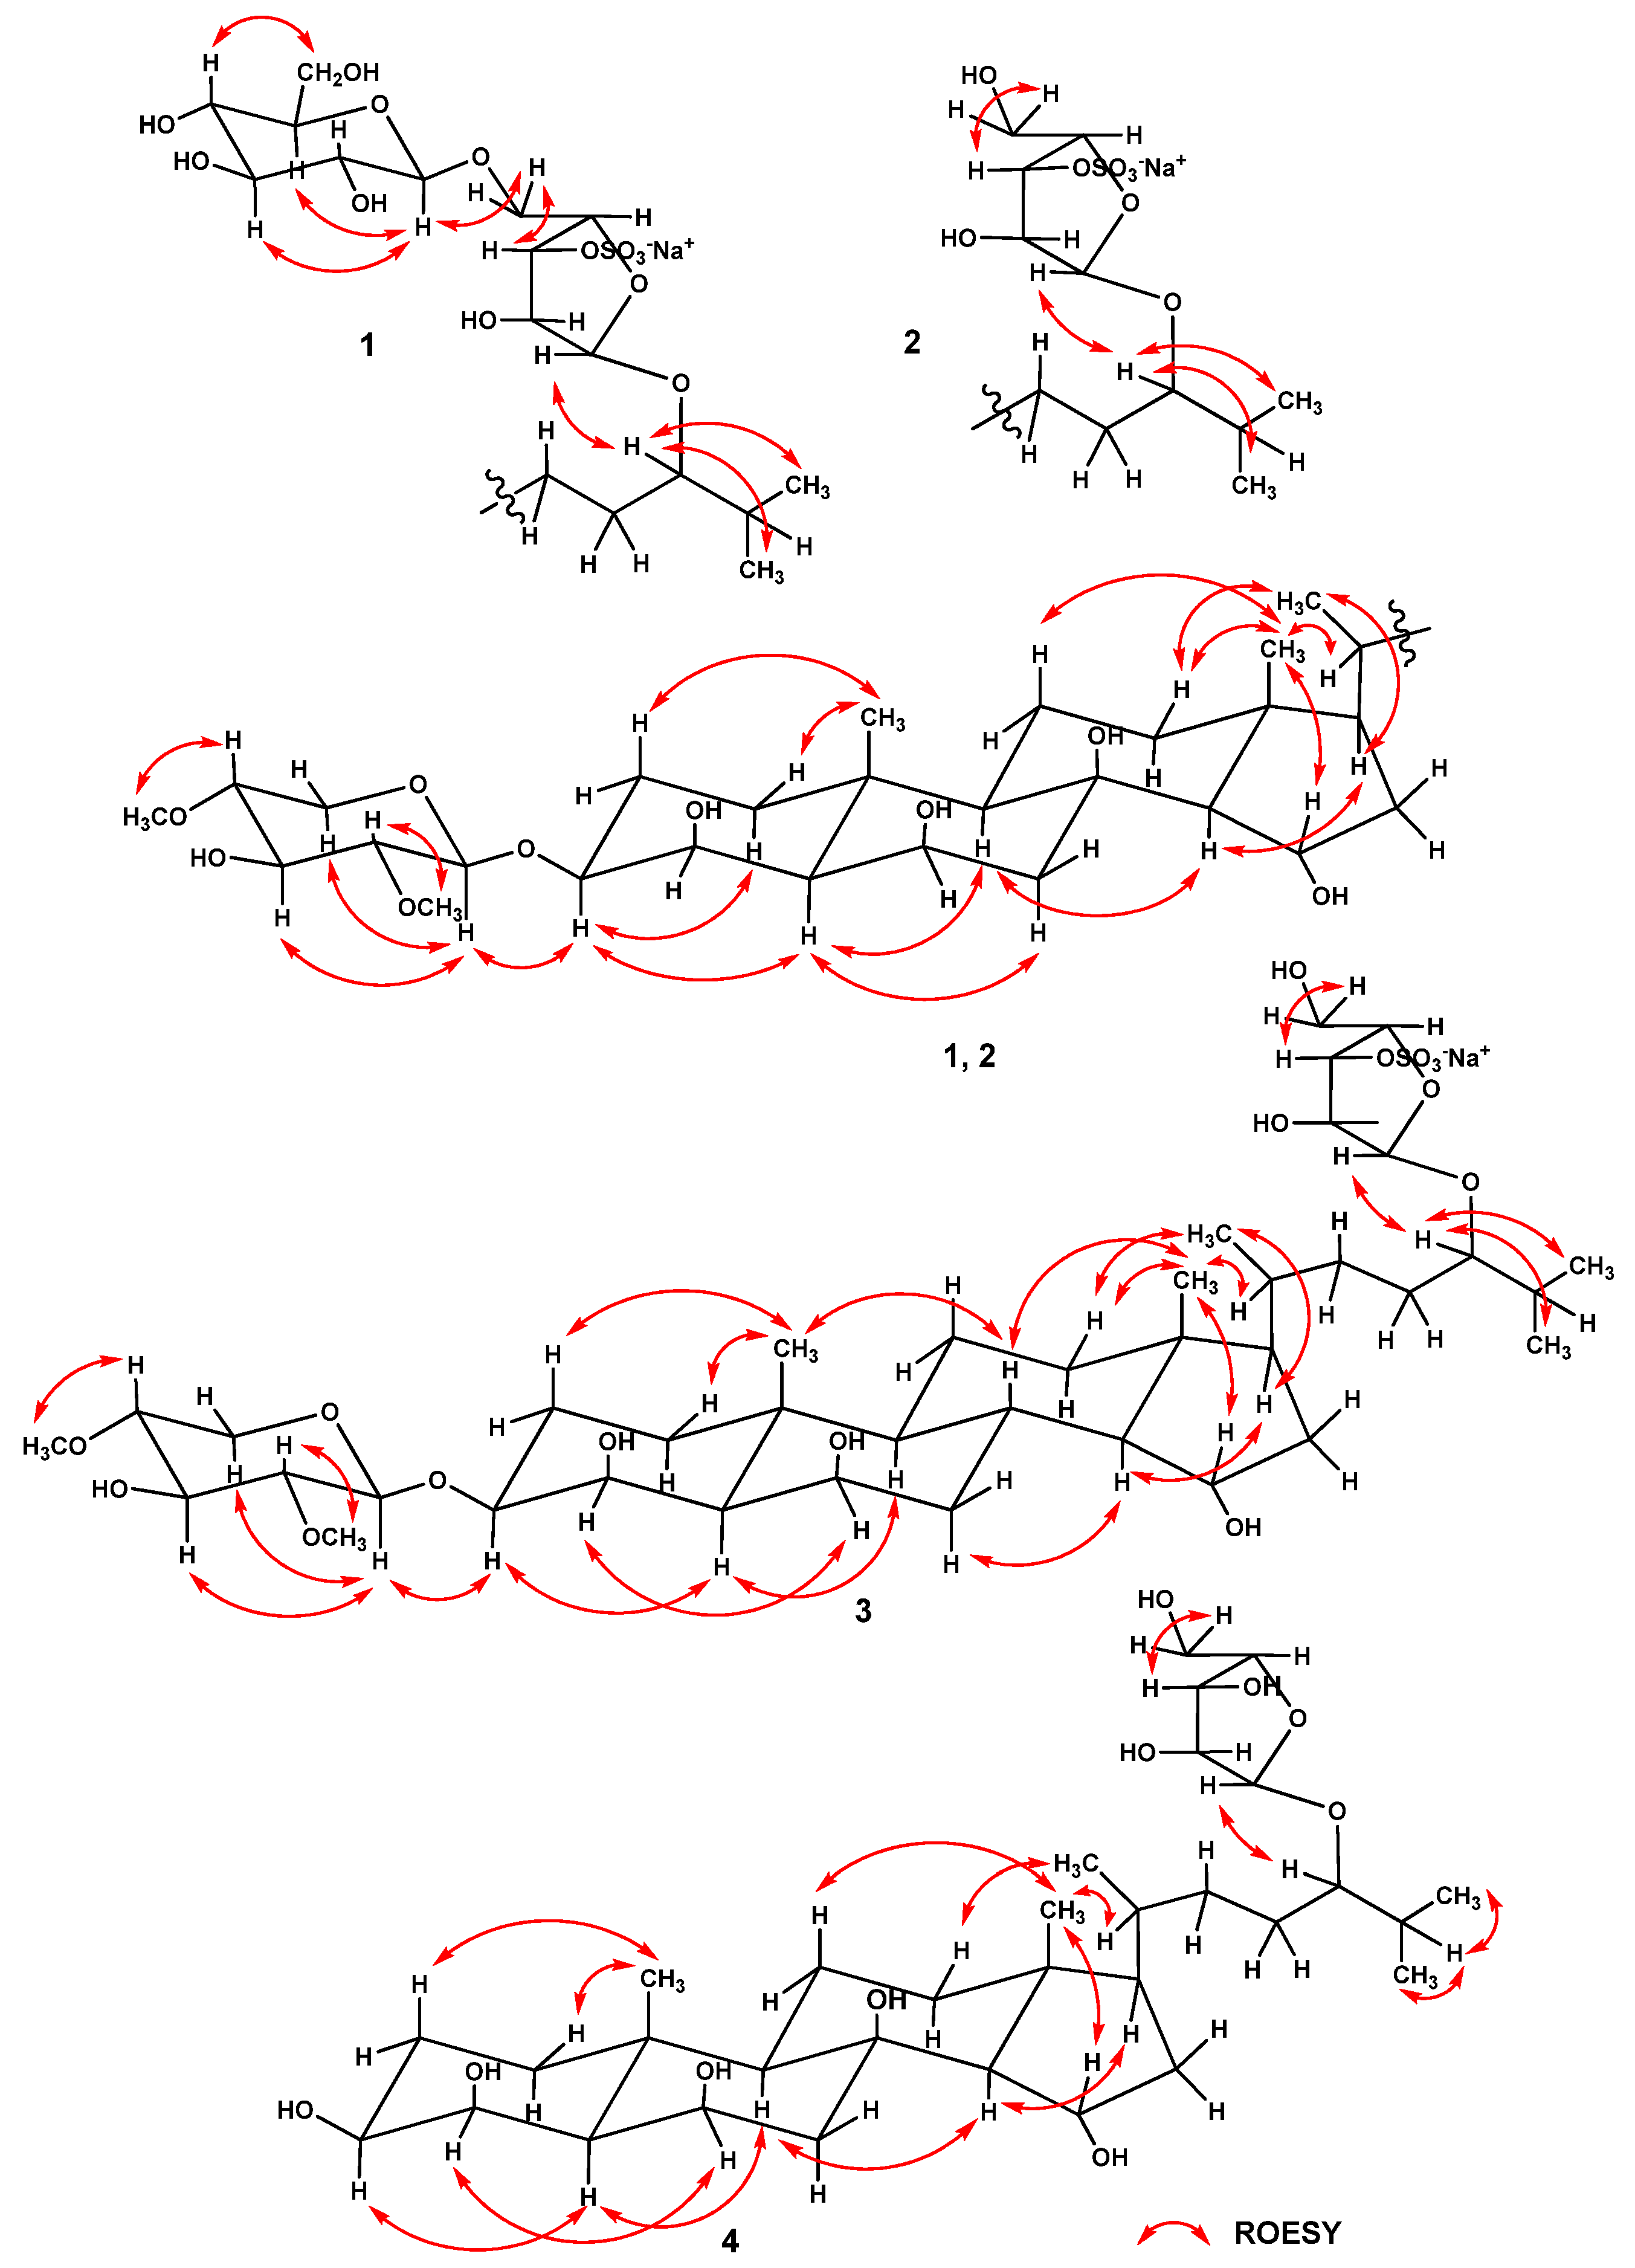
2.1. Structure Determination of Compounds 1–4
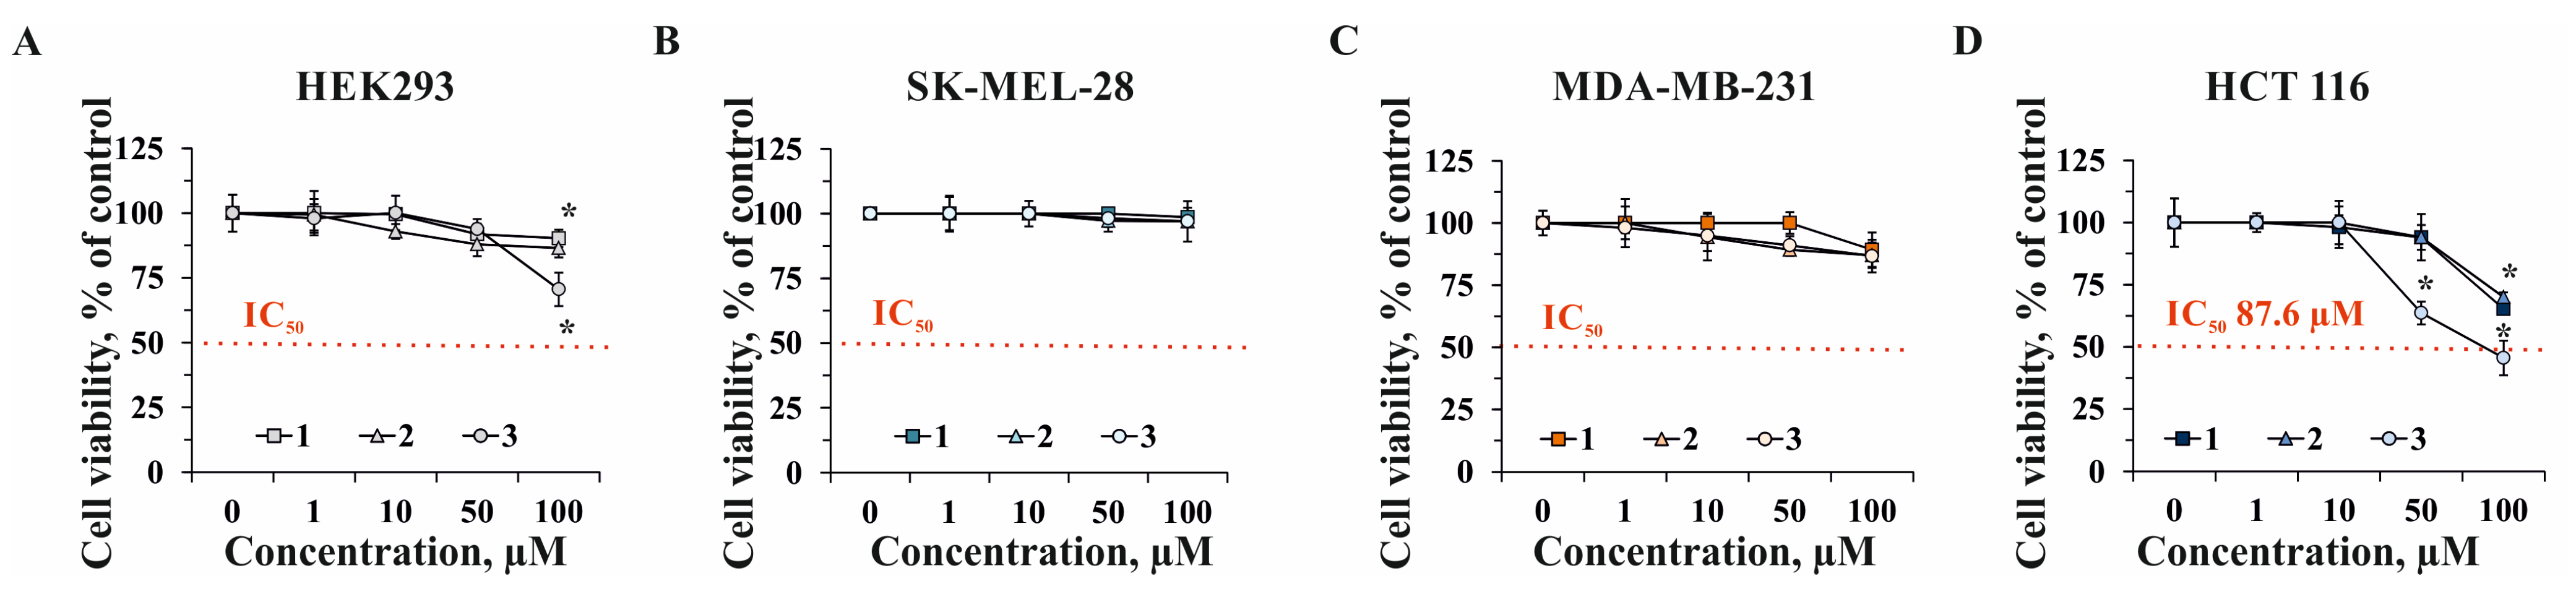
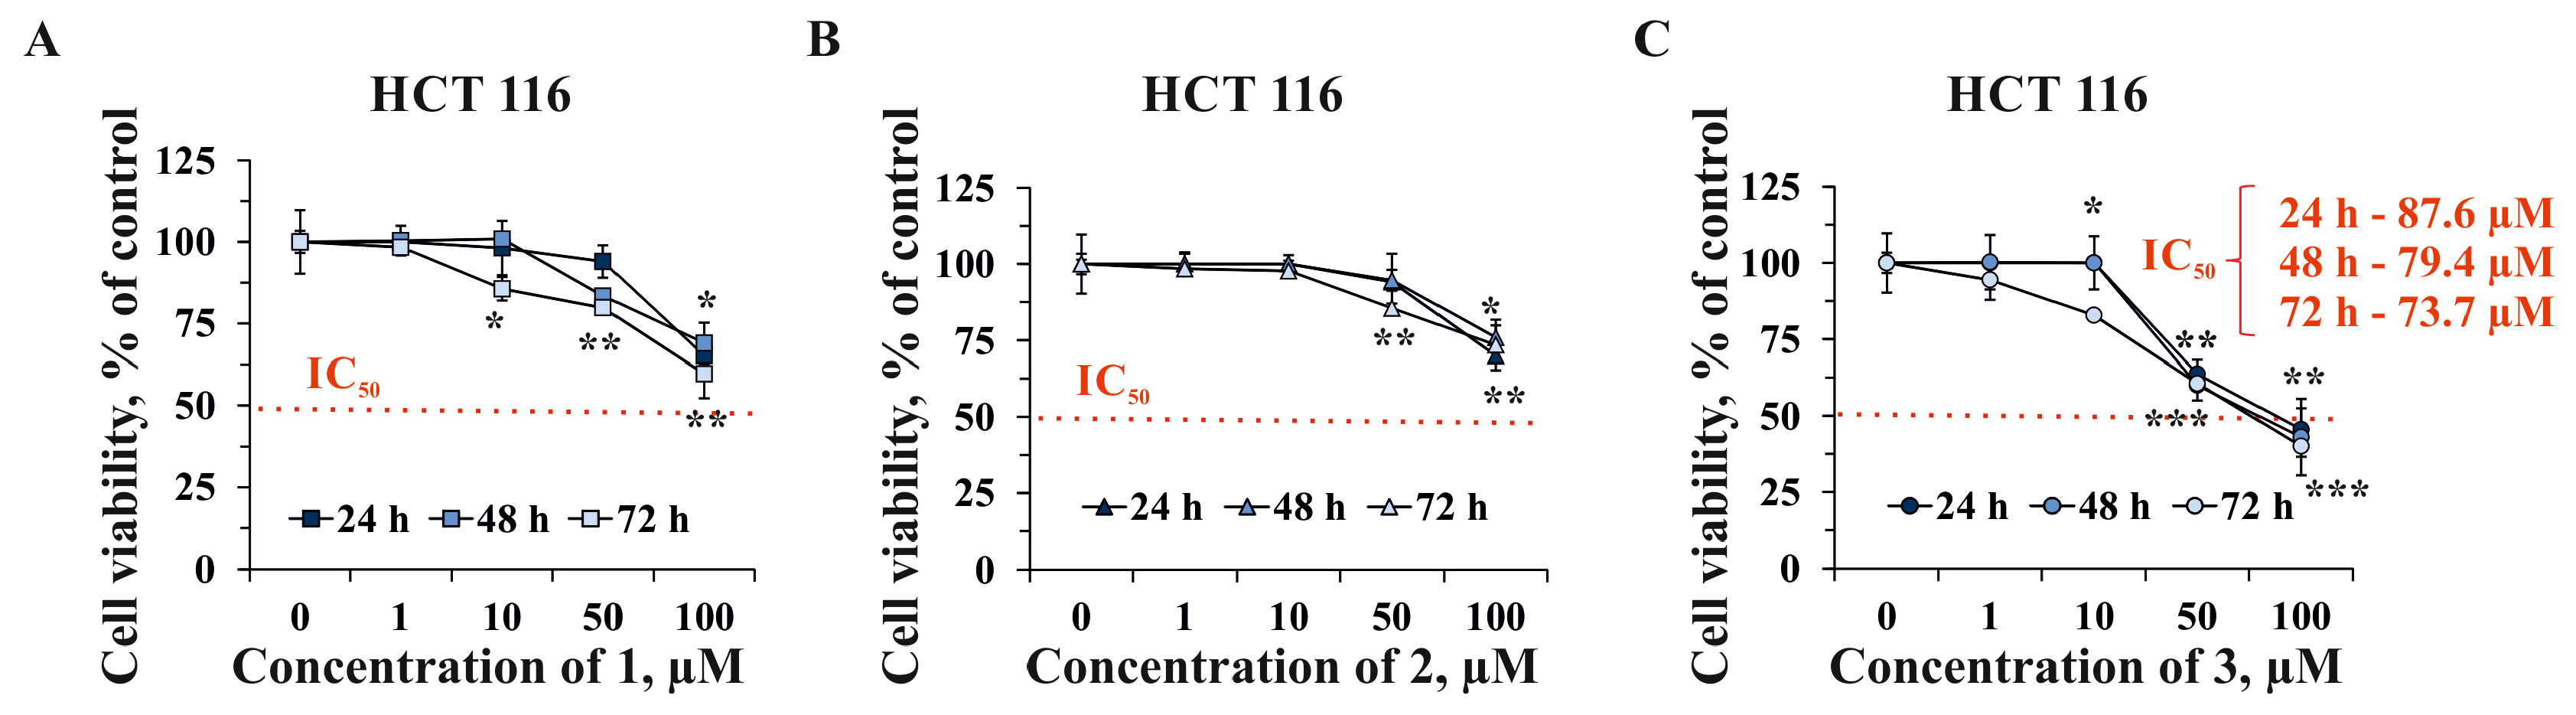
2.2. The Effect of Compounds 1–3 on Cell Viability and Proliferation of Human Normal and Cancer Cells
2.3. The Effect of Compounds 1–3 on the Colony Formation of Human Colorectal Carcinoma Cells
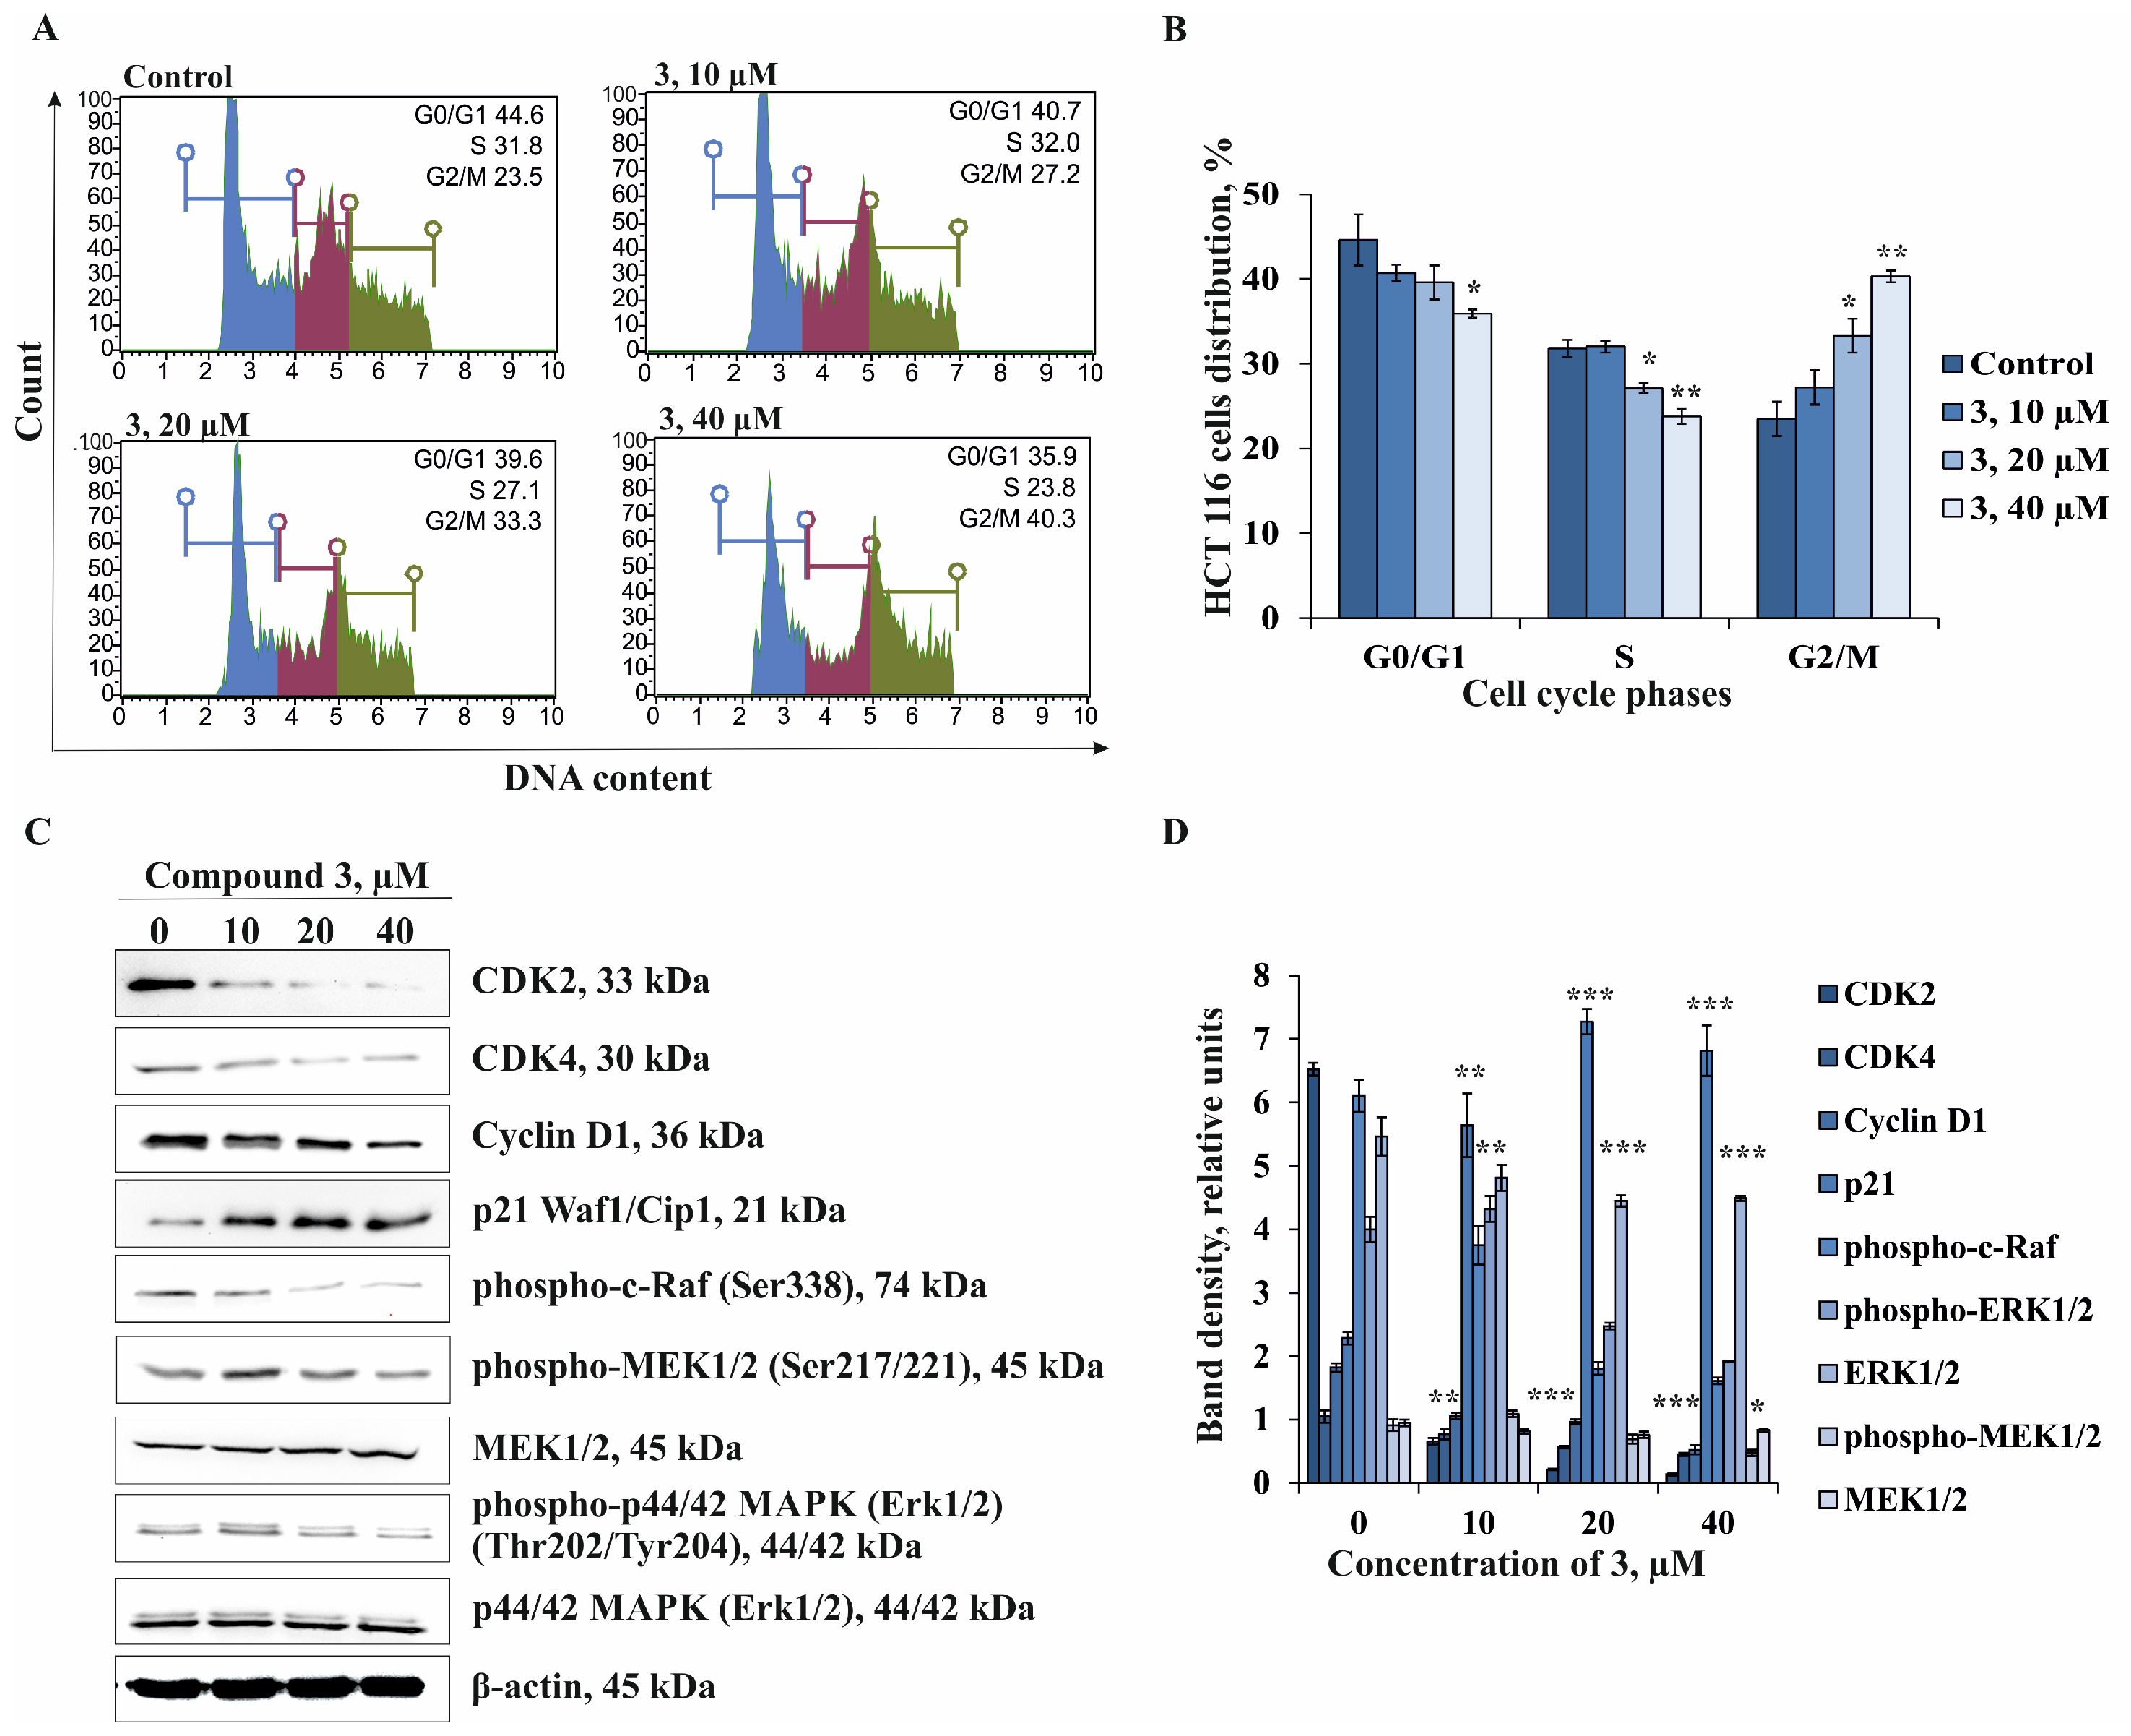
2.4. The Effect of Compound 3 on Cell Cycle Progression and Molecular Mechanism of Anti-cancer Action in Human Colorectal Carcinoma Cells
3. Materials and Methods
3.1. General Procedures
3.2. Animal Material
3.3. Extraction and Isolation
3.4. Compound Characterization Data
3.5. Acid Hydrolysis of Compound 1 and Determination of Absolute Configurations of the Sugars by GC
3.6. Solvolysis of Compound 2
3.7. Reagents
3.8. Cell Lines and Cell Culture Conditions
3.9. Cell Viability Assay
3.10. Cell Proliferation Assay
3.11. Anchorage-Independent Cell Growth Assay
3.12. Cell Cycle Assay
3.13. Western Blot Assay
3.14. Statistical Analysis
4. Conclusions
Supplementary Materials
Author Contributions
Funding
Data Availability Statement
Acknowledgments
Conflicts of Interest
References
- Minale, L.; Riccio, R.; Zollo, F. Steroid oligoglycosides and polyhydroxysteroids from Echinoderms. Fortschr. Chem. Org. Naturst. 1993, 62, 75–308. [Google Scholar] [CrossRef] [PubMed]
- Iorizzi, M.; De Marino, S.; Zollo, F. Steroidal oligoglycosides from the Asteroidea. Curr. Org. Chem. 2001, 5, 951–973. [Google Scholar] [CrossRef]
- Lebar, M.L.; Heimbegner, J.L.; Baker, B.J. Cold-water marine natural products. Nat. Prod. Rep. 2007, 24, 774–797. [Google Scholar] [CrossRef]
- Inagaki, M. Structure and biological activity of glycosphingolipids from starfish and feather star. Yakugaku Zasshi 2008, 128, 1187–1194. [Google Scholar] [CrossRef]
- Ivanchina, N.V.; Kicha, A.A.; Stonik, V.A. Steroid glycosides from marine organisms. Steroids 2011, 76, 425–454. [Google Scholar] [CrossRef]
- Dong, G.; Xu, T.H.; Yang, B.; Lin, X.P.; Zhou, X.F.; Yang, X.W.; Liu, Y.H. Chemical constituents and bioactivities of starfish. Chem. Biodivers. 2011, 8, 740–791. [Google Scholar] [CrossRef]
- Xia, J.M.; Miao, Z.; Xie, C.L.; Zhang, J.W.; Yang, X.W. Chemical constituents and bioactivities of starfishes: An update. Chem. Biodivers. 2020, 17, e1900638. [Google Scholar] [CrossRef]
- Katanaev, V.L.; Di Falco, S.; Khotimchenko, Y. The anticancer drug discovery potential of marine invertebrates from Russian Pacific. Mar. Drugs 2019, 17, 474. [Google Scholar] [CrossRef] [PubMed]
- Lazzara, V.; Arizza, V.; Luparello, C.; Mauro, M.; Vazzana, M. Bright spots in the darkness of cancer: A review of starfishes-derived compounds and their anti-tumor action. Mar. Drugs 2019, 17, 617. [Google Scholar] [CrossRef] [PubMed]
- Yun, C.W.; Kim, H.J.; Lee, S.H. Therapeutic application of diverse marine-derived natural products in cancer therapy. Anticancer Res. 2019, 39, 5261–5284. [Google Scholar] [CrossRef]
- Ghelani, H.; Khursheed, M.; Adrian, T.E.; Jan, R.K. Anti-inflammatory effects of compounds from echinoderms. Mar. Drugs 2022, 20, 693. [Google Scholar] [CrossRef] [PubMed]
- Fukuyama, Y.; Kubo, M.; Harada, K. Neurotrophic Natural Products. In Progress in the Chemistry of Organic Natural Products; Kinghorn, A.D., Falk, H., Gibbons, S., Asakawa, Y., Liu, J.K., Dirsch, V.M., Eds.; Springer: Cham, Switzerland, 2024; Volume 123, pp. 255–257. [Google Scholar] [CrossRef]
- Gomes, A.R.; Freitas, A.C.; Duarte, A.C.; Rocha-Santos, T.A.P. Chapter 1—Echinoderms: A review of bioactive compounds with potential health effects. In Studies in Natural Products Chemistry; Atta-ur-Rahman, Ed.; Elsevier: Amsterdam, The Netherlands, 2016; Volume 49, pp. 1–54. [Google Scholar] [CrossRef]
- Carvalhal, F.; Correia-da-Silva, M.; Sousa, E.; Pinto, M.; Kijjoa, A. Sources and biological activities of marine sulfated steroids. J. Mol. Endocrinol. 2018, 61, T211–T231. [Google Scholar] [CrossRef] [PubMed]
- Pounina, T.A.; Gloriozova, T.A.; Savidov, N.; Dembitsky, V.M. Sulfated and sulfur-containing steroids and their pharmacological profile. Mar. Drugs 2021, 19, 240. [Google Scholar] [CrossRef] [PubMed]
- Chichvarkhin, A.; Chichvarkhina, O.; Wakita, D. Sea stars of the genus Henricia Gray, 1840 (Echinodermata, Asteroidea) from Vostok Bay, Sea of Japan. PeerJ 2019, 7, e6585. [Google Scholar] [CrossRef] [PubMed]
- Alboasud, M.; Jeong, H.; Lee, T. Complete mitochondrial genomes and phylogenetic analysis of genus Henricia (Asteroidea: Spinulosida: Echinasteridae). Int. J. Mol. Sci. 2024, 25, 5575. [Google Scholar] [CrossRef] [PubMed]
- D’Auria, M.V.; Fontana, A.; Minale, L.; Riccio, R. Starfish saponins. Part XLII. Isolation of twelve steroidal glycosides from the Pacific Ocean starfish Henricia laeviuscola. Gazz. Chim. Ital. 1990, 120, 155–162. [Google Scholar]
- Palagiano, E.; Zollo, F.; Minale, L.; Paloma, L.G.; Iorizzi, M.; Bryan, P.; McClintock, J.; Hopkins, T.; Riou, D.; Roussakis, C. Downeyoside A and B, two new sulphated steroid glucuronides from the starfish Henricia downeyae. Tetrahedron 1995, 51, 12293–12300. [Google Scholar] [CrossRef]
- Palagiano, E.; Zollo, F.; Minale, L.; Iorizzi, M.; Bryan, P.; McClintock, J.; Hopkins, T. Isolation of 20 glycosides from the starfish Henricia downeyae, collected in the Gulf of Mexico. J. Nat. Prod. 1996, 59, 348–354. [Google Scholar] [CrossRef]
- Fedorov, S.N.; Shubina, L.K.; Kicha, A.A.; Ivanchina, N.V.; Kwak, J.Y.; Jin, J.O.; Bode, A.M.; Dong, Z.; Stonik, V.A. Proapoptotic and anticarcinogenic activities of leviusculoside G from the starfish Henricia leviuscula and probable molecular mechanism. Nat. Prod. Commun. 2008, 3, 1575–1580. [Google Scholar] [CrossRef]
- Findlay, J.A.; He, Z.Q. Polyhydroxylated steroidal glycosides from the starfish Asterias forbesi. J. Nat. Prod. 1991, 54, 428–435. [Google Scholar] [CrossRef]
- Nes, W.R.; Varkey, T.E.; Krevitz, K. The stereochemistry of sterols at C-20 and its biosynthetic implications. J. Am. Chem. Soc. 1977, 99, 260–262. [Google Scholar] [CrossRef]
- Vanderach, D.J.; Djerassi, C. Marine natural products—Synthesis of four naturally occurring 20-β-H cholanic acid-derivatives. J. Org. Chem. 1978, 43, 1442–1448. [Google Scholar] [CrossRef]
- Leontein, K.; Lindberg, B.; Lönngren, J. Assignment of absolute configuration of sugar by g.l.c. of their acetylated glycosides from chiral alcohols. Carbohydr. Res. 1978, 62, 359–362. [Google Scholar] [CrossRef]
- Levina, E.V.; Kalinovsky, A.I.; Dmitrenok, P.S. Steroid compounds from two Pacific starfish of the genus Evasterias. Russ. J. Bioorg. Chem. 2009, 35, 123–130. [Google Scholar] [CrossRef] [PubMed]
- Kicha, A.A.; Ivanchina, N.V.; Kalinovsky, A.I.; Dmitrenok, P.S.; Agafonova, I.G.; Stonik, V.A. Steroidal triglycosides, kurilensosides A, B and C, and other polar steroids from the Far Eastern starfish Hippasteria kurilensis. J. Nat. Prod. 2008, 71, 793–798. [Google Scholar] [CrossRef] [PubMed]
- Nunez, H.A.; Walker, T.E.; Fuentes, R.; O’Connor, J.; Serianni, A.; Barker, R. Carbon-13 as a tool for the study of carbohydrate structures, conformations and interactions. J. Supramol. Struct. 1977, 6, 535–550. [Google Scholar] [CrossRef] [PubMed]
- D’Auria, M.V.; Minale, L.; Pizza, C.; Riccio, R.; Zollo, F. Starfish saponins XV. Stereochemistry at C(24) of nodososide (24-O-glycosidated steroid) and at C(25) of 26-hydroxysteroids. Gazz. Chim. Ital. 1984, 114, 469–473. [Google Scholar]
- Riccio, R.; D’Auria, M.V.; Iorizzi, M.; Minale, L.; Laurent, D.; Duhet, D. Starfish saponins. 25. Steroidal glycosides from the starfish Gomophia watsoni. Gazz. Chim. Ital. 1985, 115, 405–409. [Google Scholar]
- Riccio, R.; Iorizzi, M.; Minale, L.; Oshima, Y.; Yasumoto, T. Starfish saponins. Part 34. Novel steroidal glycosides sulphates from the starfish Asterias amurensis. J. Chem. Soc. Perkin Trans. 1988, 1, 1337–1347. [Google Scholar] [CrossRef]
- Kicha, A.A.; Ivanchina, N.V.; Kalinovski, A.I.; Dmitrenok, P.S.; Smirnov, A.V. Two new steroid glycosides from the Far East starfish Hippasteria kurilensis. Russ. J. Bioorg. Chem. 2009, 35, 557–562. [Google Scholar] [CrossRef]
- Kicha, A.A.; Kalinovskii, A.I.; Ivanchina, N.V.; Malyarenko, T.V.; Popov, R.S.; Long, F.K.; Hung, N.A. Minor steroid triglycoside, planciside D, from the tropical starfish Acanthaster planci. Chem. Nat. Comp. 2014, 50, 1032–1036. [Google Scholar] [CrossRef]
- De Correa, R.S.; Riccio, R.; Minale, L.; Duque, C. Starfish Saponins, Part 21. Steroidal glycosides from the starfish Oreaster reticulatus. J. Nat. Prod. 1985, 48, 751–755. [Google Scholar] [CrossRef]
- Otto, T.; Sicinski, P. Cell cycle proteins as promising targets in cancer therapy. Nat. Rev. Cancer. 2017, 17, 93–115. [Google Scholar] [CrossRef] [PubMed]
- Sun, Y.; Liu, W.Z.; Liu, T.; Feng, X.; Yang, N.; Zhou, H.F. Signaling pathway of MAPK/ERK in cell proliferation, differentiation, migration, senescence and apoptosis. J. Recept. Signal Transduct. Res. 2015, 35, 600–604. [Google Scholar] [CrossRef] [PubMed]
- Lavoie, H.; Gagnon, J.; Therrien, M. ERK signalling: A master regulator of cell behaviour, life and fate. Nat. Rev. Mol. Cell Biol. 2020, 21, 607–632. [Google Scholar] [CrossRef] [PubMed]
- Duronio, R.J.; Xiong, Y. Signaling pathways that control cell proliferation. Cold Spring Harb. Perspect. Biol. 2013, 5, a008904. [Google Scholar] [CrossRef] [PubMed]
- AAT Bioquest. Available online: https://www.aatbio.com/tools/ic50-calculator (accessed on 10 November 2020).
- Indrayanto, G.; Putra, G.S.; Suhud, F. Validation of in-vitro bioassay methods: Application in herbal drug research. Profiles Drug Subst. Excip. Relat. Methodol. 2021, 46, 273–307. [Google Scholar] [CrossRef]
- Du, F.; Zhao, X.; Fan, D. Soft agar colony formation assay as a hallmark of carcinogenesis. Bio Protoc. 2017, 7, e2351. [Google Scholar] [CrossRef]
42. Disclaimer/Publisher’s Note: The statements, opinions and data contained in all publications are solely those of the individual author(s) and contributor(s) and not of MDPI and/or the editor(s). MDPI and/or the editor(s) disclaim responsibility for any injury to people or property resulting from any ideas, methods, instructions or products referred to in the content. |


| Position | 1, 2 b | 3 | ||
|---|---|---|---|---|
| δH (J in Hz) | δC | δH (J in Hz) | δC | |
| 1 | 1.73 m 1.01 m | 41.0, CH2 | 1.65 m 1.00 m | 39.4, CH2 |
| 2 | 1.96 m 1.70 m | 25.3, CH2 | 1.93 m 1.68 m | 25.4, CH2 |
| 3 | 3.64 m | 80.6, CH | 3.58 m | 81.0, CH |
| 4 | 4.25 m | 74.7, CH | 4.23 m | 74.7, CH |
| 5 | 1.23 m | 50.5, CH | 1.12 m | 50.3, CH |
| 6 | 4.25 m | 76.2, CH | 4.15 m | 74.7, CH |
| 7 | 2.39 dd (15.0, 2.8) 1.60 dd (15.0, 3.1) | 45.3, CH2 | 2.13 ddd (14.3, 6.8, 3.3) 1.29 m | 40.5, CH2 |
| 8 | – | 76.8, C | 1.99 m | 31.8, CH |
| 9 | 0.97 m | 57.6, CH | 0.72 td (11.0, 4.5) | 56.1, CH |
| 10 | – | 36.9, C | – | 36.8, C |
| 11 | 1.80 m 1.46 m | 19.3, CH2 | 1.45 m 1.39 m | 21.4, CH2 |
| 12 | 1.96 m 1.24 m | 42.7, CH2 | 1.96 m 1.22 m | 41.4, CH2 |
| 13 | – | 45.4, C | – | 44.8, C |
| 14 | 1.17 d (9.5) | 66.4, CH | 1.05 dd (10.9, 9.3) | 63.6, CH |
| 15 | 4.27 td (9.5, 3.1) | 70.1, CH | 3.88 td (9.3, 3.4) | 74.3, CH |
| 16 | 1.92 m 1.78 m | 42.0, CH2 | 1.92 m 1.79 m | 42.0, CH2 |
| 17 | 1.33 m | 56.1, CH | 1.39 m | 55.1, CH |
| 18 | 0.95 s | 15.3, CH3 | 0.74 s | 13.8, CH3 |
| 19 | 1.43 s | 18.7, CH3 | 1.33 s | 18.1, CH3 |
| 20 | 1.31 m | 36.5, CH | 1.34 m | 37.0, CH |
| 21 | 0.90 d (6.0) | 19.0, CH3 | 0.93 d (6.3) | 19.2, CH3 |
| 22 | 1.63 m 0.94 m | 33.1, CH2 | 1.64 m 0.99 m | 33.1, CH2 |
| 23 | 1.55 m 1.26 m | 28.6, CH2 | 1.58 m 1.29 m | 28.5, CH2 |
| 24 | 3.31 m | 84.0, CH | 3.34 m | 84.0, CH |
| 25 | 1.86 m | 31.5, CH | 1.86 m | 31.5, CH |
| 26 | 0.88 d (6.8) | 18.5, CH3 | 0.89 d (6.9) | 18.5, CH3 |
| 27 | 0.89 d (6.8) | 18.1, CH3 | 0.89 d (6.9) | 18.2, CH3 |
| Position | 1 | 2, 3 b | ||
|---|---|---|---|---|
| δH (J in Hz) | δC | δH (J in Hz) | δC | |
| 2,4-di-OMe-Xylp | ||||
| 1′ | 4.44 d (7.5) | 102.6, CH | 4.44 d (7.5) | 102.7, CH |
| 2′ | 2.92 dd (9.0, 7.5) | 84.7, CH | 2.91 dd (8.9, 7.5) | 84.7, CH |
| 3′ | 3.43 t (9.0) | 76.7, CH | 3.43 t (8.9) | 76.6, CH |
| 4′ | 3.17 m | 81.0, CH | 3.17 m | 80.9, CH |
| 5′ | 4.00 dd (10.0, 4.0) 3.13 t (10.0) | 64.2, CH2 | 4.00 dd (10.1, 3.7) 3.14 t (10.1) | 64.2, CH2 |
| 2′-OMe | 3.61 s | 61.0, CH3 | 3.61 s | 61.0, CH3 |
| 4′-OMe | 3.45 s | 59.0, CH3 | 3.45 s | 59.0, CH3 |
| 3-OSO3−-Araf | ||||
| 1″ | 5.00 br s | 109.2, CH | 4.98 br s | 109.5, CH |
| 2″ | 4.24 m | 82.0, CH | 4.23 m | 82.1, CH |
| 3″ | 4.67 m | 84.7, CH | 4.46 dd (5.6, 2.3) | 84.5, CH |
| 4″ | 4.33 m | 84.1, CH | 4.22 m | 84.4, CH |
| 5″ | 4.14 dd (11.7, 3.7) 3.87 dd (11.7, 4.2) | 69.6, CH2 | 3.83 dd (12.0, 3.0) 3.71 dd (12.0, 5.2) | 63.1, CH2 |
| Glcp | ||||
| 1′″ | 4.34 d (7.7) | 104.9, CH | ||
| 2′″ | 3.22 dd (9.0, 7.7) | 75.1, CH | ||
| 3′″ | 3.35 t (9.0) | 77.8, CH | ||
| 4′″ | 3.28 m | 71.6, CH | ||
| 5′″ | 3.25 m | 77.9, CH | ||
| 6′″ | 3.85 dd (12.1, 2.3) 3.66 dd (12.1, 5.3) | 62.7, CH2 | ||
Disclaimer/Publisher’s Note: The statements, opinions and data contained in all publications are solely those of the individual author(s) and contributor(s) and not of MDPI and/or the editor(s). MDPI and/or the editor(s) disclaim responsibility for any injury to people or property resulting from any ideas, methods, instructions or products referred to in the content. |
© 2024 by the authors. Licensee MDPI, Basel, Switzerland. This article is an open access article distributed under the terms and conditions of the Creative Commons Attribution (CC BY) license (https://creativecommons.org/licenses/by/4.0/).
Share and Cite
Kicha, A.A.; Tolkanov, D.K.; Malyarenko, T.V.; Malyarenko, O.S.; Kuzmich, A.S.; Kalinovsky, A.I.; Popov, R.S.; Stonik, V.A.; Ivanchina, N.V.; Dmitrenok, P.S. Sulfated Polyhydroxysteroid Glycosides from the Sea of Okhotsk Starfish Henricia leviuscula spiculifera and Potential Mechanisms for Their Observed Anti-Cancer Activity against Several Types of Human Cancer Cells. Mar. Drugs 2024, 22, 294. https://doi.org/10.3390/md22070294
Kicha AA, Tolkanov DK, Malyarenko TV, Malyarenko OS, Kuzmich AS, Kalinovsky AI, Popov RS, Stonik VA, Ivanchina NV, Dmitrenok PS. Sulfated Polyhydroxysteroid Glycosides from the Sea of Okhotsk Starfish Henricia leviuscula spiculifera and Potential Mechanisms for Their Observed Anti-Cancer Activity against Several Types of Human Cancer Cells. Marine Drugs. 2024; 22(7):294. https://doi.org/10.3390/md22070294
Chicago/Turabian StyleKicha, Alla A., Dmitriy K. Tolkanov, Timofey V. Malyarenko, Olesya S. Malyarenko, Alexandra S. Kuzmich, Anatoly I. Kalinovsky, Roman S. Popov, Valentin A. Stonik, Natalia V. Ivanchina, and Pavel S. Dmitrenok. 2024. "Sulfated Polyhydroxysteroid Glycosides from the Sea of Okhotsk Starfish Henricia leviuscula spiculifera and Potential Mechanisms for Their Observed Anti-Cancer Activity against Several Types of Human Cancer Cells" Marine Drugs 22, no. 7: 294. https://doi.org/10.3390/md22070294