Article

Investigating the Mechanism of Action of Ipomoea pes-caprae in the Treatment of Rheumatoid Arthritis Based on Serum Metabolomics and Network Pharmacology

1
Guangxi Key Laboratory of Efficacy Study on Chinese Materia Medica, Guangxi University of Chinese Medicine, Nanning 530200, China
2
University Engineering Research Center of Reutilization of Traditional Chinese Medicine Resources, Guangxi University of Chinese Medicine, Nanning 530200, China
3
Guangxi Key Laboratory of TCM Formulas Theory and Transformation for Damp Diseases, Guangxi University of Chinese Medicine, Nanning 530200, China
4
Department of Pharmaceutical, Heilongjiang University of Chinese Medicine, Harbin 150040, China
*
Authors to whom correspondence should be addressed.
These authors contributed equally to this work.
Mar. Drugs 2025, 23(3), 114; https://doi.org/10.3390/md23030114
Submission received: 9 February 2025 / Revised: 27 February 2025 / Accepted: 3 March 2025 / Published: 7 March 2025
(This article belongs to the Special Issue Bioactive Specialized Metabolites from Marine Plants)

Abstract

:
Ipomoea pes-caprae (L.) Sweet (Convolvulaceae) is a commonly used marine Chinese medicine in the coastal areas of southern China. Traditionally, it has been used in the treatment of rheumatoid arthritis (RA). However, the mechanism of action against RA remains unclear. This study aimed to explore the mechanism of action of Ipomoea pes-caprae water extract (IPE) in the treatment of RA through serum metabolomics and network pharmacology. Rat models of RA with wind-dampness cold bi-syndrome (WCM) and wind-dampness heat bi-syndrome (WHM) were established to evaluate the therapeutic effect of IPE against RA. Ultra-high performance liquid chromatography-quadrupole time-of-flight mass spectrometry (UPLC-Q-TOF-MS/MS) technology was used to analyze the absorbed components of IPE in the plasma of the two models. Serum metabolomics was employed to identify potential biomarkers and metabolic pathways of IPE in the treatment of RA. The key targets and related pathways of RA were screened using network pharmacology and validated using molecular docking. The biomarker-pathway-target network was mapped via the combination of metabolomics and network pharmacology. A total of 10 chemical constituents were identified from WHM rat plasma, and eight chemical constituents were identified from WCM rat plasma. Serum metabolomics research identified 20 endogenous potential biomarkers, and 10 major metabolic pathways closely related to WHM and WCM. Network pharmacology analysis yielded 65 overlapping targets, with the core targets being ALB, AKT1, EGFR, and CASP3. Molecular docking showed that the four absorbed components in plasma had a strong binding activity with ALB and AKT1. Combining metabolomics and network pharmacology, two major biomarkers and two major pathways were identified. IPE can effectively relieve the symptoms of RA, and the potential mechanism of IPE in treating RA has been preliminarily elucidated. These results can provide a scientific basis for further drug research and development, as well as clinical application.

Graphical Abstract

1. Introduction

Rheumatoid arthritis (RA) is a systemic inflammatory autoimmune disease characterized by synovial hyperplasia, synovial inflammation, and joint destruction. It belongs to the category of ‘bi-syndrome’ in traditional Chinese medicine (TCM) [1]. Bi-syndrome is a syndrome of pain, soreness, numbness, weight, and movement disorder of limbs and joints caused by feeling the pathogenic factors of wind, cold, dampness, and heat. As the disease progresses, the incidence of limb disability and limited physiological function increases [2], so early diagnosis and intervention are crucial. At present, there is a lack of specific treatment measures for RA in clinical practice, and drug treatment is still the main treatment. The treatment goals are to reduce pain, control the development of inflammation, delay disease progression, and maintain joint function to the greatest extent. The most common types of drugs include non-steroidal anti-inflammatory drugs (NSAIDs), corticosteroids (CORT), disease-modifying anti-rheumatic drugs (DMARDs), etc. Although these drugs can effectively relieve the symptoms and progression of the disease, they still cannot fundamentally treat the disease and may cause toxic side effects such as cardiovascular diseases, damage of gastrointestinal tract, as well as liver and kidney [3]. Therefore, there is an urgent need to discover safer and more effective drugs for clinical treatment of RA. TCM has attracted much attention from researchers as a key component of complementary and alternative therapies due to its powerful therapeutic effects and relatively few side effects. Modern studies have shown that TMC has significant efficacy and low side effects in the treatment of various diseases, highlighting its importance in the modern medical system [4,5,6]. TCM treatment of bi-syndrome focuses on syndrome differentiation and treatment. According to the patient’s individual differences, symptoms, constitution, etiology, and other factors, personalized treatment plans are formulated for syndrome differentiation and treatment [7]. This individualized treatment can improve the patient’s symptoms and quality of life more comprehensively. In addition, TCM emphasizes the holistic concept and pays attention to regulating body functions as a whole. In the treatment of RA, it not only focuses on the inflammation and pain of local joints, but it also considers the overall condition of the whole body, such as immune function and endocrine status. Through multi-target and multi-way, the homeostasis of various physiological systems in the body is restored as a whole. TCM is increasingly being valued [8].
Serum metabolomics is an approach to exploring biological systems from a holistic perspective. It reflects the physiological and metabolic status of organisms by analyzing changes in metabolites in the body [9,10]. This is of great significance for the early diagnosis of diseases, the understanding of pathological mechanisms, and the discovery of new drugs. Network pharmacology is an integrative pharmacology that uses systems biology, bioinformatics, and network science methods to construct a visualized network of “drug-target-disease” to reveal the complex mechanism of TCM acting on diseases [11]. It is helpful to understand the comprehensive effects of multi-component and multi-target drugs and promote the development of personalized medicine and precision medicine [12]. In short, the combination of these two approaches in TCM research can more comprehensively and systematically reveal the overall pharmacodynamic characteristics and pharmacological mechanisms of TCM.
Ipomoea pes-caprae (L.) Sweet, belonging to the Convolvulaceae family and the Ipomoea genus, is a herbaceous climbing plant widely distributed in tropical and subtropical regions. It is one of the most common beach plants in the world. In the southern coastal areas of China, Ipomoea pes-caprae is a commonly used traditional marine medicine among the Jing ethnic group. In addition, Ipomoea pes-caprae, as a marine TCM, is also widely popular in tropical and subtropical countries such as Thailand, Brazil, Mexico, and Australia. It has the effects of dispelling wind and eliminating dampness, resolving abscesses, and dispersing nodules, as well as drawing out toxins and reducing swelling. It is commonly used to treat lumbar muscle strain and rheumatic joint pain [13,14,15]. Several marine-derived compounds can be effectively used to treat rheumatoid arthritis [16]. Marine TCM is rich in medicinal resources. The chemical constituents of Ipomoea pes-caprae mainly include resin glycosides, terpenoids, flavonoids, phenolic acids, volatile compounds, steroids, and other compounds, which exhibit various biological activities such as anti-inflammatory, antiviral, antitumor, antibacterial, and immunomodulatory effects [17]. The anti-inflammatory activity of Ipomoea pes-caprae, which aligns with its traditional efficacies, is considered one of its primary pharmacological effects. Our previous study demonstrated that Ipomoea pes-caprae has significant anti-RA efficacy [18] and good therapeutic effects on rats in the models of wind-dampness cold bi-syndrome (WCM) and wind-dampness heat bi-syndrome (WHM) [19]. However, its mechanism of action in the treatment of RA has not been fully elucidated. In the present study, we carried out the first metabolomics analysis of Ipomoea pes-caprae water extract (IPE) in a rat model of RA disease to obtain the differences in metabolic responses between the two models of bi-syndrome, followed by the combination of metabolomics and network pharmacology to identify the key anti-RA proteins in IPE. Finally, we successfully revealed the pharmacological basis, metabolic pathway, potential target, and mechanism of action of the IPE in the treatment of RA, which provides a scientific basis for its further drug development and clinical application.

2. Results

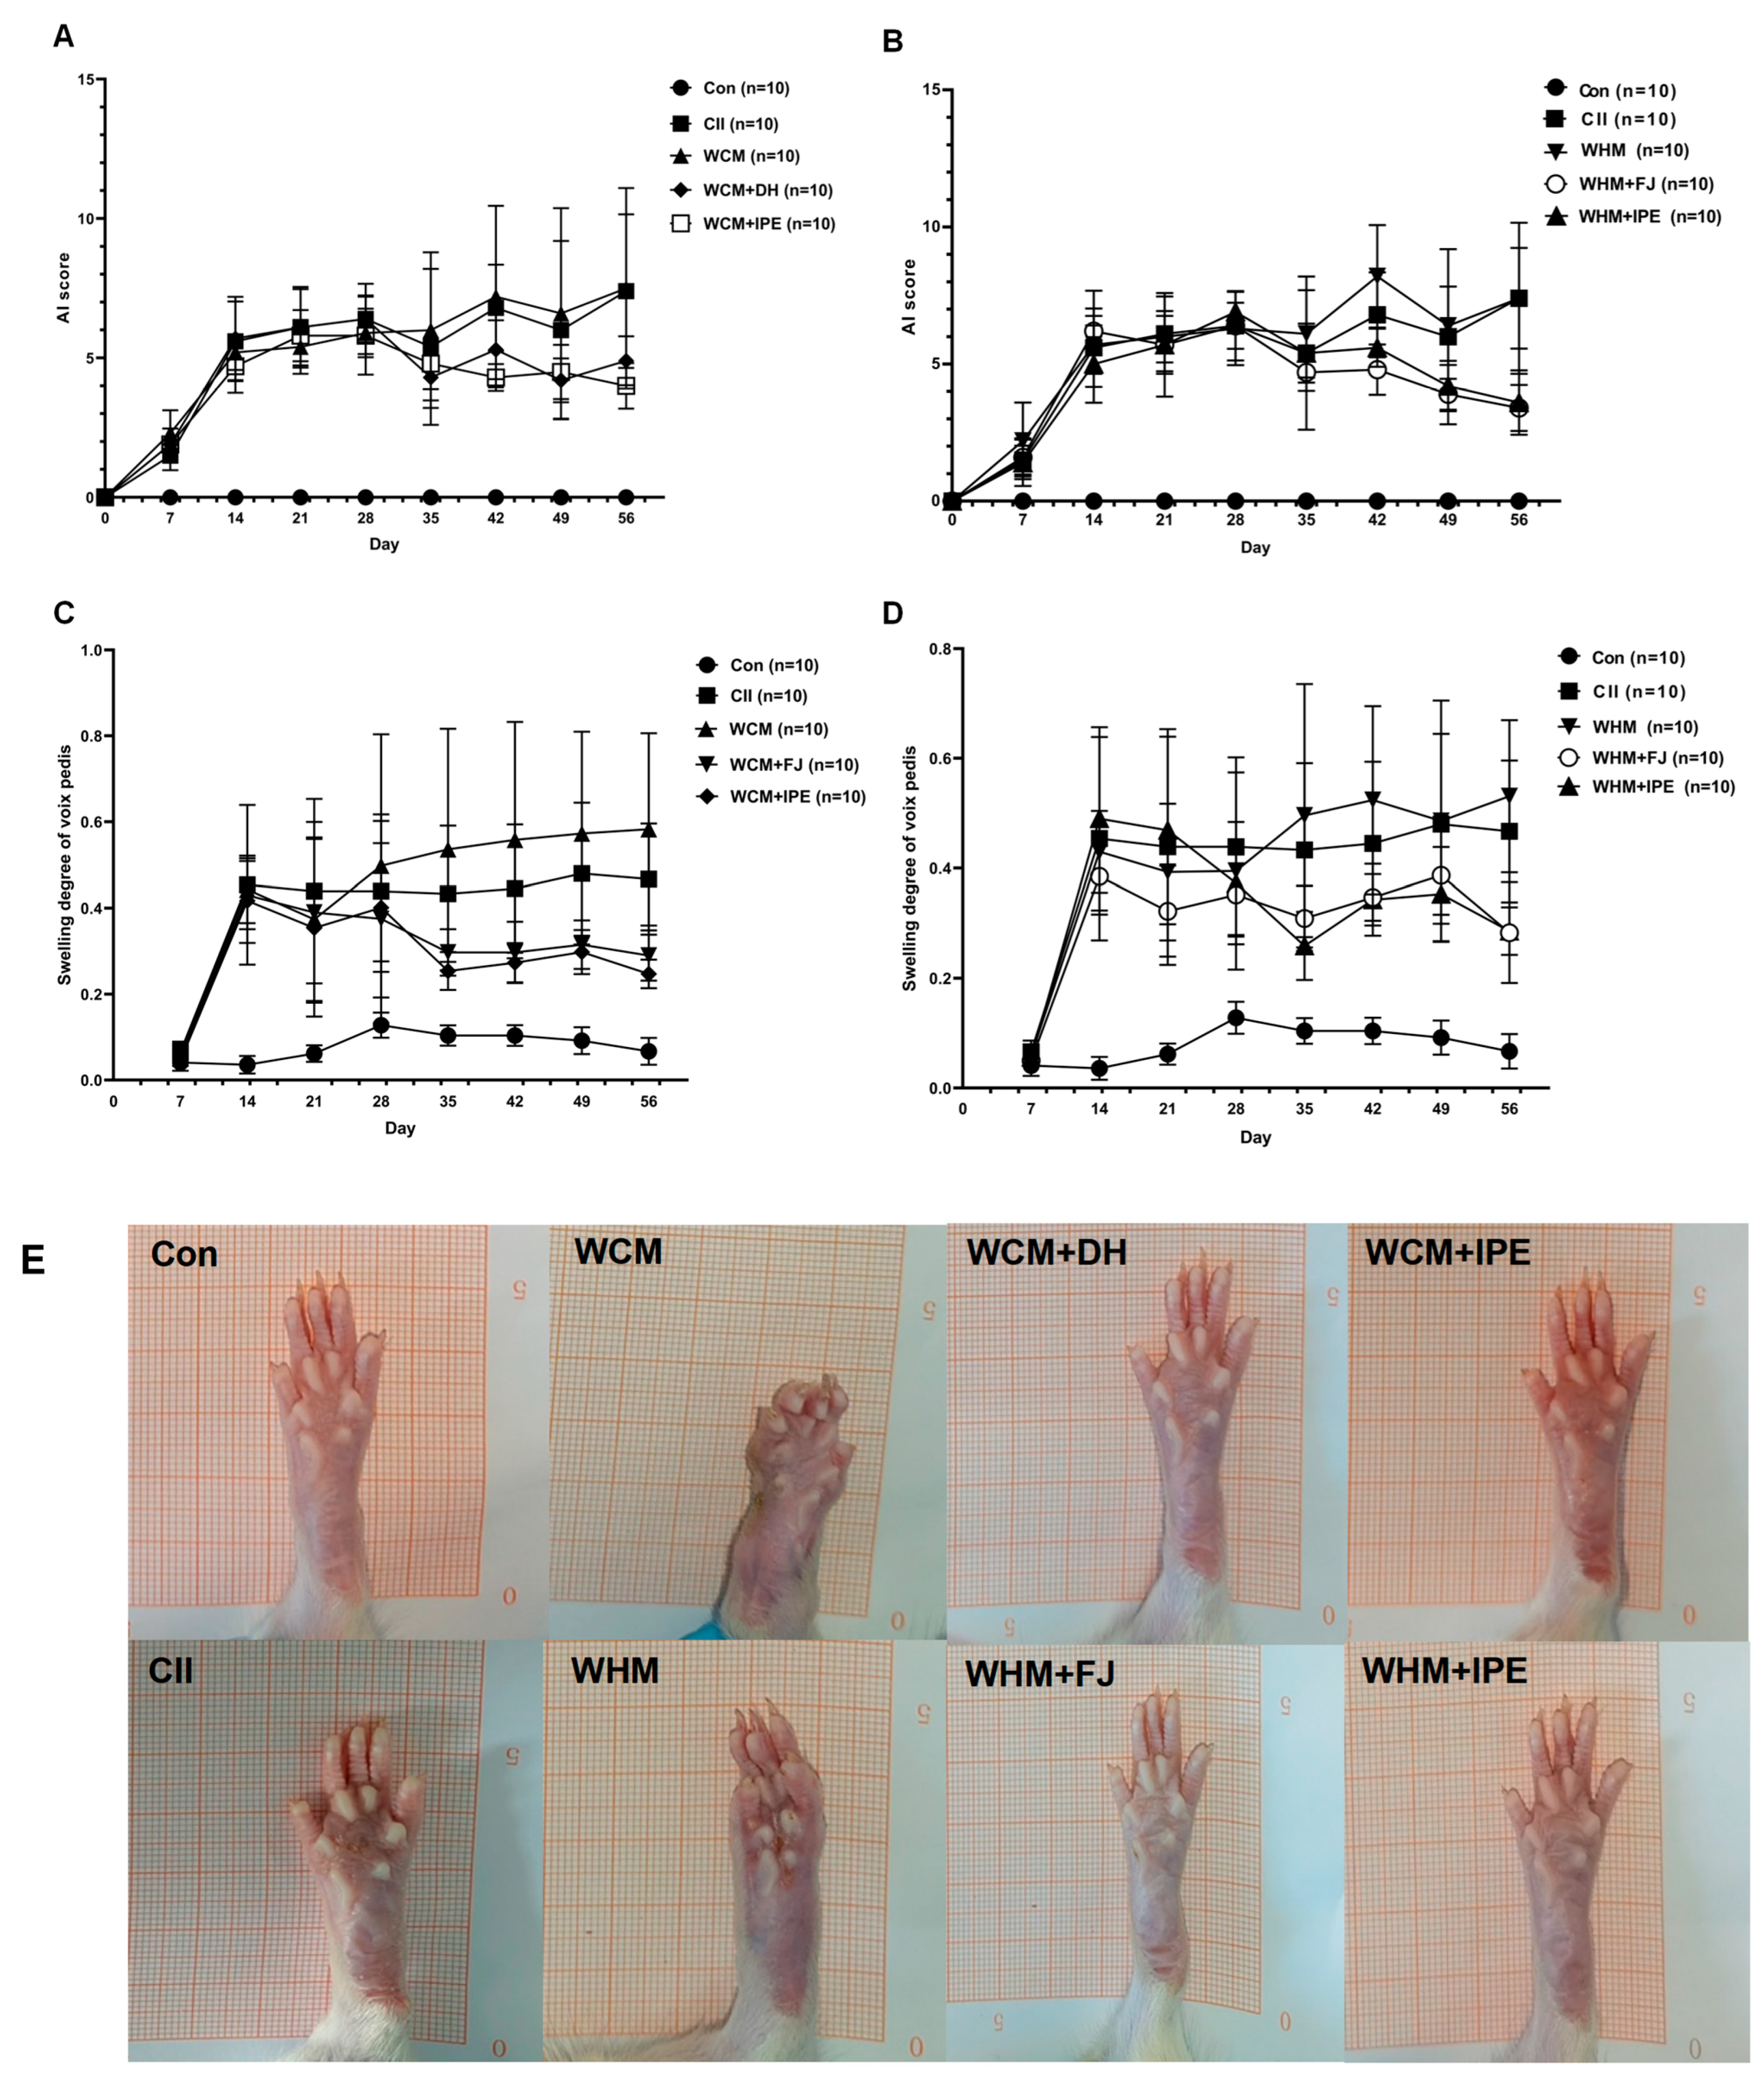
2.1. Effects of IPE on AI Score and Left Hind Toe Swelling in RA Rats

IPE showed significant therapeutic effects on both WCM and WHM rats. As shown in Figure 1A,B, compared with the normal control group (Con), the Arthritis Index (AI) scores of rats in each model group increased statistically significantly after seven days of modeling, which was statistically significant (p < 0.01). Compared with the WHM group, when administered on the 28th day, the AI scores of rats in the wind-dampness heat bi-syndrome + Fangji group (WHM + FJ) and wind-dampness heat bi-syndrome + Ipomoea pes-caprae group (WHM + IPE) decreased (p < 0.05 or p < 0.01). When compared with the WCM group, the AI scores of rats in the wind-dampness cold bi-syndrome + Duhuo group (WCM + DH) and the wind-dampness cold bi-syndrome + Ipomoea pes-caprae group (WCM + IPE) decreased (p < 0.05 or p < 0.01) on the 28th day of administration. The comparison of AI score of rats in each group is shown in Table 1.
In addition, as shown in Figure 1C,D, compared with the Con group, rats in each model group exhibited significant toe swelling on day 14 after modeling, and the difference was statistically significant (p < 0.01). On the 35th day of the experiment, it could be observed that the rats in the WCM and WHM groups showed more severe swelling of the left hind toe compared with the CII, but there was no significant difference. Compared with the WHM group, on the 14th day of drug administration, the swelling degree of the left hind toe of rats in the WHM + FJ group and WHM + IPE group decreased statistically significantly (p < 0.05 or p < 0.01). Compared with the WCM group, the swelling of the left hind toe of rats in the WCM + DH group and WCM + IPE group decreased statistically significantly (p < 0.05 or p < 0.01) on the 14th day of drug administration. The comparison of left hind toes swelling of rats in each group is shown in Table 2.

2.2. Pathological Section of Ankle Synovial Tissue and Micro-CT of the Ankle Joint of Rats

According to the pathological section of ankle synovial tissue of rats, compared with the Con group, the degree of synovial tissue lesions in rats in each model group was relatively severe, and inflammatory cell infiltration and fibrous tissue proliferation were observed in the synovial tissue, with significant differences. Compared with the WHM group, the degree of synovial tissue lesions in the WHM + FJ group and WHM + IPE group was relatively reduced. Compared with the WCM group, the degree of synovial tissue lesions was also relatively reduced in the WCM + DH group and WCM + IPE group (Figure 2A). In addition, according to micro-computed tomography (micro-CT), it could be observed that the ankle joints of the model rats in each group showed bone damage, irregular articular bone structure, joint space narrowing, severe erosion, and other changes in the joints compared with the Con group. After administration of IPE intervention, the ankle joint damage in rats in all groups showed different degrees of improvement (Figure 2B).

2.3. Effect of IPE on Inflammatory Factors in Serum

Compared with the Con group, the TNF-α and IL-6 levels of rats in the CII and the WCM and WHM groups increased significantly with statistical significance (p < 0.01), and the TNF-α and IL-6 levels of rats in the WCM and WHM groups were higher than those in the CII. Compared with the WHM group, the TNF-α and IL-6 levels of rats in the WHM + FJ group and WHM + IPE group decreased significantly (p < 0.05 or p < 0.01). Compared with the WCM group, the TNF-α and IL-6 levels decreased in rats in the WCM + DH group and WCM + IPE group (p < 0.05 or p < 0.01), as shown in Figure 3A,B.

2.4. Characterization of the Chemical Constituents of IPE

In this study, 49 chemical components were identified from IPE by ultra-performance liquid chromatography-mass spectrometry (UPLC-MS), including one resin glycoside, nine flavonoids, 28 organic acids, five coumarins, one lignan, two nucleosides, two terpenes, and one vitamin. The positive and negative base peak chromatogram (BPC) of IPE are shown in Figure 4A,B. The molecular formulae, secondary fragment ions, and relative content information for each of the 49 identified chemical components are presented in Table 3.

2.5. Identification and Relative Contents of the Absorbed Components in Plasma of the Con + IPE, WCM + IPE, and WHM + IPE Groups

Firstly, plasma samples from the Con, Con + IPE, WCM, WHM, WCM + IPE, and WHM + IPE groups were analyzed by UPLC-MS in positive and negative ion modes, respectively. Second, the precise relative molecular mass and secondary fragmentation information of the absorbed components in plasma were compared with the IPE component identification results to further identify the absorbed prototype of the components in plasma. The results showed that eight absorbed components in plasma were initially identified from the Con + IPE group, including caffeic acid, p-hydroxybenzoic acid, ferulic acid, isoscopoletin, scopoletin, methyl caffeate acid, protocatechuic acid, and esculetine. From the WHM + IPE group, 10 absorbed components in plasma were initially identified, including caffeic acid, p-hydroxybenzoic acid, ferulic acid, isoscopoletin, scopoletin, methyl caffeate acid, coumarin, protocatechuic aldehyde, protocatechuic acid, and esculetine. Eight absorbed components in plasma were initially identified from the WHM + IPE group, where these eight absorbed components in plasma were consistent with those of the Con + IPE group (Table 4).

2.6. Pharmacokinetic Analysis of the Absorbed Components of IPE in the Plasma

In the preliminary stage of this study, we carried out a comprehensive analysis of the differential content of IPE in different models and administration groups and finally chose caffeic acid, protocatechuic acid, and ferulic acid among the absorbed components of IPE in the plasma to further investigate the in vivo pharmacokinetic characteristics of IPE. The results showed that the area under the drug–time curve (AUC0~t) of the three absorbed components in the plasma was smaller in the WCM + IPE and WHM + IPE groups compared with that in the Con + IPE group; the time to peak drug concentration (Tmax) and half-life (t1/2) of the absorbed components in the plasma were prolonged in the WCM + IPE group; the t1/2 of the blood concentration was shortened in the WHM + IPE group; and the Tmax was comparable in the WHM + IPE and Con + IPE groups; compared with WHM + IPE, the WCM + IPE group had lower peak concentration (Cmax) and longer t1/2, indicating that there were differences in the rate and extent of absorption of different components of IPE in normal and pathological model rats. The drug–time curves of caffeic acid are shown in Figure 5A, protocatechuic acid in Figure 5B, and ferulic acid in Figure 5C. The main pharmacokinetic parameters are shown in Table 5.

2.7. Serum Metabolomics Analysis of IPE in RA Rats

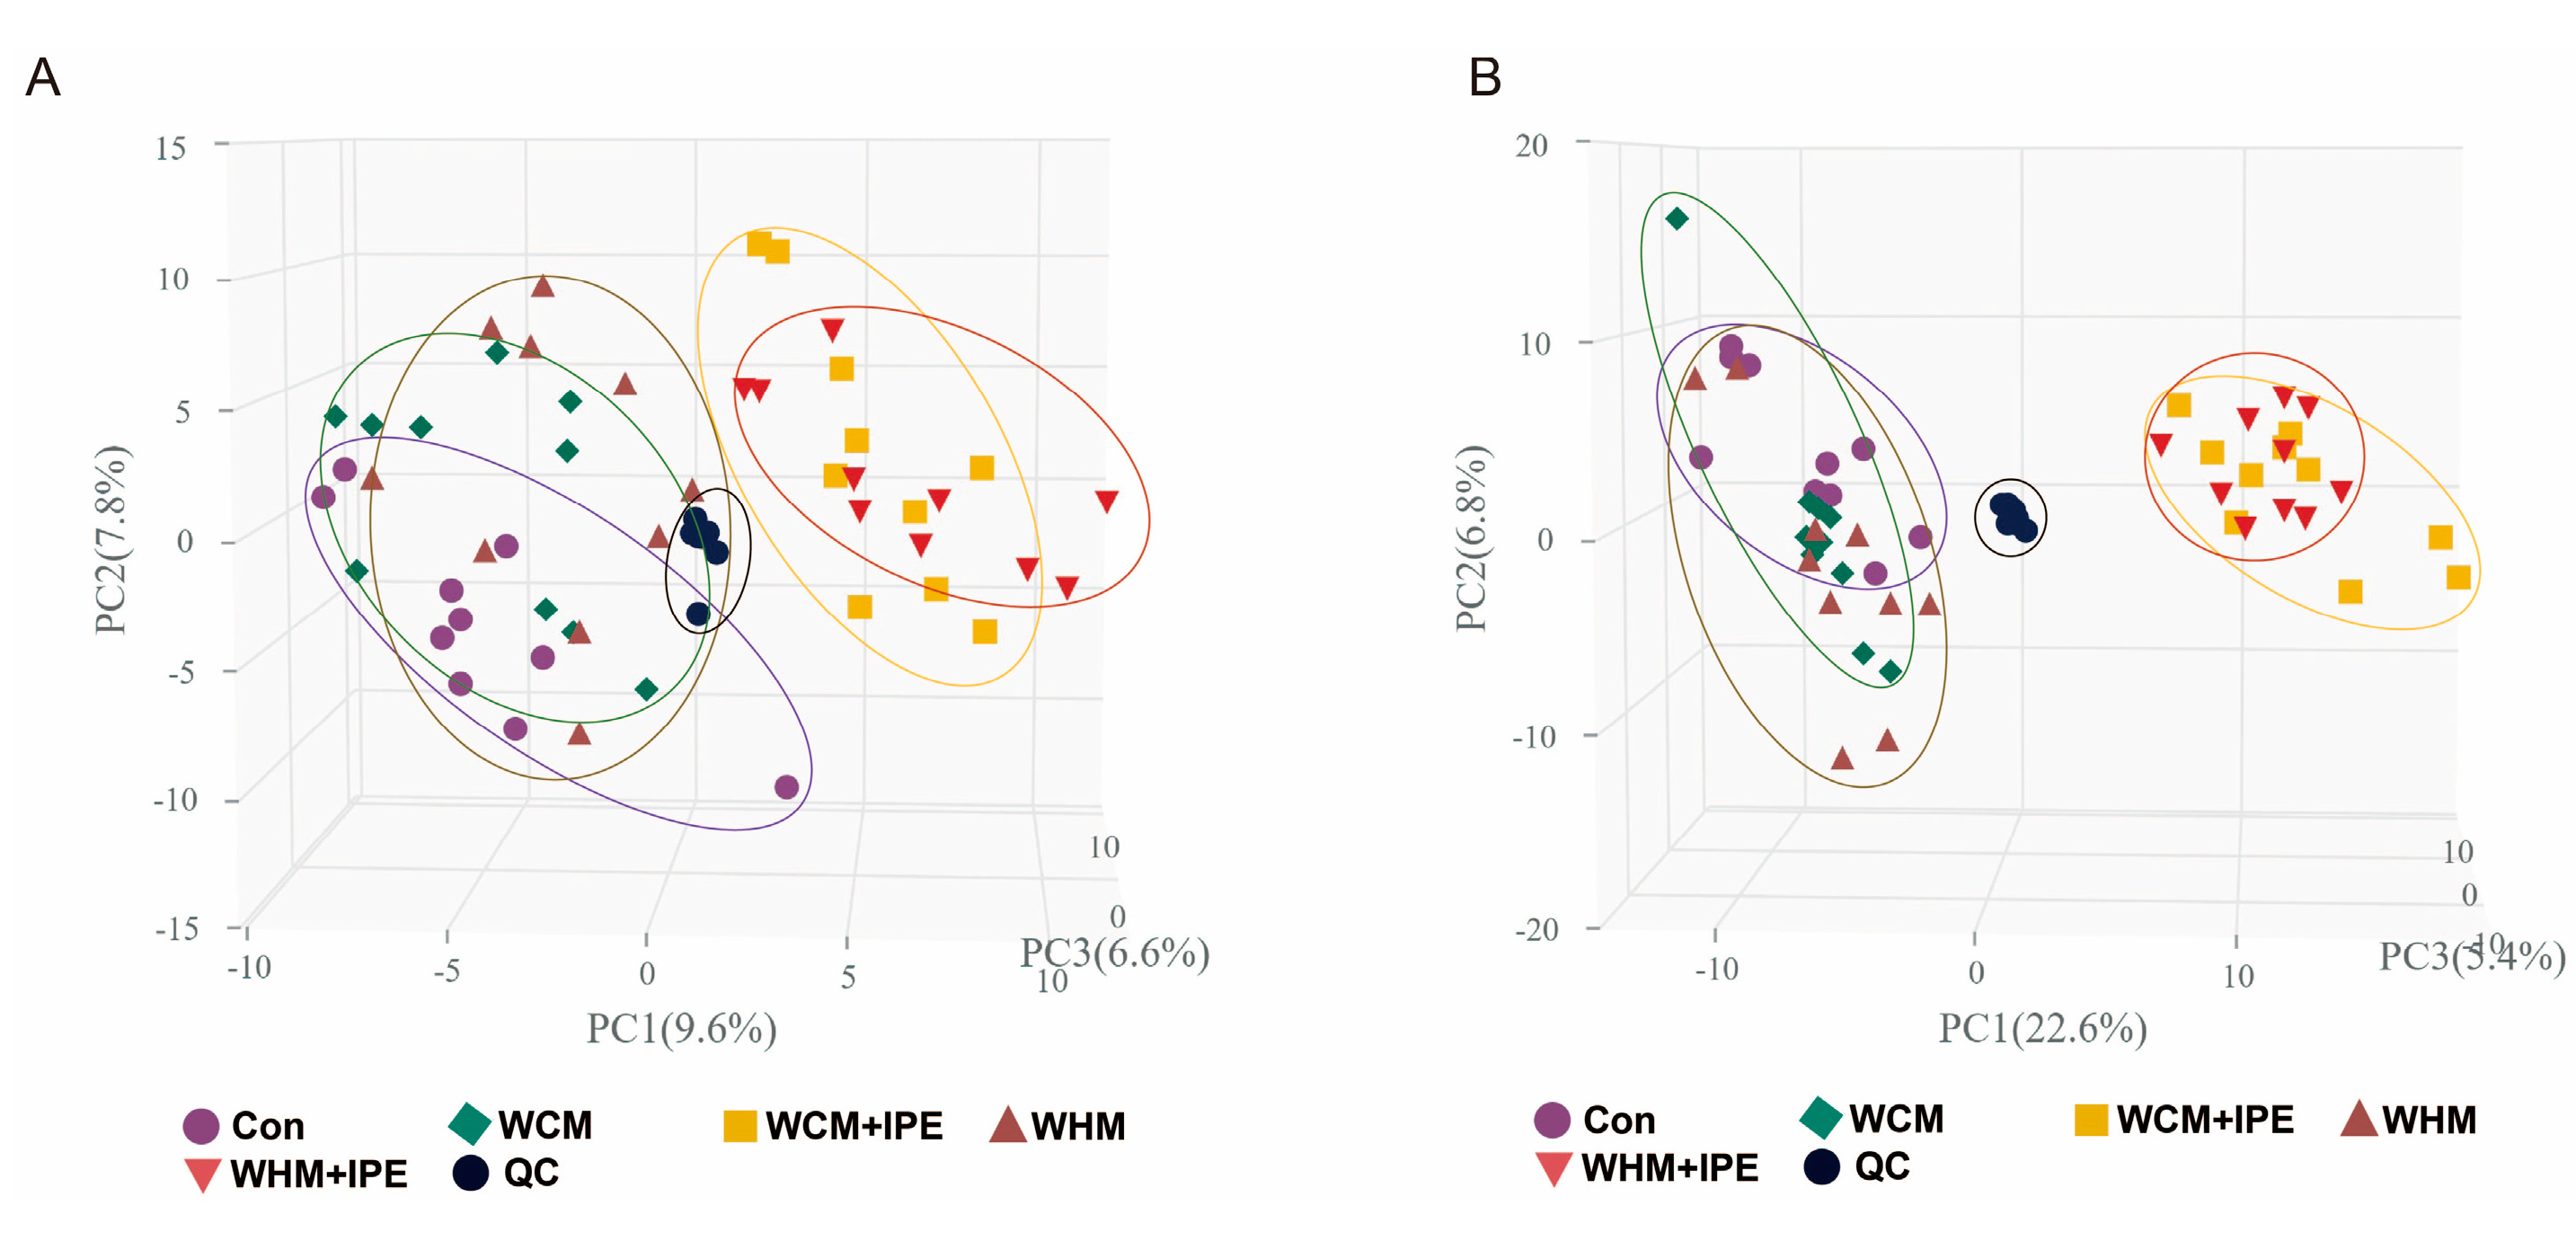
2.7.1. PCA of Serum Samples

The results of multivariate data analysis are shown in Figure 6A,B. First, unsupervised principal component analysis (PCA) analysis was performed on each experimental group, including the Con, WCM, WHM, WCM + IPE, and WHM + IPE groups. The quality control (QC) samples clustered well in positive and negative ion modes, indicating that the instrumental method was applicable. The normal control group and each model group were well distinguished in both modes, indicating that the RA model was successfully constructed. The administered group differed from each model group in both modes, indicating that IPE has a certain therapeutic effect on RA.

2.7.2. OPLS-DA Analysis of Serum Samples

The data of the Con, WCM, and WHM groups were analyzed by OPLS-DA modeling in positive and negative ion modes, respectively, and the score plots are shown in Figure 7. As can be seen from the figure, the model was not overfitted in the positive and negative ion modes, with good explanatory power and reliable data analysis. In the positive and negative ion modes, the Con, WCM, and WHM groups were separated in terms of composition, and the endogenous composition of rat serum was changed after modeling, which indicated that the modeling was successful. In the comparison between the WCM and WHM groups, the composites were separated, indicating that there might be differences between the two modeling groups. Compared with the WCM and WHM groups, the WCM + IPE and WHM + IPE groups were separated by components, indicating that IPE administration interfered with the metabolism of serum endogenous components. The inter-group comparison between the WCM + IPE and WHM + IPE groups showed separation of components, suggesting that IPE may exert its efficacy by regulating different endogenous metabolites.

2.7.3. Identification of Endogenous Biomarkers

A total of 11 potential biomarkers closely related to wind-dampness heat bi-syndrome and 10 potential biomarkers closely related to wind-dampness cold bi-syndrome were screened and identified under positive and negative-ion modes. The results showed that the serum levels of 1-methyl-l-histidine were significantly higher (p < 0.05), while the levels of urocanic acid, D-allose, D-threonate, hippuric acid, L-threonate, pentachlorophenol, pyrocatechol, creatinine, DL-normetanephrine, and malonic acid were significantly lower (p < 0.05, p < 0.01) in rats from the WHM group compared with those from the Con group. Compared with the WHM group, the content of each component in the serum of rats in the WHM + IPE group was significantly adjusted back (p < 0.05, p < 0.01). Compared with the Con group, the serum levels of capric acid, O-succinyl-L-homoserine, octanoic acid, uracil, γ-aminobutyric acid, 2′-deoxycytidine, and cytosine in rats of the WCM group were significantly increased (p < 0.05), while the levels of urocanic acid, p-coumaryl alcohol, and D-mannose were significantly reduced (p < 0.05, p < 0.01). Compared with the WCM group, the content of each component in the serum of rats in the WCM + IPE group was significantly restored (p < 0.05, p < 0.01). The results indicated that IPE had a good modulatory effect on the endogenous biomarkers in the serum of rats with WCM and WHM (Table 6).

2.7.4. Analysis of the Major Metabolic Pathways in IPE

IPE administration was able to significantly affect eight metabolic pathways in wind-dampness cold bi-syndrome: histidine metabolism, fatty acid biosynthesis, alanine, aspartate and glutamate metabolism, butanoate metabolism, arginine and proline metabolism, pyrimidine metabolism, and pantothenate and CoA biosynthesis, beta-alanine metabolism. IPE administration could significantly affect three metabolic pathways in wind-dampness heat bi-syndrome, namely histidine metabolism, phenylalanine metabolism, and tyrosine metabolism. As shown in Figure 8A,B.

2.8. Network Pharmacological Analysis of IPE Against RA

In this experiment, 10 components absorbed components of IPE in the plasma by the UPLC-MS technique were identified as the potential bioactive components of IPE, which might form the possible pharmacological material basis for IPE to exert its pharmacological effects against RA with wind-dampness cold bi-syndrome and wind-dampness heat bi-syndrome. Based on the 10 absorbed components of IPE in the plasma, 253 drug targets were predicted from the PharmMapper database and TCMSP database. Combined with Gene Cards and OMIM databases, 1542 RA disease targets were obtained. From the Venn diagram of “disease target-drug target” overlap, 65 targets were identified as potential targets for IPE in RA (Figure 9A). KEGG pathway enrichment analysis showed that the IL-17 and PI3K/Akt signaling pathways were the most critical signaling pathways among the top 10 signaling pathways (Figure 9B). GO analysis was performed to enrich the biological processes (BPs), cellular components (CCs), and molecular functions (MFs) of the protein targets, as shown in Figure 9C. An “absorbed components-target-disease” interaction network was constructed, which consisted of 75 nodes and 432 edges. The core targets were calculated by CentiScaPe 2.2, and the center nodes with a high degree of association were ALB, AKT1, EGFR, and CASP3, suggesting that these were the key targets (Figure 9D). Table 7 lists the core targets and their degree values.

2.9. Molecular Docking of Absorbed Components in the Plasma to Key Targets

A total of 10 absorbed components in the plasma were subjected to molecular docking with the four key targets sequentially, and the results are shown in Figure 10A. The depth of color represents the absolute value of binding energy. The darker the color, the greater the absolute value of binding energy and the stronger the binding effect. The combinations with stronger binding effects were visualized (Figure 10B). The results showed that the binding energy of scopoletin docked with AKT1 was −6.23 kJ/mol, forming three hydrogen bonds with residue ALA116 of AKT1; the binding energy of scopoletin docked with ALB was −6.11 kJ/mol, forming two hydrogen bonds with residue ARG186 of ALB and one hydrogen bond with residue TYR138. Methyl caffeate docked with AKT1 had a binding energy of −6.96 kJ/mol, and formed two hydrogen bonds with residue GLY117 of AKT1; methyl caffeate docked with ALB had a binding energy of −5.20 kJ/mol, and formed four hydrogen bonds with residues ASP121, VAL120, LYS174, and ALA172 of ALB. The binding energy of protocatechuic acid docked with AKT1 was −6.4 kJ/mol, and five hydrogen bonds were formed with ASP91 residue of AKT1; the binding energy of protocatechuic acid docked with ALB was −5.66 kJ/mol, and three hydrogen bonds were formed with LYS-199, GLN-196, and SER-192 residues of ALB; and the binding energy of ferulic acid docked with AKT1 was −6.63 kJ/mol, forming four hydrogen bonds with the LYS-88, ALA-112, and GLY-117 residues of AKT1; the binding energy of ferulic acid docked with ALB was −5.18 kJ/mol, forming three hydrogen bonds with the LYS-199 and LYS-195 residues of ALB.

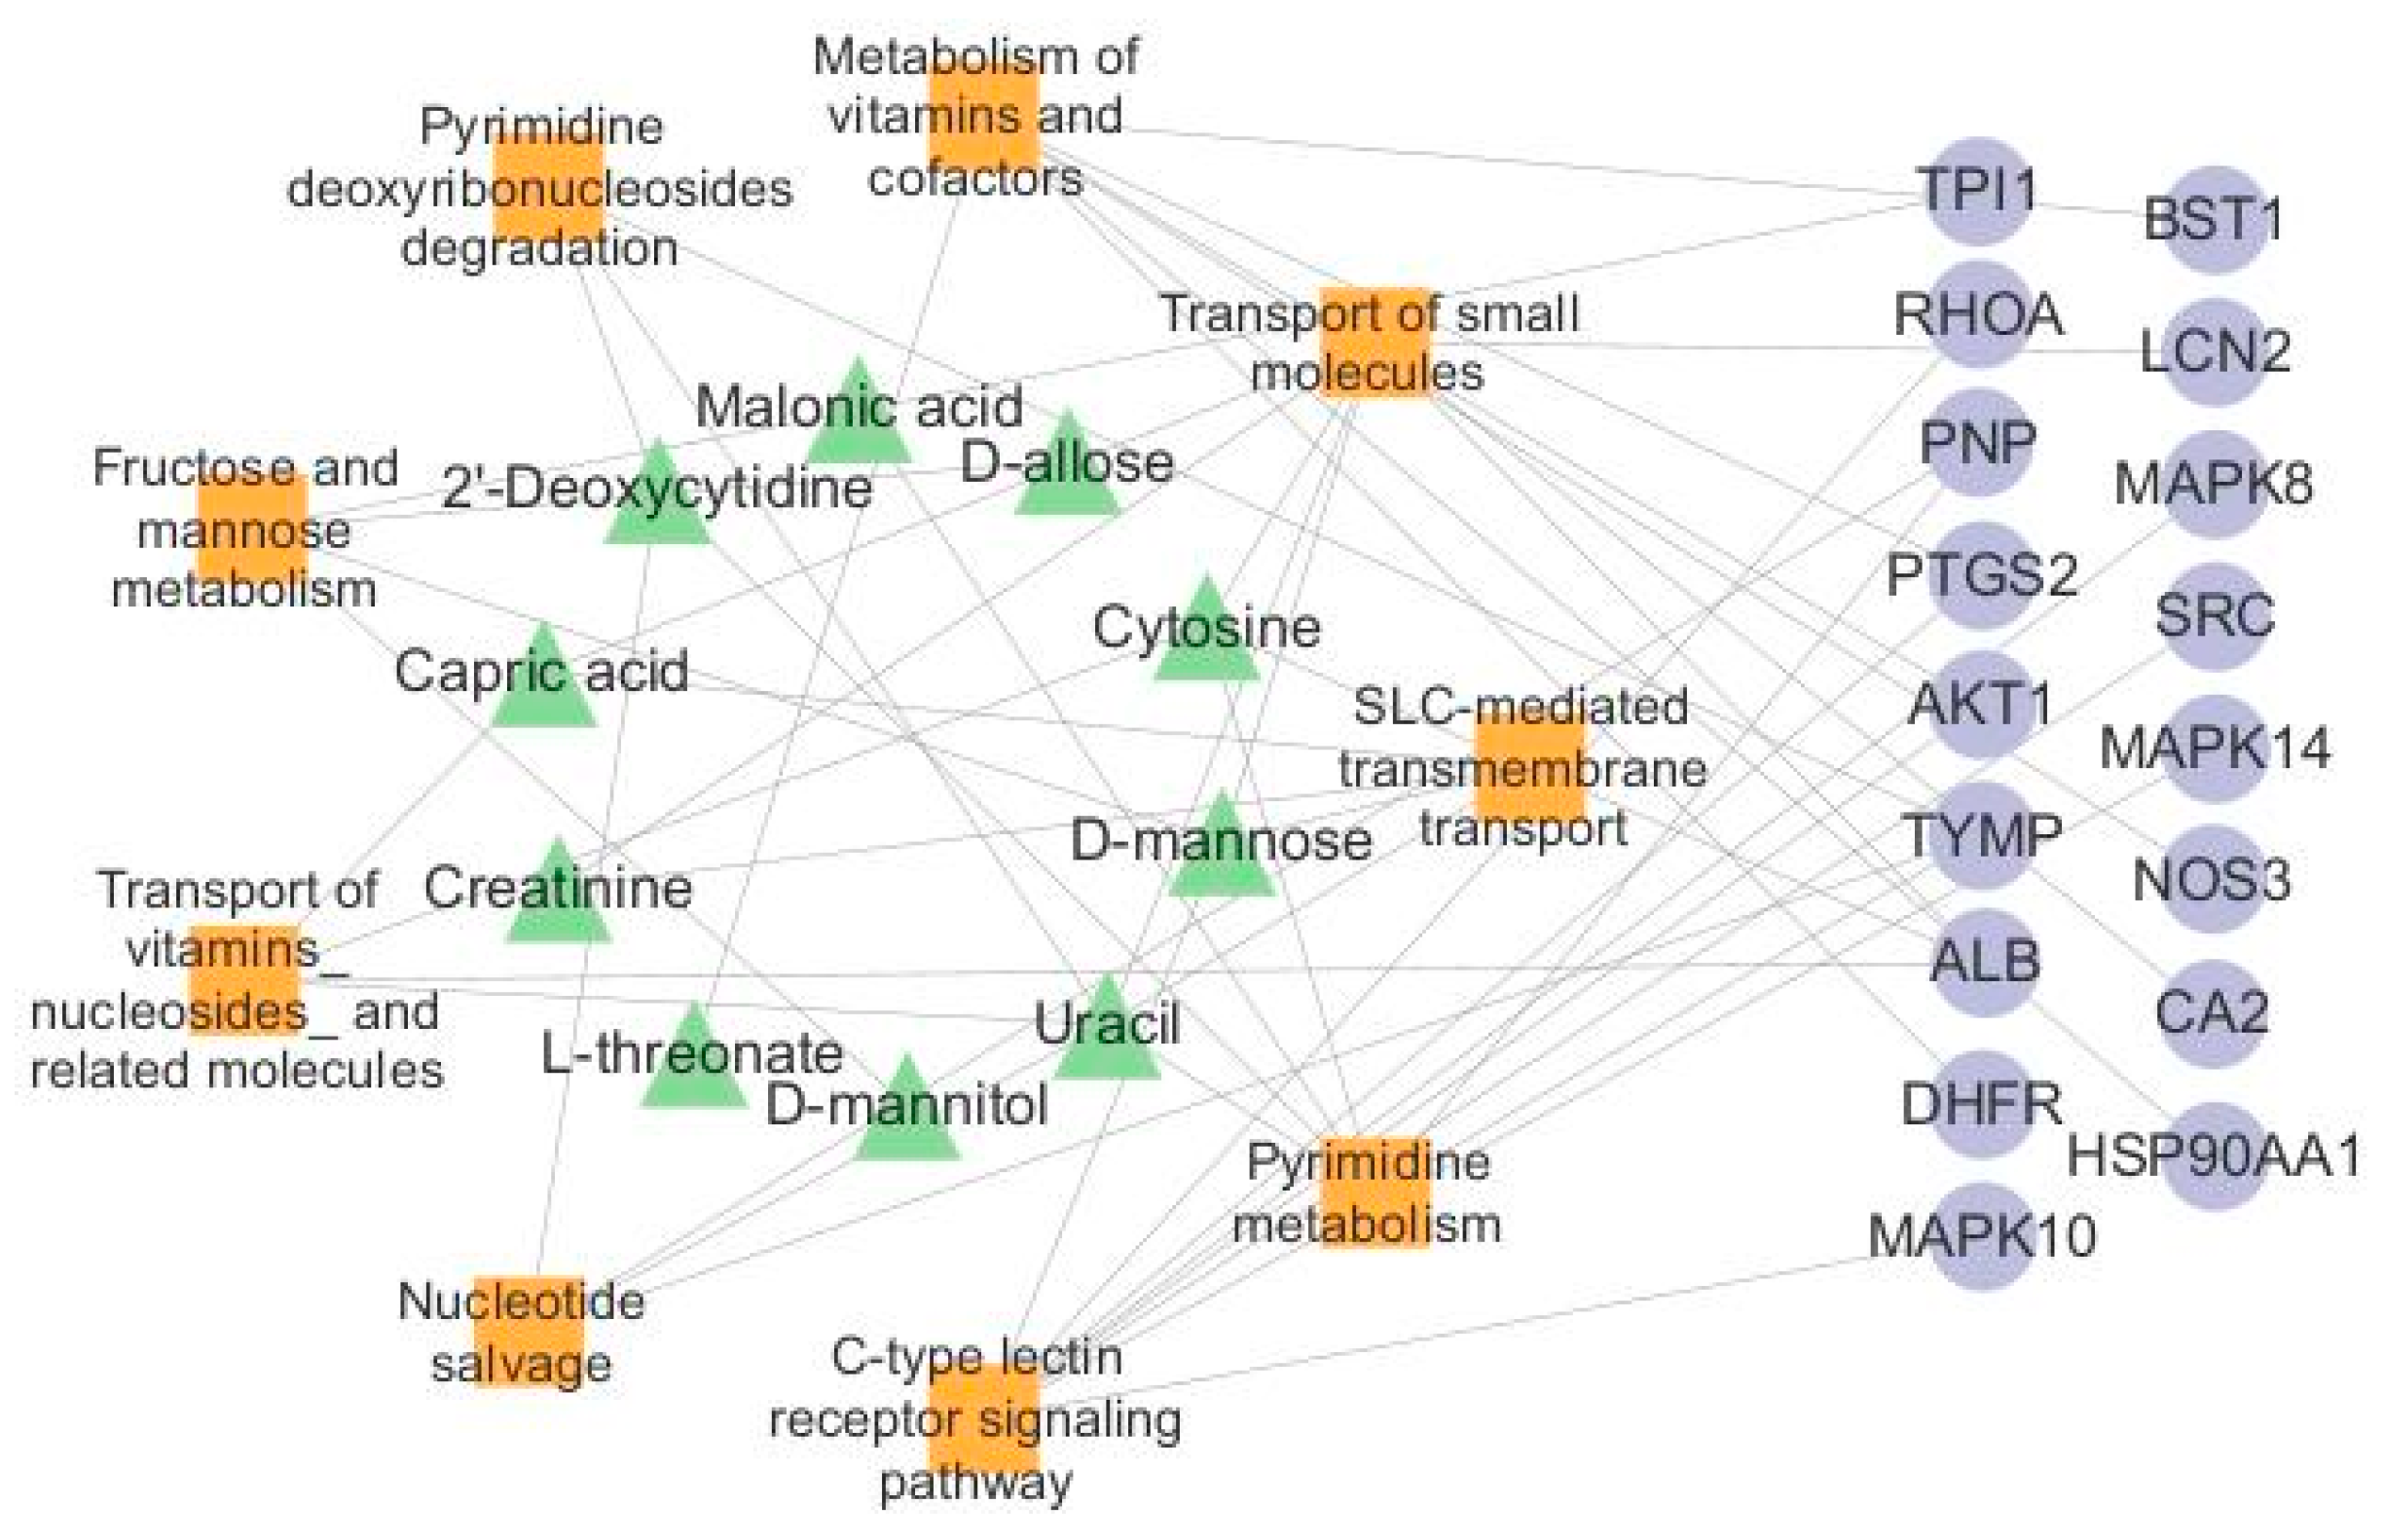
2.10. Network Analysis of Endogenous Biomarkers and Targets

A total of 20 endogenous biomarkers identified by metabolomics and 65 potential targets obtained by network pharmacology were jointly analyzed, and the results were visualized using Cytoscape 3.10 to construct a visual network diagram of biomarkers-pathways-targets. The results of the analysis showed the interactions of nine pathways, 17 targets, and 10 biomarkers, with a total of 36 nodes (Figure 11). The final further screening yielded two key signaling pathways: SLC-mediated transmembrane transport pathway and C-type lectin receptor signaling pathway; key endogenous biomarkers as D-mannose and cytosine; core targets as ALB and AKT1.

3. Discussion

The pathogenesis of RA is quite complex, and one of the core links is the persistent chronic inflammation of joint synovium induced by pro-inflammatory cytokines. In this process, inflammatory factors such as IL-6 and TNF-α play a crucial role and are regarded as key factors in the inflammatory process of RA. Studies have shown that the levels of pro-inflammatory cytokines, such as IL-6 and TNF-α, significantly up-regulate in patients with RA [20]. In particular, IL-6 not only serves as one of the major mediators of systemic inflammation in RA but also plays a key pro-inflammatory role in the pathogenesis of the disease and regulates joint pain [21]. Notably, the present experimental data showed that IPE could effectively reduce the serum levels of IL-6 and TNF-α, thereby inhibiting the progression of RA to a certain extent.
X. Cheng et al. explored the mechanism of Ipomoea pes-caprae in AIA arthritis rats under network pharmacological analysis [22]. Compared with the AIA model, the CIA model is a gold standard model for exploring the pathogenesis of RA and evaluating therapeutic drugs, which has been widely recognized and applied [23]. In this study, in order to follow the theory of TCM, the principle of identification and treatment, and to further validate the traditional efficacy of Ipomoea pes-caprae and clarify its mechanism of action, we reconstructed the CIA model based on specific environments (rheumatic cold and heat), namely wind-dampness cold bi-syndrome and wind-dampness heat bi-syndrome models, based on the existing foundation [19,24,25]. Compared with the AIA model, wind-dampness cold bi-syndrome and wind-dampness heat bi-syndrome models can better simulate the pathogenesis of RA syndrome.
On the basis of the analysis of the chemical composition of the IPE, further analysis of its components in the body is of more important value and significance for the determination of the material basis of the medicinal effect and the study of the mechanism of action. In this study, we identified chemical components of 49 IPE based on the UPLC-MS technique, and eight absorbed components in plasma from the rats in the Con and WHM groups, and 10 absorbed components in plasma from the rats in the WCM group. One of the absorbed components in plasma, scopoletin, could target and regulate tyrosine kinases on fibroblast-like synoviocytes (FLS) to block NF-κB signaling, thereby attenuating the progression of RA [26]. Caffeic acid inhibits IL-6 and TNF-α and attenuates the inflammatory response in RA-FLS by blocking the phosphorylation of IκB and IκB kinases [27]. Ferulic acid inhibits JAK/STAT pathway-mediated RA by modulating the levels of C-reactive protein (CRP), rheumatoid factor (RF), TNF-α, and TGF-β, and increasing JAK2 levels [28]. Protocatechuic acid inhibits the secretion of MMP-3, MMP-13, TNF-α, IL-1β, and IL-6; regulates the expression of p-p65 and IκBα; and reduces the phosphorylation level of Akt and mTOR, and exerts anti-RA effects by inhibiting the NF-κB and Akt/mTOR signaling pathways [29]. Esculetin modulates RA by decreasing LTB4 levels [30]. It also exerts its anti-inflammatory effects by decreasing the secretion of NO and soluble intercellular adhesion molecules [31].
Next, we performed a serum metabolomics study in IPE to search for biomarkers and speculate on their metabolic pathways. It was found that a total of 11 potential biomarkers were screened after IPE intervention in WHM rats, of which 10 biomarkers were significantly up-regulated and one biomarker was significantly down-regulated. These biomarkers could mainly affect the metabolic pathways of histidine, phenylalanine, and tyrosine. A total of 10 potential biomarkers were screened after IPE intervention in WCM rats, of which three biomarkers were significantly up-regulated and seven biomarkers significantly down-regulated. These biomarkers mainly affected the metabolic pathways of histidine metabolism, fatty acid biosynthesis, alanine, aspartic acid, and glutamic acid metabolism. Compared with the WHM group, the serum levels of D-allose, D-mannitol, equine uric acid, L-threonate, pentachlorophenol, urocanic acid, creatinine, pyrocatechol, DL-norepinephrine, and malonic acid were up-regulated, while the content of methylhistidine was down-regulated. It is suggested that IPE may regulate the energy metabolism disorder of WHM rats in terms of amino acid metabolism and pyrimidine metabolism. Compared with the WCM group, the serum levels of urocanic acid, p-coumaryl alcohol, and D-mannose were up-regulated, while the levels of octanoic acid, capric acid, O-succinyl-L-homoserine, uracil, γ-aminobutyric acid, 2′-deoxycytidine, and cytosine were down-regulated in the WCM + IPE group, indicating that IPE might regulate the energy metabolism disorder in WCM rats in terms of amino acid metabolism, pyrimidine metabolism, and fatty acid metabolism.
In conclusion, IPE can adjust the content of biomarkers and make them return to normal levels, which has an obvious corrective effect, indicating that IPE can improve the metabolic profile abnormality and material metabolism disorder caused by wind-dampness heat bi-syndrome and wind-dampness cold bi-syndrome. This is one of the mechanisms of IPE’s anti-RA action.
We further carried out network pharmacological analysis to obtain four core targets and used KEGG to obtain two key signaling pathways associated with RA disease. ALB, also known as albumin (ALB), is the most important protein in human plasma [32]. The albumin-to-fibrinogen ratio (AFR) and C-reactive protein-to-albumin ratio (CAR) have become commonly used biomarkers to predict systemic inflammation [33]. High C-reactive protein (CRP) levels and low albumin (ALB) levels may be associated with chronic and severe inflammation. Several studies have shown that the CRP to ALB ratio (CAR) is associated with inflammatory status [34,35]. Recently, significantly increased fibrinogen (Fib) levels and lower ALB levels have been reported in RA patients [36,37]. AKT is protein kinase B, also known as PKB or Rac, and AKT1 is the main member of the AKT family. As a downstream molecule of the PI3K/Akt signaling pathway, when activated, AKT1 can inhibit cell proliferation and apoptosis, thus promoting cell survival. The PI3K/Akt signaling pathway could regulate the release and proliferation of inflammatory factors, apoptosis, and the formation of inflammation-related enzymes, and participate in the development of RA. The PI3K/Akt signaling pathway was found to be widespread and abnormally activated in RA synoviocytes [38]. Inhibition of the expression of the PI3K/Akt signaling pathway could induce apoptosis of fibroblast-like synoviocytes and have therapeutic effects on RA [39]. Phosphorylation of PI3K/Akt could also activate IL-1β and induce the expression of pro-inflammatory factors TNF-α and IL-6 and joint inflammation in rats [40]. EGFR (epidermal growth factor receptor, EGFR) is a member of the epidermal growth factor receptor (HER) family, and binding of EGFR to its corresponding ligands could activate several intracellular signaling pathways, such as the PI3K/Akt and MAPK pathways. EGFR and its ligands can also induce cytokine Caspase 3 (CASP3) production in synovial fibroblasts during the pathogenesis of RA [41]. It has been found that in RA patients, TNF induces caspase 3/GSDME activation and triggers monocyte and macrophage pyroptosis [42]. Therefore, inhibition of TNF-induced caspase 3/GSDME-mediated pyroptosis attenuates RA. IL-17 is a pro-inflammatory cytokine that promotes stromal cell proliferation, osteoclast differentiation, and angiogenesis in RA. IL-17 has been shown to activate many common downstream signaling pathways, including NF-κB, MAPKs, JNK, p38, ERK, C/EBP, PI3K, and JAK/STATs. Prolonged intra-articular administration of IL-17 in mice leads to the emergence of key features of RA, such as inflammation and destruction of articular bone and cartilage [43]. IL-17 can also cause bone destruction by inducing osteoclastogenesis [44]. In addition, upregulation of TNF and IL-17 can lead to further stimulation of fibroblasts and epithelial cells to secrete IL-6, IL-8, PGE2, and neutrophil chemotactic agents, thereby exacerbating the development of inflammation [45].
Finally, we combined metabolomics and network pharmacology analyses to identify the key targets of IPE for RA as ALB and AKT1, with endogenous biomarkers being D-mannose and cytosine, and the key signaling pathways involved are SLC-mediated transmembrane transport and C-type lectin receptor signaling pathway. In addition, we also found that the four absorbed components in plasma, namely, scopoletin, methyl caffeate, protocatechuic acid, and ferulic acid, had strong binding capacities with ALB and AKT1, respectively, through molecular docking validation, suggesting that scopoletin, caffeic acid methyl ester, protocatechuic acid, and ferulic acid of IPE may exert anti-RA effects by regulating ALB and AKT1.

4. Materials and Methods

4.1. Chemical Reagents and Standards

Methanol, acetonitrile, and formic acid for mass spectrometry were purchased from Thermo Fisher Scientific (168 Third Avenue, Waltham, MA 02451, USA.); natural bovine collagen type II was purchased from Merck (Frankfurter Straße 250, 64293 Darmstadt Germany); complete Freund’s adjuvant was purchased from SIGMA (3050 Spruce Street St., Saint Louis, MO, USA); Duhuo formula granules and Fangji formula granules were purchased from PuraPharm (No. 9, Jinhe Road Nanning Economic and Technological Development Area, Nanning, China) Corporation; and IL-6 and TNF-α were purchased from Elabscience Biotechnology Co., Ltd. (No. 6, Jiufu Road, Jiangxia District, Wuhan, China). Caffeic acid (MUST-22062118), scopoletin (MUST-21032415), protocatechuic acid (MUST-22041413), syringic acid (MUST-22052411), and ferulic acid (MUST-22052411) were purchased from Shanghai Acmec Biochemical Technology Co., Ltd. (No. 2991, Jinke Road, Pudong New District, Shanghai, China). The purity of the above controls was ≥98%.

4.2. Preparation of Plant Extracts

4.2.1. Preparation of IPE Paste

Ipomoea pes-caprae medicinal materials were collected from Baisha Town, Hepu County, Beihai City, Guangxi Province, on 8 April 2022, and were identified as the above-ground part of Ipomoea pes-caprae (L.) Sweet of the family Convolvulaceae by Professor Songji Wang of Guangxi University of Chinese Medicine. The IPE was prepared in the Guangxi Key Laboratory of Efficacy Study on Chinese Materia Medica. Briefly, the above-ground part of Ipomoea pes-caprae was taken, 12 times the amount of water was added, soaked for 1 h, heated to boiling, extracted for 1 h, and filtered while hot. The above steps were repeated twice, and the two filtrates were combined, concentrated under reduced pressure, and stored at −20 °C for future use.

4.2.2. Preparation of IPE Samples

The IPE paste obtained under item 2.2.1 was dried to powder, and its powder of 1.0 g was accurately weighed. The weighed powder was mixed with 20 mL of 50% methanol and subjected to ultrasonic extraction for 30 min. After cooling to room temperature, the volume was adjusted to the initial weight with 50% methanol. The solution was diluted to a final concentration of 1 mg/mL, filtered through a 0.22 μm membrane, and 3 μL of the filtrate was injected for UPLC-MS analysis.

4.3. Animal Grouping and Drug Administration

A total of 83 male SD rats, SPF grade, six weeks old, body mass (200 ± 10 g), were purchased from Hunan SJA Laboratory Animal Co., Ltd. (Haodan Science and Technology Park, No.99 Changchong Road, Longping High-tech Park, Furong District, Changsha City, China), Animal License No. SCXK (Hunan) 2019-0004. The animal experiments were approved by the Animal Ethics Committee of Guangxi University of Chinese Medicine (Approval No. DW20220220-117). After one week of adaptive feeding, the animals were randomly divided into eight groups of 10 animals according to weight stratification: normal control group (Con), natural bovine type II collagen model group (CII), wind-dampness cold bi-syndrome model group (WCM), wind-dampness heat bi-syndrome model group (WHM), wind-dampness cold bi-syndrome + Ipomoea pes-caprae group (WCM + IPE), wind-dampness heat bi-syndrome + Ipomoea pes-caprae group (WHM + IPE), wind-dampness cold bi-syndrome + Duhuo group (WCM + DH) (Duhuo formula granules), and wind-dampness heat bi-syndrome + Fangji group (WHM + FJ) (Fangji formula granules). Another three rats were randomly selected as the normal administration group (Con + IPE), and the absorbed components in plasma were studied in vivo. The oral dose of IPE was 13.5 g/kg, and the dosing volume was 20 mL/kg. The oral doses of Duhuo formula granules and Fangji formula granules were 9.0 g/kg, with a dosing volume of 20 mL/kg for each. The blank control group and each model group were administered an equal volume of distilled water by oral gavage. The administration was performed once daily for 28 consecutive days.

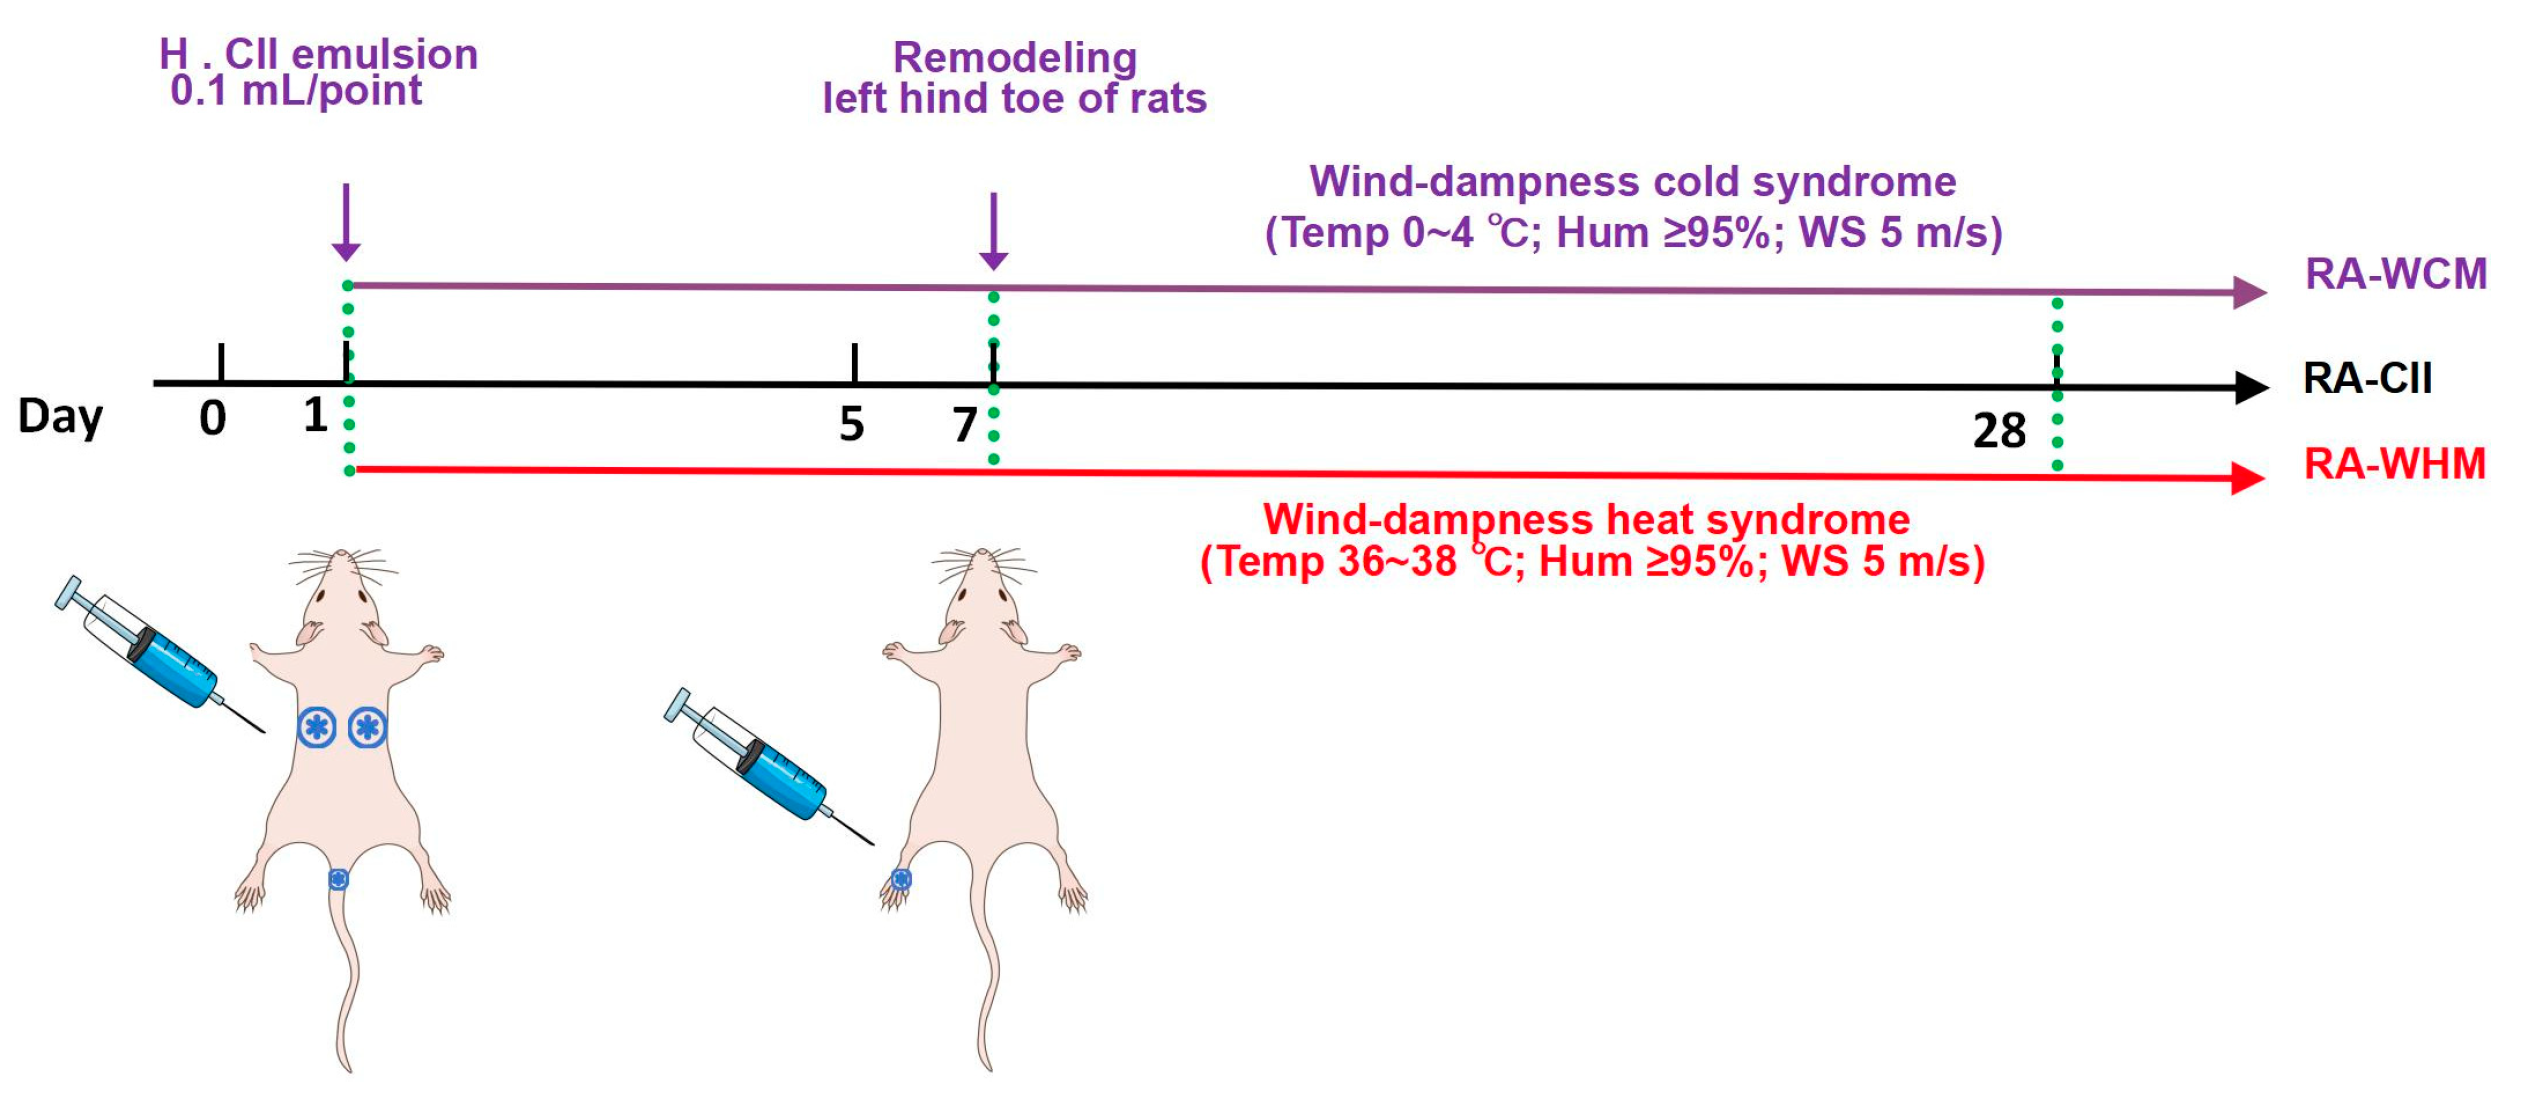
4.4. Animal Model Construction

A solution of natural bovine type II collagen (CII) was mixed with freund’s complete adjuvant (CFA) in equal volumes (1:1; v:v) to form a CII emulsion. On the first day of the experiment, except for the normal control group, rats in all other groups were subcutaneously injected with a total of 0.3 mL of CII emulsion, divided into two injection sites on the back (on either side of the spine) and one site at the base of the tail, with 0.1 mL of CII emulsion at each site. On the seventh day of the experiment, a second modeling was performed, and 0.1 mL of CII emulsion was injected subcutaneously into the left hind toe of the rat [18]. After the first injection of CII emulsion, the rats were placed in an environment that simulated wind-dampness cold bi-syndrome (temperature 0–4 °C, relative humidity ≥ 95%, wind speed 5 m/s), once a day, 30 min each time, for a total of 28 days. On the contrary, after the first injection of CII emulsion, the rats were placed in an environment that simulated wind-dampness heat bi-syndrome (temperature 36–38 °C, relative humidity ≥ 95%, wind speed 5 m/s), once a day for 30 min each time, for a total of 28 days. A schematic diagram of the animal model is shown in Figure 12.

4.5. Joint Inflammation AI Score Evaluation and Left Hind Toe Swelling Analysis

During the experiment, we systematically observed the lesions of the left hind toe and other toes of rats in each group according to the following time nodes: Day 7, Day 14, Day 21, Day 28, Day 35, Day 42, Day 49, and Day 56, and used the AI scoring system to evaluate them. The specific criteria for the AI score are as follows: 0 points: normal; 1 point: slight but obvious redness and swelling of the ankle joint, obvious redness and swelling limited to individual toe joints; 2 points: moderate redness and swelling of the toe joints; 3 points: severe redness and swelling of the entire paw, including the toes; 4 points: the toes are inflamed to the greatest extent, involving multiple joints. The sum of the scores for the four paws of each rat is taken as the final arthritis score, with a maximum of 16 points. AI score ≥ 4 was used as a reference criterion for successful replication of the RA model [46].
In addition, the thickness of the left hind toe of rats was measured using a vernier caliper every seven days to calculate the degree of toe swelling degree. The degree of swelling = (Ct − C0)/C0, where C0 represents the plantar thickness before modeling, and Ct indicates the toe thickness after modeling.

4.6. Serum Sample Collection

Rats were fasted for 12 h before administration but not deprived of water, then weighed and administered. A total of 0.2 mL of blood was collected from the orbit at 5 min, 30 min, 45 min, 1 h, 2 h, 4 h, 6 h, 8 h, and 12 h after the end of gavage administration and placed in a centrifuge tube with a preservative anticoagulant (1.5% EDTA aqueous solution, 1.5 mL). The samples were centrifuged at 4 °C for 10 min at 4000 rpm to separate the plasma. The supernatant was transferred to a new centrifuge tube and stored in a refrigerator at −80 °C for the detection of absorbed components in plasma and pharmacokinetics. In addition, after the end of the entire experimental cycle, blood was taken from the abdominal aorta of the rat. The blood samples were kept at room temperature for 2 h, then centrifuged at 4 °C at 3000 rpm for 10 min, and the upper serum was aspirated. The samples were stored at −80 °C in a low-temperature refrigerator for TNF-α, IL-6 detection, and metabolomics detection.
QC samples were prepared by taking equal amounts of all samples to be tested and mixing them into the same EP tube. Pipette 1 mL of serum from QC and each of the 8 groups (Con, CII, WCM, WHM, WCM + IPE, WHM + IPE, WCM + DH, and WHM + FJ) and add three times the volume of methanol and acetonitrile solution (methanol: acetonitrile = 1:1) to precipitate the protein. Vortex for 3 min, then centrifuge at low temperature for 10 min (15,000 r/min, 4 °C); the supernatant was passed through a 0.22 μm microporous filter membrane, dried to a solid state under nitrogen, and 200 μL of methanol was added to the pellet. The mixture was sonicated for 3 min, mixed by vortexing for 1 min, centrifuged at low temperature for 10 min (15,000 r/min, 4 °C), and the supernatant was transferred for UPLC-MS analysis.

4.7. Histopathology and Micro-CT Analysis

The left hind-toe ankle joint of the rat obtained in the experiment was stripped of the surface skin and muscles and placed in a 4% paraformaldehyde solution for dehydration and fixation. After one day, it was replaced with a new 4% paraformaldehyde solution for continued fixation for seven days. After dehydration and fixation, the ankle joint was decalcified in EDTA decalcification solution for four weeks. The tissue was dehydrated, embedded in paraffin, sectioned, and the sections were dewaxed before being stained with HE and analyzed by micro-CT. The scanning parameters for the micro-CT imaging system were as follows: X-rays, 90 kV and 80 μA; field of view, 18 mm; voxel size, 36 μm; scan mode, high resolution; scan time, 14 min. Scan-reconstructed images were analyzed using Analyze 12.0 software.

4.8. Chromatographic and Mass Spectrometry Conditions for UPLC-MS

Ultra-high liquid chromatograph (model: ExionLC AC, manufacturer: SCIEX Corporation, USA) and QTOF mass spectrometer (model: X500R, manufacturer: SCIEX Corporation, USA), Waters ACQUITY UPLC HSS T3 C18 column (1.8 μm, 2.1 × 100 mm) was used as the mobile phase for the separation of 0.1% formic acid aqueous solution (A)-acetonitrile (B) as a mobile phase, gradient elution (0~30 min, 5%~95% B); volume flow rate of 0.4 mL/min; injection volume: 3 μL, column temperature: 40 °C. Ion source: dual-spray TurboV, positive and negative ion scanning, TOF MS scanning range of m/z 100~1500, positive/negative ion source voltage of −4500 V/5500 V, ion source temperature: 600 °C, GS1: 55 psi, GS2: 55 psi, air curtain gas pressure: 35 psi, parent ion collision energy: ±10 V, de-cluster voltage (DP): ±80 V, daughter ion collision energy (CE): ±35 V.

4.9. Pharmacokinetic Analysis

In order to further elaborate on the in vivo pharmacokinetic characteristics of IPE, this study selected caffeic acid, protocatechuic acid, and ferulic acid as the research objects to explore their in vivo absorption and metabolism characteristics. In addition, syringic acid was chosen as the internal standard. The column is the same as under “2.8”. Use A as 0.1% acetic acid aqueous solution (A) acetonitrile (B) as the mobile phase, with gradient elution (0–6 min, 5–20% B; 6–10 min, 20–40% B), a volume flow of 0.4 mL/min, a column temperature of 40 °C, and an injection volume of 3 μL. Ion source: electrospray ion source (ESI), negative ion mode collection, simultaneous measurement by multiple reaction monitoring (MRM) mode. The MS/MS setting parameters were as follows: atomizer pressure was 35 psi, drying air temperature was 150 °C, capillary voltage was 4500 V, and sheath air temperature was 600 °C. The ion pairs used for quantitative analysis are shown in Table 8.

4.10. Serum Metabolomics Analysis

In order to elucidate the changes in endogenous components observed in model rats after IPE administration, this study used serum metabolomics technology to compare the differential metabolites before and after IPE administration, screen biomarkers, and predict metabolic pathways. The UPLC conditions were water + 25 mM ammonium acetate + 25 mM ammonia (A)-acetonitrile (B) as the mobile phase, with a gradient elution program (0–1.5 min, 98–98% B; 1.5–12 min, 98–2% B; 12–14 min, 2–2% B; 14–14.1 min, 2–98% B; 14.1–17 min, 98–98% B). The flow rate was 0.3 mL/min, the injection volume was 2 μL, and the column temperature was 25 °C. The conditions of mass spectrometry were as follows: ion source: electrospray ionization (ESI); acquisition mode: positive ion and negative ion mode; ion source temperature: 600 °C; nebulizing gas auxiliary heating gas 1: nitrogen, 60 psi; auxiliary heating gas 2: nitrogen, 60 psi; air curtain gas, 30 psi; spray voltage: ±5500 V; first-stage scanning range: 80–1200 Da; resolution: 60,000. Scan accumulation time: 100 ms; the second level adopts the segmented acquisition method; the scanning range: 70–1200 Da; the second level resolution: 30,000; scan accumulation time: 50 ms; dynamic exclusion time: 4 s. To ensure the stability of the method, QC samples were tested on the machine before, during and after the injection of the samples to be tested.

4.11. Multivariate Data Analysis

The raw data were collected using the UPLC-MS method, and peak alignment, retention time correction, and peak area extraction were performed on the raw data. The peak area-related parameters were extracted as follows: centWave: m/z 10 ppm; peak width: c (10, 60); prefilter: c (10, 100). Peak grouping parameters, bw = 5, mzwid = 0.025, minfrac = 0.5. Annotation of isotopes and adducts was performed using CAMERA (Collection of Algorithms for MEtabolite pRofile Annotation). Metabolite identification was based on the mass-to-charge ratio (m/z < 10 ppm), secondary profiles, and a database established with standards. PCA was utilized to observe natural clustering trends and metabolic pattern differences among each group, followed by Orthogonal partial least squares discriminant analysis (OPLS-DA) to identify differences between the two groups. According to the mass-to-charge ratio of the components, the screening condition: Mass Error < 5 ppm, combined with secondary spectral information. The possible structural types of the differential metabolites were hypothesized, and the online databases PubChem (https://pubchem.ncbi.nlm.nih.gov) (accessed on 2 March 2023) and HMDB (https://hmdb.ca) (accessed on 2 March 2023) were searched to determine their compositions.

4.12. Network Pharmacology Analysis

Potential targets of the absorbed components of IPE in the plasma were obtained from the Pharm Mapper (https://www.lilab-ecust.cn/pharmmapper/) (accessed on 21 May 2024) and TCMSP (https://old.tcmsp-e.com/tcmsp.php) (accessed on 21 May 2024). The disease targets for wind-dampness cold bi-syndrome and wind-dampness heat bi-syndrome were retrieved from OMIM (https://www.omim.org/) (accessed on 21 May 2024) and Gene Cards (https://www.genecards.org/) (accessed on 21 May 2024) databases using “rheumatoid arthritis” as the search term. The target protein names were corrected from UniProt (https://www.uniprot.org/) (accessed on 22 May 2024) to the official gene names. Venny diagrams were produced by Venny 2.1.0 (https://bioinfogp.cnb.csic.es/tools/venny/index.html) (accessed on 26 May 2024), and the incoming component targets were intersected with disease targets, and the intersecting targets were potential therapeutic targets of IPE in RA. Gene Ontology (GO) enrichment and Kyoto Encyclopedia of Genes and Genomes (KEGG) pathway enrichment analyses of the intersecting targets were performed using the DAVID database (https://david.ncifcrf.gov/) (accessed on 29 May 2024) to explore the biological functions and potential mechanisms of the detected targets. The obtained target genes were submitted to the interaction gene search tool STRING (https://cn.string-db.org/) (accessed on 15 June 2024) to construct protein–protein interaction (PPI) networks. The PPI network data were imported into Cytoscape 3.10 software to construct the “absorbed components-target-disease” network of IPE for the treatment of wind-dampness cold bi-syndrome and wind-dampness heat bi-syndrome. The endogenous biomarkers identified by metabolomics and the targets obtained from the network pharmacology intersection were imported into Integrated Molecular Pathway Level Analysis (IMPaLA, http://impala.molgen.mpg.de/impala) (accessed on 20 July 2024) and Cytoscape 3.10 software to construct the biomarker-pathway-target visualization network.

4.13. Molecular Docking

The 3D structures of the absorbed components in plasma were downloaded from the TCMSP and PubChem databases and converted to mol2 format files using Open Babel 3.1.1. The core targets with the top-ranked degree value in the PPI network were selected, and the 3D structure of the desired protein was downloaded by searching the PDB database and saved in pdb format. AutoDockTools-1.5.7 software was used to molecularly dock the absorbed components in plasma and core target proteins, and finally, PyMOL 2.5.2 software was used to visualize the results with higher activity.

4.14. Statistical Methods

Expressed as mean ± standard deviation ( x ¯ ± s) and processed by GraphPad Prism 8.4.3 statistical software, statistical comparisons were evaluated by one-way ANOVA, followed by the Student–Newman–Keuls post hoc test. The difference was statistically significant with p < 0.05 and p < 0.01. The peak area of each individual compound extracted from IPE was compared to the sum of the peak areas of the total compounds of IPE, and the relative content of each component in the total compounds was calculated based on the ion flow peak area normalization method [47]. VIP > 1 and p-value < 0.05 were used to screen significantly changed metabolites. Pearson correlation analysis was conducted to determine the correlation between the two variables.

5. Conclusions

This experiment proves that IPE can effectively alleviate RA symptoms, and its multiple chemical components are well absorbed and metabolized in vivo, while also exploring the key targets and mechanisms of IPE in the treatment of RA based on serum metabolomics and network pharmacology. The results showed that IPE exhibited significant therapeutic effects on both wind-dampness cold bi-syndrome and wind-dampness heat bi-syndrome by acting on multiple potential targets and metabolic pathways, especially the core targets of ALB and AKT1. This study provides data and theoretical support for the in-depth investigation of the mechanism of IPE against RA and lays the foundation for the clinical application of IPE.

Author Contributions

Methodology, formal analysis, writing—review and editing, and data curation, F.Z. and S.L.; Supervision, writing—original draft, and data curation, X.P.; Supervision and writing—original draft, J.W.; Project administration and supervision, J.X.; Project administration, and resources, Z.D. and E.H.; Conceptualization, project administration, supervision, and funding acquisition, J.D. and X.H. All authors have read and agreed to the published version of the manuscript.

Funding

This research was funded by Guangxi University of Chinese Medicine ‘Guipai Traditional Chinese Medicine Inheritance and Innovation Team’, funding number 2022A005 and The Talent Education Program of Guangxi Science and Technology Project, funding number AA23026008.

Institutional Review Board Statement

The study was conducted in accordance with the Declaration of Helsinki, and approved by the Animal Ethics Committee of Guangxi University of Chinese Medicine (Approval No. DW20220220-117; Approval date: 20 February 2022).

Data Availability Statement

The data presented in this study are available on request from the corresponding authors.

Conflicts of Interest

The authors declare no conflict of interest.

Abbreviations

The following abbreviations are used in this manuscript:
RARheumatoid arthritis
NSAIDSNonsteroidal anti-inflammatory drugs
CORTCorticosteroids
DMARDsDisease-modifying anti-rheumatic drugs
TNF-αTumor Necrosis Factor-α
IL-6Interleukin- 6
NF-κBNuclear Factor kappa-light-chain-enhancer of activated B cells
FLSFibroblast-like synoviocytes
CRPC-reactive protein
RFRheumatoid factor
TNF-αTumor necrosis factor-α
TGF-βTransforming growth factor-β
JAK/STATJanus kinase/signal transducer and activator of transcription
Akt/mTORAkt/mammalian target of rapamycin
LTB4Leukotriene B4
PI3K/AktPhosphatidylinositol 3-kinases/Akt
MAPKMitogen-activated protein kinase
JNKC-Jun N-terminal kinase
ERKExtracellular regulated protein kinases
C/ebpCCAAT/enhancer-binding protein

References

  1. Li, Z. Arthromyodynia Theory; Guangdong Science & Technology Press, Ltd.: Guangzhou, China, 1987. [Google Scholar]
  2. Jiang, Q. Practical Chinese Medicine Clinical Medicine Series Practical Chinese Medicine Rheumatology Immunology; China Press of Traditional Chinese Medicine: Beijing, China, 2022. [Google Scholar]
  3. Xie, C.Q.; Jia, P.; Hu, L. Research Progress on Pathogenesis and Drug Treatment of Rheumatoid Arthritis. China Mod. Doctor. 2024, 62, 145–148. [Google Scholar]
  4. Jia, W.; Yu, S.; Liu, X.; Le, Q.; He, X.; Yu, L.; He, J.; Yang, L.; Gao, H. Ethanol Extract of Limonium Bicolor Improves Dextran Sulfate Sodium-Induced Ulcerative Colitis by Alleviating Inflammation and Restoring Gut Microbiota Dysbiosis in Mice. Mar. Drugs 2024, 22, 175. [Google Scholar] [CrossRef]
  5. Zeng, L.; Yang, T.; Yang, K.; Yu, G.; Li, J.; Xiang, W.; Chen, H. Efficacy and Safety of Curcumin and Curcuma Longa Extract in the Treatment of Arthritis: A Systematic Review and Meta-Analysis of Randomized Controlled Trial. Front. Immunol. 2022, 13, 891822. [Google Scholar] [CrossRef]
  6. Zhang, Y.L.; Wang, Y.L.; Yan, K.; Li, H.; Zhang, X.; Essola, J.M.; Ding, C.; Chang, K.; Qing, G.; Zhang, F.; et al. Traditional Chinese Medicine Formulae Qy305 Reducing Cutaneous Adverse Reaction and Diarrhea by Its Nanostructure. Adv. Sci. 2024, 11, e2306140. [Google Scholar] [CrossRef] [PubMed]
  7. Jiang, Q.; Wang, H.L.; Gong, X.; Luo, C.G. Guidelines of Diagnosis and Treatment of Rheumatoid Arthritis Disease and Syndrome Combination. J. Tradit. Chin. Med. 2018, 59, 1794–1800. [Google Scholar]
  8. Wang, Y.; Chen, S.; Du, K.; Liang, C.; Wang, S.; Owusu Boadi, E.; Li, J.; Pang, X.; He, J.; Chang, Y.X. Traditional Herbal Medicine: Therapeutic Potential in Rheumatoid Arthritis. J. Ethnopharmacol. 2021, 279, 114368. [Google Scholar] [CrossRef]
  9. Zhao, S.; Wang, P.C.; Feng, J.; Chen, Z.L.; Wang, Q.H.; Kuang, H.X. Application of Metabonomics in Study on Traditional Chinese Medicine. Chin. Tradit. Herb. Drugs. 2015, 46, 756–765. [Google Scholar]
  10. Li, Z.; Yuan, J.; Dai, Y.; Xia, Y. Integration of Serum Pharmacochemistry and Metabolomics to Reveal the Underlying Mechanism of Shaoyao-Gancao-Fuzi Decoction to Ameliorate Rheumatoid Arthritis. J. Ethnopharmacol. 2024, 326, 117910. [Google Scholar] [CrossRef]
  11. Peng, W.; Yang, Y.; Lu, H.; Shi, H.; Jiang, L.; Liao, X.; Zhao, H.; Wang, W.; Liu, J. Network Pharmacology Combines Machine Learning, Molecular Simulation Dynamics and Experimental Validation to Explore the Mechanism of Acetylbinankadsurin a in the Treatment of Liver Fibrosis. J. Ethnopharmacol. 2024, 323, 117682. [Google Scholar] [CrossRef]
  12. Zhang, D.F.; Hu, C.J.; Hu, K.F. Application and Prospect of Network Pharmacology in the Field of Traditional Chinese Medicine. J. Med. Inf. 2024, 45, 30–36+56. [Google Scholar]
  13. Guan, H.S.; Wang, S.G. Chinese Marine Herb; Shanghai Scientific & Technical Publishers: Shanghai, China, 2009. [Google Scholar]
  14. Ge, Y.C.; Luo, J.Q.; Wu, Y.H.; Li, Y.X.; Huo, W.Z.; Yu, B.W. Chemical Constituents from Ipomoea pes-caprae. J. Chin. Med. Mater. 2016, 39, 2251–2255. [Google Scholar]
  15. Deng, J.G.; Hao, E.W.; Hou, X.T. Marine Chinese Medicine; Guangxi Science and Technology Publishing House Co., Ltd.: Nanning, China, 2018. [Google Scholar]
  16. Bilal, M.; Qindeel, M.; Nunes, L.V.; Duarte, M.T.S.; Ferreira, L.F.R.; Soriano, R.N.; Iqbal, H.M.N. Marine-Derived Biologically Active Compounds for the Potential Treatment of Rheumatoid Arthritis. Mar. Drugs 2020, 19, 10. [Google Scholar] [CrossRef] [PubMed]
  17. Feng, X.H.; Deng, J.G.; Qin, J.F.; Hao, E.W.; Wei, W.; Xie, J.L.; Hou, X.T. Research Progress on Chemical Constituents of Marine Medicine Ipomoea pes-caprae and Their Pharmacological Activities. Chin. Tradit. Herb. Drugs. 2018, 49, 955–964. [Google Scholar]
  18. Wei, Y.T.; Hao, E.W.; Xia, Z.S.; Jiang, Q.Y.; Du, Z.C.; Deng, J.G.; Hou, X.T. Study on the Therapeutic Effect of Ipomoea pes-caprae Extract on Collagen-Induced Arthritis Model Rats. Guangxi Sci. 2021, 28, 626–633. [Google Scholar]
  19. Huang, C.T.; Yang, X.; Hou, X.T.; Du, Z.C.; Yu, C.L.; Mo, Q.; Zhao, F.C.; Wei, Y.T.; Hao, E.W.; Deng, J.G. Effect of Aqueous Extract of Chinese Marine Medicine Houteng on Pedal Swelling in Rheumatoid Arthritis Rats with Fengshihanbi or Fengshirebi Syndrome. Pharmacol. Clin. Chin. Mater. Med. 2021, 37, 109–113. [Google Scholar]
  20. Ma, X.W.; Zhang, H.; Deng, L.L.; Yan, R.; Fang, S.M. Research Progress in Roles of Mitogen Activated Protein Kinase Signalling Pathway in Pathogenesis of Rheumatoid Arthritis. Chin. J. Pharmacol. Toxicol. 2022, 36, 297–302. [Google Scholar]
  21. Choy, E.H.S.; Calabrese, L.H. Neuroendocrine and Neurophysiological Effects of Interleukin 6 in Rheumatoid Arthritis. Rheumatology 2018, 57, 1885–1895. [Google Scholar] [CrossRef]
  22. Cheng, X.; Cui, N.; Hou, X.; Pi, Z.; Deng, J.; Liu, S. Uncovering the Effective Substances and Mechanism of Ipomoea pes-caprae against Rheumatoid Arthritis Using Liquid Chromatography-Mass Spectrometry and Targeted Network Pharmacology. J. Sep. Sci. 2023, 46, e2200856. [Google Scholar] [CrossRef]
  23. Miyoshi, M.; Liu, S. Collagen-Induced Arthritis Models. Methods Mol. Biol. 2018, 1868, 3–7. [Google Scholar]
  24. Ma, J.F.; Hou, X.J.; Liu, X.P.; Wang, Y.; Ding, M.G.; Zheng, W.; Zhu, Y.L. Establishment and Evaluation of Cold Syndrome Animal Model with Rheumatoid Arthritis. China J. Tradit. Chin. Med. Pharm. 2016, 31, 1967–1970. [Google Scholar]
  25. Yang, D.Y.; Zhao, Z.T.; Chen, J.L.; Zhu, T.T. Replication and Evaluation of Rat Model of Rheumatoid Arthritis with Heat Arthralgia Syndrome. Lishizhen Med. Mater. Med. Res. 2021, 32, 2042–2045. [Google Scholar]
  26. Chen, Q.; Zhou, W.; Huang, Y.; Tian, Y.; Wong, S.Y.; Lam, W.K.; Ying, K.Y.; Zhang, J.; Chen, H. Umbelliferone and Scopoletin Target Tyrosine Kinases on Fibroblast-Like Synoviocytes to Block Nf-Κb Signaling to Combat Rheumatoid Arthritis. Front. Pharmacol. 2022, 13, 946210. [Google Scholar] [CrossRef] [PubMed]
  27. Wang, W.; Sun, W.; Jin, L. Caffeic Acid Alleviates Inflammatory Response in Rheumatoid Arthritis Fibroblast-Like Synoviocytes by Inhibiting Phosphorylation of Iκb Kinase A/Β and Iκbα. Int. Immunopharmacol. 2017, 48, 61–66. [Google Scholar] [CrossRef]
  28. Zhu, L.; Zhang, Z.; Xia, N.; Zhang, W.; Wei, Y.; Huang, J.; Ren, Z.; Meng, F.; Yang, L. Anti-Arthritic Activity of Ferulic Acid in Complete Freund’s Adjuvant (Cfa)-Induced Arthritis in Rats: Jak2 Inhibition. Inflammopharmacology 2020, 28, 463–473. [Google Scholar] [CrossRef] [PubMed]
  29. Wu, H.; Wang, J.; Zhao, Q.; Ding, Y.; Zhang, B.; Kong, L. Protocatechuic Acid Inhibits Proliferation, Migration and Inflammatory Response in Rheumatoid Arthritis Fibroblast-Like Synoviocytes. Artif. Cells Nanomed. Biotechnol. 2020, 48, 969–976. [Google Scholar] [CrossRef]
  30. Rzodkiewicz, P.; Gąsińska, E.; Gajewski, M.; Bujalska-Zadrożny, M.; Szukiewicz, D.; Maśliński, S. Esculetin Reduces Leukotriene B4 Level in Plasma of Rats with Adjuvant-Induced Arthritis. Reumatologia 2016, 54, 161–164. [Google Scholar] [CrossRef]
  31. Garg, S.S.; Gupta, J.; Sahu, D.; Liu, C.J. Pharmacological and Therapeutic Applications of Esculetin. Int. J. Mol. Sci. 2022, 23, 12643. [Google Scholar] [CrossRef]
  32. Bunte, K.; Beikler, T. Th17 Cells and the Il-23/Il-17 Axis in the Pathogenesis of Periodontitis and Immune-Mediated Inflammatory Diseases. Int. J. Mol. Sci. 2019, 20, 3394. [Google Scholar] [CrossRef]
  33. Afifi, N.; Medhat, B.M.; Abdel Ghani, A.M.; Mohamed Ali Hassan, H.G.E.; Behiry, M.E. Value of Albumin-Fibrinogen Ratio and Crp-Albumin Ratio as Predictor Marker of Disease Activity in Egyptian Ra Patients, Correlated with Musculoskeletal Sonography. Res. Rev. 2020, 12, 241–248. [Google Scholar] [CrossRef]
  34. Ishizuka, M.; Nagata, H.; Takagi, K.; Iwasaki, Y.; Shibuya, N.; Kubota, K. Clinical Significance of the C-Reactive Protein to Albumin Ratio for Survival after Surgery for Colorectal Cancer. Ann. Surg. Oncol. 2016, 23, 900–907. [Google Scholar] [CrossRef]
  35. Tominaga, T.; Nonaka, T.; Sumida, Y.; Hidaka, S.; Sawai, T.; Nagayasu, T. The C-Reactive Protein to Albumin Ratio as a Predictor of Severe Side Effects of Adjuvant Chemotherapy in Stage Iii Colorectal Cancer Patients. PLoS ONE 2016, 11, e0167967. [Google Scholar] [CrossRef]
  36. Sahebari, M.; Ayati, R.; Mirzaei, H.; Sahebkar, A.; Hejazi, S.; Saghafi, M.; Saadati, N.; Ferns, G.A.; Ghayour-Mobarhan, M. Serum Trace Element Concentrations in Rheumatoid Arthritis. Biol. Trace Elem. Res. 2016, 171, 237–245. [Google Scholar] [CrossRef] [PubMed]
  37. Zhang, P.; Liu, J.; Tan, B.; Zhu, F.; Fang, L. Hypercoagulable State Is Associated with Nf-Kappa B Activation and Increased Inflammatory Factors in Patients with Rheumatoid Arthritis. J. Cell Mol. Immunol. 2016, 32, 364–368. [Google Scholar]
  38. Liu, Q.; Wang, J.; Ding, C.; Chu, Y.; Jiang, F.; Hu, Y.; Li, H.; Wang, Q. Sinomenine Alleviates Rheumatoid Arthritis by Suppressing the Pi3k-Akt Signaling Pathway, as Demonstrated through Network Pharmacology, Molecular Docking; Experimental Validation. Drug Des. Devel. Ther. 2024, 18, 3523–3545. [Google Scholar] [CrossRef]
  39. Aihaiti, Y.; Tuerhong, X.; Zheng, H.; Cai, Y.; Yang, M.; Xu, P. Peroxiredoxin 4 Regulates Tumor-Cell-Like Characteristics of Fibroblast-Like Synoviocytes in Rheumatoid Arthritis through Pi3k/Akt Signaling Pathway. Clin. Immunol. 2022, 237, 108964. [Google Scholar] [CrossRef] [PubMed]
  40. Jiang, R.H.; Xu, J.J.; Zhu, D.C.; Li, J.F.; Zhang, C.X.; Lin, N.; Gao, W.Y. Glycyrrhizin Inhibits Osteoarthritis Development through Suppressing the Pi3k/Akt/Nf-Κb Signaling Pathway in Vivo and in Vitro. Food Funct. 2020, 11, 2126–2136. [Google Scholar] [CrossRef]
  41. Yuan, F.L.; Li, X.; Lu, W.G.; Sun, J.M.; Jiang, D.L.; Xu, R.S. Epidermal Growth Factor Receptor (Egfr) as a Therapeutic Target in Rheumatoid Arthritis. Clin. Rheumatol. 2013, 32, 289–292. [Google Scholar] [CrossRef]
  42. Gul, B.; Anwar, R.; Saleem, M.; Ahmad, M.; Ullah, M.I.; Kamran, S. Attenuation of Cfa-Induced Arthritis through Regulation of Inflammatory Cytokines and Antioxidant Mechanisms by Solanum Nigrum L. Leaves Extracts. Inflammopharmacology 2023, 31, 3281–3301. [Google Scholar] [CrossRef]
  43. Hughes, C.D.; Ryan, S.E.; Steel, K.J.A.; van den Beukel, M.D.; Trouw, L.A.; van Schie, K.A.J.; Toes, R.E.M.; Menon, B.; Kirkham, B.W.; Taams, L.S. Type 17-Specific Immune Pathways Are Active in Early Spondyloarthritis. RMD Open. 2023, 9, e003328. [Google Scholar] [CrossRef]
  44. Zhang, F.; Zhang, Y.; Zhou, J.; Cai, Y.; Li, Z.; Sun, J.; Xie, Z.; Hao, G. Metabolic Effects of Quercetin on Inflammatory and Autoimmune Responses in Rheumatoid Arthritis Are Mediated through the Inhibition of Jak1/Stat3/Hif-1α Signaling. Mol. Med. 2024, 30, 170. [Google Scholar] [CrossRef]
  45. Wang, M.; Tian, T.; Yu, S.; He, N.; Ma, D. Th17 and Treg Cells in Bone Related Diseases. Clin. Dev. Immunol. 2013, 2013, 203705. [Google Scholar] [CrossRef] [PubMed]
  46. Zhao, Z.T.; Zhao, Y.K.; Chen, J.L.; Zhu, T.T.; Yan, X.K.; Zhang, Y.F. Effect of Different Suspension Moxibustion Methods on Syndrome Characteristics of Rats with Rheumatoid Arthritis of Heat Bi Syndrome Based on “Moxibustion Can Be Used for Heat Syndrome”. Chin. Acupunct. Moxibustion 2023, 43, 1062–1069. [Google Scholar]
  47. Wang, Y.G.; Fu, J.X.; Zhang, C.; Hu, S.Q.; Zhao, H.B. Flower Scent Component Changes During the Flowering Process in Symplocos Sumuntia. J. Zhejiang A. F. Univ. 2016, 33, 516–523. [Google Scholar]
Figure 1. Effect of IPE on AI score and left hind toe swelling in rats. (A): Trend plot of AI scores in WCM rats; (B): trend plot of AI scores in WHM rats; (C): trend plot of left hind toes swelling in WCM rats; (D): trend plot of left hind toes swelling in WHM rats; (E): representative macroscopic photographs of left hind toes swelling of each groups. Normal control group (Con); natural bovine type II collagen model group (CII); wind-dampness cold bi-syndrome model group (WCM); wind-dampness heat bi-syndrome model group (WHM); wind-dampness cold bi-syndrome + Duhuo group (WCM + DH): Wind-dampness heat bi-syndrome + Fangji group (WHM + FJ); wind-dampness cold bi-syndrome + Ipomoea pes-caprae group (WCM + IPE); wind-dampness heat bi-syndrome + Ipomoea pes-caprae group (WHM + IPE).
Marinedrugs 23 00114 g001
Figure 2. Effects of IPE on the pathological changes in ankle joints of rats (A), micro-CT images (B). Blue arrows: lymphocytes; black arrows: fibroblasts; green arrows: fiber cells; white arrows: bone destruction; normal control group (Con); natural bovine type II collagen model group (CII); wind-dampness cold bi-syndrome model group (WCM); wind-dampness heat bi-syndrome model group (WHM); wind-dampness cold bi-syndrome + Duhuo group (WCM + DH); wind-dampness heat bi-syndrome + Fangji group (WHM + FJ); wind-dampness cold bi-syndrome + Ipomoea pes-caprae group (WCM + IPE); wind-dampness heat bi-syndrome + Ipomoea pes-caprae group (WHM + IPE).
Marinedrugs 23 00114 g002
Figure 3. Effect of IPE on the expression levels of inflammatory factors TNF-α (A) and IL-6 (B) in serum. Normal control group (Con); natural bovine type II collagen model group (CII); wind-dampness cold bi-syndrome model group (WCM); wind-dampness heat bi-syndrome model group (WHM); wind-dampness cold bi-syndrome + Duhuo group (WCM + DH); wind-dampness heat bi-syndrome + Fangji group (WHM + FJ); wind-dampness cold bi-syndrome + Ipomoea pes-caprae group (WCM + IPE); wind-dampness heat bi-syndrome + Ipomoea pes-caprae group (WHM + IPE). The data were analyzed by one-way analysis of variance (ANOVA) followed by the Student–Newman–Keuls post hoc test. For each category (n = 10), * p < 0.05, ** p < 0.01, significantly different from the Con; p < 0.05, △△ p < 0.01, significantly different from the WCM; # p < 0.05, ## p < 0.01, significantly different from the WHM.
Marinedrugs 23 00114 g003
Figure 4. Base peak chromatogram of IPE. (A): positive ions; (B): negative ions. Peak No 1~49 are compounds corresponding to Table 3 “Paek No.” 1~49, respectively.
Marinedrugs 23 00114 g004
Figure 5. Pharmacokinetic profiles of caffeic acid (A), protocatechuic acid (B), and ferulic acid (C) components of IPE in rats ( x ¯ ± s, n = 6). Normal control + Ipomoea pes-caprae group (Con + IPE); Wind-dampness cold bi-syndrome + Ipomoea pes-caprae group (WCM + IPE); Wind-dampness heat bi-syndrome + Ipomoea pes-caprae group (WHM + IPE).
Marinedrugs 23 00114 g005
Figure 6. Plot of PCA scores of serum samples in rats. (A): positive ion mode, (B): negative ion mode. Normal control group (Con); wind-dampness cold bi−syndrome model group (WCM); wind−dampness heat bi−syndrome model group (WHM); wind−dampness cold bi−syndrome + Ipomoea pes-caprae group (WCM + IPE); wind-dampness heat bi−syndrome + Ipomoea pes−caprae group (WHM + IPE); quality control (QC) samples.
Marinedrugs 23 00114 g006
Figure 7. OPLS-DA model scores of serum positive and negative ions in rats. (A): Normal control group (Con) vs. wind−dampness cold bi−syndrome model group (WCM); (B): normal control group (Con) vs. wind−dampness heat bi−syndrome model group (WHM); (C): wind−dampness cold bi−syndrome model group (WCM) vs. wind-dampness heat bi−syndrome model group (WHM); (D): wind-dampness cold bi-syndrome model group (WCM) vs. wind-dampness cold bi-syndrome + Ipomoea pes−caprae group (WCM + IPE); (E): wind−dampness heat bi−syndrome model group (WHM) vs. Wind−dampness heat bi−syndrome + Ipomoea pes−caprae group (WHM + IPE); (F): wind−dampness cold bi−syndrome + Ipomoea pes−caprae group (WCM + IPE) vs. wind−dampness heat bi−syndrome + Ipomoea pes−caprae group (WHM + IPE).
Marinedrugs 23 00114 g007
Figure 8. Enrichment analysis of metabolic pathways of IPE in rats with anti-RA wind-dampness cold bi-syndrome and wind-dampness heat bi-syndrome. (A): Disturbance metabolic pathway of wind-dampness cold bi-syndrome; (B): disturbance metabolic pathway of wind-dampness heat bi-syndrome.
Marinedrugs 23 00114 g008
Figure 9. Network pharmacology analysis of IPE anti-RA. (A): Venny diagram of disease-drug intersection targets; (B): KEGG-enriched top 10 pathway bubble diagram; (C): GO functional enrichment analysis gradient level bar graph; (D): “compound-target-disease” interaction network diagram and protein–protein interaction network. The red circle represents the core target, the green circle represents the absorbing component, the purple circle represents the relevant potential target, and the orange square represents the disease. Larger circles indicate higher degree values.
Marinedrugs 23 00114 g009
Figure 10. Molecular docking of absorbed components of IPE in the plasma to key targets. (A): Heat map of molecular docking; (B): visualization of molecular docking of components to targets.
Marinedrugs 23 00114 g010
Figure 11. Biomarker-pathway-target network diagram of IPE anti-RA. Green triangles represent biomarkers, orange squares represent pathways, and purple circles represent targets.
Marinedrugs 23 00114 g011
Figure 12. The process diagram of animal model establishment.
Marinedrugs 23 00114 g012
Table 1. Comparison of AI score in rats in each group ( x ¯ ± s, n = 10.)
Group Dose (g/kg)AI Score
Day 28 (Prior to First Dose)Day 56 (Post Last Dose)
Con-0 ± 00 ± 0
CII-6.4 ± 0.8 **7.4 ± 2.8 **
WCM-5.9 ± 0.9 **7.5 ± 3.6 **
WHM-6.3 ± 1.3 **7.4 ± 1.8 **
WCM + DH96.4 ± 1.3 **4.9 ± 0.9 Δ
WHM + FJ96.9 ± 0.7 **3.6 ± 1.2 #
WCM + IPE13.55.8 ± 1.4 **4.0 ± 0.8 Δ
WHM + IPE13.56.4 ± 1.3 **3.4 ± 0.8 #
The data were analyzed via one-way analysis of variance (ANOVA) followed by the Student–Newman–Keuls post hoc test. ** p < 0.01, significantly different from the Con; Δ p < 0.05, significantly different from the WCM; # p < 0.05, significantly different from the WHM.
Table 2. Comparison of left hind toes swelling in rats in each group ( x ¯ ± s, n = 10.)
GroupDose (g/kg)left Hind Toes Swelling
Day 28 (Prior to First Dose)Day 56 (Post Last Dose)
Con-0.13 ± 0.030.07 ± 0.03
CII-0.44 ± 0.16 **0.47 ± 0.13 **
WCM-0.50 ± 0.31 **0.58 ± 0.22 **
WHM-0.40 ± 0.18 **0.53 ± 0.14 **
WCM + DH90.38 ± 0.24 **0.29 ± 0.06 Δ
WHM + FJ90.35 ± 0.07 **0.28 ± 0.09 #
WCM + IPE13.50.40 ± 0.15 **0.25 ± 0.03 Δ
WHM + IPE13.50.37 ± 0.11 **0.29 ± 0.04 #
The data were analyzed by one-way analysis of variance (ANOVA) followed by the Student–Newman–Keuls post hoc test. ** p < 0.01, significantly different from the Con; Δ p < 0.05, significantly different from the WCM; # p < 0.05, significantly different from the WHM.
Table 3. The identified chemical composition of IPE based on the UPLC-MS method.
Peak No.FormulaRetention Time (min)Fragment IonRelative Molecular Mass (m/z)Error (ppm)
×106
Fragment Ions in the Positive/Negative ion Mode (m/z)IdentificationRelative Content (%)Identification Type
Precursor MassFound at Mass
1C7H12O60.53[M−H]191.0561191.05620.4173.0459, 127.0402, 109.0297Quinic acid1.918Organic acid
2C4H4O40.59[M−H]115.0036115.00370.397.9325, 71.0130Fumaric acid0.129Organic acid
3C4H6O50.6[M−H]133.0143133.01441.171.0139, 72.9931, 59.0138, 115.0039Malic acid0.626Organic acid
4C6H8O70.72[M−H]−191.0197191.02001.4129.0198, 111.0091Citric acid1.839Organic acid
5C10H13N5O40.76[M+H]+268.1040268.1039−0.5136.0615, 119.0351Adenosine0.441Nucleoside
6C4H6O40.79[M−H]117.0193117.01930117.0193, 99.9260, 73.0294Succinic acid0.034Organic acid
7C10H13N5O50.8[M−H]282.0844282.08460.8150.0422, 133.0156Guanosine0.104Adenosine
8C7H6O51.03[M−H]169.0143169.0141−0.779.0185, 125.0250, 124.0251, 69.0338, 51.0242Gallic acid0.015Organic acid
9C7H6O41.75[M−H]153.0193153.01951.3108.0221, 109.0290Protocatechuic acid0.296Organic acid
10C16H18O92.03[M−H]353.0878353.08800.6191.0579, 179.0347, 135.0453, 161.0245Neochlorogenic acid11.241Organic acid
11C7H6O32.36[M−H]137.0244137.02450.1137.0245, 119.0140, 109.0296, 108.0219, 93.0343Protocatechuic aldehyde1.34Organic acid
12C7H6O32.36[M−H]137.0244137.02450.1137.0245, 93.0343, 65.0033Salicylic acid1.34Organic acid
13C15H16O92.38[M−H]339.0722339.0721−0.2177.0192, 133.0295Esculin0.041Coumarins
14C8H8O32.97[M−H]151.0401151.0400−0.5136.0168, 108.0216Methyl 4-hydroxybenzoate0.043Organic acid
15C16H18O93.03[M−H]353.0878353.08790.2191.0584, 173.0455, 135.0450, 179.0350, 161.0246Chlorogenic acid15.739Organic acid
16C16H18O93.03[M−H]353.0878353.08790.21910561, 179.0349, 135.0451, 161.0241Cryptochlorogenic acid2.335Organic acid
17C10H8O43.08[M+H]+193.0495193.0494−0.7178.0262, 150,0313, 133.0285, 122.0363Scopoletin0.575Coumarins
18C9H10O23.11[M−H]149.0608149.0606−1.1149.0581, 121.06884-Hydroxy-3-methoxystyrene0.021Organic acid
19C10H10O43.13[M−H]193.0506195.0504−1134.0360, 133.0270Ferulic acid0.14Organic acid
20C9H6O43.18[M+H]+179.0339179.0337−1151.0398, 123.0443,Esculetin0.053Coumarins
21C9H8O43.25[M−H]179.0350179.0349−0.3135.0453, 134.0375, 107.0504, 89.0398, 79.0554Caffeic acid3.633Organic acid
22C17H20N4O63.89[M+H]377.1456377.1455−0.1377.1427, 243.0877, 172.0873, 319.1363Vitamine B20.201Vitamins
23C9H6O24.51[M+H]+147.0441147.04410119.0487Coumarin0.097Coumarins
24C27H30O174.73[M−H]625.1410625.14100625.1413, 463.1073, 301.0361, 271.0254Quercetin-3-O-sophoroside0.095Flavonoids
25C10H10O34.91[M+H]179.0703179.0609−1.9133.1009, 105.0700Mellein0.029Organic acid
26C10H8O44.98[M+H]193.0495193.0492−1.8178.0259, 150.0310, 133.0284, 122.0362Scopoletin0.787Coumarins
27C10H10O45.11[M−H]193.0506193.0503−1.4133.0285, 134.0361Methyl caffeate acid0.042Organic acid
28C27H30O165.39[M−H]609.1461609.1458−0.5609.1455, 301.0349, 300.0273, 271.0245Rutin0.155Flavonoids
29C21H20O125.59[M−H]463.0882463.08830.2301.0354, 300.0276, 271.0249, 255.0300Isoquercitrin0.762Flavonoids
30C21H20O125.71[M−H]463.0882463.0881−0.1301.0353, 300.0275, 271.0249, 255.0299Quercetin-7-O-β-D-glucopyranoside2.043Flavonoids
31C7H6O35.75[M−H]137.0244137.0242−1.893.0348, 65.0396p-Hydroxybenzoic acid0.074Organic acid
32C27H30O155.88[M−H]593.1512593.1511−0.3284.0331Kaempferol-3-O-rutinoside0.026Flavonoids
33C25H24O126.09[M−H]515.1195515.1194−0.2353.0875, 191.0557, 179.5898, 173.0475Isochlorogenic acid B19.91Organic acid
34C11H12O46.138[M+H]+209.0808209.08080103.0544Ethyl Caffeate0.074Organic acid
35C15H10O66.15[M+H]+287.0550287.0540−3.5153.0185, 121.0291Kaempferol0.147Flavonoids
36C21H20O116.15[M−H]447.0933447.0929−1284.0327, 255.0295, 227.0346Astragalin0.123Flavonoids
37C26H32O116.16[M−H]519.1872519.1871−0.4357.1344, 151.0402, 136.0165(+)-Pinoresinol-β-D-glucoside0.108Flavonoids
38C25H24O126.31[M−H]515.1195515.1192−0.6353.0875, 191.6309, 179.0347, 173.0457Isochlorogenic acid A12.564Organic acid
39C22H26O86.41[M−H]417.1555417.1550−1.2387.1084, 181.0503, 166.0269, 137.0242Syringaresinol0.167Organic acid
40C25H24O126.75[M−H]515.1195515.1191−0.8353.0873, 191.0555, 179.0357, 173.0480Isochlorogenic acid C19.627Organic acid
41C26H26O128.01[M−H]529.1352529.1348−0.7367.1033, 353,0870, 179.0350, 173.04543,5-Di-caffeoylquinic acid or 4,5-Di -caffeoylquinicacidmethyl Ester or 3,4-Di- caffeoylquinic acid methyl ester0.302Organic acid
42C34H30O148.26[M−H]661.1563661.1561−0.3515.1193, 499.1245, 353.0880, 191.0558, 179.03493,5-Di-O-caffeoyl-4-O-coumaroylquinic acid0.27Organic acid
43C18H16O69.53[M+H]+329.1020329.10210.5314.0787, 299.05524′-Hydroxy-3′,5,7, -trimethoxyflavone0.242Flavonoids
44C36H58O1010.27[M+FA−H]695.4012695.4005−1.0487.3421Pedunculoside0.102Terpene
45C43H36O1610.93[M−H]807.1931807.1925−0.8645.1607, 499.1238, 179.03544,5-Di-O-caffeoyl-1,3-Di-O-couma-roylquinicacid0.021Organic acid
46C42H62O1611.84[M−H]821.3965821.39680.3821.3948, 351.0563Glycyrrhizic Acid0.009Organic acid
47C13H14O217.76[M+H]+203.1067203.1066−0.4185.0957, 161.0960, 121.06532-Hydroxy-4,4,7-trimethyl-1(4H)-naphthalenone0.086Organic acid
48C61H106O2420.97[M+FA−H]1267.70561267.70570.2965.4911, 947.4778, 545.3325, 417.2858, 146.9649Pescapreins XXX0.001Resin glycosides
49C18H34O224.36[M−H]281.2481281.2479−2.5281.7474Oleic acid0.032Organic acid
Table 4. Identification of absorbed components in plasma of IPE in rats of each administration group.
GroupNo.Retention Time (min)FormulaFragment IonRelative Molecular Mass (m/z)Error (ppm)
×106
Fragment Ions in the Positive/Negative Ion Mode (m/z)IdentificationRelative Content (%)>Identification Type
Precursor MassFound at Mass
Con + IPE11.98C7H6O4[M−H]153.0193153.01972.5109.0305, 108.0225Protocatechuic acid1.04Prototypical or metabolic components
23.26C10H8O4[M+H]+193.0495193.04950178.0269, 150.0323, 133.0297, 122.0378Scopoletin5.83Prototype components
33.34C9H8O4[M−H]179.035179.03531.6135.0453, 117.0340, 89.0391Caffeic acid33.04Prototypical or metabolic components
43.42C9H6O4[M+H]+179.0339179.03432.0123.0455Esculetine0.39Prototype components
53.6C10H10O4[M−H]193.0506193.05070.3134.0380, 133.0296Ferulic acid17.23Prototypical or metabolic components
65.22C10H8O4[M+H]+193.0495193.0493−1.0178.0270, 150.0317, 133.0299, 122.0378Isoscopoletin2.7Prototype components
75.39C10H10O4[M−H]193.0506193.05112.6134.0373, 133.0289Methyl caffeate acid1.57Prototypical or metabolic components
86.05C7H6O3[M−H]137.0244137.0242−1.293.0334, 65.0391p-Hydroxybenzoic acid38.2Prototypical or metabolic components
WCM + IPE91.75C7H6O4[M−H]153.0193153.01962109.0291, 108.0207Protocatechuic acid1.14Prototypical or metabolic components
102.15C7H6O3[M−H]137.0244137.02461.6108.0226, 93.0345Protocatechuic aldehyde1.68Prototype components
113.16C10H8O4[M+H]+193.0495193.0494−0.1178.0271, 150.0322, 133.0289, 122.0369Scopoletin4.71Prototype components
123.19C9H8O4[M−H]179.0350179.03521.2135.0454, 117.0346, 89.0400Caffeic acid30.2Prototypical or metabolic components
133.31C9H6O4[M+H]+179.0339179.03400.8151.0398, 123.0442Esculetine0.5Prototype components
143.48C10H10O4[M−H]193.0506193.05060134.0363, 133.0291Ferulic acid20.09Prototypical or metabolic components
154.69C9H6O2[M+H]+147.0441147.0440−0.7119.0500Coumarin1.77Prototype components
165.18C10H8O4[M+H]+193.0495193.0486−5178.0270, 150.0321, 133.0291, 122.0366Isoscopoletin7.8Prototype components
175.32C10H10O4[M−H]193.0506193.05050.6133.0285, 134.0361Methyl caffeate acid2.45Prototypical or metabolic components
185.96C7H6O3[M−H]137.0244137.0242−1.393.0334, 65.0390p-Hydroxybenzoic acid29.65Prototypical or metabolic components
WHM + IPE191.79C7H6O4[M−H]153.0193153.0192−0.9109.0308, 108.0219Protocatechuic acid0.84Prototypical or metabolic components
203.23C10H8O4[M+H]+193.0495193.04971178.0280, 150.0334, 133.0299, 122.0369Scopoletin5.56Prototype components
213.32C9H8O4[M−H]179.0350179.0349−0.7135.0454, 107.0509, 89.0391Caffeic acid34.24Prototypical or metabolic components
223.41C9H6O4[M+H]+179.0339179.03421.7151.0141, 123.0439Esculetine0.58Prototype components
233.58C10H10O4[M−H]193.0506193.0505−0.6134.0369, 133.0294Ferulic acid17.71Prototypical or metabolic components
245.21C10H8O4[M+H]+193.0495193.0489−3.2178.0259, 150.0310, 133.0284, 122.0368Isoscopoletin5Prototype components
255.38C10H10O4[M−H]193.0506193.05081134.0510, 133.0292Methyl caffeate acid2.02Prototypical or metabolic components
266.05C7H6O3[M−H]137.0244137.0241−2.193.0333, 65.0391p-Hydroxybenzoic acid34.04Prototypical or metabolic components
Table 5. Pharmacokinetic parameters of the main components of the IPE in rats of each administration group in vivo (x ± s, n = 6).
ParametersAUC0~t (μg·h·L−1)MRT0~t (h)Tmax (h)Cmax (μg·L−1)t1/2 (h)
Group
Component
Con + IPECaffeic acid2078.79 ± 349.444.18 ± 1.820.85 ± 0.22702.53 ± 189.914.51 ± 3.03
Ferulic acid60.56 ± 27.271.30 ± 0.280.45 ± 0.1035.76 ± 10.901.51 ± 0.51
Protocatechuic acid504.08 ± 177.401.90 ± 0.420.66 ± 0.25268.86 ± 90.171.93 ± 1.01
WCM + IPECaffeic acid1130.16 ± 162.903.32 ± 0.350.62 ± 0.14341.80 ± 123.302.82 ± 1.07
Ferulic acid34.92 ± 22.611.05 ± 0.350.33 ± 0.1226.15 ± 11.581.02 ± 0.46
Protocatechuic acid193.59 ± 99.991.59 ± 0.380.41 ± 0.12121.05 ± 77.401.46 ± 0.32
WHM + IPECaffeic acid2301.61 ± 409.954.53 ± 1.340.93 ± 0.12709.49 ± 194.273.82 ± 2.55
Ferulic acid103.90 ± 41.202.27 ± 0.420.7 ± 0.2738.75 ± 16.201.31 ± 0.32
Protocatechuic acid306.73 ± 98.261.83 ± 0.240.62 ± 0.14145.46 ± 53.241.25 ± 0.36
AUC0~t: The area under the drug–time curve; MRT0~t: mean residence time; Tmax: the time to peak drug concentration; Cmax: peak concentration; t1/2: half-life.
Table 6. Effect of IPE on potential biomarkers in serum of WHM and WCM rats.
GroupNo.MetaboliteFormulaHMDB IDWHM vs. ConWHM + IPE vs. WHM
VIPDifference Multiplep ValueTrendVIPDifference Multiplep ValueTrend
WHM + IPE1Urocanic acidC6H6N2O200003011.0080.54710.00114.11309.50.000
2D-alloseC6H12O600011517.1230.66620.0242.6751.4360.021
3D-mannitolC6H14O600007651.5550.60530.0002.6815.0950.000
4Hippuric acidC9H9NO300007145.0630.47530.00010.6510.780.000
5L-threonateC4H8O500009431.9540.75180.0013.4033.0740.000
6PentachlorophenolC₆HCl₅O00419741.2280.65850.0041.7303.0640.000
7PyrocatecholC₆H₆O₂00009571.0710.41340.0132.78218.230.000
81-Methyl-l-histidineC₇H11N₃O₂00000011.4691.2940.0413.0270.0600.000
9CreatinineC4H7N3O00005628.8350.86390.01210.491.2130.000
10DL-normetanephrineC₈H11NO₃00008192.8900.66660.0366.7203.0230.000
11Malonic acidC3H4O4000069120.160.64870.00422.961.6090.000
WCM + IPE12Urocanic acidC6H6N2O200003011.0430.71800.03715.12268.10.000
13Capric acidC10H20O200005111.7911.3120.0102.1660.40370.000
14O-succinyl-L-homoserineC8H13NO602558681.0681.2620.0401.0010.68450.016
15Octanoic acidC8H16O200004822.6841.5010.0082.2510.48950.000
16p-Coumaryl alcoholC9H10O200036541.4180.65160.0412.6145.7560.000
17UracilC₄H₄N₂O₂000030010.961.4400.0005.4420.79880.035
18γ-Aminobutyric acidC4H9NO200001122.3081.2300.0152.4970.78880.008
192′-DeoxycytidineC9H13N3O400000143.0111.1240.0113.1650.89170.008
20CytosineC4H5N3O00006304.8761.1140.0164.6070.91160.049
21D-mannoseC6H12O600001692.5470.58330.0001.0721.3370.025
HMDB ID: human metabolome database ID; VIP: variable importance in projection; ↑: up-regulated; ↓: down-regulated.
Table 7. Core targets and their degree scores.
GeneNameDegree
ALBAlbumin44
AKT1AKT serine/threonine kinase 1 Gene41
EGFREpidermal growth factor receptor37
CASP3Caspase-336
Table 8. Mass spectrometry optimization parameters.
IdentificationIon Pair (m/z)Collecting ModelVoltage (V)Collision Energy (V)
Caffeic acid179.0350→135.0428[M−H]−80−35
Ferulic acid193.0506→134.0411[M−H]−80−35
Protocatechuic acid153.0193→109.0294[M−H]−80−35
Syringic acid197.0556→123.0091[M−H]−80−20
Disclaimer/Publisher’s Note: The statements, opinions and data contained in all publications are solely those of the individual author(s) and contributor(s) and not of MDPI and/or the editor(s). MDPI and/or the editor(s) disclaim responsibility for any injury to people or property resulting from any ideas, methods, instructions or products referred to in the content.

