1. Introduction
According to the World Health Organization (WHO), cardiovascular diseases were the leading cause of noncommunicable diseases (NCD) around the World in 2008, which accounted for 48% of all NCD deaths, or nearly 30% of all global deaths. The burden of these diseases is rising disproportionately among lower income countries and populations [
1]. In China, the largest developing country in the World, it has been a main public health event in the adult population of 40 years of age and older, accounting for approximately 43% of total mortality [
2]. So far, among numerous factors, it was reported that short-term exposure to ambient air pollution has been associated with an increase mortality and morbidity of cardiovascular diseases [
3,
4,
5].
Previously, associations between ambient air pollution and hospital admissions for cardiovascular disease have been extensively reported in developed countries [
3,
6,
7,
8,
9], and only a few studies were conducted in large Asian cities [
10,
11]. In Mainland China, some researchers have evaluated the adverse effect of ambient air pollution on daily mortality and morbidity in several developed large cities, including Beijing [
11,
12], Shanghai [
13,
14], Tianjin [
15], and Shenyang [
16]. These studies also mostly focused on the relationship between ambient air pollution and broad categories of respiratory and cardiovascular causes of death and morbidity in the more developed area of China. The association between air pollution and subgroups of cardiovascular disease of hospital admissions is quite scarce in less developed inland cities of China. Additionally, gaseous and particulate air pollution in the Lanzhou Valley of Gansu Province is a well-known public health problem, and the highest concentrations of gaseous and particulate pollutants have been documented in the urban cities in China [
17], even in the World [
18], less evidence is available to illustrate the effect of ambient air pollution on hospital admissions for cardiovascular disease in Lanzhou, a heavily polluted city of western China. There remains a need for replicating the findings in less developed areas, where characteristics of levels of economic development, outdoor air pollution, socio-demographic status of local residents, weather patterns and latitudes may be different [
19,
20].
The aim of this paper is to identify the short-term effect of major air pollutants, including sulfur dioxide (SO2), nitrogen dioxides (NO2) and particulate matter less than 10 microns in diameter (PM10), on hospital admissions for cardio-cerebrovascular disease in Lanzhou, western China during 2001 to 2005. We examined the associations with overall and stratified groups by gender and age. The modifying effect of season on major air pollutants was conducted to test the possible interaction. Better understanding the adverse effect of outdoor air pollution on morbidity will provide relevant information for developing public health plans and risk assessments in the ambient environment.
3. Results
Summary statistics of hospital admissions, air pollutant concentrations, and meteorological data are shown in
Table 1. From 2001 to 2005 (1,826 days), a total of 28,243 hospital admissions for cardio-cerebrovascular disease were recorded. On average, there were approximately 10 cases/day and 6 cases/day due to cardiac diseases and cerebrovascular diseases. During the period, the average concentrations of PM
10, SO
2 and NO
2 were 187.07 μg/m
3, 79.11 μg/m
3 and 45.81 μg/m
3, respectively, and they were higher in the cold season than in the warm season. The average concentration of PM
10 was higher than the national secondary ambient air quality standard in China (150 μg/m
3). The average level of SO
2 was higher than the national primary ambient air quality standard in China (50 μg/m
3). The average temperature and relative humidity were 11.08 °C and 50.46%, respectively.
Table 1.
Summary statistics of daily hospital admissions, air pollutant concentrations, and weather conditions in Lanzhou (2001–2005).
Table 1.
Summary statistics of daily hospital admissions, air pollutant concentrations, and weather conditions in Lanzhou (2001–2005).
| | Mean | SD | Min | P25 | Median | P75 | Max | IQR |
|---|
| Daily Hospital admissions | | | | | | | | |
| Cardiac diseases | 9.65 | 5.64 | 0 | 5 | 9 | 13 | 36 | 8 |
| Cerebrovascular diseases | 5.82 | 3.88 | 0 | 3 | 5 | 8 | 23 | 5 |
| Meteorology measures | | | | | | | | |
| Temperature (°C) | 11.08 | 9.92 | −12.20 | 2.10 | 11.90 | 20.00 | 30.10 | 17.90 |
| Relative humidity (%) | 50.46 | 14.03 | 15.90 | 40.20 | 50.70 | 60.30 | 89.80 | 20.1 |
| Air pollutants concentrations | | | | | | | | |
| PM10 (μg/m3) | 187.07 | 125.78 | 16.00 | 101.00 | 148.00 | 235.00 | 2,561.00 | 134.00 |
| SO2 (μg/m3) | 79.11 | 61.43 | 2.00 | 37.00 | 58.00 | 106.00 | 371.00 | 69.00 |
| NO2 (μg/m3) | 45.81 | 29.30 | 4.00 | 25.00 | 37.50 | 56.00 | 260.00 | 31.00 |
| Cold season a | | | | | | | | |
| PM10 (μg/m3) | 276.04 | 214.39 | 21.00 | 149.00 | 222.00 | 333.00 | 2561.00 | 184.00 |
| SO2 (μg/m3) | 114.87 | 66.76 | 6.00 | 65.00 | 100.00 | 148.00 | 371.00 | 83.00 |
| NO2 (μg/m3) | 58.78 | 33.15 | 4.00 | 35.00 | 50.00 | 75.00 | 260.00 | 40.00 |
| Warm season b | | | | | | | | |
| PM10 (μg/m3) | 125.69 | 65.71 | 16.00 | 86.00 | 114.00 | 149.00 | 880.00 | 63.00 |
| SO2 (μg/m3) | 43.89 | 24.53 | 2.00 | 28.00 | 40.00 | 54.00 | 182.00 | 26.00 |
| NO2 (μg/m3) | 33.04 | 17.15 | 4.00 | 22.00 | 29.00 | 40.00 | 123.00 | 18.00 |
Table 2 shows the correlations between air pollutants, temperature, and relative humidity. PM
10, SO
2 and NO
2 had a strong positive correlation with each other, and were negatively correlated with temperature and relative humidity.
Table 2.
Spearman’s correlations between daily weather conditions and air pollutant concentrations in Lanzhou (2001–2005).
Table 2.
Spearman’s correlations between daily weather conditions and air pollutant concentrations in Lanzhou (2001–2005).
| | Temperature | Relative humidity | PM10 | SO2 |
|---|
| PM10 | −0.454 ** | −0.320 ** | | |
| SO2 | −0.585 ** | −0.296 ** | 0.624 ** | |
| NO2 | −0.465 ** | −0.218 ** | 0.643 ** | 0.640** |
Table 3 shows the estimates for the percent change in hospital admissions for cardiac and cerebrovascular disease associated with an IQR increase of air pollutants in different lag structures after adjustment for the long-term trend, DOW, holiday and weather conditions. Significant associations were found between air pollution and daily hospital admissions for cardio-cerebrovascular disease in Lanzhou. Regarding the time sequence of the associations, greater estimates were found for PM
10 at lag 01 day (L01) in cardiac hospital admissions, SO
2 at lag 0 day (L0) and lag 03 day (L03) in cardiac and cerebrovascular hospital admissions, while there was a more delayed relation (lag 02–03 day) for NO
2 in cardiac and cerebrovascular disease. For instance, an IQR increase in the 2-day moving average of PM
10 (Lag01) was associated with an increase of 2.32% (95%CI: 0.55%~4.12%) in cardiac disease admissions, An IQR increase of SO
2 corresponded to a 2.34% (95%CI: 0.23%~4.49%) increase in the number of hospital admissions for cardiac disease at lag 0 day, and 5.53% (95%CI: 1.69%~9.53%) for cerebrovascular disease at lag 03 day. An IQR increase in the 3-day and 4-day moving average of NO
2 (Lag02 and Lag03) was associated with an increase of 3.94% (95%CI: 1.83%~6.09%) in cardiac disease admissions, 4.76% (95%CI: 1.45%~8.19%) in cerebrovascular disease admissions.
Table 3.
Percent change (mean and 95%CI) of the association between an IQR increase in pollutant concentrations and daily hospital admissions in Lanzhou from 2001 to 2005. *
Table 3.
Percent change (mean and 95%CI) of the association between an IQR increase in pollutant concentrations and daily hospital admissions in Lanzhou from 2001 to 2005. *
| Lag structures | Cardiac diseases | Cerebrovascular diseases |
|---|
| Change % (95%CI) | P value | Change % (95%CI) | P value |
|---|
| PM10 | Single-day lag | | | | |
| | 0 | 1.28 (−0.21~2.80) | 0.09 | −0.77 (−3.44~1.97) | 0.58 |
| | 1 | 1.66 (0.13~3.20) | 0.03 | −1.43 (−3.64~0.83) | 0.21 |
| | 2 | 1.54 (0.06~3.05) | 0.04 | −1.38 (−3.47~0.76) | 0.20 |
| | 3 | −0.25 (−1.66~1.19) | 0.74 | −1.50 (−3.45~0.50) | 0.14 |
| | Cumulative-day lag | | | | |
| | 01 | 2.32 (0.55~4.12) | 0.01 | −1.72 (−4.60~1.25) | 0.25 |
| | 02 | 2.13 (0.15~4.15) | 0.03 | −2.39 (−5.43~0.75) | 0.13 |
| | 03 | 0.91 (−1.19~3.06) | 0.40 | −3.01 (−6.12~0.21) | 0.18 |
| SO2 | Single-day lag | | | | |
| | 0 | 2.34 (0.23~4.49) | 0.03 | 3.80 (0.63~7.08) | 0.02 |
| | 1 | 0.81 (−1.27~2.92) | 0.45 | 4.03 (0.87~7.29) | 0.01 |
| | 2 | 1.82 (−0.26~3.95) | 0.09 | 4.26 (1.07~7.55) | 0.01 |
| | 3 | 1.24 (−0.85~3.38) | 0.25 | 3.09 (−0.09~6.37) | 0.06 |
| | Cumulative-day lag | | | | |
| | 01 | 1.98 (−0.31~4.32) | 0.09 | 4.71 (1.23~8.30) | 0.01 |
| | 02 | 2.29 (−0.11~4.76) | 0.06 | 5.40 (1.72~9.23) | <0.00 |
| | 03 | 2.29 (−0.21~4.86) | 0.07 | 5.53 (1.69~9.53) | <0.00 |
| NO2 | Single-day lag | | | | |
| | 0 | 3.47 (1.67~5.30) | <0.00 | 4.06 (1.36~6.84) | <0.00 |
| | 1 | 2.68 (0.87~4.52) | <0.00 | 3.26 (0.56~6.04) | 0.02 |
| | 2 | 2.43 (0.60~4.29) | 0.01 | 2.43 (−0.29~5.22) | 0.08 |
| | 3 | 1.42 (−0.39~3.27) | 0.13 | 3.04 (0.30~5.86) | 0.03 |
| | Cumulative-day lag | | | | |
| | 01 | 3.78 (1.80~5.80) | <0.00 | 4.39 (1.43~7.43) | <0.00 |
| | 02 | 3.94 (1.83~6.09) | <0.00 | 4.40 (1.25~7.64) | 0.01 |
| | 03 | 3.77 (1.55~6.03) | <0.00 | 4.76 (1.45~8.19) | <0.00 |
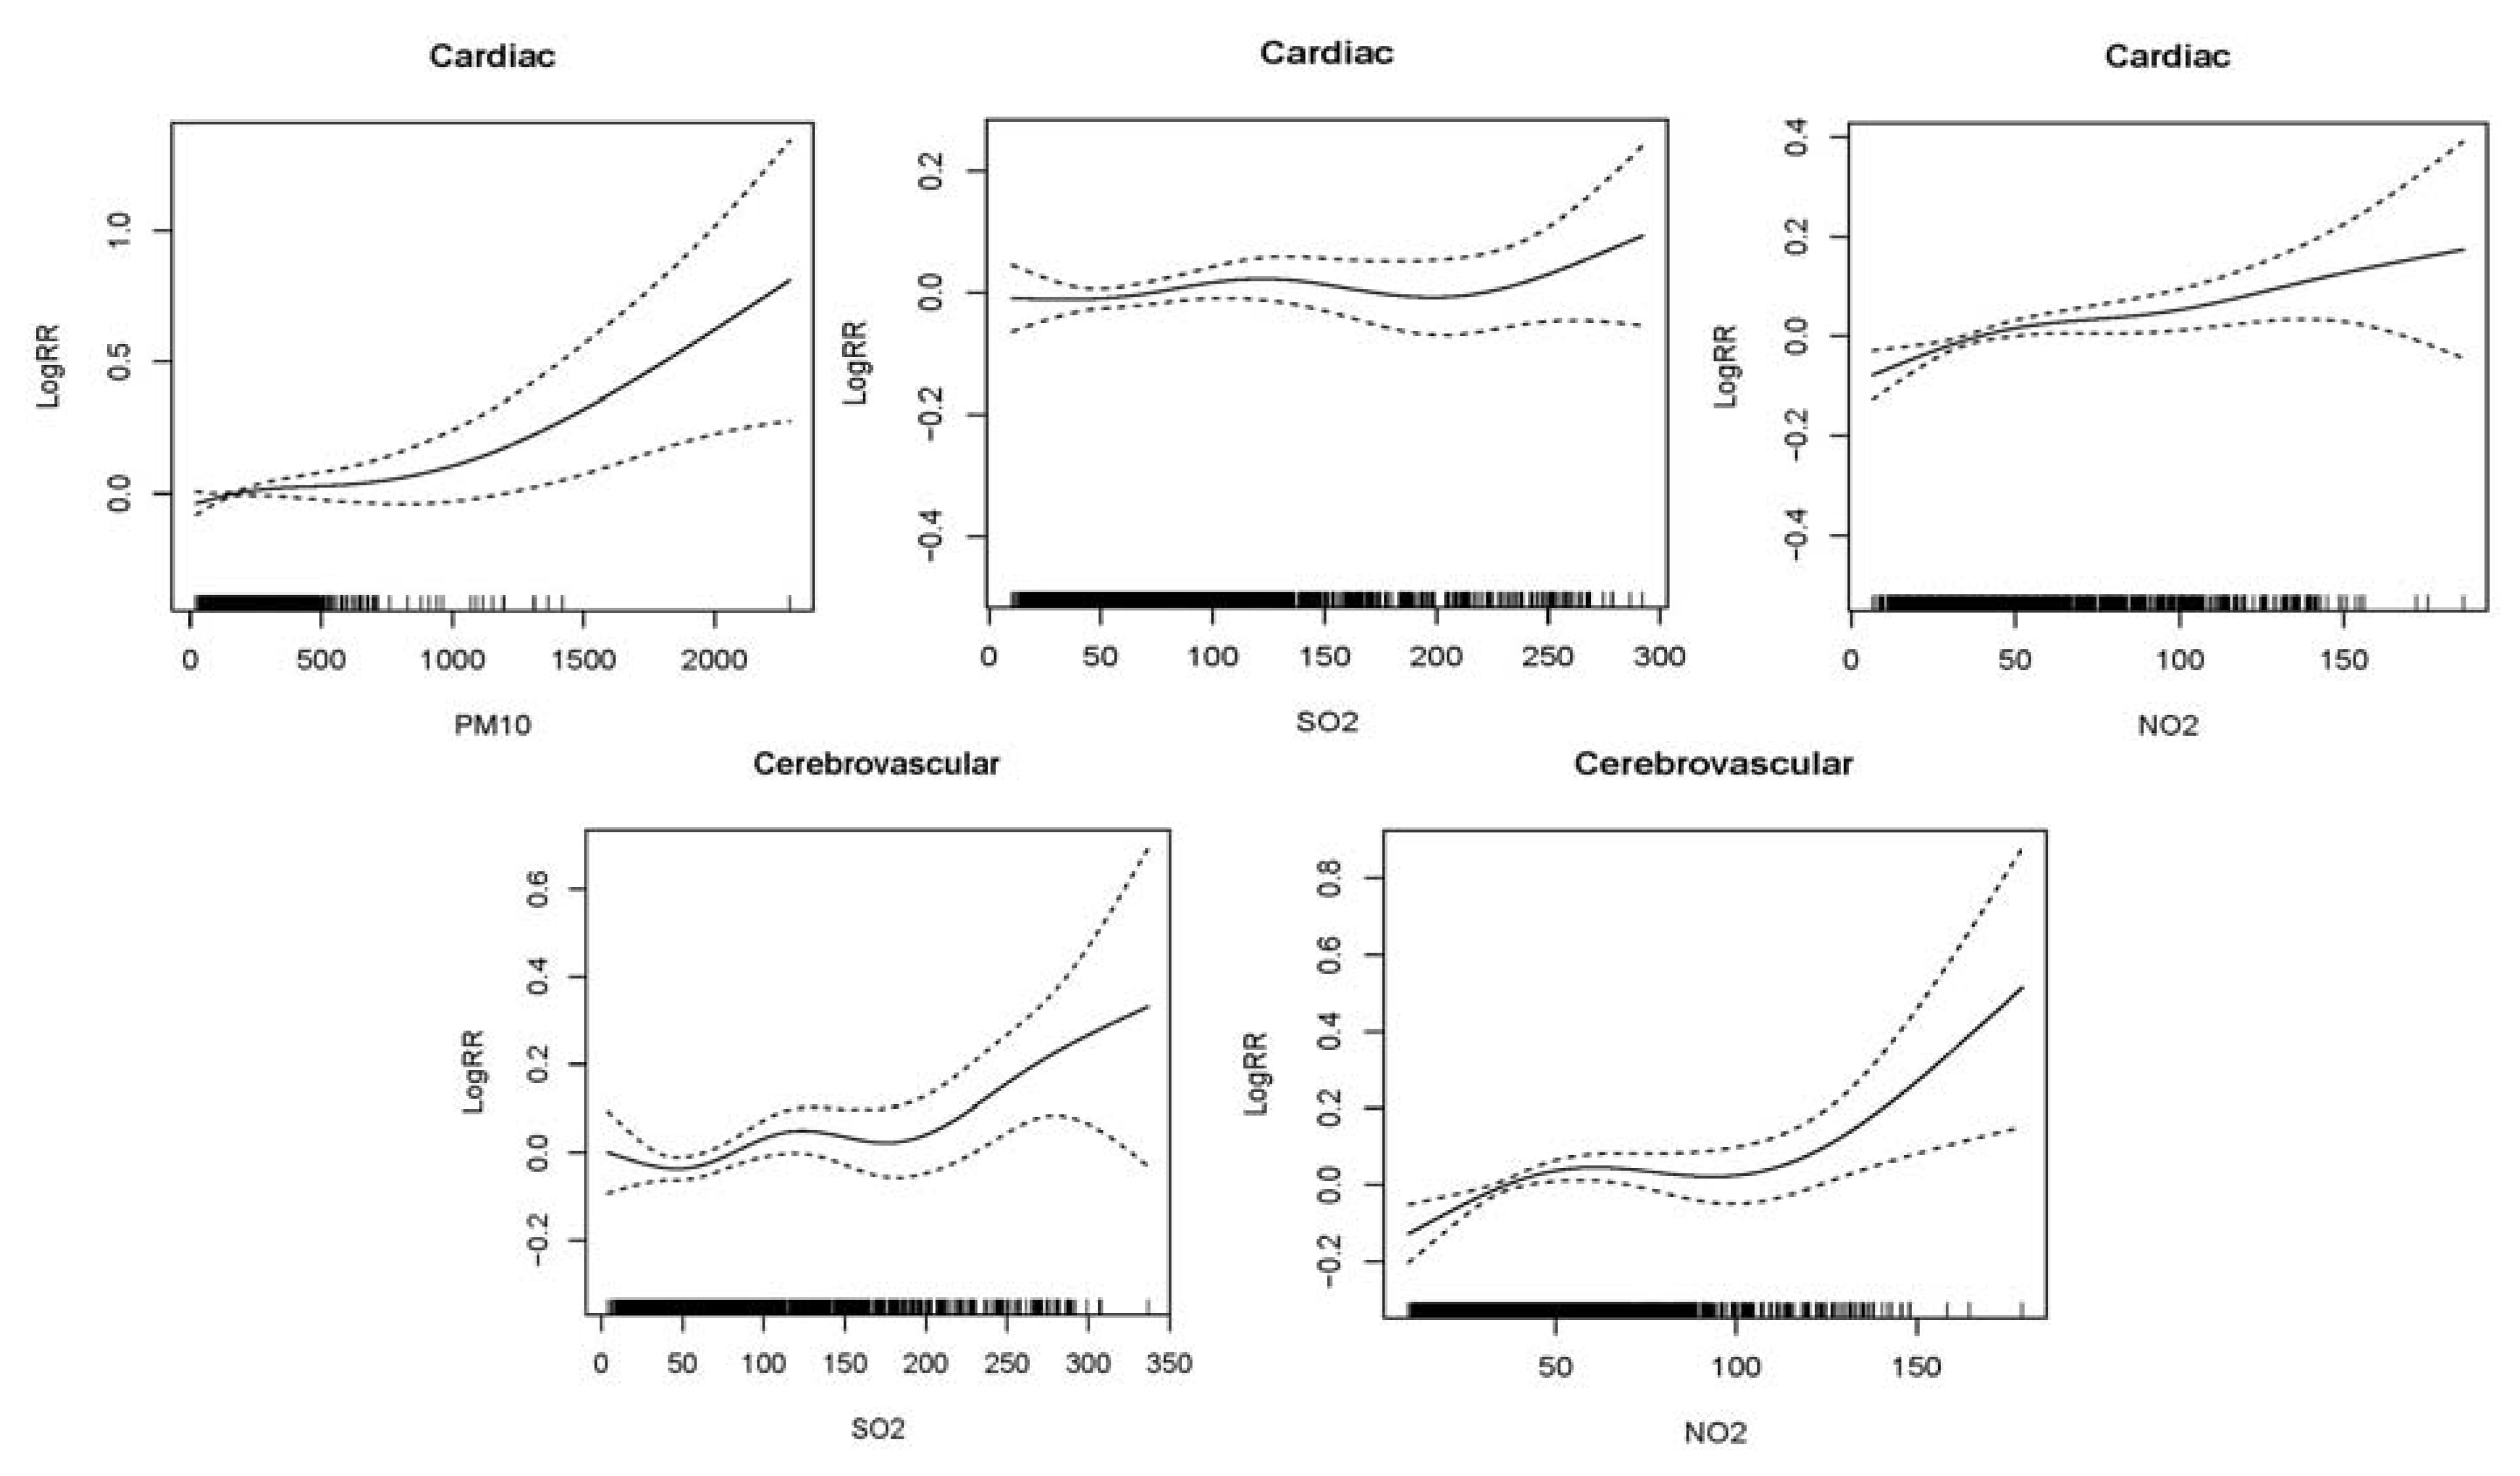
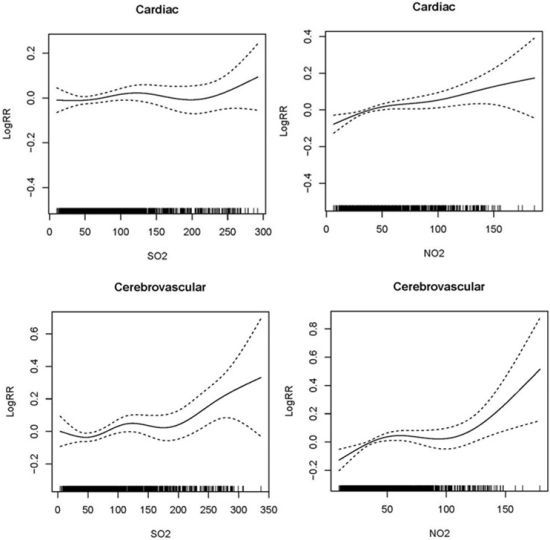
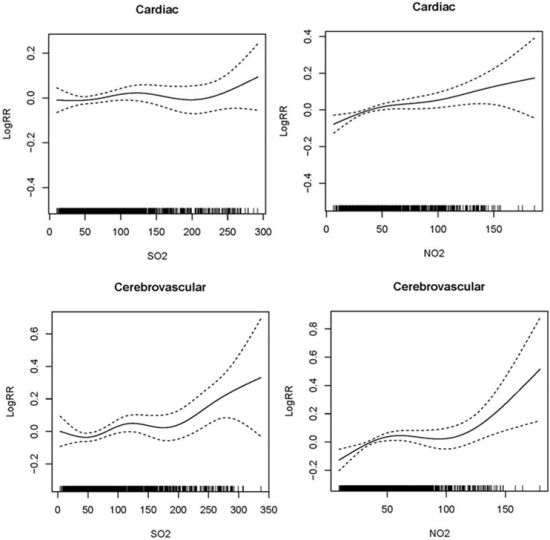
Figure 2 shows graphically the exposure-response relationships between air pollutants and daily hospital admissions for cardio-cerebrovascular disease in the single-pollutant models. There were similar positive linear relationships between air pollutants and cardiac and cerebrovascular hospital admissions, which indicated the relative risk of hospital admissions increased as air pollution increased in Lanzhou during the study period. Since there was no significant association between cerebrovascular disease and PM
10, we did not give the figure.
Figure 2.
Smoothing plots of air pollutants against hospital admissions risk of cardiac and cerebrovascular diseases. X-axis is the pollutant (PM10 or SO2 or NO2) (µg/m3). The solid lines indicate the estimated mean percentage of change in daily hospital admission, and the dotted lines represent twice the point-wise standard error *. * The greatest effects of single-day lag 0 (L0) SO2 and cumulative-day lag (Lag01 for PM10, lag02 for NO2 ) were used for cardiac hospital admissions; cumulative-day lag 03 (L03) SO2 and NO2 were used for cerebrovascular hospital admissions. All models were controlled for the time trend, DOW, holiday, mean temperature and humidity.
Table 4 shows the magnitude of the effects of air pollutants varied with gender and age. The significant associations were found between air pollutants and hospital admissions by gender. The effects of gaseous pollutants showed the greater association with cardiac-cerebrovascular diseases than the particulate matter in male and female. Percent increases of cardiac-cerebrovascular diseases in female were significantly greater than in male except for SO
2 on cerebrovascular diseases. In two different age groups, the significant effects of air pollutants on hospital admissions clearly increased with age with the exception of the effect of SO
2 on cardiac hospital admissions.
Table 4.
A Percent change (mean and 95%CI) of daily hospital admissions with an IQR increase in pollutant concentrations by gender and age group in Lanzhou from 2001 to 2005 *.
Table 4.
A Percent change (mean and 95%CI) of daily hospital admissions with an IQR increase in pollutant concentrations by gender and age group in Lanzhou from 2001 to 2005 *.
| | Cardiac diseases | Cerebrovascular diseases |
|---|
| n a | Change % (95%CI) | p value | N a | Change % (95%CI) | p value |
|---|
| Gender | | | | | | |
| Male | PM10 | 5.94 | 2.05 (−0.17~4.32) | 0.07 | 3.79 | −0.21 (−3.47~3.17) | 0.90 |
| | SO2 | | 2.33 (−0.72~5.49) | 0.14 | | 6.47 (2.41~10.68) | <0.00 |
| | NO2 | | 3.64 (0.54~6.84) | 0.02 | | 4.45 (0.38~8.68) | 0.03 |
| Female | PM10 | 3.71 | 2.99 (0.10~5.96) | 0.04 | 2.03 | −3.72 (−8.39~1.19) | 0.14 |
| | SO2 | | 5.82 (1.63~10.17) | 0.01 | | 2.65 (−3.53~9.24) | 0.41 |
| | NO2 | | 6.25 (1.98~10.70) | <0.00 | | 6.06 (0.47~11.95) | 0.03 |
| Age | | | | | | |
| <65 | PM10 | 4.15 | 2.19 (−0.35~4.80) | 0.09 | 2.98 | −0.65 (−4.39~3.25) | 0.74 |
| | SO2 | | 2.82 (−0.41~6.16) | 0.09 | | 3.97 (−1.32~9.55) | 0.14 |
| | NO2 | | 3.04 (−0.15~6.33) | 0.06 | | 2.92 (−1.44~7.47) | 0.19 |
| ≥65 | PM10 | 5.50 | 2.47 (0.03~4.98) | 0.04 | 2.84 | −1.98 (−5.79~1.98) | 0.32 |
| | SO2 | | 2.05 (−0.69~4.86) | 0.14 | | 6.15 (0.77~11.83) | 0.02 |
| | NO2 | | 4.60 (1.83~7.45) | <0.00 | | 5.85 (1.15~10.78) | 0.01 |
Table 5 shows the effects of air pollutants on daily hospital admissions across seasons, with the interaction terms of pollution concentrations and the season. We observed the significant associations both in the cold season and warm season. In the cold season, the significant positive relationships were observed between PM
10 and NO
2 and cardiac disease hospitalizations. Similarly, significant associations of NO
2 and SO
2 with cerebrovascular disease hospitalizations were observed. In the warm season, only NO
2 was significantly associated with increased cardiac disease admissions, and the effect estimates were higher than that in the cold season.
Table 5.
Percent change (mean and 95%CI) of daily hospital admissions associated with an IQR increase in pollutant concentrations modified by season level in Lanzhou from 2001 to 2005 *.
Table 5.
Percent change (mean and 95%CI) of daily hospital admissions associated with an IQR increase in pollutant concentrations modified by season level in Lanzhou from 2001 to 2005 *.
| Season a | Cardiac diseases | Cerebrovascular diseases |
|---|
| n b | Change % (95%CI) | p value | n b | Change % (95%CI) | p value |
|---|
| Cold season | | | | | | |
| PM10 | 9.72 | 7.92 (1.91~14.30) | 0.01 | 5.58 | −4.67 (−13.0~4.58) | 0.31 |
| SO2 | | 2.02 (−0.21~4.29) | 0.08 | | 5.76 (1.65~10.04) | 0.01 |
| NO2 | | 2.94 (0.68~5.25) | 0.01 | | 4.58 (1.02~8.27) | 0.01 |
| Warm season | | | | | | |
| PM10 | 9.59 | 5.81 (−0.20~12.18) | 0.06 | 6.06 | −2.90 (−6.11~0.41) | 0.08 |
| SO2 | | 1.97 (−3.82~8.10) | 0.51 | | 2.81 (−7.84~14.68) | 0.62 |
| NO2 | | 8.41 (3.69~13.34) | <0.00 | | 5.39 (−1.74~13.03) | 0.14 |
Table 6.
Percent change (mean and 95%CI) of daily hospital admissions of Lanzhou associated with an IQR increase in pollutant concentrations in single and multiple pollutants models. *
Table 6.
Percent change (mean and 95%CI) of daily hospital admissions of Lanzhou associated with an IQR increase in pollutant concentrations in single and multiple pollutants models. *
| Models | Cardiac diseases | Cerebrovascular diseases |
|---|
| Change % (95%CI) | p value | Change % (95%CI) | p value |
|---|
| PM10 | 2.13 (0.15~4.15) | 0.03 | −2.39 (−5.43~0.75) | 0.13 |
| + SO2 | 1.97 (−0.03~4.01) | 0.05 | −1.84 (−4.88~1.29) | 0.25 |
| + NO2 | 1.27 (−0.80~3.38) | 0.23 | −2.10 (−5.14~1.05) | 0.19 |
| + SO2+ NO2 | 1.27 (−0.80~3.38) | 0.23 | −2.04 (−5.10~1.12) | 0.20 |
| SO2 | 2.29 (−0.11~4.76) | 0.06 | 5.40 (1.72~9.23) | <0.00 |
| + PM10 | 2.58 (−0.29~5.54) | 0.08 | 8.52 (4.65~12.53) | <0.00 |
| + NO2 | −0.24 (−3.57~3.22) | 0.89 | 5.82 (1.34~10.50) | 0.01 |
| + PM10+ NO2 | −0.05 (−3.45~3.46) | 0.98 | 5.86 (1.37~10.54) | 0.01 |
| NO2 | 3.94 (1.83~6.09) | <0.00 | 4.40 (1.25~7.64) | 0.01 |
| + PM10 | 4.16 (1.55~6.84) | <0.00 | 6.97 (3.59~10.46) | <0.00 |
| + SO2 | 4.71 (1.64~7.88) | <0.00 | 4.00 (0.08~8.07) | 0.04 |
| + PM10+ SO2 | 4.18 (1.02~7.45) | 0.01 | 4.82 (0.81~8.98) | 0.02 |
Table 6 compares the results of single-pollutant and multiple-pollutant models. For cardiac disease hospital admissions, the effect of PM
10 reduced and became insignificant after adjusting other pollutants, SO
2 has no significant effect either before or after adjustment for co-pollutants. The effect of NO
2 increased and remained significant after adding the other pollutants. As for cerebrovascular diseases hospital admissions, PM
10 was not found significant in both single and multi-pollutant models. The effect of SO
2 did not alter much by adding NO
2, or both NO
2 andPM
10, but its effect became larger after adding PM
10; NO
2 results were similar with SO
2.
4. Conclusions
In our study, we found a significant association between ambient air pollutants and the daily hospital admissions for cardio-cerebrovascular disease in Lanzhou during 2001–2005. The effects of SO2 and NO2 were associated with the increased number of cardiac and cerebrovascular disease admissions. The people aged 65 years and older was associated more strongly with gaseous pollutants than the younger. Although more significant associations were found in the cold season, the effect of NO2 was apparent in the warm season. These findings may give suggests for the local government to take steps to protect human health in Lanzhou.
Some previous studies have been conducted to estimate the effects of particulates on cardiovascular diseases in mortality [
5,
20,
25,
26,
27] and morbidity [
4,
7,
21,
28,
29] in many regions of the world. We found a significant impact of PM
10 on hospital admissions for cardiac disease, but no such pattern was found between PM
10 and cerebrovascular diseases. Our findings confirm those of earlier large analyses in European [
3,
30], Australian and New Zealand [
8] cities. Although some significant results of several studies have showed the association between PM
10 and stroke [
31,
32], little evidence clearly points to a possible effect on stroke, the biologic mechanisms for these associations also have not been fully established well. The particulates pollution was mainly caused by fossil-fuel combustion, local heavy industry emission and remote transport of dust storm in Lanzhou. Recent biological studies [
33,
34,
35] provided the evidences that PM
10 can influence important circulatory parameters including fibrinogen levels, counts of platelets and white or red blood cells that were increased risk factors of cardiovascular disease. Additional studies with more detailed data obtained from a wide variety of cities throughout the world are needed to confirm a major argument in favor of causality.
SO
2 is a gaseous pollutant mainly emitted by fuel combustion and has been found to be significantly associated with the increased cardiovascular [
6,
36], ischemic heart disease [
6], hypertension [
37], heart failure [
36], and stroke [
32] disease admissions. Findings of our study also showed the significant associations between SO
2 and cardiac and cerebrovascular disease admissions, but some researches [
4,
36] found inconsistent results which might be due to correlations with PM
10 and NO
2. Although SO
2 didn’t show a very robust effect on cardiac diseases when adding NO
2 or both NO
2 and PM
10 in multiply pollutant models, a recent study [
6] in Europe provided the evidence that SO
2 pollution may play an independent role in triggering ischemic cardiac events, which indicate the adverse effect of SO
2 on human health as an independent air pollutant. The potential biological mechanisms have been proposed for the relationship. As the SO
2 inhalation concentration rise, the osmotic fragility ratios, and methemoglobin and sulfhemoglobin values were significantly higher in blood [
38]. Recent studies also found that SO
2 had relevant effects on blood pressure, heart rate variability [
39] and ventricular arrhythmia [
40].
Of the pollutants we considered, the significant associations with NO
2 were the most robust in single and multiple pollutant models in our study. This result was consistent with some studies [
32,
37], but conflict with the other findings [
4]. According to the research [
41], motor vehicle exhaust and industrial emissions were the major anthropogenic sources of NO
2 in Lanzhou. The adverse effect of NO
2 on cardiovascular diseases has been widely reported mainly in urban areas. Studies on the biological mechanism of cardiovascular impairments due to gaseous pollutants found that the increase in NO
2 was associated with increased plasma fibrinogen [
42], platelet counts [
33] and arrhythmia [
43]. Increasing NO
2 exposure also found to be associated with decreasing the standard deviation of all normal-to-normal intervals (SDNN) [
44] which was a risk marker in patients with left ventricular systolic dysfunction (LVSD) [
45]. All these adverse effects may in turn activate circulatory pathways and impair cardiovascular function.
Elderly people had higher estimates for cardiac-cerebrovascular admissions for gaseous pollutants than the younger except the effect estimate of SO
2 on cardiac hospital admissions in this study. Some studies have suggested that gaseous pollutant from outdoor sources has stronger effect on the elderly than younger people [
8,
36]. Another research of the public health and air pollution in Asia (PAPA) study [
46] showed sex, age and education may modify the health effects of outdoor air pollution in Shanghai, and females and the elderly were more vulnerable to outdoor air pollution. Actually elderly people constitute the largest proportion of cardiovascular illness and death; they were usually susceptible to air pollution as the high-risk group compared with younger people. Especially for those patients with cardiorespiratory diseases, we hypothesized that these elderly people may not adjust well to the serious air pollution. So the identification of target diseases and high risk groups would be useful in finding suitable air quality guidelines in environmental health [
36].
Our findings showed the significant association between air pollutants and hospital admissions in both the cold and warm season. Generally, the concentrations of air pollutants were higher and more variable in the cold season than in the warm season in Lanzhou, and the more significant effects of air pollutants on cardio-cerebrovascular disease admissions were found accordingly in the cold season, which is consistent with several studies in Shanghai [
14] and Hong Kong [
4]. The observation of stronger effects of air pollutants in the cold season might be due to the special topography characteristics and regional meteorology in Lanzhou. Lanzhou is located in a narrow (2–8 km width) and long (40 km), valley surrounded by mountains with the Yellow River flowing across the city. And in such a valley, the weather is generally stable with weak wind and strong inversions. The topographic characteristics make Lanzhou vulnerable to the air pollution, particularly in winter [
47]. Additionally, except the traffic and industrial process emissions, increased winter domestic coal consumption exerted a strong influence on ambient pollutant concentrations [
41]. On the other hand, we also observed the high effect of NO
2 in the warm season. The consistent results were also found that the stronger effect of NO
2 on cardiovascular disease at the higher temperature level in Wuhan [
48] and Taiwan [
32]. There were some possible reasons for this phenomenon. Firstly, with the development of urbanization process, the volumes of vehicular traffic were increasing which might be the main resource of NOx. In addition, in the warm season, with higher temperature and insolation rates, ambient ozone levels increased which may result in the oxidation processes of NO to NO
2 enhanced [
41]. So, it was considered the interaction effect of gaseous pollutants exposure and the season may be existed and the potential mechanism should be studied further.
Our study has several limitations. Firstly, like other ecological studies, we just use the average of monitoring results across different stations as surrogates of personal exposure level to ambient air pollution. The use of ambient rather than personal exposure measures is expected to result in exposure misclassification. However, this misclassification is expected to lead one to underestimate the relative risk [
49]. And the difference between these proxy values and the true exposures are an inherent and unavoidable type of measurement error [
14]. Secondly, due to the date of symptom onset likely preceded the date of admission in a proportion of cases, there is a delay from the onset of an increase in the air pollutant level to hospital admission for cardio-cerebrovascular diseases. Thirdly, the data of hospital admissions we collected was limited in four hospitals, a select basis may exist in our study.
In summary, we observed significant associations between exposure to gaseous pollutants (SO2 and NO2) and increased hospital admissions for cardio-cerebrovascular disease in Lanzhou. Our finding strengthens the evidence of the short-term effect of gaseous pollutants on cardio-cerebrovascular diseases for morbidity in a heavily polluted city of western China. This work may have many implications for the redesigning of public health policy regarding the air pollution in Lanzhou.

