2.1. Mathematical Model
We start with considering the transmission dynamics in a randomly mixing population, although a heterogeneous model will be considered later. Let
R0 be the basic reproduction number of an infectious disease, representing the average number of secondary cases generated by a typical primary case throughout the course of its infectiousness in a fully susceptible population [
8]. In a common transmission dynamics written by ordinary differential equations (e.g., the so-called “Susceptible-Infectious-Removed (SIR)” model),
R0 may be decomposed as the product of the transmission rate
β and the average duration of infectiousness 1/
γ. Under contact tracing practice which is accompanied by case isolation, we assume that the contact tracing takes place before the traced exposed individuals become infectious and that a fraction
q of the total contacts of primary case can be traced and are effectively prevented. The average number of secondary cases generated by a primary case under the contact tracing is thus (1 −
q)
R0.
We describe a population in which only a part of them are fully protected from infection due to vaccination that took place in advance of an epidemic. Due to the vaccination practice, a fraction
vf is assumed as fully immune, while a fraction
vp is partially immune (e.g., not protected from smallpox but protected from the severe illness). Partially immune individuals are assumed to have a reduced susceptibility by a factor
αs ≤ 1. Even provided that the partially immune individuals are infected, their infectiousness is assumed to be
αi times that among fully susceptible individuals (where
αi ≤ 1). The relative reductions in susceptibility and infectiousness are common assumptions [
4]. Moreover, we assume that vaccination elicits protection from severe disease. Because of the reduced severity, cases among partially immune individuals would be more mobile and have a greater contact rate than cases arising from susceptible individuals by a factor
αm ≥ 1. Lastly, the reduced severity may not only improve clinical outcomes but also delay diagnosis, and thus, we assume that the duration of infectious contact is lengthened by
αd times (where
αd ≥ 1). It should be noted that the last two effects,
i.e.,
αm and
αd, are vaccine-induced modifications in behavior, and thus, the estimates could vary with calendar time, geographic location and during the course of an epidemic (see Discussion). For simplicity and for the exposition of our modeling results, we focus on the early stage of an epidemic in a single hypothetical setting. In summary, we consider four individual effects of vaccination among which two act as protective (
i.e., reduce the average number of secondary cases per single primary case), while the remaining two factors,
αm and
αd, can increase the reproduction number of partially immune individuals relative to fully susceptible individuals.
Under the abovementioned scenario, we assess four epidemiological outcome measures, including: (i) the threshold of a major epidemic under the interventions (contact tracing/case isolation and vaccination); (ii) the probability of extinction given a single vaccinated or unvaccinated index case; (iii) the expected number of cases throughout the course of an epidemic, and (iv) the expected duration of a minor outbreak.
To describe the transmission dynamics under vaccination, we employ the next-generation matrix. We split the population into two sub-groups by vaccination history and the average number of secondary cases in sub-group
i generated by a single primary case of sub-group
j is denoted by
Rij (where the subscripts
i and
j represent the vaccination history in which vaccinated individuals are denoted by 1 and otherwise 0). The average numbers of within- and between-group transmissions that are seen among those who are capable of causing further cases are parameterized as follows:
Namely, among unvaccinated contacts caused by unvaccinated primary cases, the proportion of those who do not possess residual immunity (1 −
vf −
vp) and contact tracing of primary cases (1 −
q) are multiplied to
R0. When the contacts are vaccinated, partially protected population
vp has a reduced susceptibility by
αs times as compared to unvaccinated. When the primary case is vaccinated, the transmissibility is multiplied by
αiαmαd due to individual effects of vaccination on the primary case as mentioned above. Although the reproduction numbers (1) are heuristically described,
Rij similar to Equation (1) can be derived from a variety of equation systems that adopt the abovementioned assumptions. The next-generation matrix,
K, is written as:
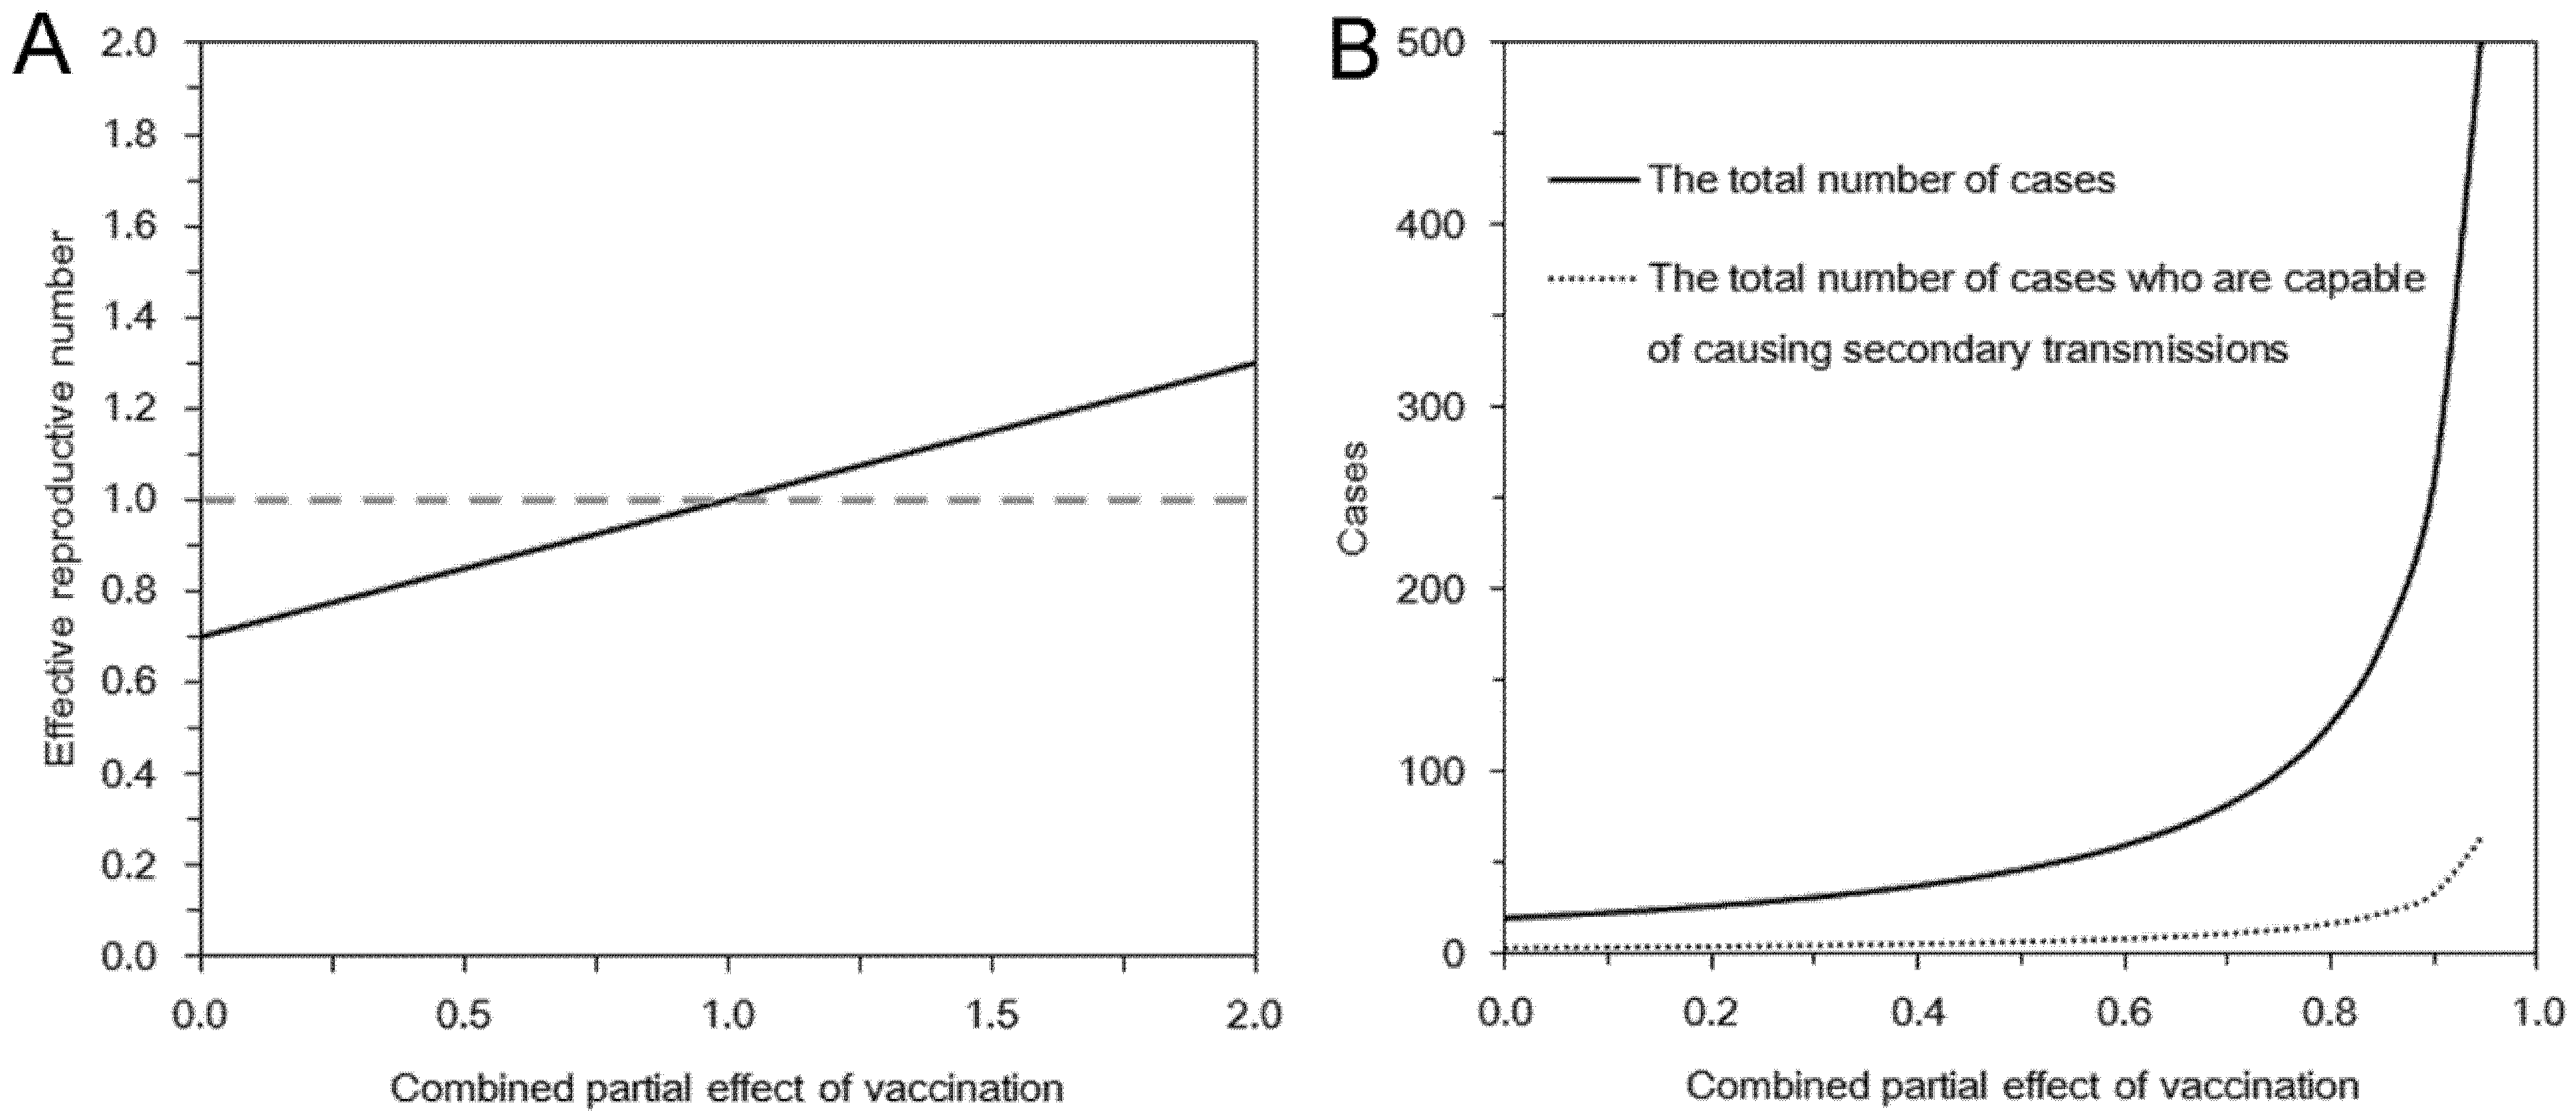
The effective reproduction number,
Rv, of a population with vaccine-induced immunity is defined as the dominant eigenvalue of the next-generation matrix:
For the sake of clarity in our theoretical exposition (to apply model-based findings to the practical issue of smallpox control), we focus on the spread of infection that can be expected to be contained in the absence of partial immunity. Considering that 30% or more of the present day population has never been vaccinated, the assumption of “successful containment” indicates that the contact tracing is highly effective in preventing secondary transmission [
1] (e.g., the initial attack size should not be too large to contain smallpox by means of contact tracing and case isolation). Namely,
Rv < 1 for
vp = 0, or equivalently, (1 −
q)(1 −
vf)
R0 < 1.
2.2. Epidemic Threshold and Vaccine Effects
Let
nu,i and
nv,i be the numbers of unvaccinated and vaccinated cases in generation
i, respectively. For mathematical convenience, here we focus on the exponential growth (linear phase) alone. Given the initial numbers of
nu,0 unvaccinated and
nv,0 vaccinated index cases, the
i-th generation is written as:
The total number of unvaccinated and vaccinated cases,
Nu and
Nv, throughout the course of an epidemic is calculated as:
Combining Equations (4) and (5), we get:
which results from geometric series and converges only in the case of
Rv < 1. A major epidemic, which does not decline to extinction without substantial depletion of susceptible individuals or concerted effort of control, occurs if and only if
Rv > 1. Solving the inequality with respect to vaccine effects, we obtain the following condition that allows a major epidemic to occur:
We assume that an outbreak starts with a single index case. In the sub-critical case (
i.e.,
Rv ≤ 1), the total number of cases converges to:
If an epidemic starts with a single infected individual who experiences infection at random, the probability that the index case is vaccinated is given by
vpαs/(1 −
vf −
vp +
vpαs). Otherwise, he/she is unvaccinated with the probability (1 −
vf −
vp)/(1 −
vf −
vp +
vpαs). Using this initial condition, the total number of cases who are capable of causing secondary transmissions is:
It should be noted that
Nu +
Nv increases if:
Caution must be exercised with respect to the total number of cases that is different from the calculation in Equation (9), because the abovementioned model has omitted the cases who were traced perfectly and isolated before developing infectiousness. That is, in addition to
R00 +
R10 in Equation (1), each unvaccinated cases have actually infected additional (1 −
vf −
vp +
vpαs)
qR0 cases who were perfectly traced and were not involved in further transmission dynamics given their own infections. Similarly, in addition to
R01 +
R11 in Equation (1), each vaccinated cases have caused
αiαmαd(1 −
vf −
vp +
vpαs)
qR0 cases who were traced. Thus, the total number of cases
Z is written as:
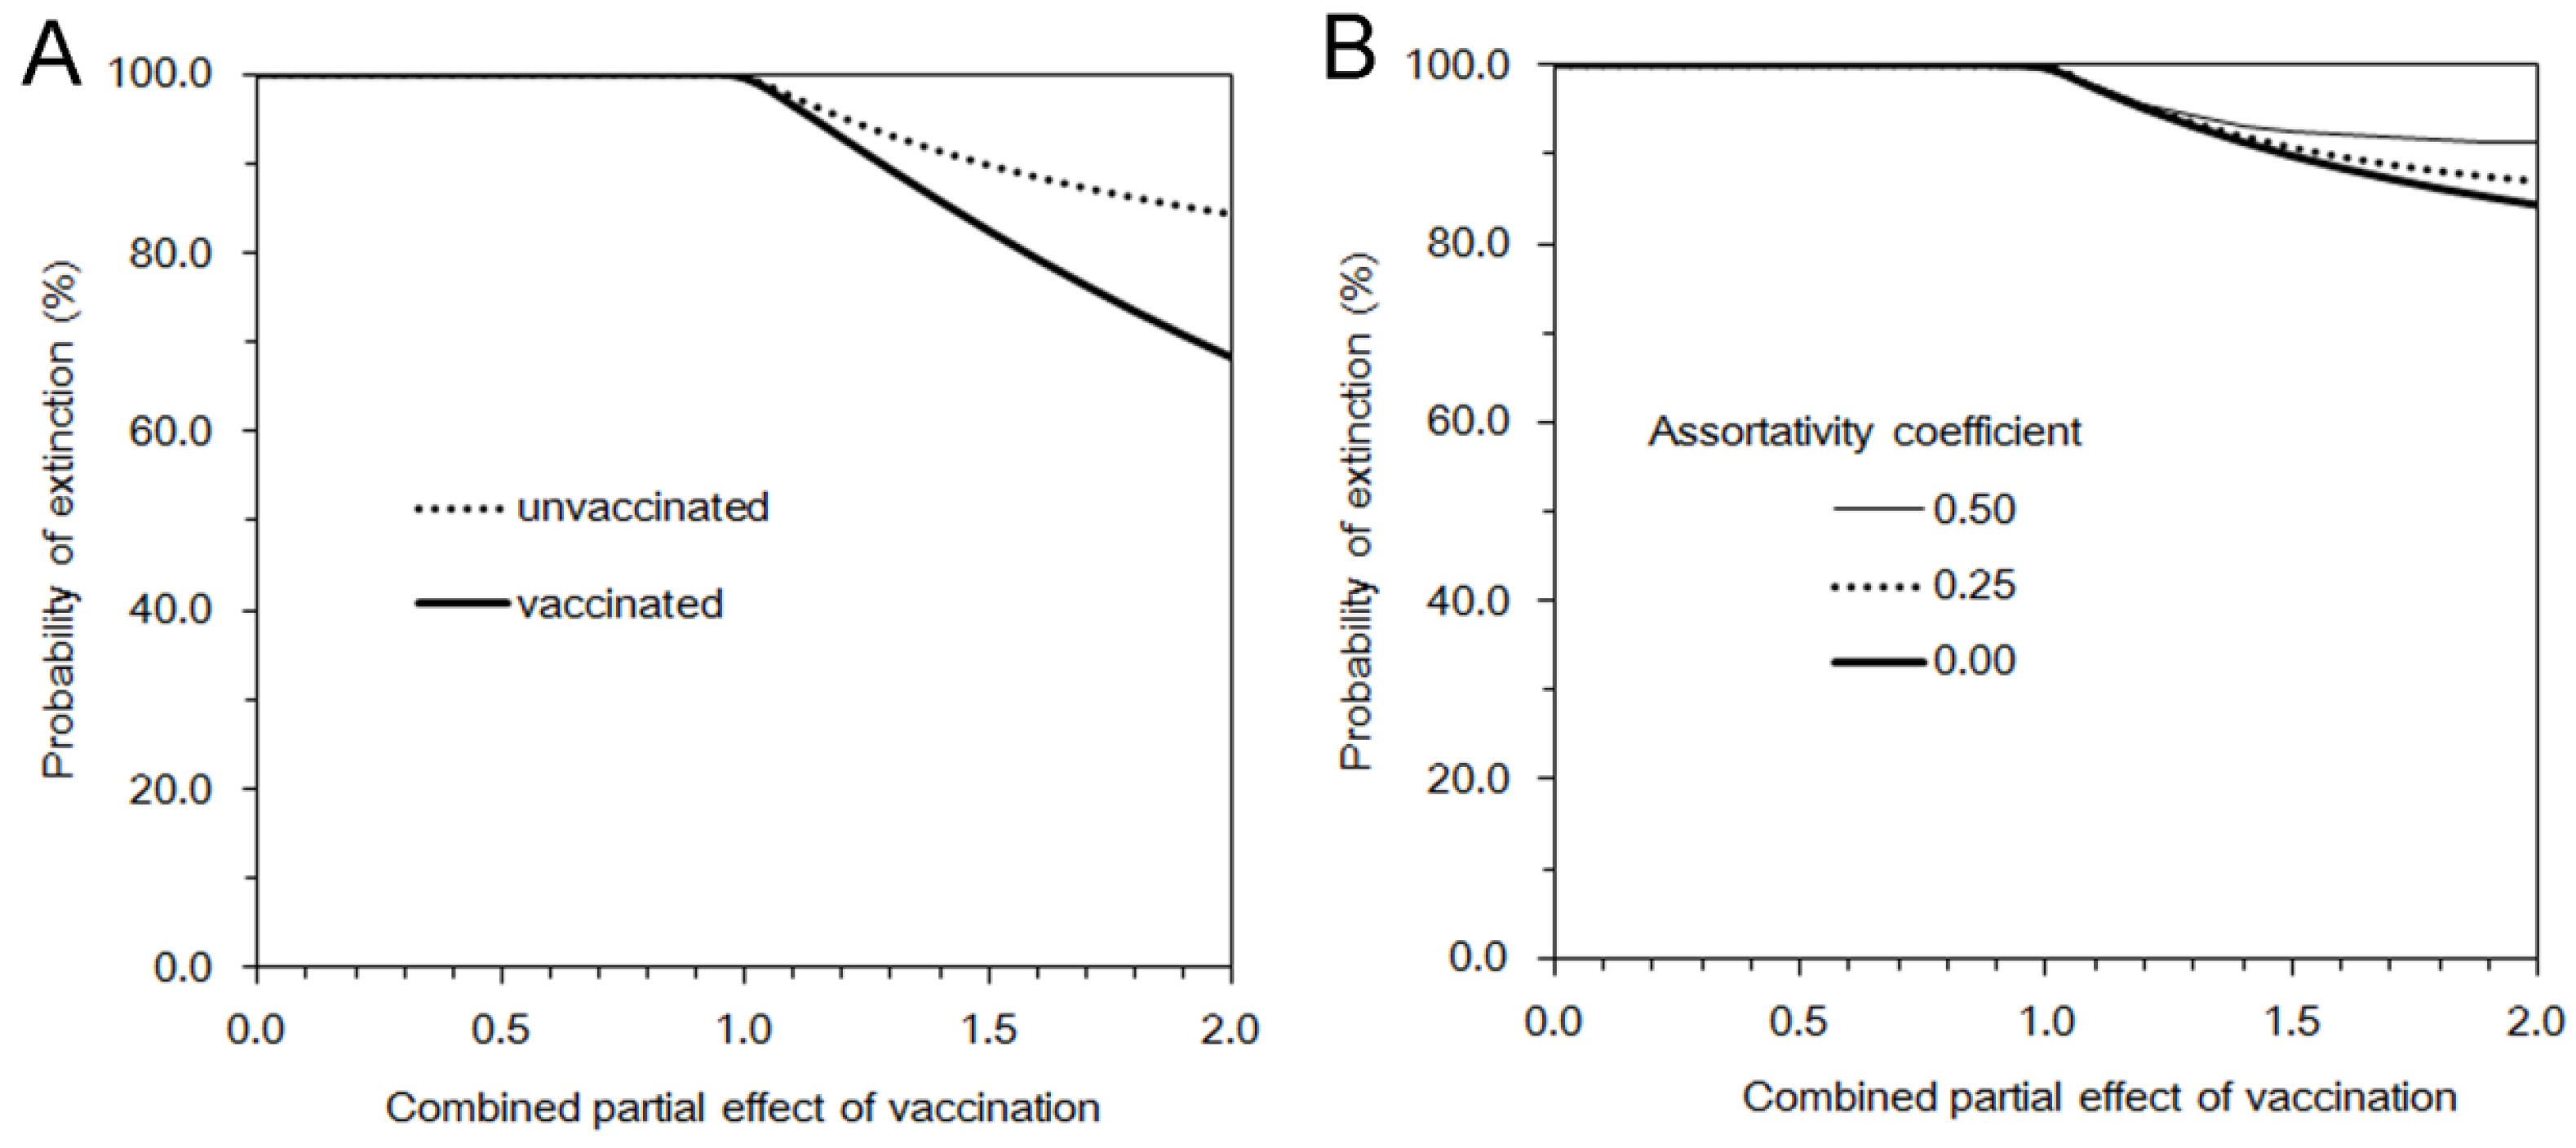
2.3. Probability of Extinction and Vaccine Effects
Whereas we consider a special case Rv < 1 for vp = 0, a combined vaccine effect that satisfies in Equation (7) for vp ≥ 0 can lead to a major epidemic. We thus consider the relationship between the probability of extinction and vaccine effects in the following by continuing to employ the abovementioned multi-type branching process approximation.
As adopted above, we label unvaccinated as type 0 and vaccinated as type 1. To ease the computation of the probability of extinction, we assume that the infectious period is exponentially distributed so that the multi-type branching process model can be rewritten as a multivariate birth-and-death process [
9,
10,
11,
12]. Let
γi (
i = 0 or 1) be the recovery rate of infectious individuals of type
i and
βij (0 ≤
i,
j ≤ 1) be the rate of increase in infectious individuals (
i.e., the so-called “birth rate” of birth-and-death process) of type
i generated by a primary case of type
j. Considering a large population that consists of fully susceptible individuals, each element of the next-generation matrix is written as
Rij =
βij/
γj.
Let
F be the probability generating function of the multi-type branching process,
i.e.,
where
pj(
x) is the probability that an individual of type
j causes the
x0 unvaccinated and
x1 vaccinated cases in the next generation. Following our foregoing study [
9], we have
Fj(
s) with an exponentially distributed infectious period that permits us to rewrite Equation (12) as:
for
j = 0 or 1. As we have already discussed elsewhere [
11,
12], Equation (13) is simplified to:
Any introduction of initial cases decline to extinction with probability 1 as long as
Rv ≤ 1. In the case of
Rv > 1, the extinction probability by generation
t,
πt(s) is described by using that at an earlier generation
t − 1,
i.e.,
where
u represents the initial condition, (
nu,0,
nv,0) = (0,1) or (1,0). Since we consider a two-host population (
i.e., unvaccinated and vaccinated cases), the probabilities of extinction at generation
t given a single unvaccinated,
πt(0,1) is given as a solution of the following simultaneous equations:
The probability of extinction,
π can be obtained by taking the limit of
t, which corresponding to:
or equivalently:
where
π0 and
π1 are the probabilities of extinction given one unvaccinated and vaccinated case, respectively. As practiced with many other branching process models, each of the secondary cases of type
i generated by a primary case becomes an ancestor of an independent sub-processes (which restarts with a type
i individual) behaving identically among the same type
i [
13]. Because of this multiplicative nature, the probability of extinction given multiple index cases (
a0,
a1) is calculated as:
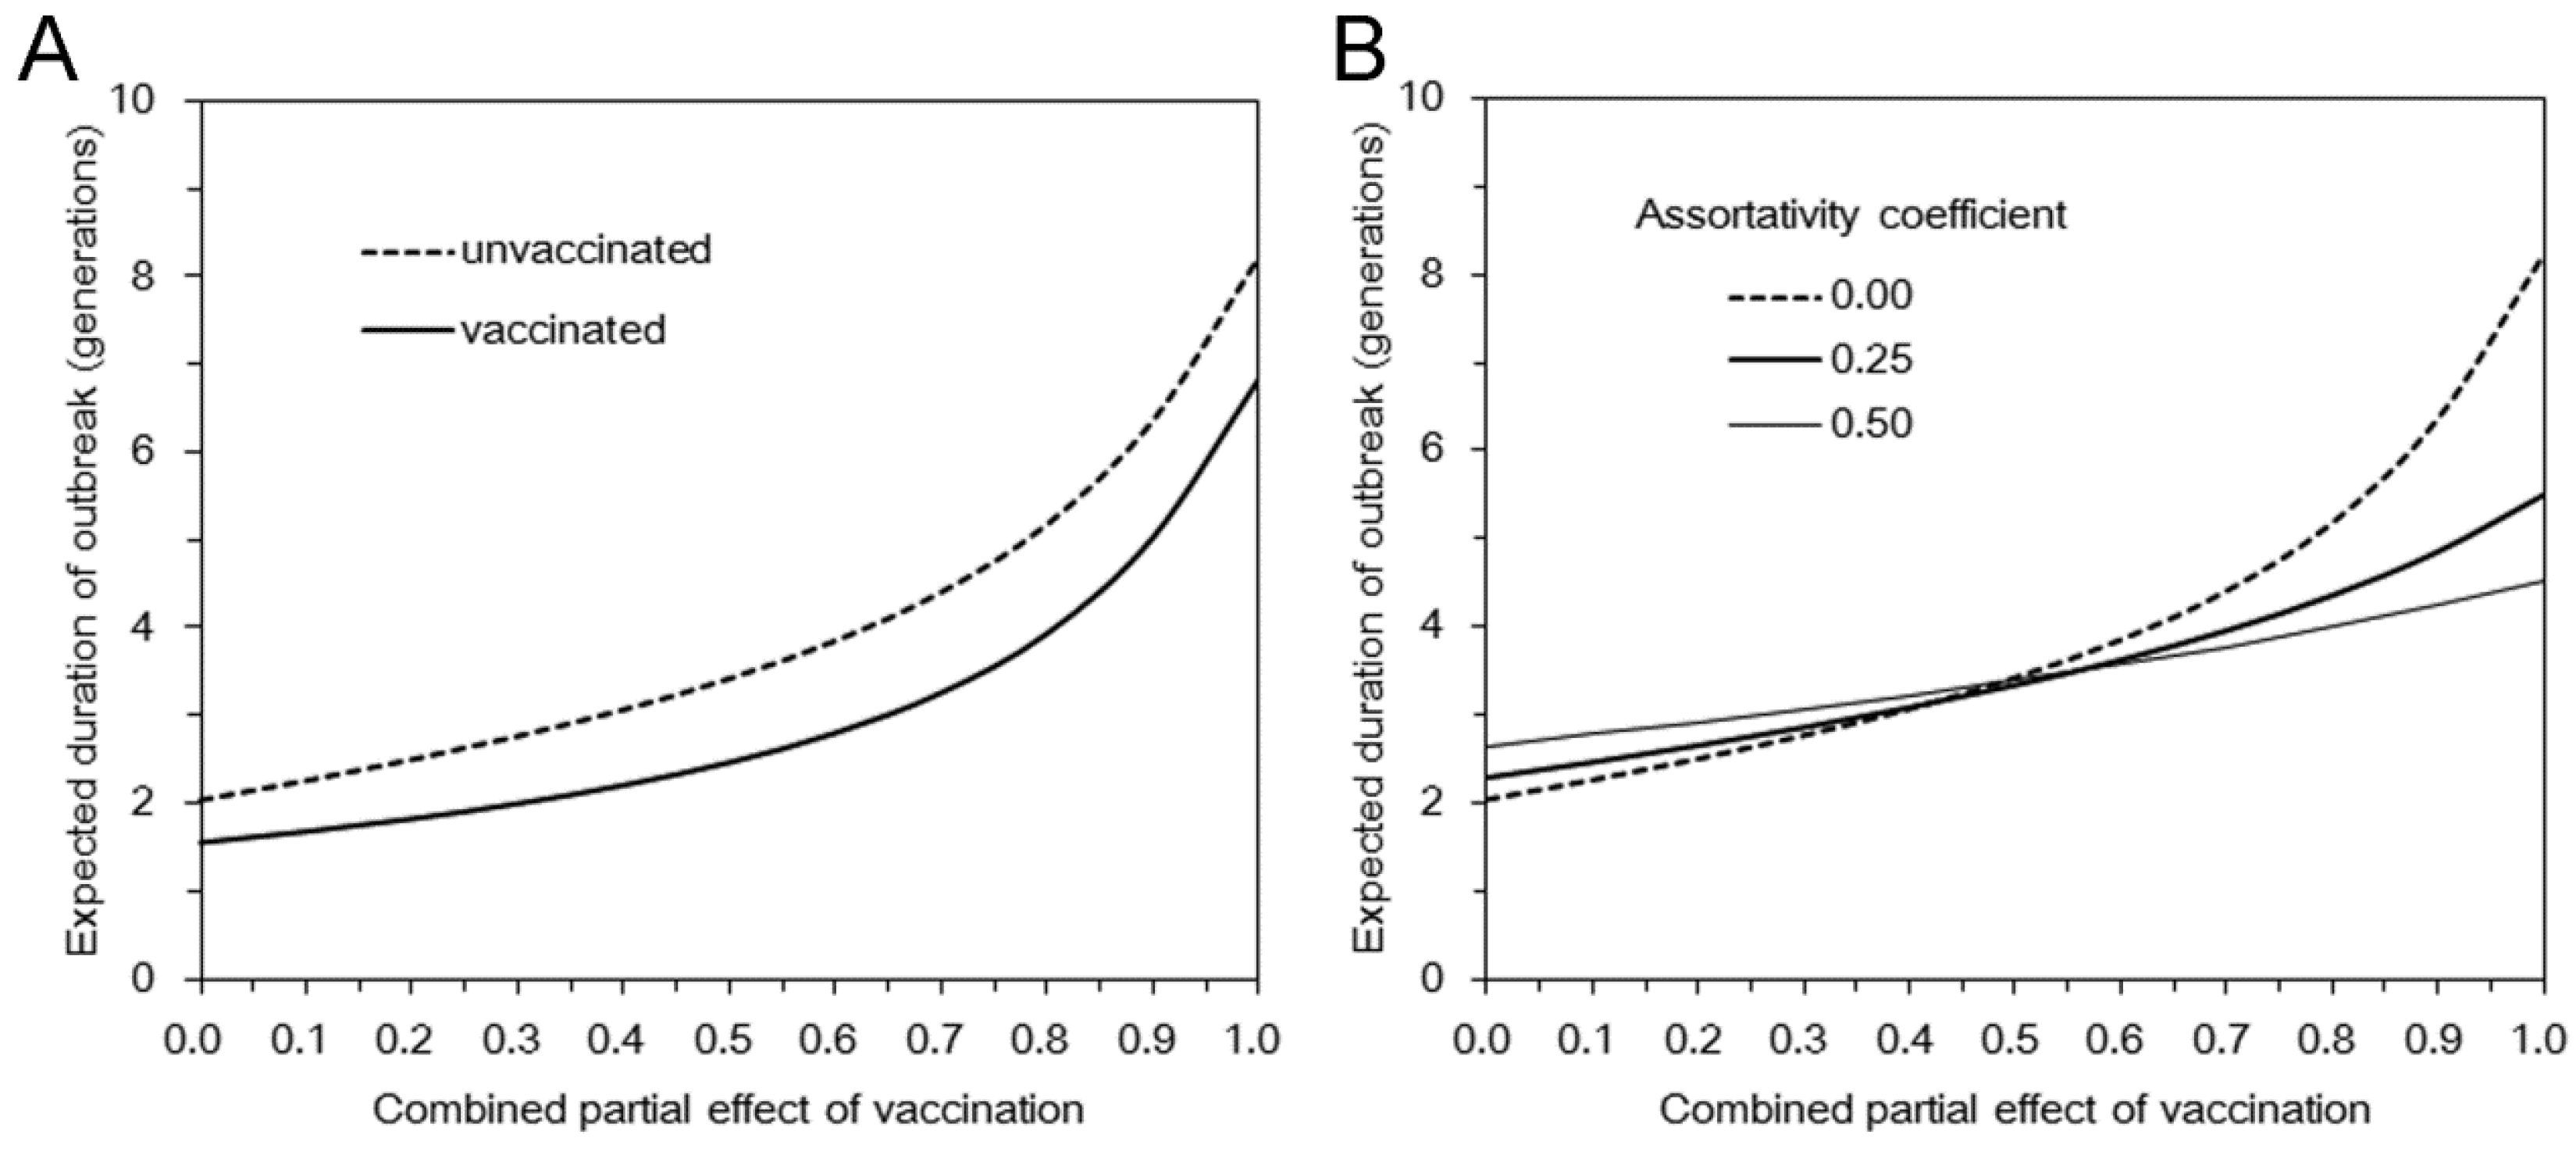
The expected duration of an epidemic, E(
T) is calculated as:
Since the abovementioned descriptions rest on homogeneous mixing assumption between vaccinated and unvaccinated individuals, we additionally consider a heterogeneous pattern of transmission, at least by assuming that there are more frequent contacts within unvaccinated subpopulation as compared to between vaccinated and unvaccinated individuals. To address the so-called “assortative mixing” (
i.e., a type of mixing in which a substantial fraction of contacts are reserved for within-group mixing), here we adopt the preferred mixing assumption [
14]. Let
θ be the proportion of contacts that are spent for within-group mixing, the element of the next-generation matrix for the heterogeneously mixing population is parameterized as:
where
ai measures the susceptibility of sub-group
i,
i.e.,
Similarly,
bj measures the infectiousness of primary cases in sub-group
j,
i.e.,
ni scales the population size of sub-group
i:
Note that the parameterization in Equation (21) would result in (1) if θ = 0 (i.e., random mixing). When θ = 1, all transmission occurs within an identical group, and this type of transmission is referred to as fully assortative.
2.4. Numerical Illustration
We consider a hypothetical scenario of biological warfare using variola virus. In advance of the bioterrorist event, we assume that no one possess full protection against smallpox any longer, and thus,
vf = 0 [
6,
15]. On the other hand, we assume that
vp = 0.3 or 30% of the population still possesses partial protection (nevertheless, it should be noted that the fraction of susceptible individuals would continue to increase as time goes by). As mentioned above, our scenario is supposed to be a subcritical process in the absence of partial protection [
6]. Namely,
Rv < 1 for
vp = 0. This leads to (1 −
q)(1 −
vf)
R0 < 1 (or (1 −
q)
R0 < 1 due to
vf = 0). In the absence of intervention,
R0 is crudely assumed to be 5 which is in line with the goal of vaccination coverage during the Intensified Smallpox Eradication Programme without accounting for other interventions [
16] and also with the published estimate of 6.85 if accompanied by contact tracing [
17,
18]. The protective effect of contact tracing,
q is arbitrarily assumed as 0.8 due to an assumption of sub-critical process (
i.e., to adopt an assumption of
Rv < 1). One should remember that these arbitrarily allocated
R0 and
q are very influential in discussing the feasibility of containment (using Equation (3)). Under these assumptions, we vary the combined effect of vaccination, denoted by
αsαiαmαd, while we adopt a fixed value of
αs at 0.8 given that a historical household data with probably limited vaccine potency indicates that susceptibility is reduced by a factor of 0.69 [
16]. Varying the combined effect of vaccination from 0 to 2, we calculate the estimate of the effective reproduction number, the expected total number of cases, the probability of extinction, and the expected duration of an outbreak. All statistical data were analyzed using a statistical software JMP version 9.0.0 (SAS Institute Inc., Cary, NC, USA).


