Development and Application of a New Grey Dynamic Hierarchy Analysis System (GDHAS) for Evaluating Urban Ecological Security
Abstract
:1. Introduction
2. Methodologies
2.1. Background and Requirements
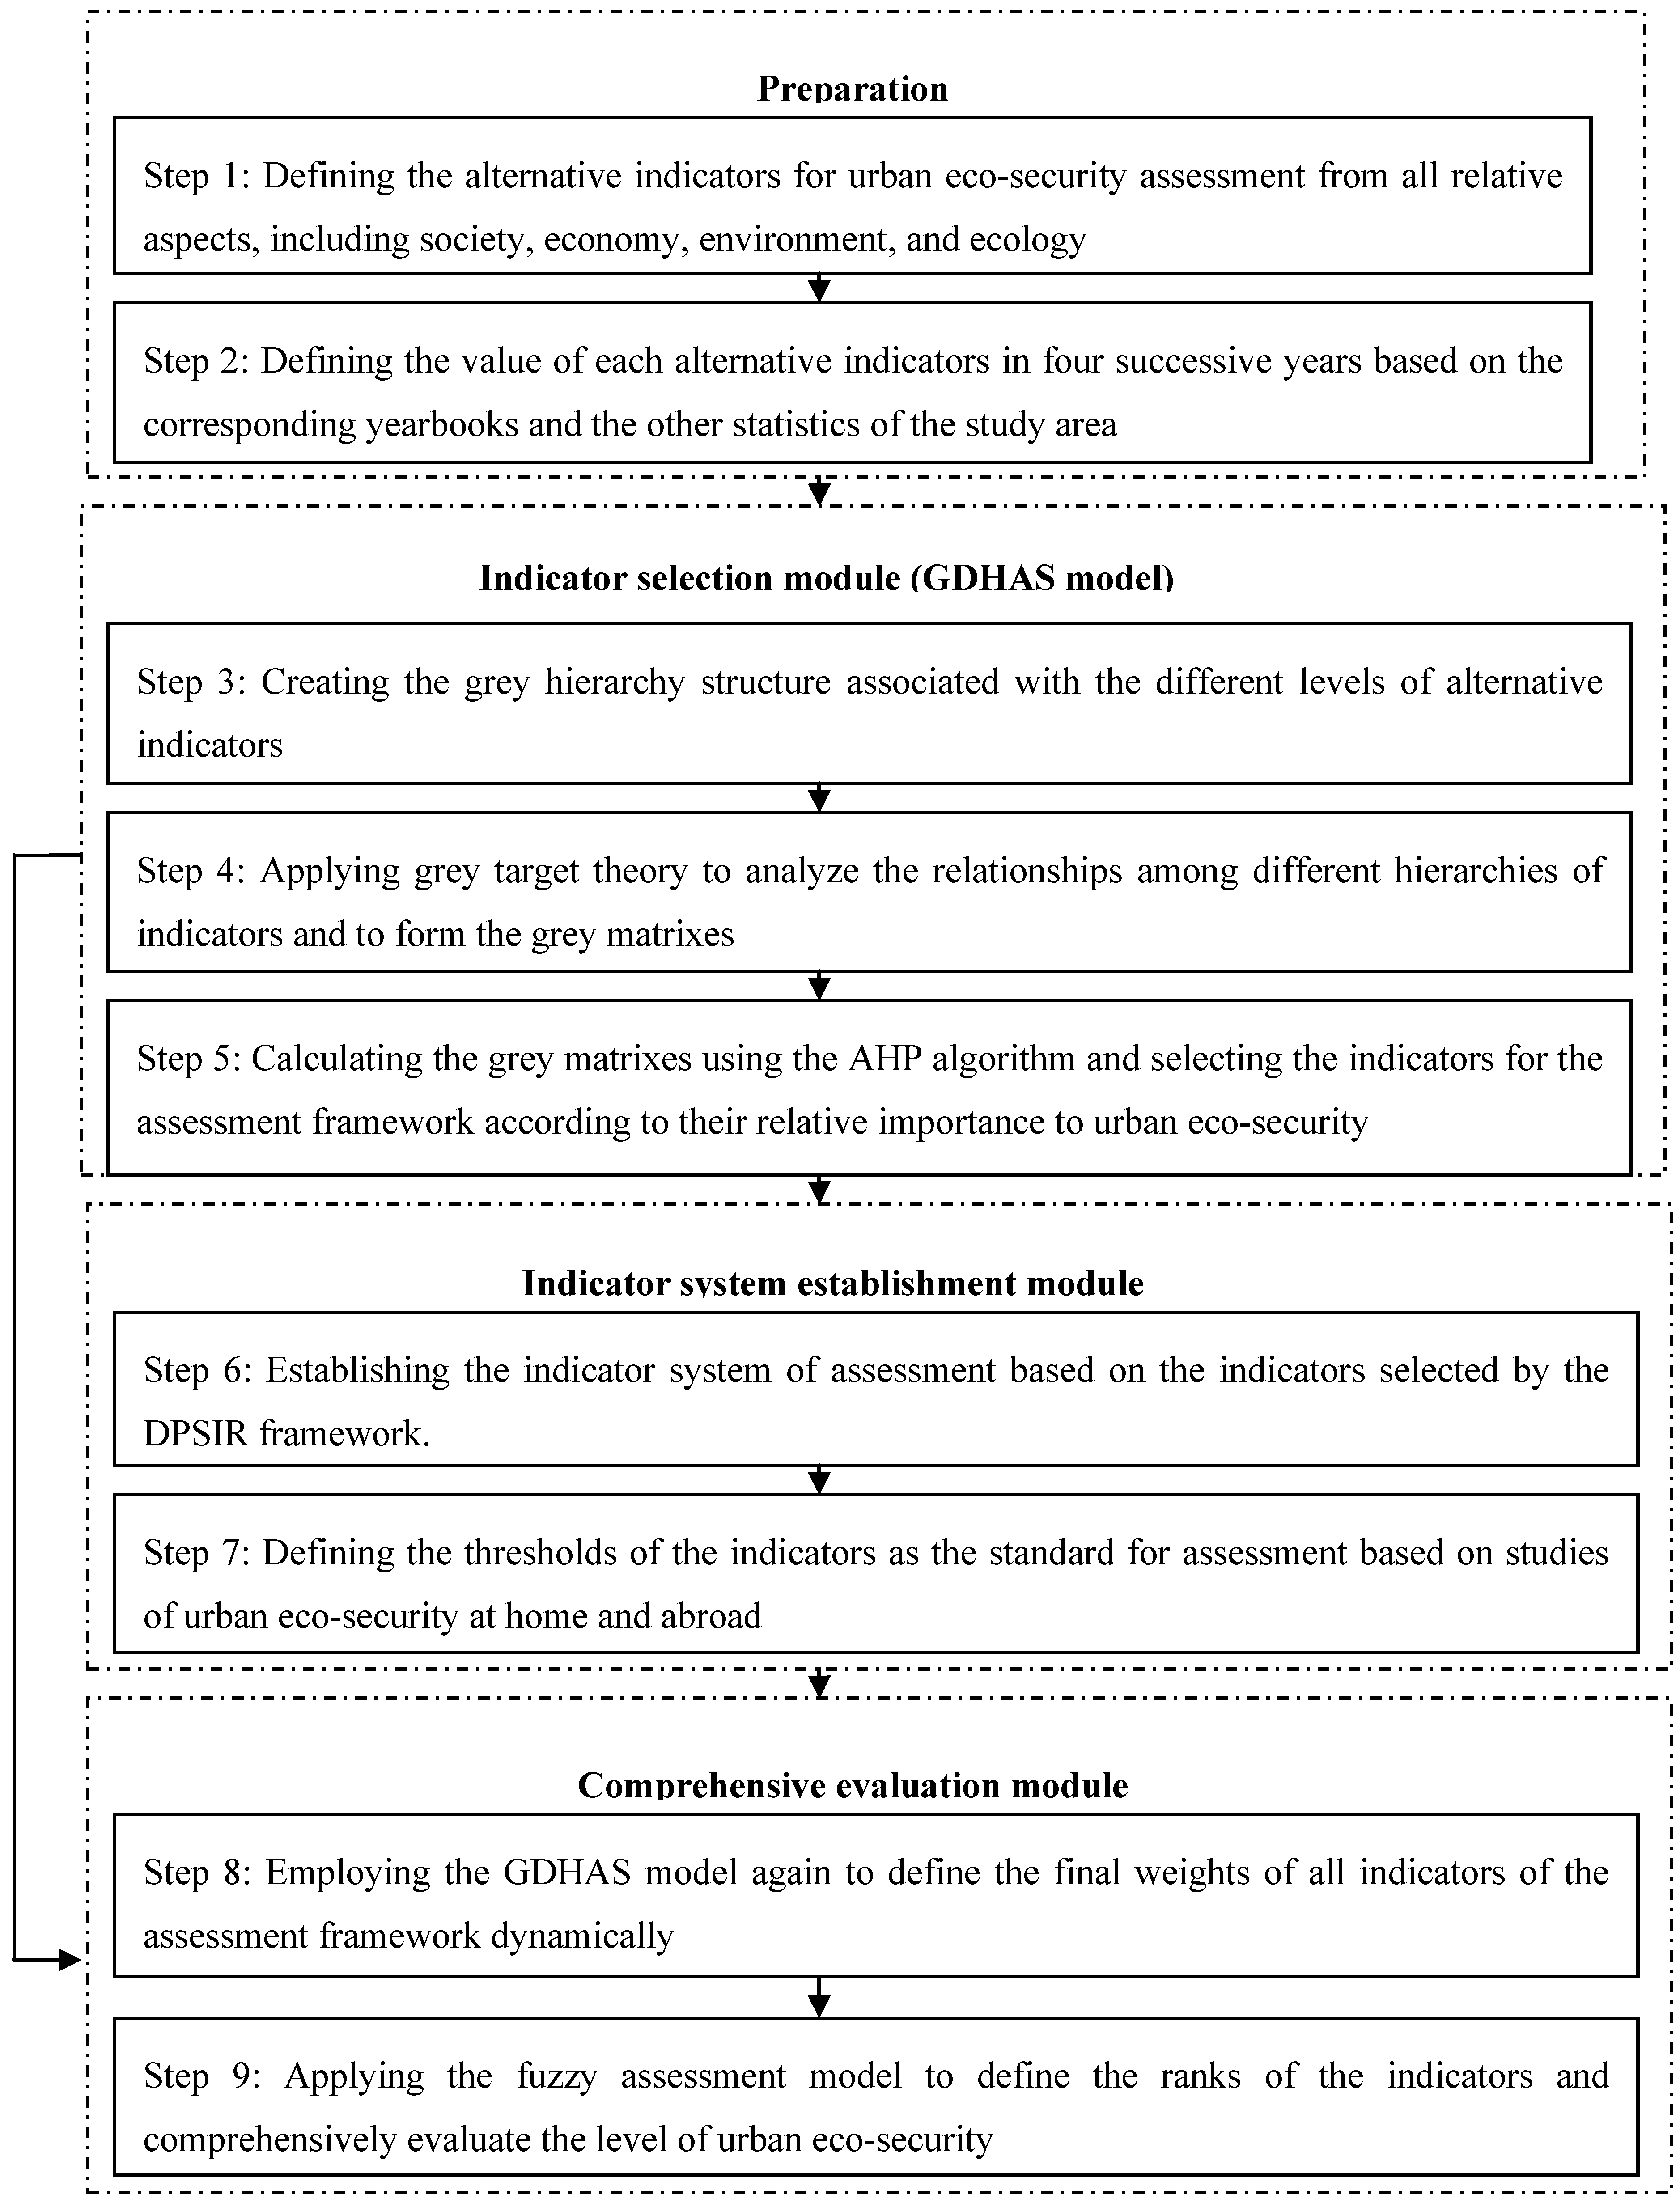
2.2. Structure of the Methodology
2.3. Indicator Selection
2.3.1 Alternative Indicators
| Person and reference | Indicators |
|---|---|
| The World Health Organization:
(1) The Building from Healthy Cities Project proposed 79 healthy urban ecosystem indicators in 1996 [31]. | Internal character |
| External performance | |
| Progress | |
| Management and monitoring | |
| Providing service | |
| Budget and finance | |
| Community service | |
| (2) Takano and Nakamura further developed 459 indicators of a healthy urban ecosystem in 1998 [32]. | Human health |
| Urban infrastructure | |
| Environmental quality | |
| Human housing and living environment | |
| Community’s role and action | |
| Living pattern and prevention performance | |
| Health care and environmental sanitation service | |
| Education | |
| Employment and industry | |
| Income and domestic consumption | |
| Local economic and demographic statistics | |
| (3) Guo et al. used the classic framework from established urban eco-healthy indicators using 24 factors [33]. | Vigor: GDP per capita |
| Organizational structure: the third industry ratio | |
| Resilience: treatment rate of urban domestic sewage | |
| Ecosystem services maintenance: comprehensive | |
| environmental quality index | |
| Population health: mean human life time | |
| (4) Yang et al. established an indicator system within the DPSRC (driving force-pressure-state-response-control) framework [34]. | Environment: environmental quality and solid waste utilization |
| Resource: land, water, and atmosphere resources etc. | |
| Society: population intelligence and average literacy | |
| Economy: public services facilities, science and technology input index | |
| (5) Hu et al. proposed indices to measure the gap between the urban developmental status quo of each factor and certain development objectives [35]. | Distance index |
| Coordination index | |
| (6) Shi et al. developed an indicator system to assess urban eco-security mainly from resources and the eco-environment [36]. | Resources security index |
| Pollution index | |
| Ecology index | |
| (7) Su et al. established a biophysical urban eco-security indicator system using 17 related energy-based indices [37]. | Vigor: energy density |
| Structure: energy diversity index | |
| Resilience: carrying capacity density based on renewable energy | |
| Ecosystem service: environmental loading ratio | |
| Population health: energy investment ratio | |
| (8) Liu et al. (2009) developed an energy-based urban eco-security indicator that integrates vigor, organizational structure, resilience, and function maintenance [38]. | Net energy yield ratio |
| Environmental loading ratio | |
| Energy exchange ratio | |
| Energy density |
2.3.2. Selection Hierarchy System
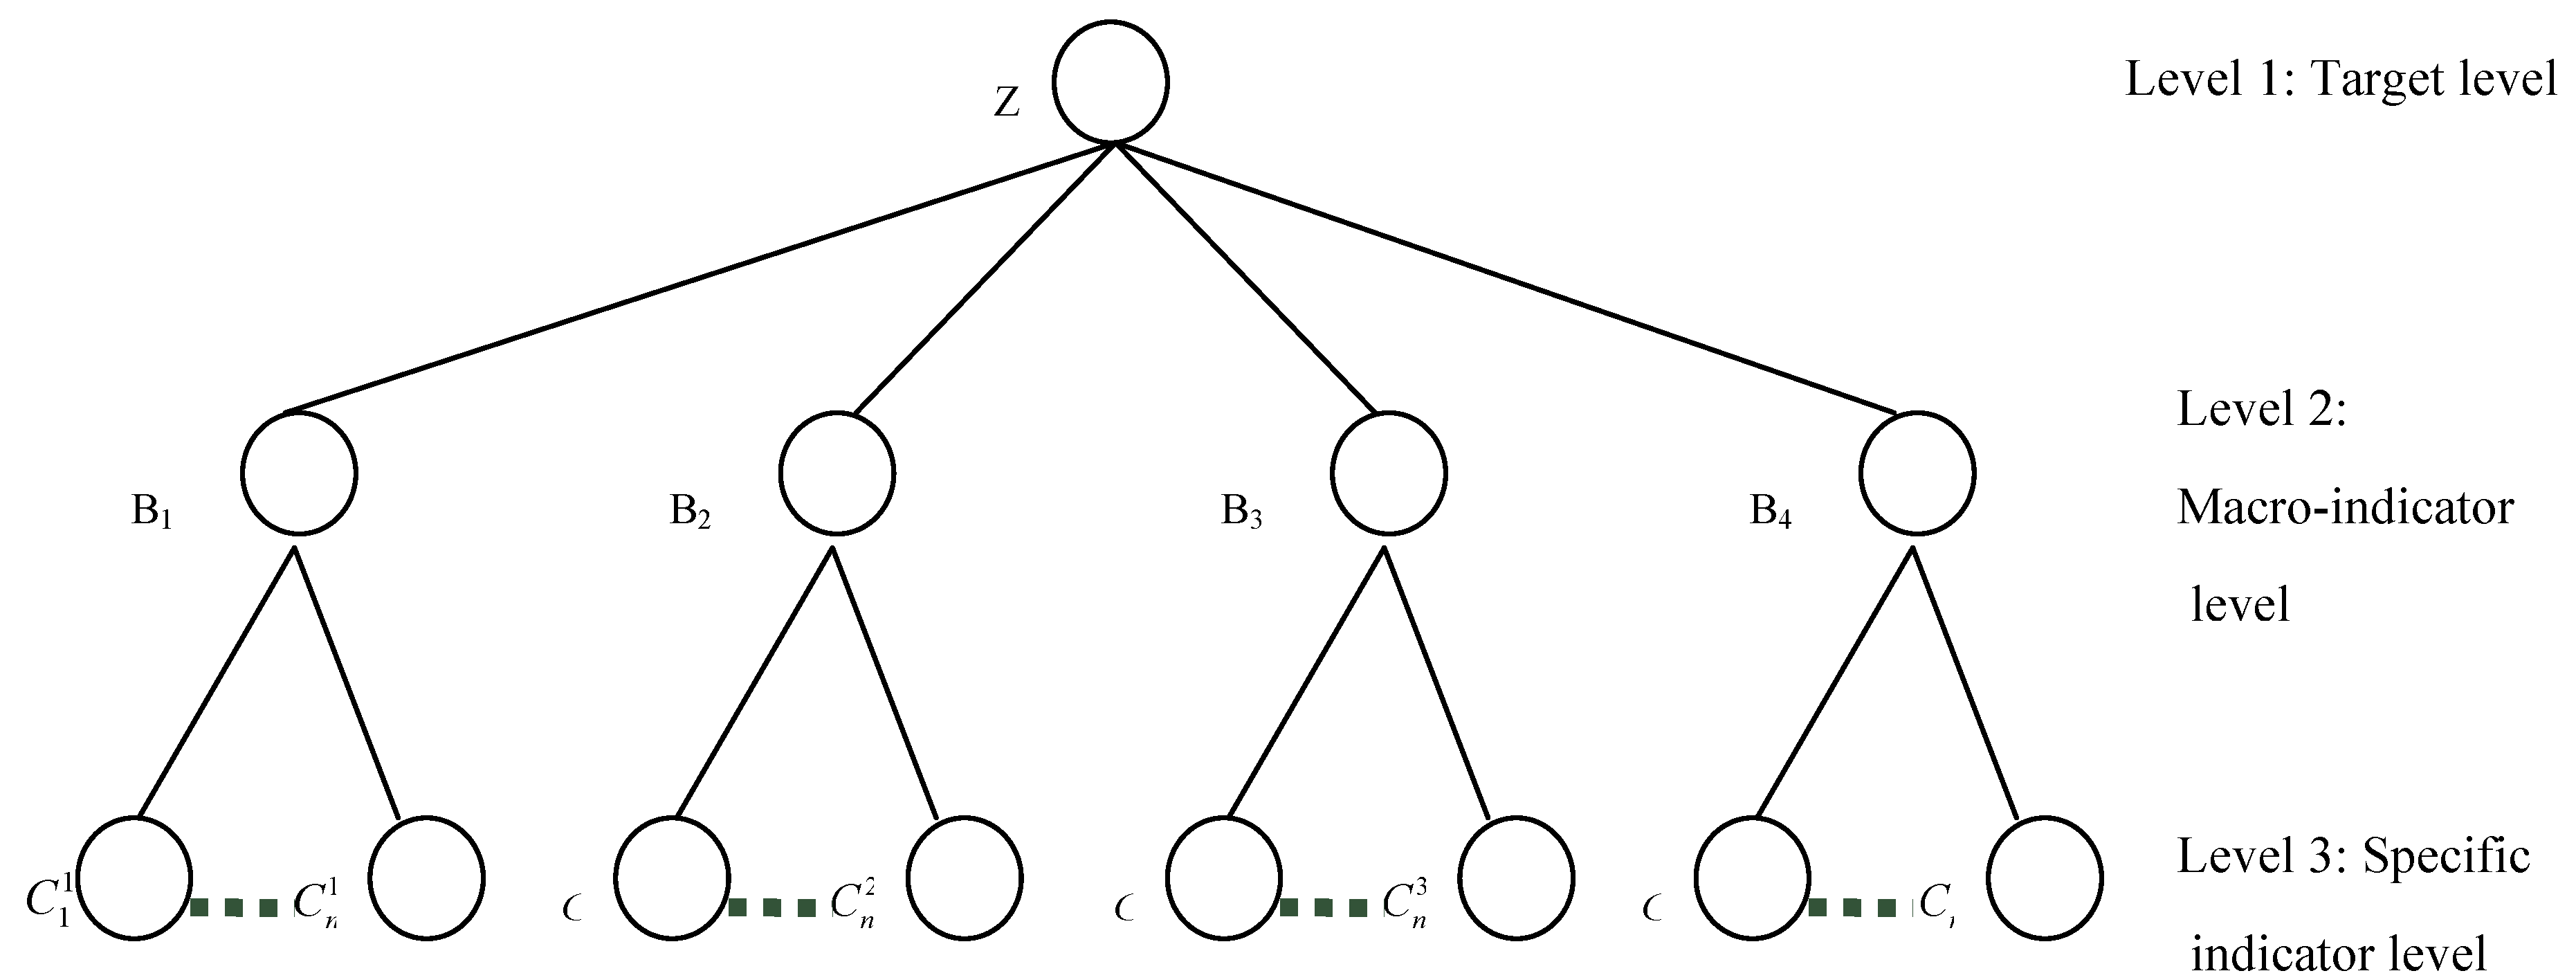
| Indicator type | Indicator explanation |
|---|---|
| macro-indicators (MIs) | driving force |
| pressure | |
| state | |
| impact | |
| response | |
| specific indicators (SIs) | 62 alternative indicators |
2.3.3. Grey Target Theory (GTT) Procedure


 and
and  represent the minimum and maximum distances, respectively, for all MIs in the response sequences, and
  and
and  represent the minimum and maximum distances, respectively, for all SIs in the response sequences. The distinguishing coefficient ζ is defined within the range 0 ≤ ζ ≤ 1. In general, ζ has a value of 0.5 (ζ = 0.5) according to the least information principle [21]. Then, the grey relational grades of the MIs and SIs are derived, respectively, as follows:


2.3.4. Application of the Analytic Hierarchy Process (AHP)


2.4. Construction of the Indicator System
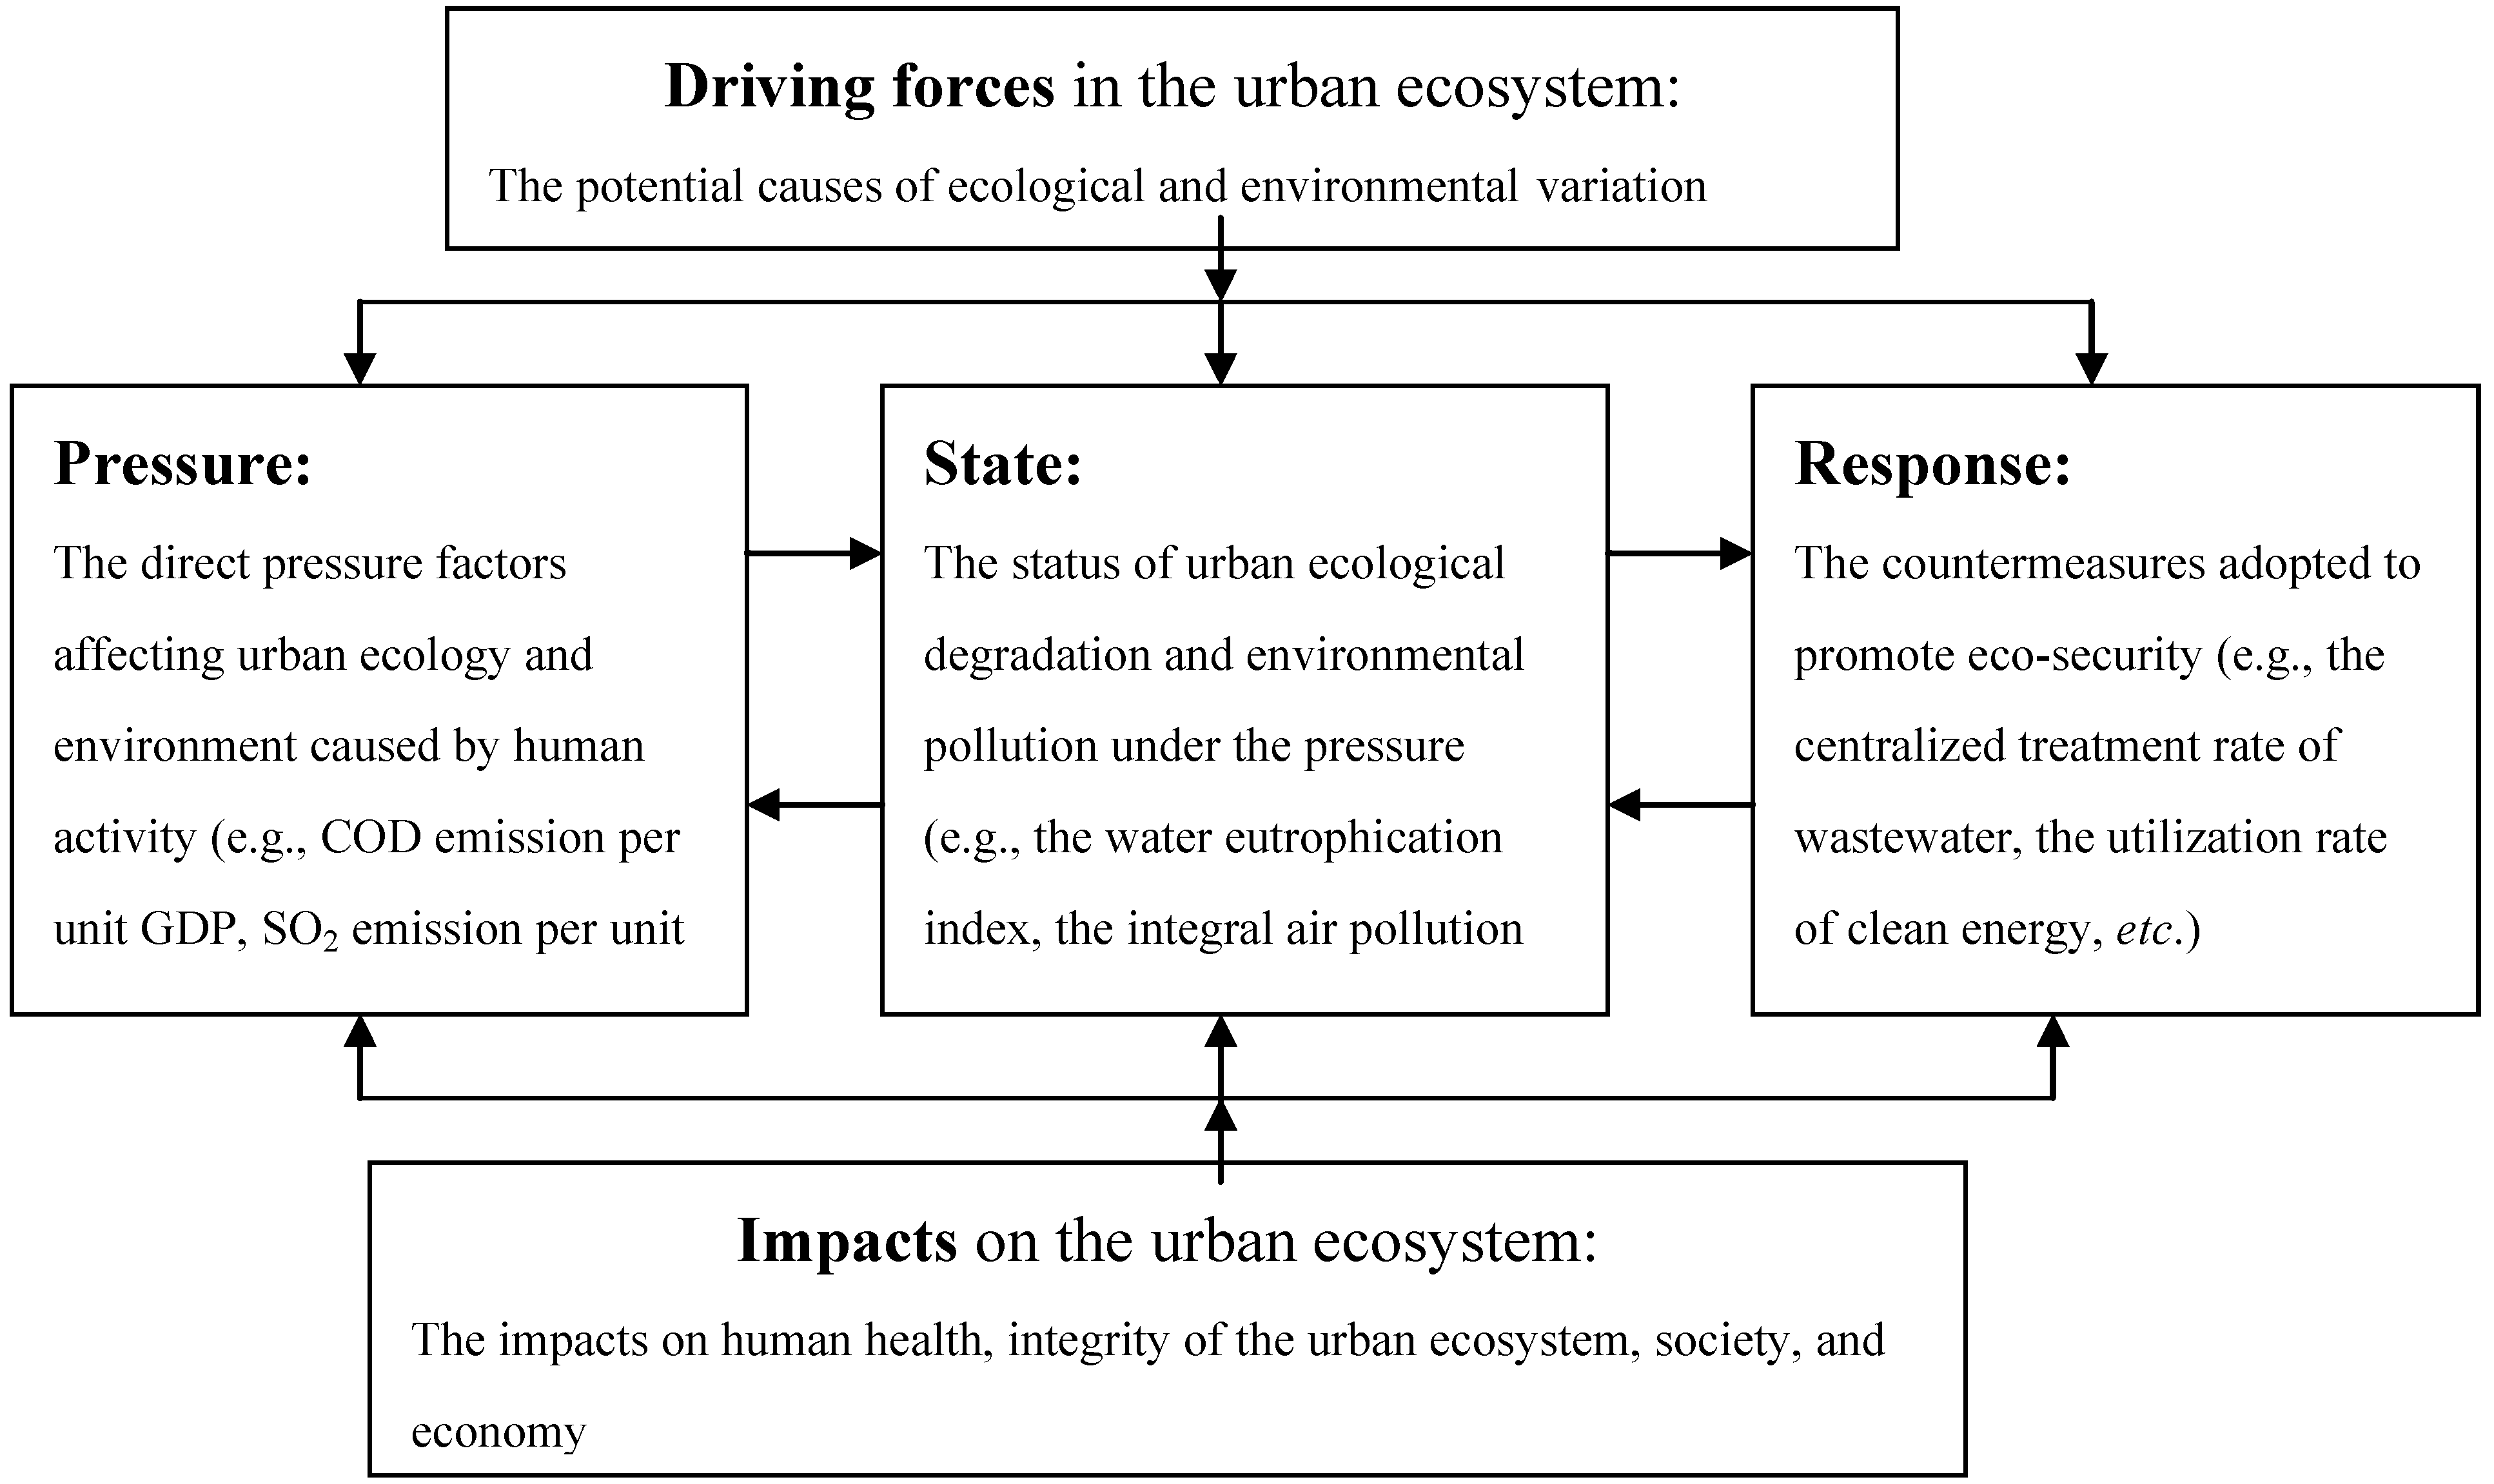
2.4.1. Application of the Driving Force-Pressure-State-Impact-Response (DPSIR) Model
2.4.2. The Thresholds for the Assessment
2.5. Comprehensive Evaluation
2.5.1. Defining the Weights of the Indicators
2.5.2. Application of the Fuzzy Assessment Model


3. Case Study
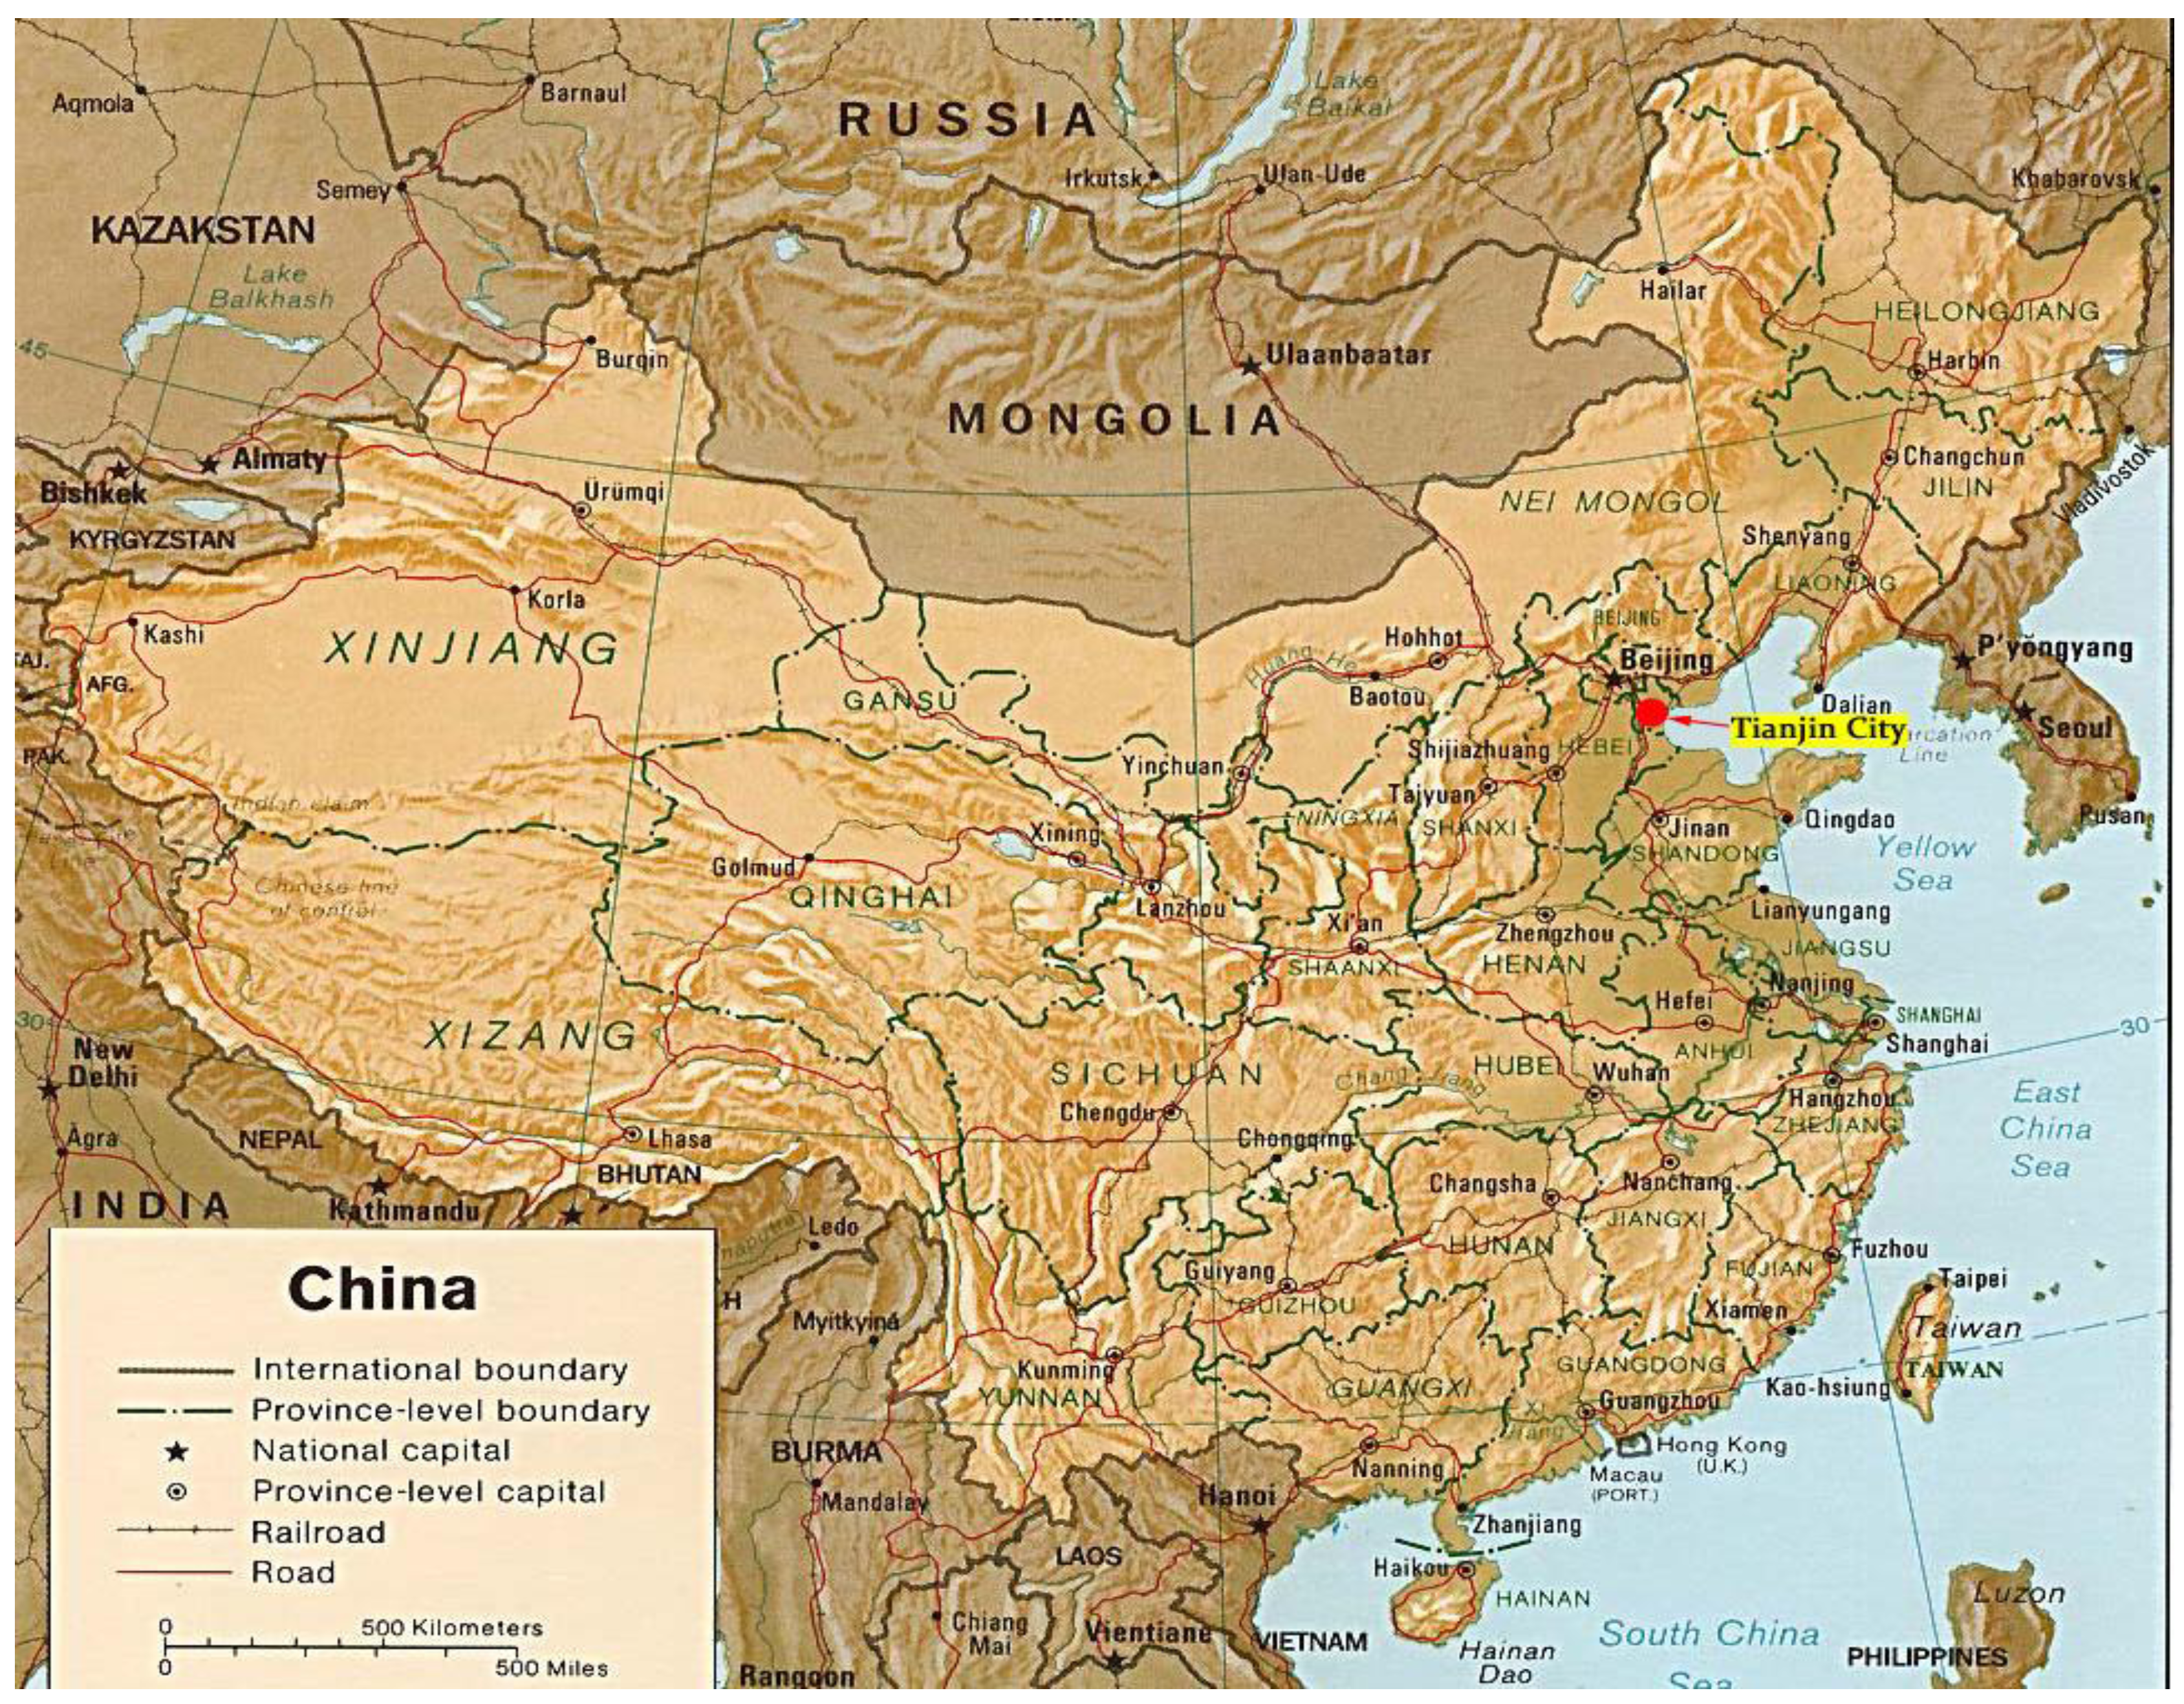
3.1. The Study Area
3.2. Application of the Methodology and Results
| Dimension of the indicator | Indicator name | Unit | Weight for selection | Selection | Source of data | |
|---|---|---|---|---|---|---|
| Economy | GDP per capita | $/person | 0.013768 | Statistical data a | ||
| Per capita annual government revenue | $/person | 0.011788 | Statistical data a | |||
| Per capita disposable income of urban households | $/person | 0.016788 | √ | Statistical data a | ||
| Energy consumption of GDP | tons of SCE/$ | 0.016857 | √ | Statistical data a | ||
| Ratio of clean energy consumption | % | 0.017532 | √ | Statistical data a | ||
| Water consumption of GDP | m3/$ | 0.019197 | √ | Statistical data a | ||
| Fresh water consumption of value-added industry | m3/$ | 0.024145 | √ | Statistical data a | ||
| Coefficient of effective utilization of agriculture irrigation water | - | 0.016132 | √ | Eco-city planning | ||
| Proportion of tertiary industry production to GDP | % | 0.016505 | Statistical data a | |||
| Rate of enterprises in scale certified by ISO-14000 | % | 0.013497 | Statistical data a | |||
| Proportion of actual investment of protecting the environment in projects | % | 0.019258 | √ | Statistical data a | ||
| Household consumption | $/person | 0.012476 | Statistical data a | |||
| Value-added industry per capita | $/person | 0.016321 | √ | Statistical data a | ||
| Ratio of value added to gross industrial output value | % | 0.015204 | Statistical data a | |||
| Energy consumption of value added in industry | tons of SCE/$ | 0.017057 | √ | Statistical data a | ||
| Society | Population density | person/ km2 | 0.016783 | √ | Statistical data a | |
| Natural growth rate | % | 0.013511 | Statistical data a | |||
| Rate of public satisfaction with environment | % | 0.01646 | √ | Eco-city planning c | ||
| urbanization level | % | 0.014823 | Statistical data a | |||
| Popularity rate of central heating | % | 0.016291 | √ | Statistical data a | ||
| Perfectness ratio of lifeline systems in the city | % | 0.01676 | √ | Eco-city planning c | ||
| Percentage of population with access to gas | % | 0.015929 | Statistical data a | |||
| Engel’s coefficient (Urban) | % | 0.016347 | √ | Statistical data a | ||
| Engel’s coefficient (Rural) | % | 0.015804 | Statistical data a | |||
| Percentage of graduates in junior secondary school entering senior secondary school | % | 0.016032 | √ | Statistical data a | ||
| Popularity rate of environmental propaganda and education | % | 0.016281 | √ | Statistical data a | ||
| Number of public transportation vehicles per 10,000 persons | unit/10,000 persons | 0.013470 | Statistical data a | |||
| R&D expenditures as percentage of GDP | % | 0.013579 | Statistical data a | |||
| Ecology | Coverage rate of forest | Mountain | % | 0.013158 | Eco-city planning c | |
| Plain | 0.016929 | √ | Eco-city planning c | |||
| Seaside | 0.017710 | √ | Eco-city planning c | |||
| Proportion of protected area to land area | % | 0.016032 | √ | Eco-city planning c | ||
| Proportion of nature reserve area to land area | km2 | 0.016261 | √ | Eco-city planning c | ||
| Per capita public green areas | m2/person | 0.016599 | √ | Eco-city planning c | ||
| Coverage rate of afforestation in developed areas | % | 0.013419 | Eco-city planning c | |||
| Coverage rate of green areas in developed areas | % | 0.01674 | √ | Eco-city planning c | ||
| Recovery rate of degraded land | % | 0.016846 | √ | Eco-city planning c | ||
| Overdraft rate of groundwater | % | 0.018539 | √ | Eco-city planning c | ||
| Coverage of wetland | % | 0.015894 | √ | Eco-city planning c | ||
| Tourism area quality rate | % | 0.016132 | √ | Eco-city planning c | ||
| Environment | Ambient air quality fine rate | % | 0.014321 | Report of environmental quality b | ||
| Inshore area water quality rate | % | 0.016492 | √ | Report of environmental quality b | ||
| Coverage of noise control districts | % | 0.01453 | Report of environmental quality b | |||
| COD emission of GDP | kg/$ | 0.019699 | √ | Report of environmental quality b | ||
| SO2 emission of GDP | kg/$ | 0.019951 | √ | Report of environmental quality b | ||
| COD emission of value-added industry | Kg/$ | 0.021234 | √ | Report of environmental quality b | ||
| Carbon emission of GDP | kg/$ | 0.016857 | √ | Statistical data a | ||
| Rate of reaching the standard of industrial waste water | % | 0.016149 | √ | Eco-city planning c | ||
| Rate of industrial dust removal | % | 0.014313 | Eco-city planning c | |||
| Urban sewage treatment rate | % | 0.016353 | √ | Eco-city planning c | ||
| Rate of sewage disposal | % | 0.014221 | Statistical data a | |||
| Industrial water recycling rate | % | 0.016616 | √ | Statistical data a | ||
| Innocuous disposal rate of garbage | % | 0.013814 | Eco-city planning c | |||
| Disposal rate of industrial waste residue | % | 0.013643 | Statistical data a | |||
| Rate of comprehensive usage of industrial waste residue | % | 0.015072 | Eco-city planning c | |||
| Urban drinking water sources quality rate | % | 0.016132 | √ | Report of environmental quality b | ||
| Drinking water quality rate | % | 0.016132 | √ | Report of environmental quality b | ||
| Comprehensive index of air environmental quality | / | 0.019538 | √ | Report of environmental quality b | ||
| Final consumption of energy | ton SCE | 0.016585 | √ | Statistical data a | ||
| Qualified rate of executing “Three Meaning” | % | 0.014132 | Statistical data a | |||
| Collection of discharge fee | $ | 0.014657 | Statistical data a | |||
| Proportion of environmental protection investment to GDP | % | 0.016705 | √ | Statistical data a | ||
| Dimension of the indicator | Macro-indicators | Indicator name | Specific indicators | The thresholds of urban ecological security | |||
|---|---|---|---|---|---|---|---|
| The weight of systems | The ecological security scores for 2008 | The weight of indicators | The eco-security scores in 2008 | ||||
| Unsafe | Safe | ||||||
| Driving force | 0.1989 | 0.1764 | Per capita disposable income of urban households | 0.2254 | 0.2254 | 5,000 | 18,000 |
| Proportion of actual investment of protecting the environment in projects | 0.3155 | 0.3155 | 3 | 8 | |||
| Percentage of graduates in junior secondary schools entering senior secondary school | 0.2511 | 0.2511 | 70 | 90 | |||
| Value added of industry per capita | 0.2178 | 0.1002 | 12 | 50 | |||
| Pressure | 0.2304 | 0.1717 | Energy consumption of GDP | 0.0788 | 0.0538 | 1.5 | 0.6 |
| Water consumption of GDP | 0.0788 | 0.1012 | 150 | 50 | |||
| Ratio of clean energy consumption | 0.0894 | 0.0833 | 20 | 30 | |||
| Fresh water consumption of value added in industry | 0.1305 | 0.11223 | 30 | 9 | |||
| Energy consumption of value added in industry | 0.0894 | 0.0384 | 1.8 | 0.4 | |||
| Population density | 0.0743 | 0.0639 | 2000 | 500 | |||
| Overdraft rate of groundwater | 0.0875 | 0.0585 | 4 | 1.5 | |||
| COD emission of GDP | 0.0841 | 0.0895 | 6 | 1.5 | |||
| SO2 emission of GDP | 0.0955 | 0.0654 | 7 | 1 | |||
| COD emission of value added of industry | 0.1129 | 0.1129 | 10 | 5 | |||
| Carbon emission of GDP | 0.0788 | 0.0538 | 3,750 | 1,500 | |||
| State | 0.1877 | 0.1135 | Coverage rate of forest (mountain) | 0.1044 | 0.0448 | 18 | 25 |
| Coverage rate of forest (seaside) | 0.1022 | 0.0511 | 7 | 10 | |||
| Proportion of protected area to land area | 0.1144 | 0 | 17 | 25 | |||
| Proportion of nature reserve area to land area | 0.1141 | 0.0955 | 4 | 15 | |||
| Coverage rate of green areas in developed areas | 0.1029 | 0.0751 | 10 | 40 | |||
| Coverage of wetland | 0.1131 | 0.1074 | 8 | 15 | |||
| Tourism area quality rate | 0.1150 | 0.1155 | 80 | 90 | |||
| Inshore area water quality rate | 0.1158 | 0 | 80 | 90 | |||
| Urban drinking water sources quality rate | 0.1155 | 0.1155 | 80 | 95 | |||
| Impact | 0.1900 | 0.0630 | Rate of public satisfaction with environment | 0.1640 | 0.1640 | 80 | 90 |
| Per capita public green areas | 0.1571 | 0.04870 | 5 | 18 | |||
| Comprehensive index of air quality | 0.2017 | 0.2017 | 1.5 | 1 | |||
| Final consumption of energy | 0.1446 | 0.06940 | 5,500 | 4,800 | |||
| Engel’s coefficient (urban) | 0.1622 | 0.1622 | 40 | 60 | |||
| Drinking water quality rate | 0.1690 | 0.1690 | 80 | 95 | |||
| Response | 0.1930 | 0.0712 | Coefficient of effective utilization of agriculture irrigation water | 0.1128 | 0.0221 | 0.3 | 0.6 |
| Popularity rate of central heating | 0.1109 | 0.0743 | 65 | 95 | |||
| Perfectness ratio of lifeline systems in the city | 0.1095 | 0.0361 | 80 | 95 | |||
| Popularity rate of environmental propaganda and education | 0.1126 | 0.1126 | 60 | 90 | |||
| Recovery rate of degraded land | 0.1104 | 0.0662 | 75 | 90 | |||
| Rate of reaching the standard of industrial waste water | 0.1135 | 0.1135 | 80 | 95 | |||
| Urban sewage treatment rate | 0.1058 | 0.1058 | 60 | 80 | |||
| Industrial water recycling rate | 0.1084 | 0.1084 | 50 | 80 | |||
| Proportion of environmental protection investment to GDP | 0.1158 | 0 | 1.5 | 3.5 | |||
3.3. Discussion
3.3.1. Comprehensive Assessment
| Ecological security rank | I | II | III | IV | V |
|---|---|---|---|---|---|
| Explanation | Unsafe | Critical | Safe | ||
| High risk | Low risk | Alert level | Low safety | High safety | |
| Range of scores | 0–0.2 | 0.2–0.4 | 0.4–0.6 | 0.6–0.8 | 0.8–1 |
3.3.2. Key Factors
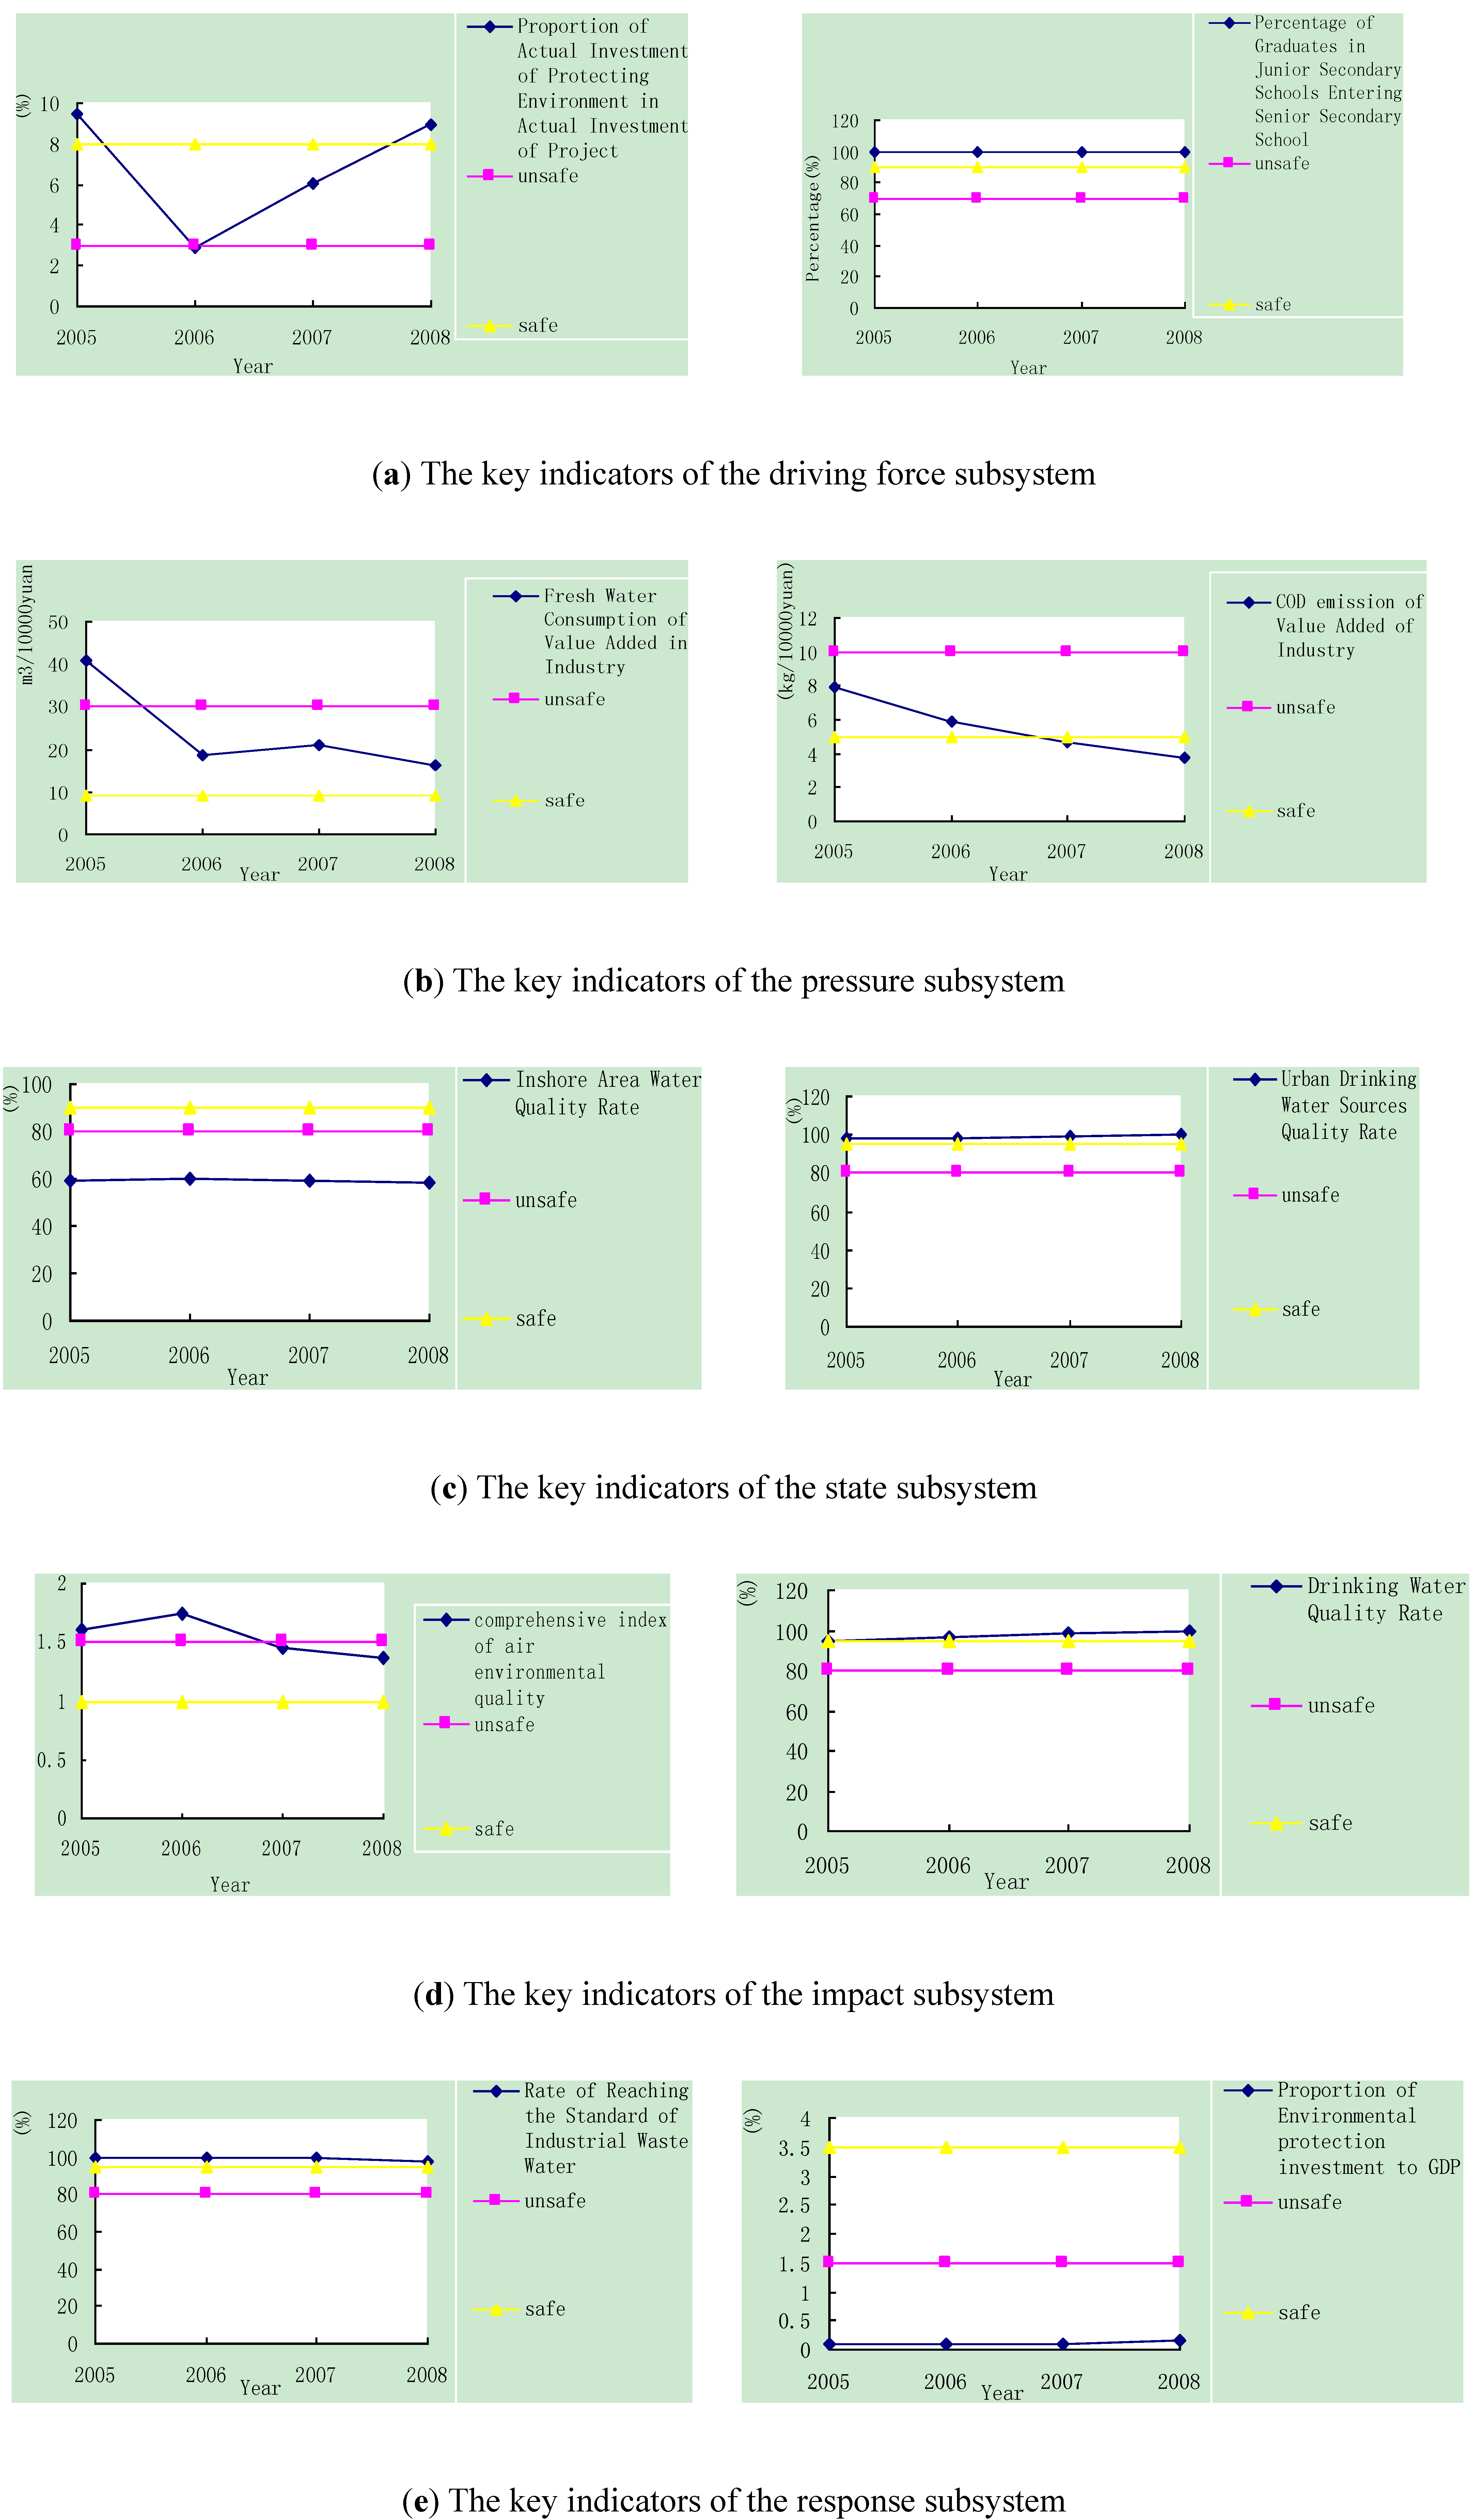
4. Conclusions
Acknowledgements
References
- Gong, J.; Liu, Y.; Xia, B.; Zhao, G. Urban ecological security assessment and forecasting, based on a cellular automata model: A case study of Guangzhou, China. Ecol. Model. 2009, 220, 3612–3620. [Google Scholar] [CrossRef]
- Ezeonu, I.C.; Ezeonu, F.C. The environment and global security. Environmentalist 2000, 20, 41–48. [Google Scholar] [CrossRef]
- Carr, E.R. Human ecological security in coastal Ghana, West Africa: the social implications of economic and environmental change in development contexts. Ph.D. Thesis, University of Kentucky, Lexington, KY, USA, 2002. [Google Scholar]
- Huang, S. Urban ecosystems, energetic hierarchies, and ecological economics of Taipei metropolis. J. Environ. Manag. 1998, 52, 39–51. [Google Scholar] [CrossRef]
- Huang, Q.; Wang, R.; Ren, Z.; Li, J.; Zhang, H. Regional ecological security assessment based on long periods of ecological footprint analysis. Resour. Conserv. Recy. 2007, 51, 24–41. [Google Scholar] [CrossRef]
- Su, M.; Yang, Z.; Chen, B.; Ulgiati, S. Urban ecosystem health assessment based on emergy and set pair analysis—A comparative study of typical Chinese cities. Ecol. Model. 2009, 220, 2341–2348. [Google Scholar] [CrossRef]
- Sun, X.; Zhu, X.; Li, Y. Landscape ecological security assessment in rapidly urbanizing bay—Area: A case study of Xiamen City, China. Acta. Ecol. Sin. 2008, 28, 3563–3573, in Chinese. [Google Scholar]
- Styers, D.M.; Chappelka, A.H.; Marzen, L.J.; Somers, G.L. Scale matters: Indicators of ecological health along the urban-rural interface near Columbus, Georgia. Eco Indic. 2010, 10, 224–233. [Google Scholar] [CrossRef]
- Tzoulas, K.; Korpela, K.; Venn, S.; Yli-Pelkonen, V.; Kaizmierczak, A.; Niemela, J.; James, P. Promoting ecosystem and human health in urban areas using green infrastructure: A literature review. Landscape Urban. Plan. 2007, 81, 167–178. [Google Scholar] [CrossRef]
- Rapport, D.J.; Friend, A.M. Towards a Comprehensive Framework for Environmental Statistics: A Stress-Response Approach; Statistics Canada: Ottawa, Canada, 1979; p. 90. [Google Scholar]
- Yannis, A.P.; Luc, A.A. Sustainability: An ill-defined concept and its assessment using fuzzy logic. Eco Econ. 2001, 37, 435–456. [Google Scholar] [CrossRef]
- Langmead, O.; McQuatters-Gollop, A.; Mee, L.D.; Friedrichd, J.; Gilberte, A.J.; Gomoiu, M.; Gomoiu, M.T.; Jackson, E.L.; Knudsen, S.; Minicheva, G.; Todorova, V. Recovery or decline of the northwestern Black Sea: A societal choice revealed by socio-ecological modeling. Ecol. Model. 2009, 220, 2927–2939. [Google Scholar] [CrossRef]
- Hughey, K.F.; Cullen, R.; Kerr, G.N.; Cook, A.J. Application of the pressure-state-response framework to perceptions reporting of the state of the New Zealand environment. J. Environ. Manag. 2004, 70, 85–93. [Google Scholar] [CrossRef]
- Ferreira, J.F.; Bricker, S.B.; Simas, T.C. Application and sensitivity testing of a eutrophication assessment method on coastal systems in the United States and European Union. J. Environ. Manag. 2007, 82, 433–445. [Google Scholar] [CrossRef]
- Yang, J.; Li, X.; Zhang, Y. Assessment on urban ecological security spatial differences based on causal network: A case of Dalian City. Acta Ecol. Sin. 2008, 28, 2774–2783, in Chinese. [Google Scholar]
- Wu, K.; Jin, J.; Wang, L. Assessment of regional ecological security using back propagation natural network method. Resour. Environ. Yangtze Basin 2008, 17, 317–322. [Google Scholar]
- Yan, W.; Yuan, X.; Xing, Z. Urban ecosystem health assessment based on attribute theory: A case study in the New District of Northern Chongqing City. Chin. J. Eco 2007, 26, 1679–1684, in Chinese. [Google Scholar]
- Wen, X.; Xiong, Y. Assessment on urban ecosystem health based on attribute theory. Syst. Eng. 2008, 26, 42–46, in Chinese. [Google Scholar]
- Chen, P. Ecological health assessment at the landscape scale based on RS and GIS, a case study from the New District of a Bay-type city. Acta Sci. Circumst. 2007, 27, 1744–1752. [Google Scholar]
- Saaty, T.L. A scaling method for priorities in hierarchical structures. J. Math. Psychol. 1977, 15, 234–281. [Google Scholar] [CrossRef]
- Deng, J.L. Base of Grey Theory; Huazhong University of Science and Technology Press: Wuhan, China, 2002; pp. 32–49. [Google Scholar]
- Nasiri, F.; Huang, G. A fuzzy decision aid model for environmental performance assessment in waste recycling. Environ. Modell. Softw. 2008, 23, 677–689. [Google Scholar] [CrossRef]
- Gong, J.; Xia, B; Chen, J. Spatially fuzzy assessment of regional eco-security in Guangzhou, a fast urbanizing area: A case study in Guangzhou City. Acta Ecol. Sin. 2008, 28, 4992–5001, in Chinese. [Google Scholar]
- Bobillo, F.; Delgado, M.; Gómez-Romero, J.; López, E. A semantic fuzzy expert system for a fuzzy balanced scorecard. Expert Syst. Appl. 2009, 36, 423–433. [Google Scholar]
- Petrosillo, I.; Muller, F.; Jones, K.B.; Zurlini, G..; Krauze, K.; Victorov, S.; Li, B.L.; Kepner, W.G. Use of Landscape Sciences for the Assessment of Environmental Security; Springer: Dordrecht, The Netherlands, 2007; pp. 1–17. [Google Scholar]
- Liao, C.; Li, L.; Yan, Z.; Hu, B. Ecological security evaluation of sustainable agricultural development in Karst Mountainous area—A case study of Du’ an Yao Autonomous county in Guangxi. Chinese Geogr. Sci. 2004, 14, 142–147, in Chinese. [Google Scholar] [CrossRef]
- Su, M.; Brian, D.F.; Yang, Z. Urban ecosystem health assessment: A review. Sci. Total Environ. 2010, 408, 2425–2434. [Google Scholar] [CrossRef]
- Zeng, Y.; Shen, G.; Guang, S.; Wang, M. Assessment of urban ecosystem health in Shanghai. Resour. Environ. Yangtze Basin 2005, 14, 208–212, in Chinese. [Google Scholar]
- Sun, Y.; Yao, L.; Sun, Z. Multi-layer grey comprehensive evaluation on urban eco-security. CSSJ 2008, 18, 143–149, in Chinese. [Google Scholar]
- Su, M.; Yang, Z.; Chen, B. Relative urban ecosystem health assessment: A method integrating comprehensive evaluation and detailed analysis. Ecohealth 2010, 7, 459–472. [Google Scholar] [CrossRef]
- Regional Guidelines for Developing a Healthy Cities Project; Western Pacific Region Office: Manila, The Philippines, 2000.
- Nakamura, K. Healthy Cities and Urban Policy Research; Routledge: London, UK, 2003; p. 76. [Google Scholar]
- Guo, X.R.; Yang, J.R.; Mao, X.Q. Primary studies on urban ecosystem health assessment. China Environ. Sci. 2002, 22, 525–529, in Chinese. [Google Scholar]
- Yang, J.; Li, X.M.; Zhang, Y. Assessment on urban ecological security spatial differences based on causal network: A case of Dalian City. Acta Ecol. Sin. 2008, 28, 2774–2783, in Chinese. [Google Scholar]
- Hu, T.L.; Yang, Z.F.; He, M.C.; Zhao, Y.W. An urban ecosystem health assessment method and its application. Acta Sci. Circumst. 2005, 25, 269–274, in Chinese. [Google Scholar]
- Shi, X.Q.; Ouyang, Z.Y. Urban eco-security and its dynamic assessment method. Acta Ecol. Sin. 2005, 25, 3237–3243, in Chinese. [Google Scholar]
- Su, M.R.; Brian, D.F.; Yang, Z.F. Urban ecosystem health assessment: A review. Sci. Total Environ. 2010, 408, 2425–2434. [Google Scholar]
- Liu, G.Y.; Yang, Z.F. Emergy-based urban ecosystem health assessment: A case study of Baotou, China. Sci. Total Environ. 2009, 14, 972–981, in Chinese. [Google Scholar]
- Vargas, L.G. Reciprocal matrices with random coefficients. Math. Model. 1982, 3, 69–81. [Google Scholar]
- Zhao, Y.; Zou, X.; Cheng, H.; Jia, H.; Wu, G.; Wang, G.; Zhang, C.L.; Gao, S.Y. Assessing the ecological security of the Tibetan plateau: Methodology and a case study for Lhaze County. J. Environ. Manag. 2006, 80, 120–131. [Google Scholar] [CrossRef]
© 2013 by the authors; licensee MDPI, Basel, Switzerland. This article is an open access article distributed under the terms and conditions of the Creative Commons Attribution license (http://creativecommons.org/licenses/by/3.0/).
Share and Cite
Shao, C.; Tian, X.; Guan, Y.; Ju, M.; Xie, Q. Development and Application of a New Grey Dynamic Hierarchy Analysis System (GDHAS) for Evaluating Urban Ecological Security. Int. J. Environ. Res. Public Health 2013, 10, 2084-2108. https://doi.org/10.3390/ijerph10052084
Shao C, Tian X, Guan Y, Ju M, Xie Q. Development and Application of a New Grey Dynamic Hierarchy Analysis System (GDHAS) for Evaluating Urban Ecological Security. International Journal of Environmental Research and Public Health. 2013; 10(5):2084-2108. https://doi.org/10.3390/ijerph10052084
Chicago/Turabian StyleShao, Chaofeng, Xiaogang Tian, Yang Guan, Meiting Ju, and Qiang Xie. 2013. "Development and Application of a New Grey Dynamic Hierarchy Analysis System (GDHAS) for Evaluating Urban Ecological Security" International Journal of Environmental Research and Public Health 10, no. 5: 2084-2108. https://doi.org/10.3390/ijerph10052084
APA StyleShao, C., Tian, X., Guan, Y., Ju, M., & Xie, Q. (2013). Development and Application of a New Grey Dynamic Hierarchy Analysis System (GDHAS) for Evaluating Urban Ecological Security. International Journal of Environmental Research and Public Health, 10(5), 2084-2108. https://doi.org/10.3390/ijerph10052084


