Identification and Assessment of Potential Water Quality Impact Factors for Drinking-Water Reservoirs


Abstract
:1. Introduction
2. Materials and Methods
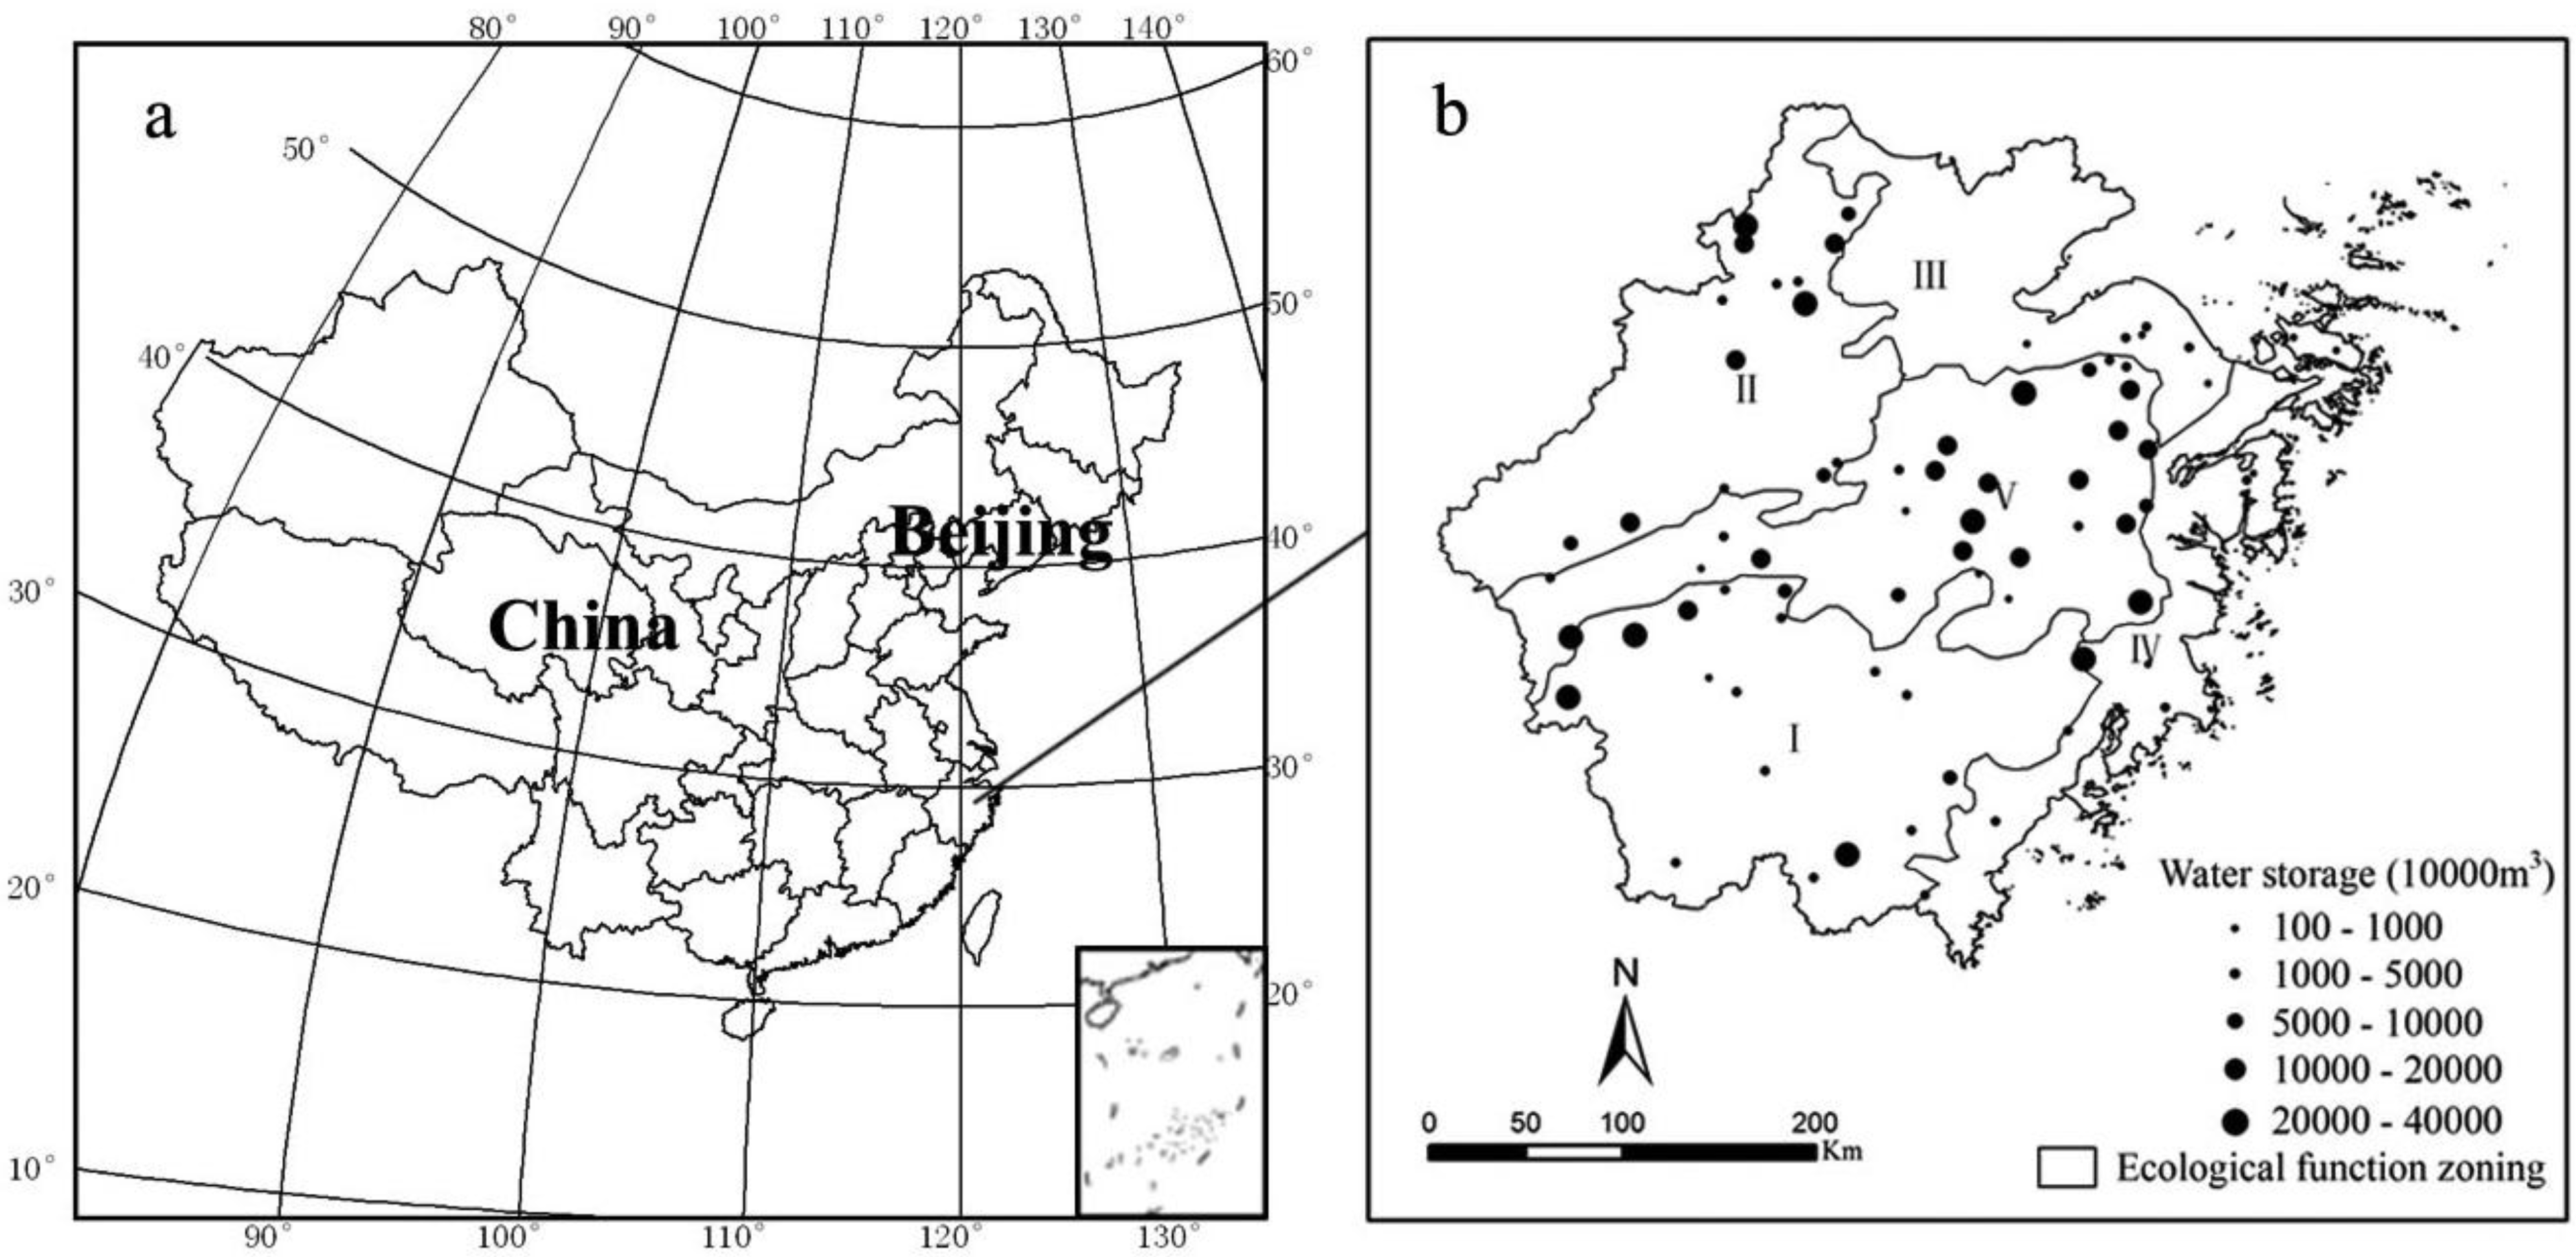
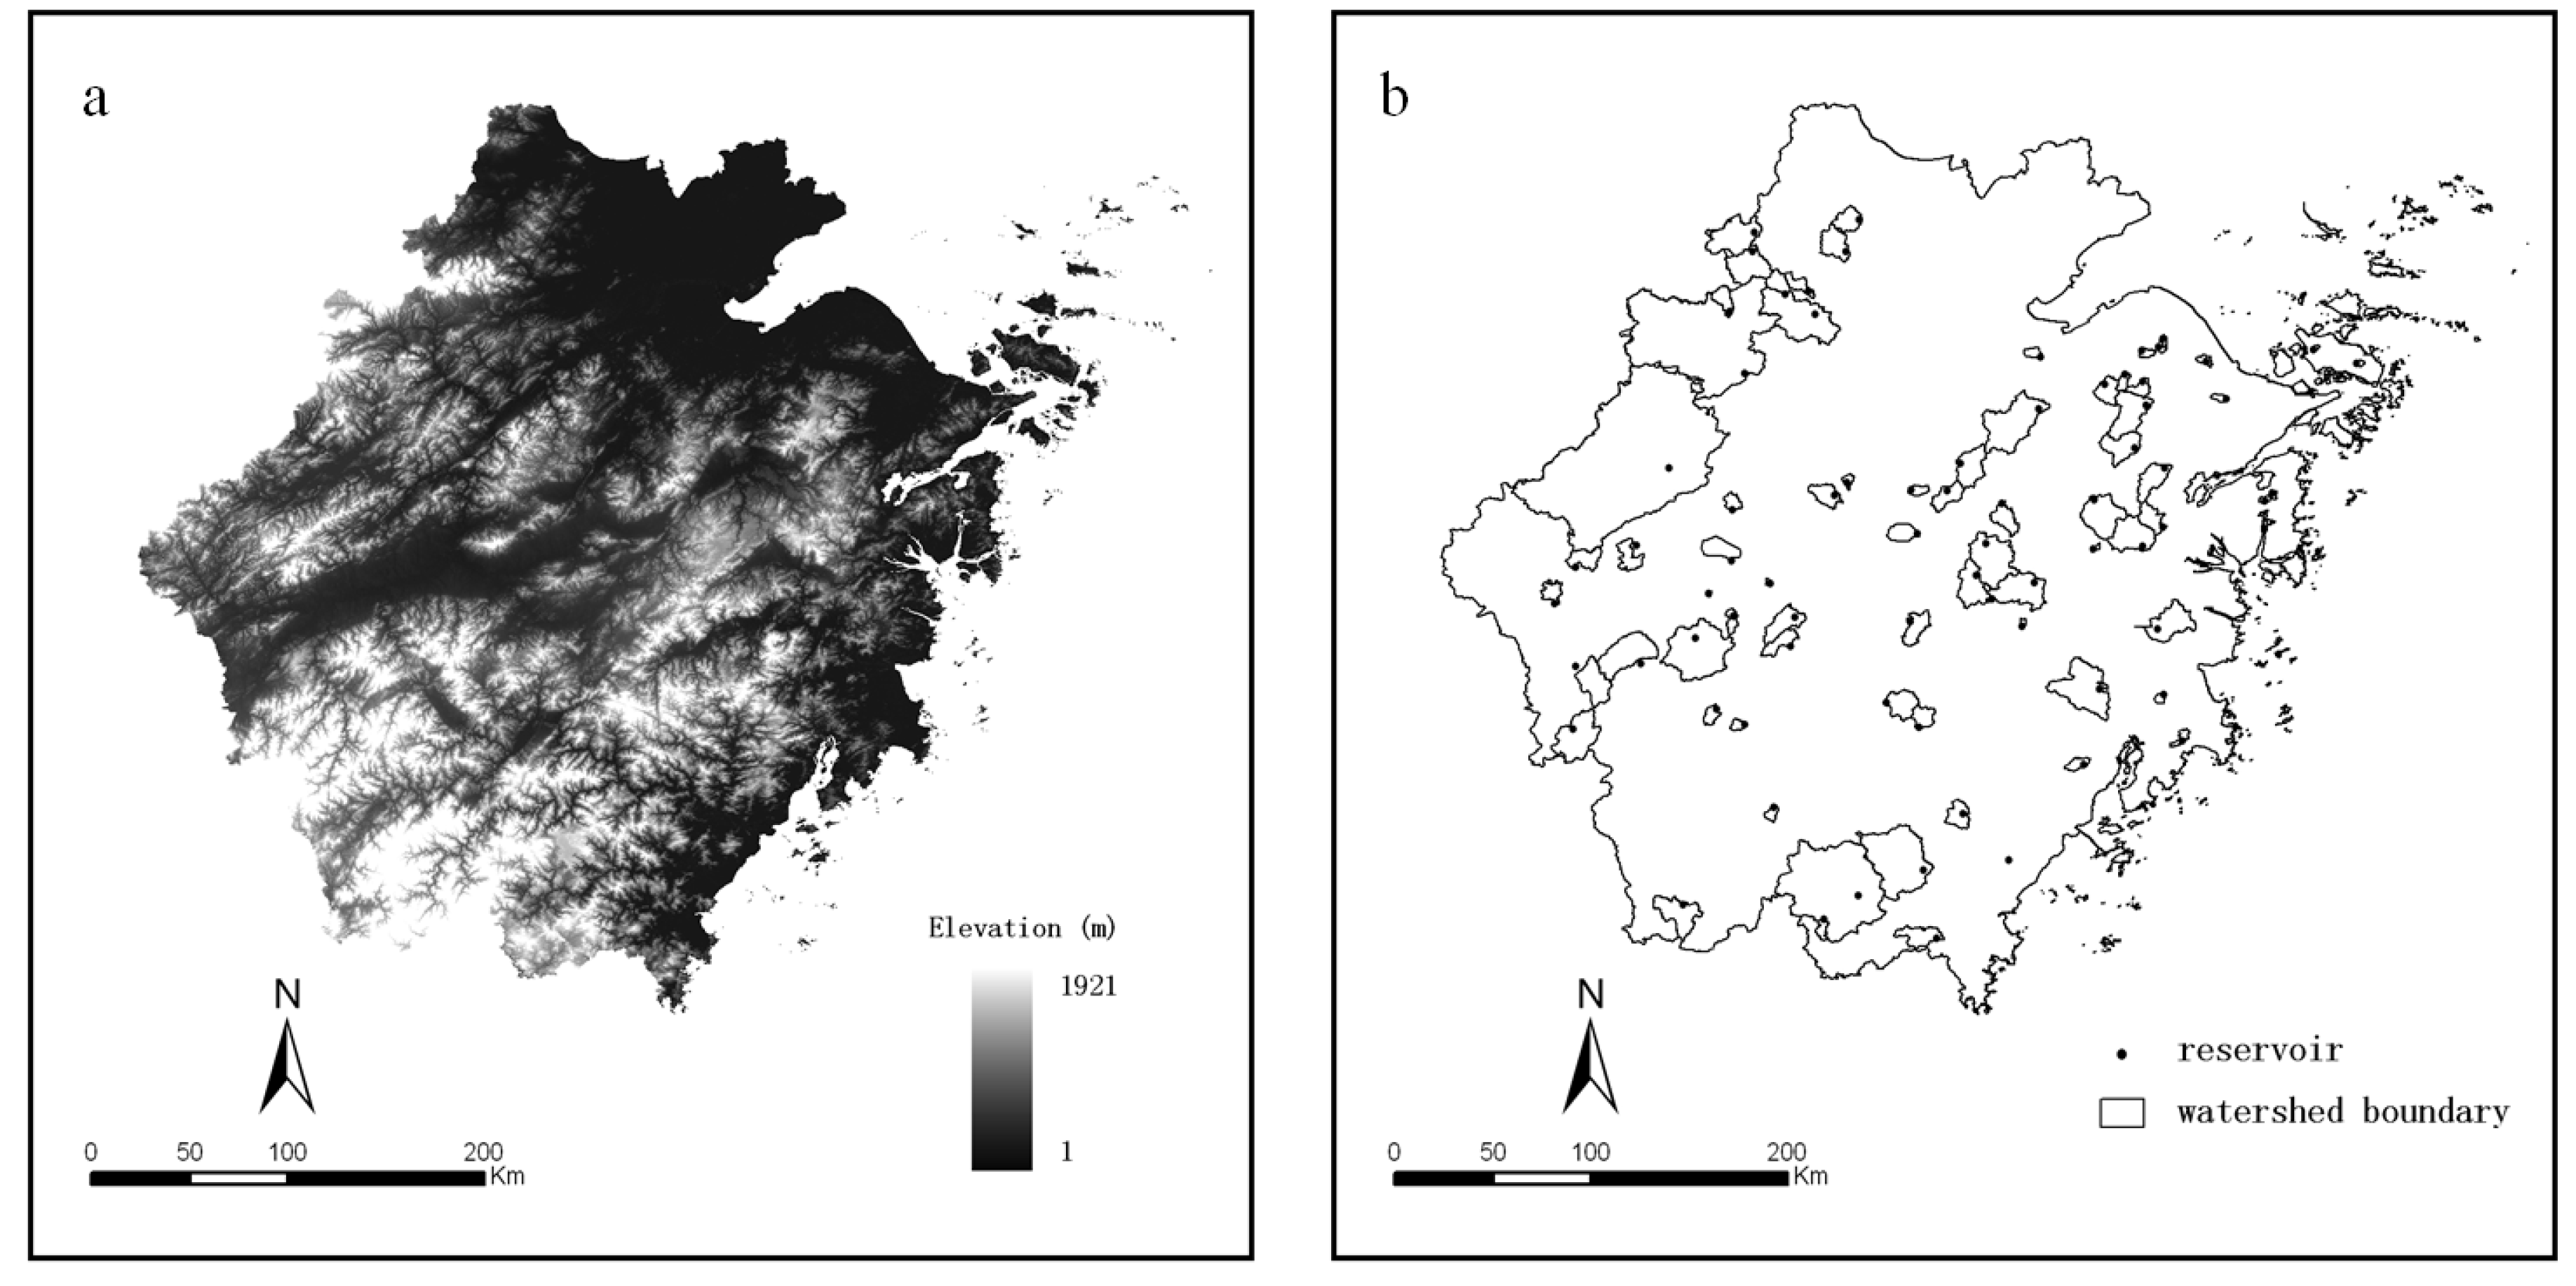
2.1. Study Area

2.2. Data

2.3. CART Decision Tree Model
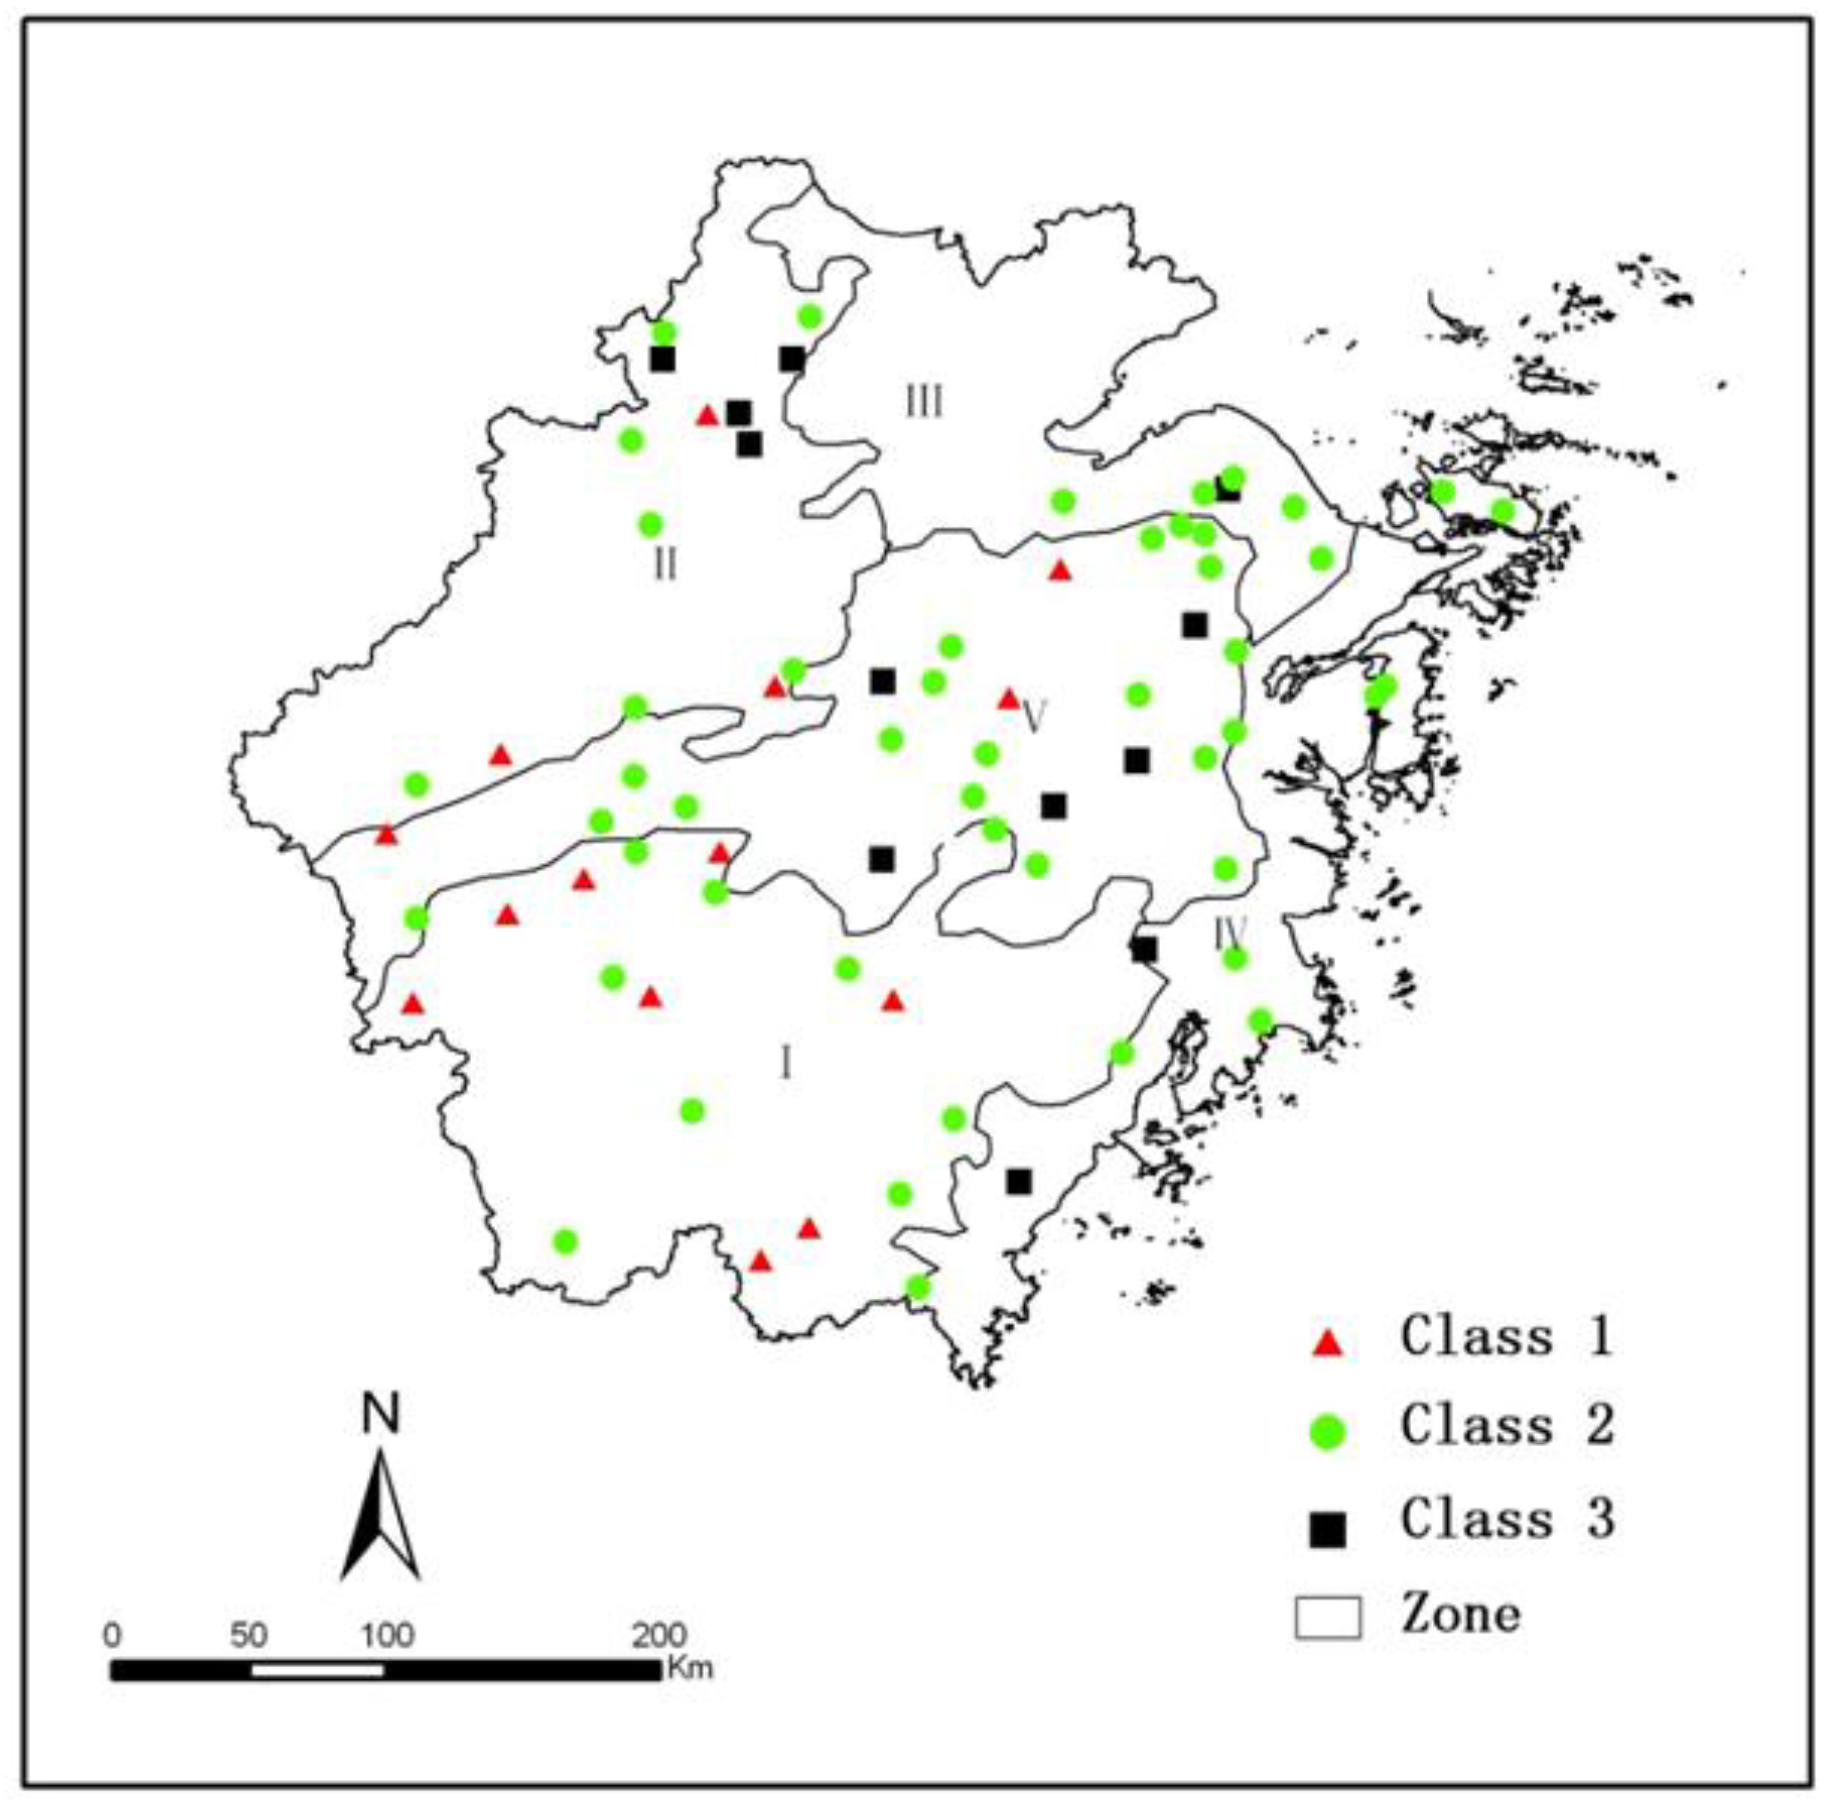
2.4. Reservoir Water Quality Classes
2.5. Comprehensive Impact Assessment Variables for Water Quality Level

| Categories | Name | Abbreviation | Unit |
|---|---|---|---|
| Land use | Percentage of forest | Forest% | |
| Percentage of farmland | Farmland% | ||
| Percentage of construction land | Construction% | ||
| Degree of fragmentation | DOF | ||
| Population | Resident population density | Res_D | people/km2 |
| Exotic population density | Imm_D | people/km2 | |
| Socio-economic parameters | Gross domestic product per unit area | GDP | 0.1 billion yuan/km2·a |
| Industrial output value per unit area | Ind_output | 0.1 billion yuan/km2·a | |
| Industrial wastewater discharge per unit area | Ind_wastewater | 10,000 ton/km2·a | |
| Industrial water consumption per unit area | Ind_consumption | 10,000 ton/km2·a | |
| Sewage treatment rate | Treatment% | ||
| Geographical features | Distance to city | Distance | km |
| Elevation | m | ||
| Characteristics of reservoirs | Storage capacity | Capacity | 10,000 m3 |
| Age | year | ||
| Climate | Precipitation | mm |
3. Results
3.1. Spatial Distribution of Water Quality

3.2. Rules for Predicting Reservoir Water Quality by CART
| Water Quality Classes | Rules |
|---|---|
| C1 | Ind_output ≤ 0.183 & GDP ≤ 0.195 & Ind_wastewater ≤ 0.119 Ind_output ≤ 0.183 & GDP ≤ 0.195 & Ind_wastewater > 0.119 & Imm_D ≤ 15 |
| C2 | Ind_output ≤ 0.183 & GDP ≤ 0.195 & Ind_wastewater > 0.119 & Imm_D > 15 Ind_output ≤ 0.183 & GDP > 0.195 Ind_output > 0.183 & Ind_wastewater ≥ 0.831 & Forest% ≥ 78.1% Ind_output > 0.183 & Ind_wastewater < 0.831 & Construction% ≥ 2.13% & Res_D ≤ 795 Ind_output > 0.183 & Ind_wastewater < 0.831 & Construction% < 2.13% |
| C3 | Ind_output > 0.183 & Ind_wastewater < 0.831 & Construction% ≥ 2.13% & Res_D > 795 Ind_output > 0.183 & Ind_wastewater ≥ 0.831 & Forest% ≤ 78.1% |
3.3. Evaluation of the Influence of Parameters on Reservoir Water Quality
| Variables | Misclassification error rate |
|---|---|
| All | 5.8% |
| Missing Ind_wastewater | 17.3% |
| Missing Ind_output | 15.4% |
| Missing GDP | 13.5% |
| Missing Construction% | 13.5% |
| Missing Res_D | 11.5% |
| Missing Imm_D | 9.6% |
| Missing Forest% | 7.7% |
| Missing Construction%, Forest% | 15.4% |
| Missing Res_D, Imm_D | 13.5% |
| Missing Ind_wastewater, Ind_output, GDP | 19.2% |
4. Discussion
4.1. Economic Development and Industrial Pollution in Zhejiang Province
4.2. Population Density and Water Quality
4.3. Effects of Land Use on Reservoir Water Quality
4.4. Precipitation and Reservoir Water Quality
4.5. Reservoir Water Quality Protection Based on Ecological Function Zoning
5. Conclusions
Acknowledgments
Author Contributions
Conflicts of Interest
References
- Jianjun, Y.; Lei, W.; Ye, S. Issues related to water quality protection of reservoirs in Zhejiang Province and countermeasures. China Water Resour. 2007, 10, 135–137. [Google Scholar]
- He, X.J.; Liu, D.G.; Lv, Z.P. Evaluation of water quality of large and medium-sized drinking water supply reservoirs in Zhejiang Province. Water Resour. Dev. Res. 2011, 3, 40–42. (In Chinese) [Google Scholar]
- Jiang, Y. China’s water scarcity. J. Environ. Manag. 2009, 90, 3185–3196. [Google Scholar] [CrossRef]
- Lv, Z.P.; Dong, H.; He, X.J. Water quality assessment and eutrophication control countermeasures of typical drinking water supply reservoirs in Zhejiang Province. J. Hydroecol. 2010, 3, 18–21. (In Chinese) [Google Scholar]
- Yang, Y.Q.; Zhang, X.G.; Chen, H.S. Studies on seasonal variation of water quality of Baixi reservoir in Zhejiang Province and ecology protection. J. Anhui Agric. Sci. 2009, 37, 7125–7127; 7133. (In Chinese) [Google Scholar]
- Weng, G.Y.; Chen, H.S.; Lu, H.H.; Hua, C.P.; Yuan, Q. Study on the water quality monitoring and eutrophication treatment in Changtan reservoir, Zhejiang Province. J. Anhui Agric. Sci. 2009, 37, 1208–1211. (In Chinese) [Google Scholar]
- Zou, Y.F. Analysis on water envirionment of Si minghu reservoir. Water Conserv. Sci. Technol. Econ. 2012, 18, 37–38. (In Chinese) [Google Scholar]
- Shrestha, S.; Kazama, F. Assessment of surface water quality using multivariate statistical techniques: A case study of the Fuji river basin, Japan. Environ. Model. Softw. 2007, 22, 464–475. [Google Scholar] [CrossRef]
- Daliakopoulos, I.N.; Coulibaly, P.; Tsanis, I.K. Groundwater level forecasting using artificial neural networks. J. Hydrol. 2005, 309, 229–240. [Google Scholar] [CrossRef]
- Khan, M.S.; Coulibaly, P. Application of support vector machine in lake water level prediction. J. Hydrol. Eng. 2006, 11, 199–205. [Google Scholar] [CrossRef]
- Kuo, J.; Wang, Y.; Lung, W. A hybrid neural-genetic algorithm for reservoir water quality management. Water Res. 2006, 40, 1367–1376. [Google Scholar] [CrossRef]
- Cheng, W.; Zhang, X.; Wang, K.; Dai, X. Integrating classification and regression tree (CART) with GIS for assessment of heavy metals pollution. Environ. Monit. Assess. 2009, 158, 419–431. [Google Scholar] [CrossRef]
- Bou Kheir, R.; Greve, M.H.; Abdallah, C.; Dalgaard, T. Spatial soil zinc content distribution from terrain parameters: A GIS-based decision-tree model in Lebanon. Environ. Pollut. 2010, 158, 520–528. [Google Scholar] [CrossRef]
- Qiu, L.; Gan, M.; Wang, K.; Deng, J.; Hong, Y.; Xu, J.; Zhu, W. Source identification of soil Cu, Zn, Pb, and Cd from anthropogenic activities by decision tree analysis in fuyang county, China. Fresenius Environ. Bull. 2012, 21, 1390–1398. [Google Scholar]
- Sugumaran, V.; Muralidharan, V.; Ramachandran, K.I. Feature selection using decision tree and classification through proximal support vector machine for fault diagnostics of roller bearing. Mech. Syst. Signal Process. 2007, 21, 930–942. [Google Scholar] [CrossRef]
- Wu, D. Supplier selection: A hybrid model using DEA, decision tree and neural network. Expert Syst. Appl. 2009, 36, 9105–9112. [Google Scholar] [CrossRef]
- Naito, T.; Miyaki, K.; Naito, M.; Yoneda, M.; Suzuki, N.; Hirofuji, T.; Nakayama, T. Parental smoking and smoking status of Japanese dental hygiene students: A pilot survey at a dental hygiene school in Japan. Int. J. Environ. Res. Public health 2009, 6, 321–328. [Google Scholar] [CrossRef]
- MacMillan, R.A.; Jones, R.K.; McNabb, D.H. Defining a hierarchy of spatial entities for environmental analysis and modeling using digital elevation models (DEMs). Comput. Environ. Urban Syst. 2004, 28, 175–200. [Google Scholar] [CrossRef]
- Merem, E.; Robinson, B.; Wesley, J.M.; Yerramilli, S.; Twumasi, Y.A. Using GIS in ecological management: Green assessment of the impacts of petroleum activities in the State of Texas. Int. J. Environ. Res. Public health 2010, 7, 2101–2130. [Google Scholar] [CrossRef]
- Zhejiang Provincial Bureau of Statistics. Zhejiang Statistical Yearbook; China Statistics Press: Beijing, China, 2010. (In Chinese) [Google Scholar]
- Zhang, X.; Lin, F.; Jiang, Y.; Wang, K.; Wong, M.T. Assessing soil Cu content and anthropogenic influences using decision tree analysis. Environ. Pollut. 2008, 156, 1260–1267. [Google Scholar] [CrossRef]
- SPSS Inc. Clementine 11.1 User’s Guide, SPSS Inc.: Chicago, IL, USA, 2007.
- Breiman, L.; Friedman, J.; Stone, C.J.; Olshen, R.A. Classification and Regression Trees; CRC Press: Boca Raton, FL, USA, 1984. [Google Scholar]
- Lewis, R.J. An Introduction to Classification and Regression Tree (CART) Analysis&Quot. In Presented at Annual Meeting of the Society for Academic Emergency Medicine 2000, San Francisco, California, CA, USA, 22–25 May 2000; pp. 1–14.
- McLachlan, G. Discriminant Analysis and Statistical Pattern Recognition; Wiley: Hoboken, NJ, USA, 2004; Volume 544. [Google Scholar]
- De’Ath, G.; Fabricius, K.E. Classification and regression trees: A powerful yet simple technique for ecological data analysis. Ecology 2000, 81, 3178–3192. [Google Scholar] [CrossRef]
- Su, S.; Zhi, J.; Lou, L.; Huang, F.; Chen, X.; Wu, J. Spatio-temporal patterns and source apportionment of pollution in Qiantang River (China) using neural-based modeling and multivariate statistical techniques. Phys. Chem. Earth, Parts A/B/C 2011, 36, 379–386. [Google Scholar] [CrossRef]
- Merem, E.C.; Yerramilli, S.; Twumasi, Y.A.; Wesley, J.M.; Robinson, B.; Richardson, C. The applications of GIS in the analysis of the impacts of human activities on South Texas Watersheds. Int. J. Environ. Res. Public Health 2011, 8, 2418–2446. [Google Scholar] [CrossRef]
- Chang, H. Spatial analysis of water quality trends in the Han River basin, South Korea. Water Res. 2008, 42, 3285–3304. [Google Scholar] [CrossRef]
- Li, S.; Gu, S.; Liu, W.; Han, H.; Zhang, Q. Water quality in relation to land use and land cover in the upper Han River Basin, China. Catena 2008, 75, 216–222. [Google Scholar] [CrossRef]
- Lee, S.; Hwang, S.; Lee, S.; Hwang, H.; Sung, H. Landscape ecological approach to the relationships of land use patterns in watersheds to water quality characteristics. Landscape Urban Plan. 2009, 92, 80–89. [Google Scholar] [CrossRef]
- Wang, J.; Da, L.; Song, K.; Li, B. Temporal variations of surface water quality in urban, suburban and rural areas during rapid urbanization in Shanghai, China. Environ. Pollut. 2008, 152, 387–393. [Google Scholar] [CrossRef]
- Tu, J.; Xia, Z.; Clarke, K.C.; Frei, A. Impact of urban sprawl on water quality in eastern Massachusetts, USA. Environ. Manag. 2007, 40, 183–200. [Google Scholar] [CrossRef]
- Whitehead, P.G.; Wilby, R.L.; Battarbee, R.W.; Kernan, M.; Wade, A.J. A review of the potential impacts of climate change on surface water quality. Hydrol. Sci. J. 2009, 54, 101–123. [Google Scholar] [CrossRef]
- Abbaspour, K.C.; Yang, J.; Maximov, I.; Siber, R.; Bogner, K.; Mieleitner, J.; Zobrist, J.; Srinivasan, R. Modelling hydrology and water quality in the pre-alpine/alpine Thur watershed using SWAT. J. Hydrol. 2007, 333, 413–430. [Google Scholar] [CrossRef]
- Ninyerola, M.; Pons, X.; Roure, J.M. Monthly precipitation mapping of the Iberian Peninsula using spatial interpolation tools implemented in a Geographic Information System. Theor. Appl. Climatol. 2007, 89, 195–209. [Google Scholar] [CrossRef]
- Childs, C. Interpolating Surfaces in ArcGIS Spatial Analyst. Available online: http://webapps.fundp.ac.be/geotp/SIG/interpolating.pdf (accessed on 16 January 2014).
- White, M.D.; Greer, K.A. The effects of watershed urbanization on the stream hydrology and riparian vegetation of Los Penasquitos Creek, California. Landscape Urban Plan. 2006, 74, 125–138. [Google Scholar] [CrossRef]
- Baker, A. Land use and water quality. Encycl. Hydrol. Sci. 2003, 17, 2499–2501. [Google Scholar]
- Jeon, J.; Yoon, C.G.; Ham, J.; Jung, K. Model development for nutrient loading estimates from paddy rice fields in Korea. J. Environ. Sci. Health, Part. B 2004, 39, 845–860. [Google Scholar] [CrossRef]
- Yoon, C.G.; Ham, J.; Jeon, J. Mass balance analysis in Korean paddy rice culture. Paddy Water Environ. 2003, 1, 99–106. [Google Scholar] [CrossRef]
- Hwang, S.; Lee, S.; Son, J.; Park, G.; Kim, S. Moderating effects of the geometry of reservoirs on the relation between urban land use and water quality. Landscape Urban Plan. 2007, 82, 175–183. [Google Scholar] [CrossRef]
- Liu, R.; Wang, J.; Shi, J.; Chen, Y.; Sun, C.; Zhang, P.; Shen, Z. Runoff characteristics and nutrient loss mechanism from plain farmland under simulated rainfall conditions. Sci. Total Environ. 2014, 468, 1069–1077. [Google Scholar]
- Berndtsson, J.C.; Bengtsson, L.; Jinno, K. Runoff water quality from intensive and extensive vegetated roofs. Ecol. Eng. 2009, 35, 369–380. [Google Scholar] [CrossRef]
Appendix A
| Parameters | Category of water quality standards | |||||
|---|---|---|---|---|---|---|
| First | Second | Third | Fourth | Fifth | ||
| DO | ≥ | 7.5 | 6 | 5 | 3 | 2 |
| CODMn | ≤ | 2 | 4 | 6 | 10 | 15 |
| COD | ≤ | 15 | 15 | 20 | 30 | 40 |
| BOD | ≤ | 3 | 3 | 4 | 6 | 10 |
| NH3-N | ≤ | 0.15 | 0.5 | 1 | 1.5 | 2 |
| TP | ≤ | 0.01 | 0.025 | 0.05 | 0.1 | 0.2 |
| TN | ≤ | 0.2 | 0.5 | 1 | 1.5 | 2 |
| TCu | ≤ | 0.01 | 1 | 1 | 1 | 1 |
| TZn | ≤ | 0.05 | 1 | 1 | 2 | 2 |
| F− | ≤ | 1 | 1 | 1 | 1.5 | 1.5 |
| TSe | ≤ | 0.01 | 0.01 | 0.01 | 0.02 | 0.02 |
| TAs | ≤ | 0.05 | 0.05 | 0.05 | 0.1 | 0.1 |
| THg | ≤ | 0.00005 | 0.00005 | 0.0001 | 0.001 | 0.001 |
| TCd | ≤ | 0.001 | 0.005 | 0.005 | 0.005 | 0.01 |
| Cr6+ | ≤ | 0.01 | 0.05 | 0.05 | 0.05 | 0.1 |
| TPb | ≤ | 0.01 | 0.01 | 0.05 | 0.05 | 0.1 |
| TCN | ≤ | 0.005 | 0.05 | 0.2 | 0.2 | 0.2 |
| V-ArOH | ≤ | 0.002 | 0.002 | 0.005 | 0.01 | 0.1 |
| Petroleum | ≤ | 0.05 | 0.05 | 0.05 | 0.5 | 1 |
| Anionic surfactant | ≤ | 0.2 | 0.2 | 0.2 | 0.3 | 0.3 |
| S2− | ≤ | 0.05 | 0.1 | 0.05 | 0.5 | 1 |
| Fecal coliform (number/L) | ≤ | 200 | 2,000 | 10,000 | 20,000 | 40,000 |
© 2014 by the authors; licensee MDPI, Basel, Switzerland. This article is an open access article distributed under the terms and conditions of the Creative Commons Attribution license (http://creativecommons.org/licenses/by/3.0/).
Share and Cite
Gu, Q.; Deng, J.; Wang, K.; Lin, Y.; Li, J.; Gan, M.; Ma, L.; Hong, Y. Identification and Assessment of Potential Water Quality Impact Factors for Drinking-Water Reservoirs. Int. J. Environ. Res. Public Health 2014, 11, 6069-6084. https://doi.org/10.3390/ijerph110606069
Gu Q, Deng J, Wang K, Lin Y, Li J, Gan M, Ma L, Hong Y. Identification and Assessment of Potential Water Quality Impact Factors for Drinking-Water Reservoirs. International Journal of Environmental Research and Public Health. 2014; 11(6):6069-6084. https://doi.org/10.3390/ijerph110606069
Chicago/Turabian StyleGu, Qing, Jinsong Deng, Ke Wang, Yi Lin, Jun Li, Muye Gan, Ligang Ma, and Yang Hong. 2014. "Identification and Assessment of Potential Water Quality Impact Factors for Drinking-Water Reservoirs" International Journal of Environmental Research and Public Health 11, no. 6: 6069-6084. https://doi.org/10.3390/ijerph110606069
APA StyleGu, Q., Deng, J., Wang, K., Lin, Y., Li, J., Gan, M., Ma, L., & Hong, Y. (2014). Identification and Assessment of Potential Water Quality Impact Factors for Drinking-Water Reservoirs. International Journal of Environmental Research and Public Health, 11(6), 6069-6084. https://doi.org/10.3390/ijerph110606069