4. Discussion
The results presented in this paper support the hypothesis that active travel is more commonly practiced in more urbanized areas (e.g., [
9,
25]). Car ownership has a greater individual association with a decrease in active travel min than the built environment categories, though the differences between the urban centers and less urbanized areas is similar in magnitude of change. Differences were found by lifecycle stage, suggesting that the household needs and desires will influence how much active travel is gained. However, as hypothesized, the built environment continued to have an association with active travel even when car ownership and household lifecycle stage were accounted for. The findings also suggest that considerable active travel gains are associated with public transport, and that the majority of those min are through walking.
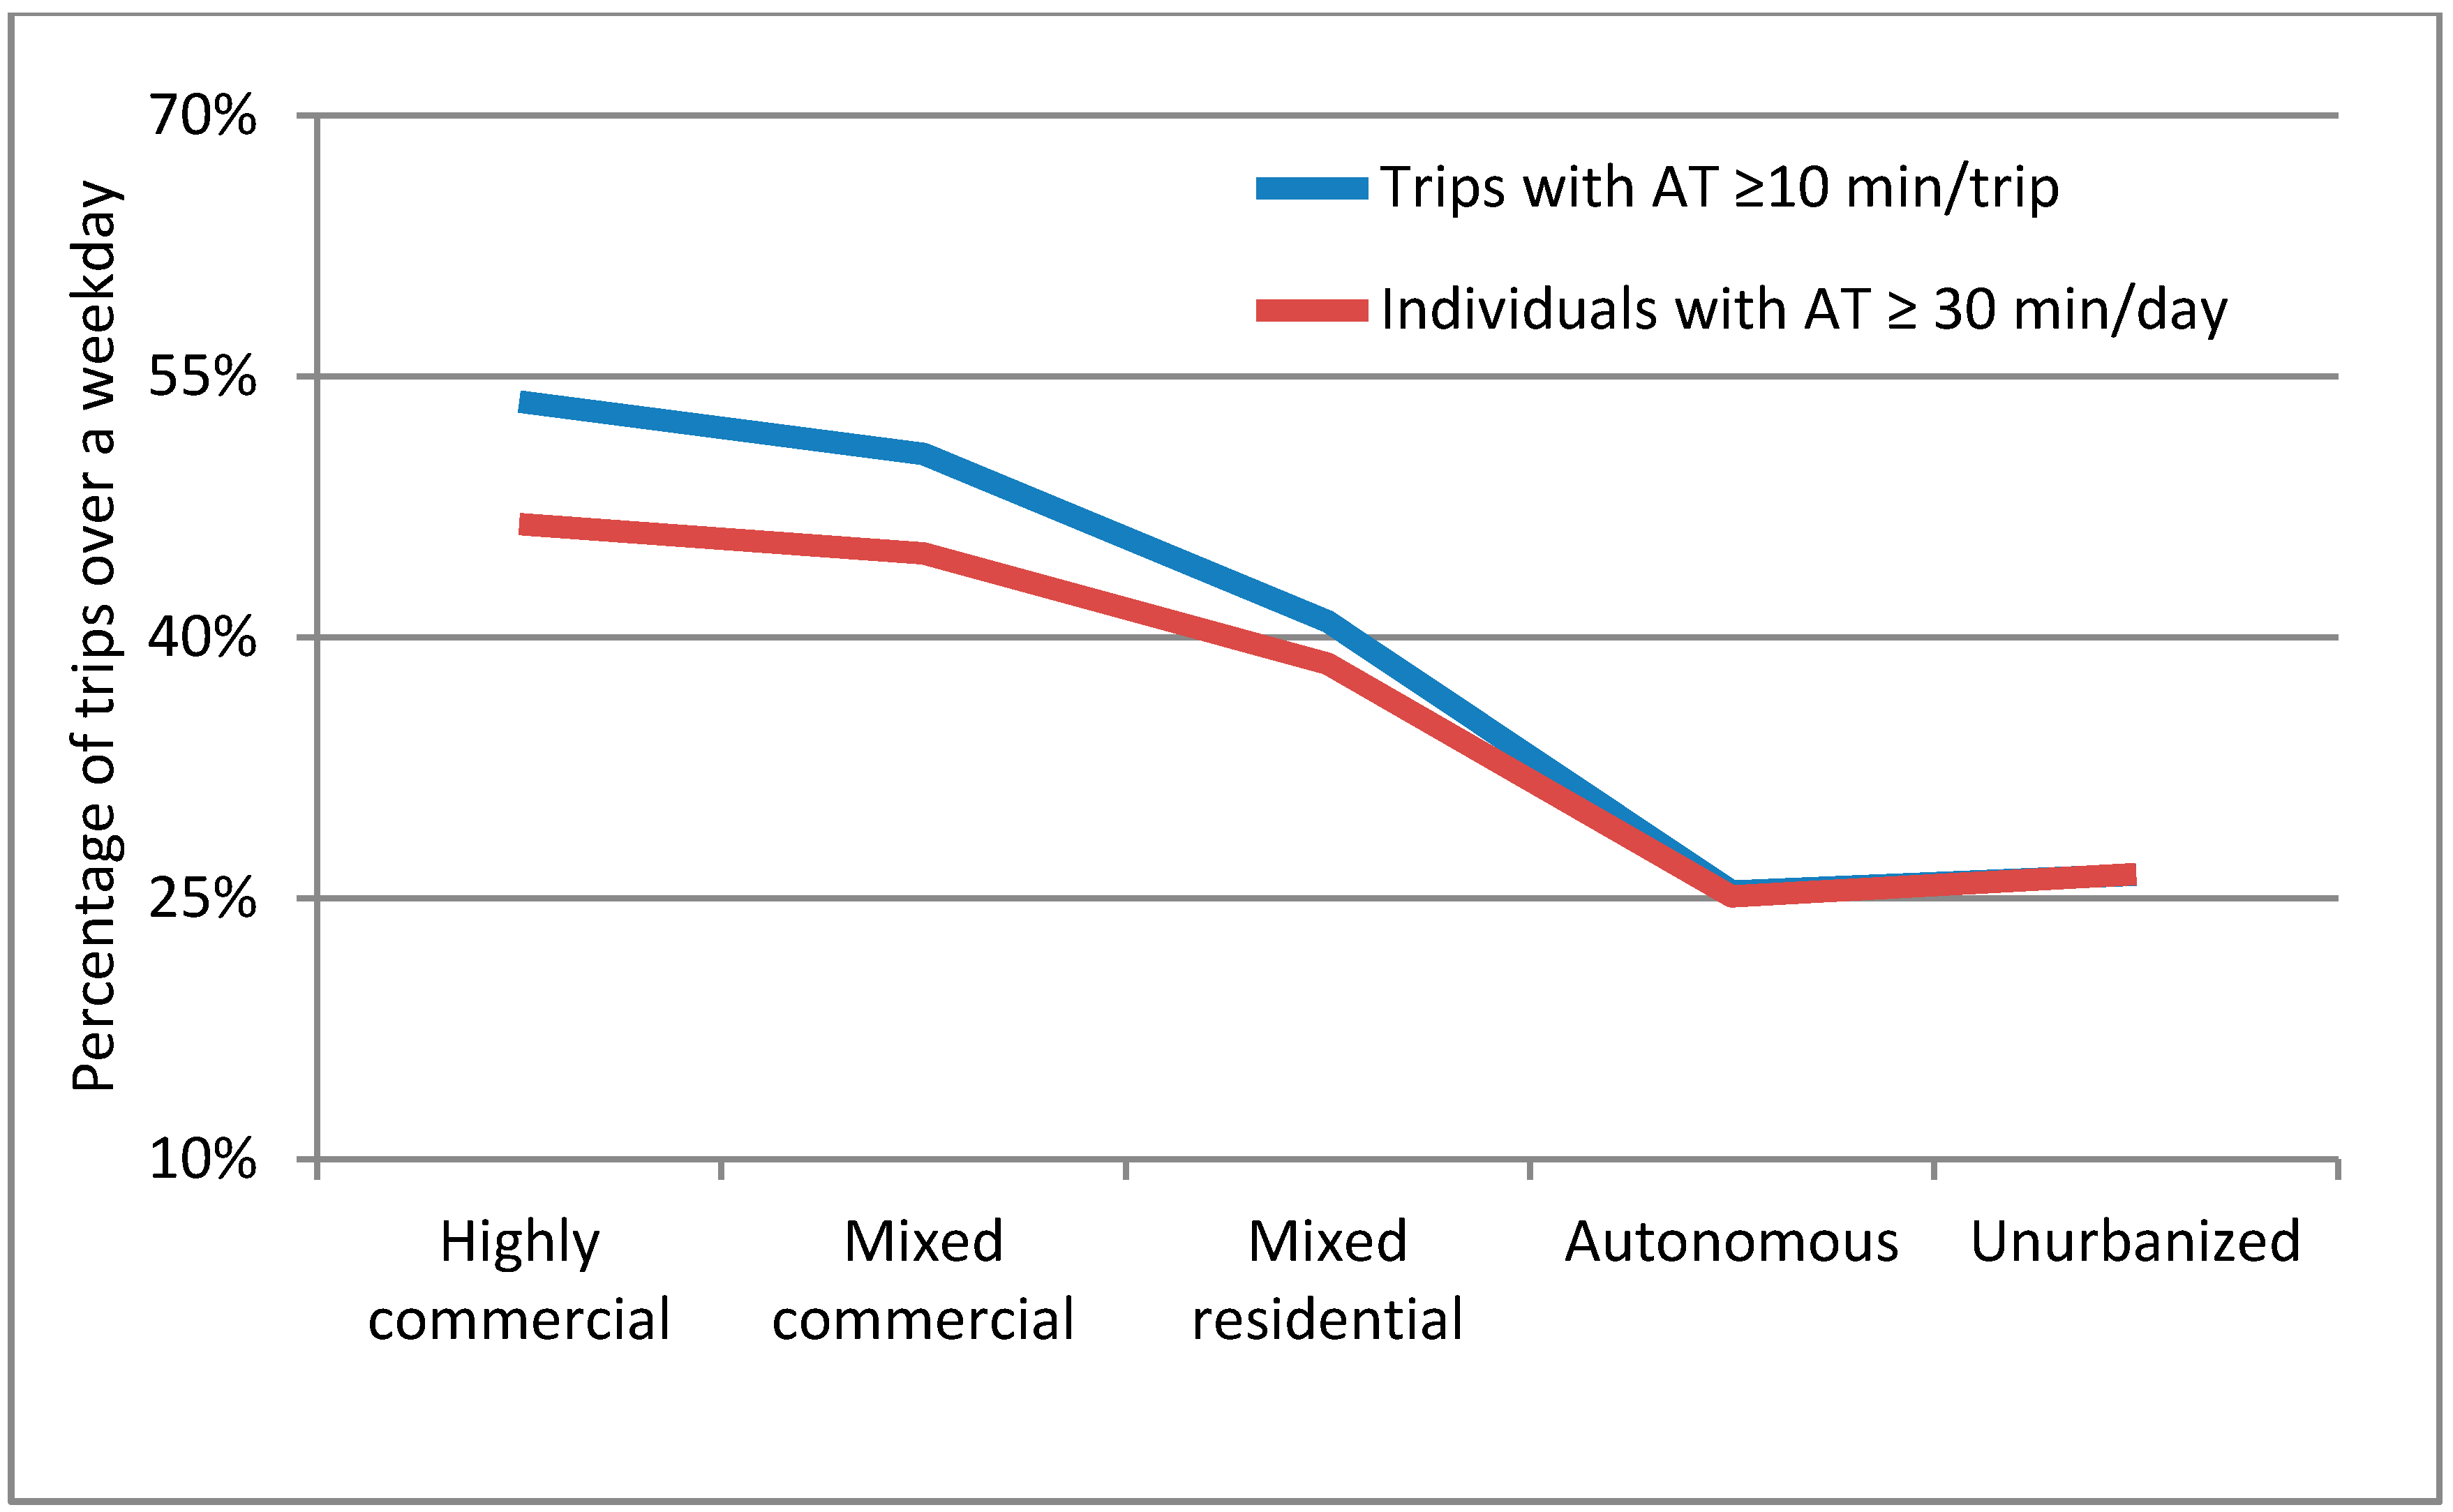
The results of the binary logistic regression show that when car ownership and household lifecycle stages are accounted for, there is a clear impact of the built environment on the likelihood that a trip will contain at least 10 min of active travel and that an individual will accumulate at least 30 min of active travel over a day. This is similar to Fishman, Böcker and Helbich [
9] who used a continuous variable for car ownership and found a strong negative influence on the total METs achieved through active transport over a day.
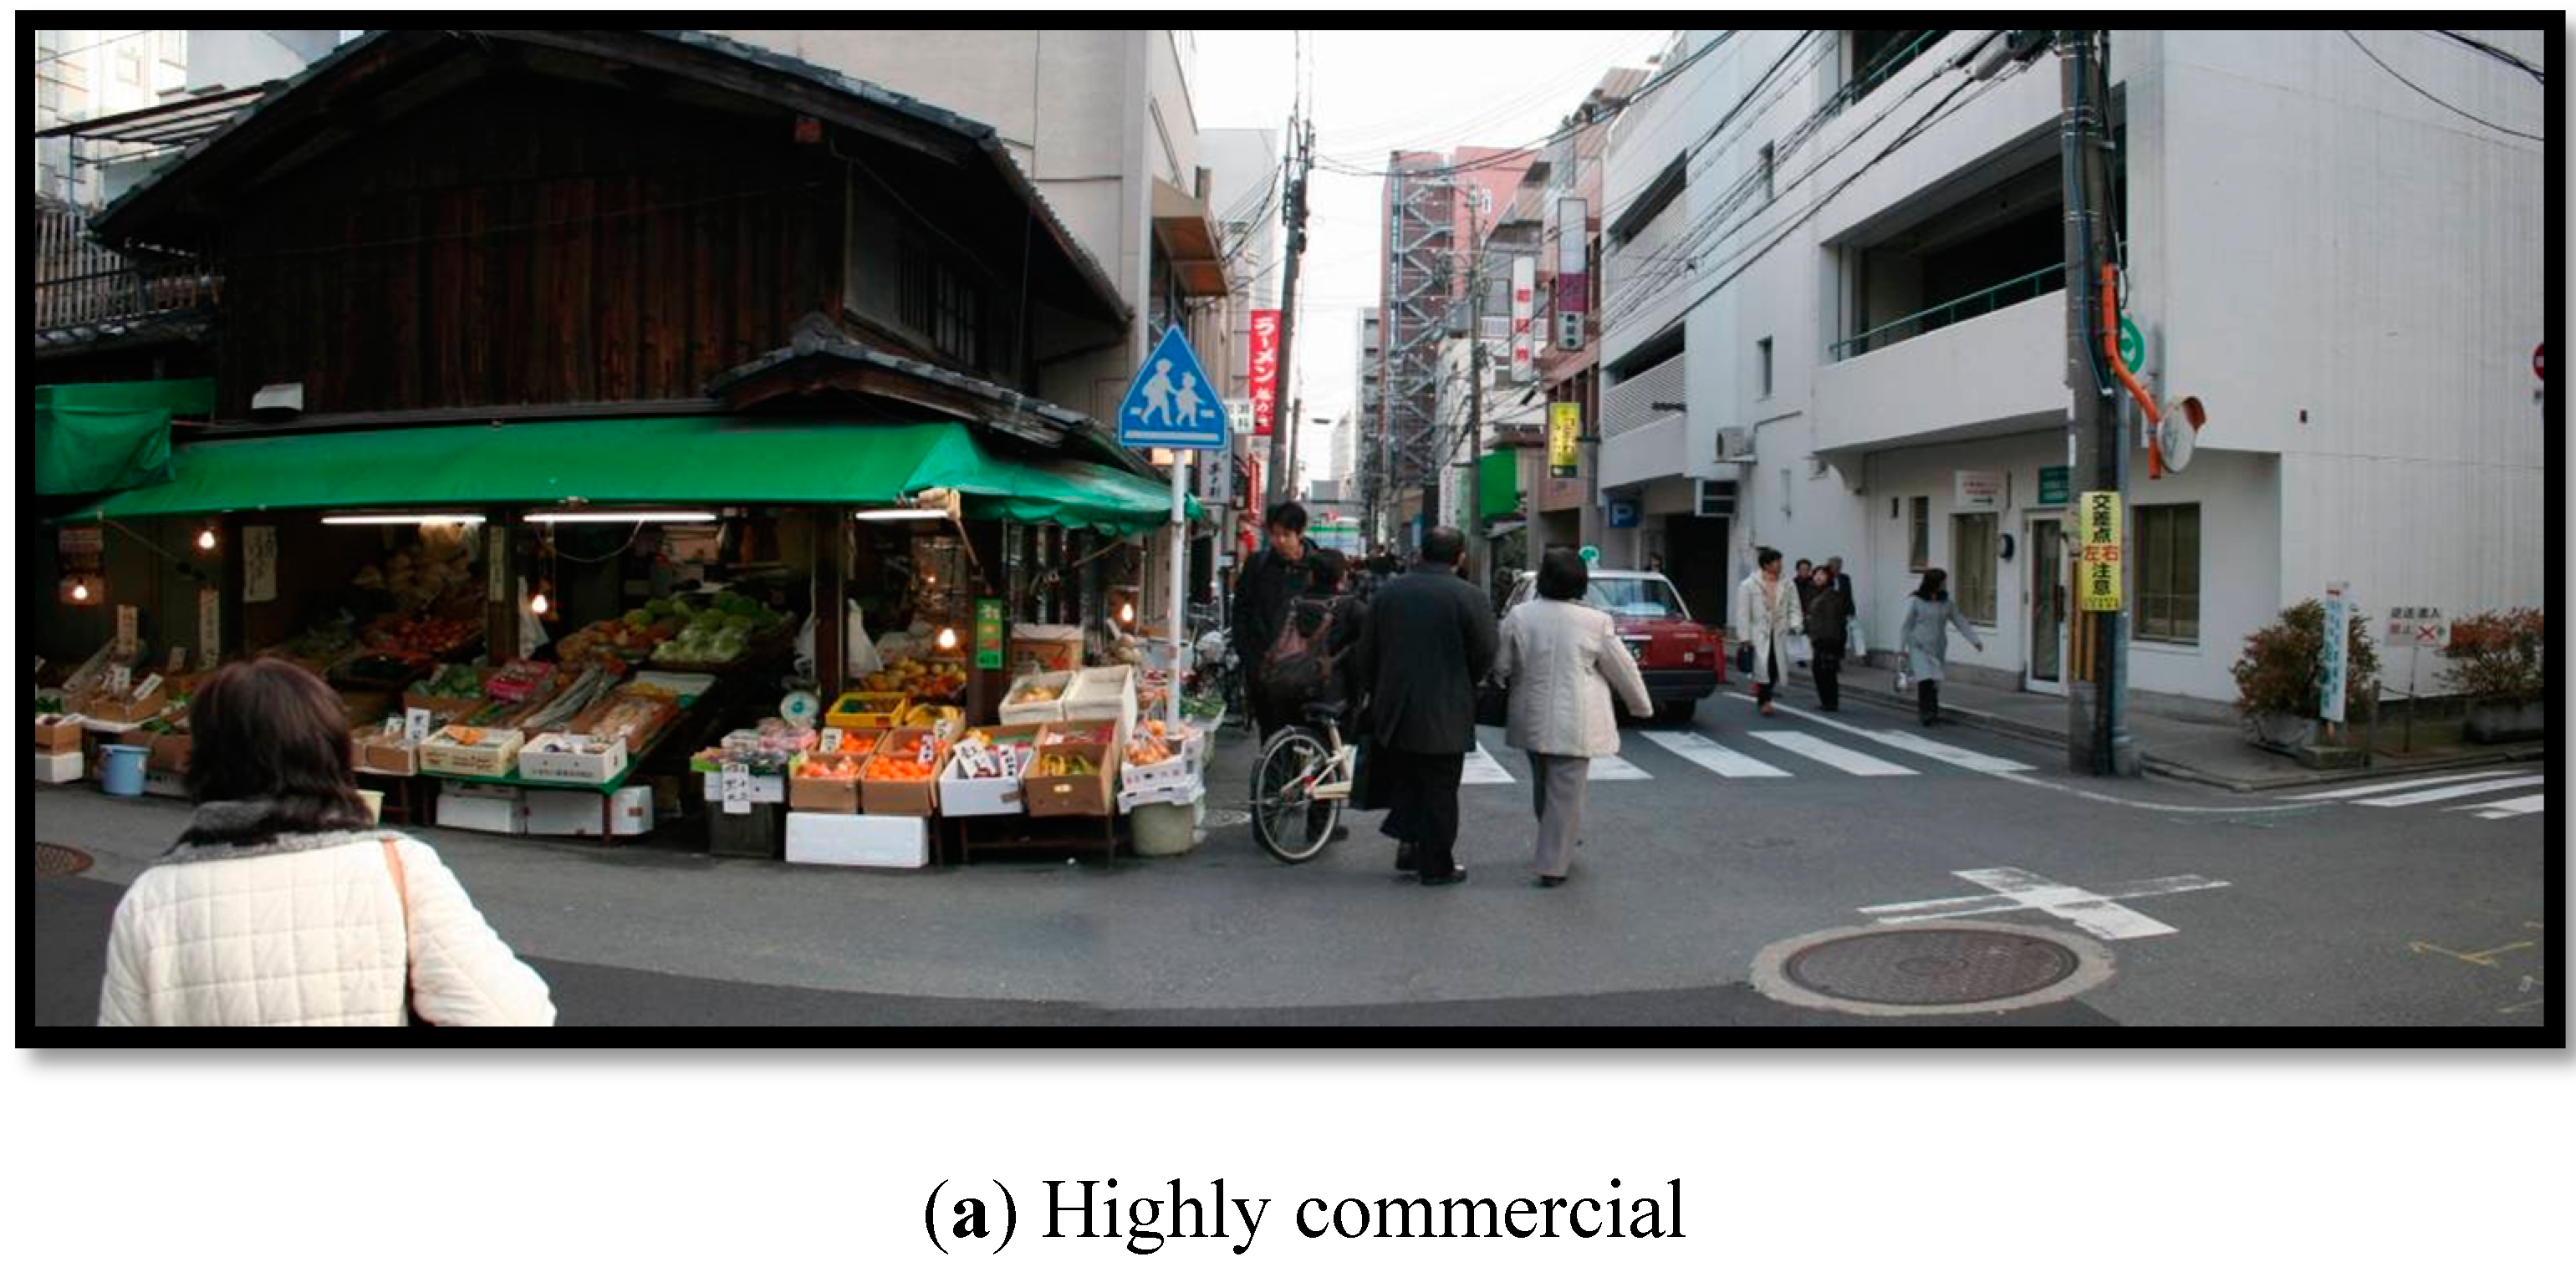
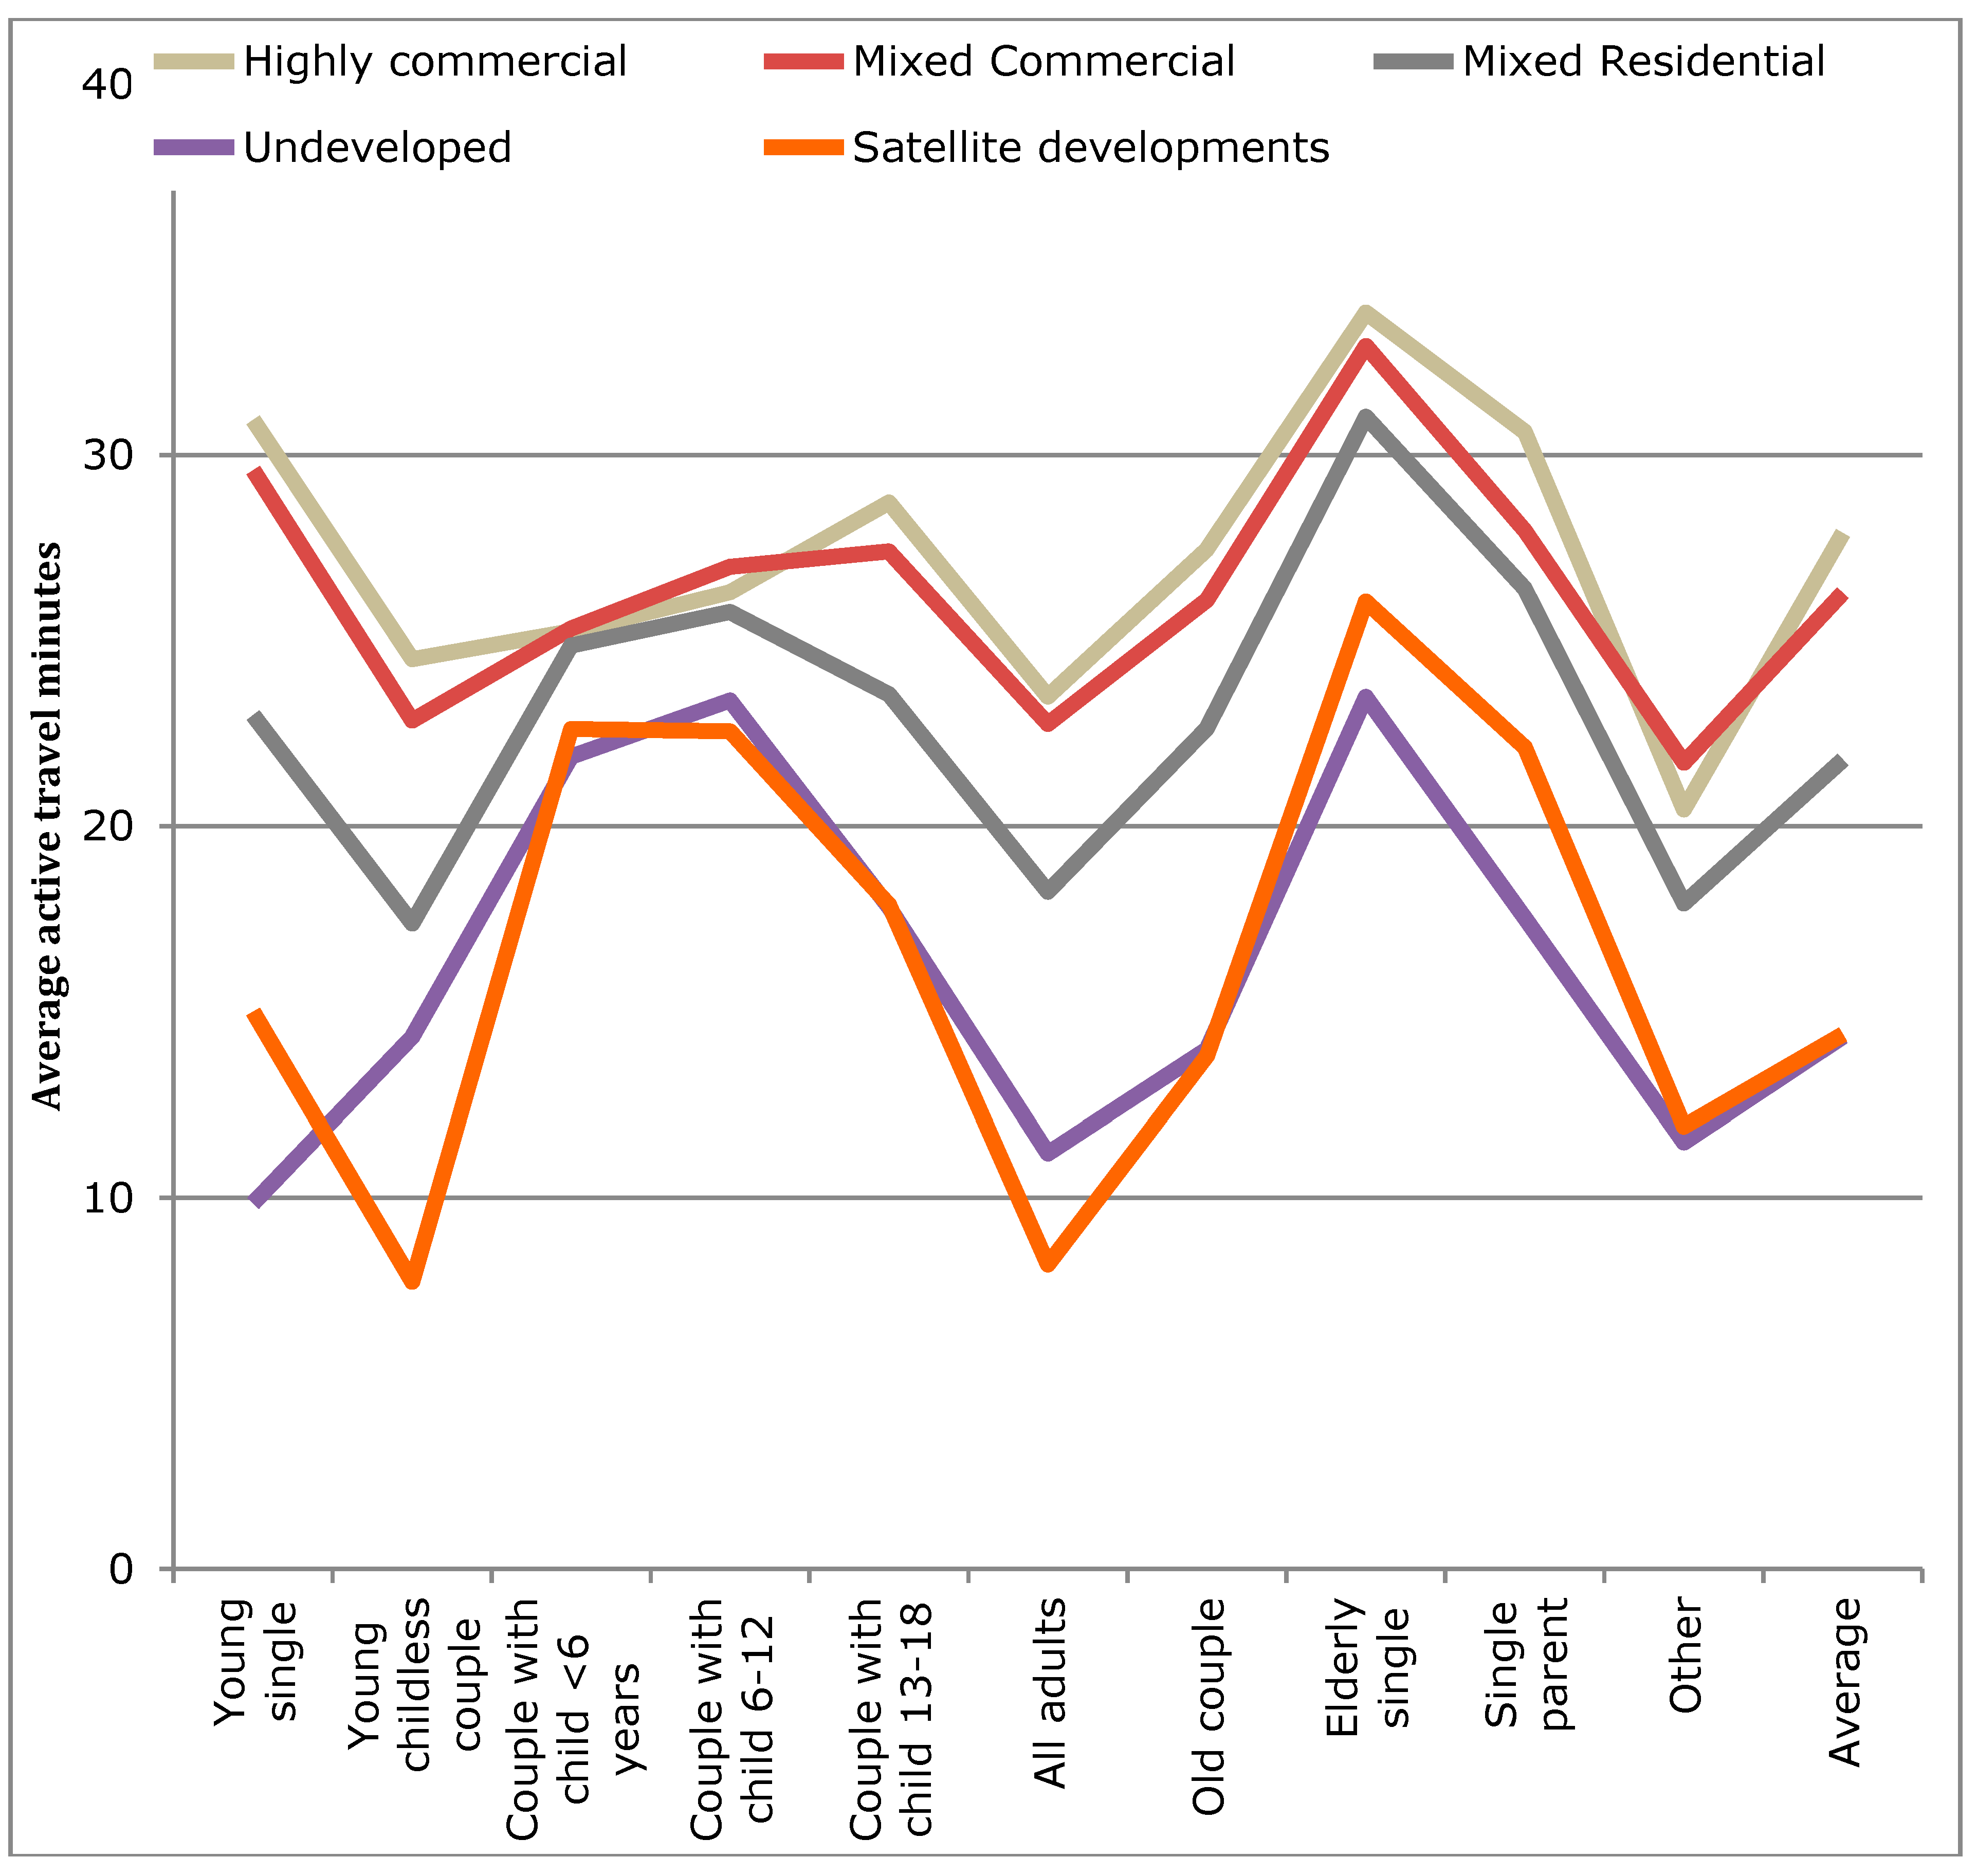
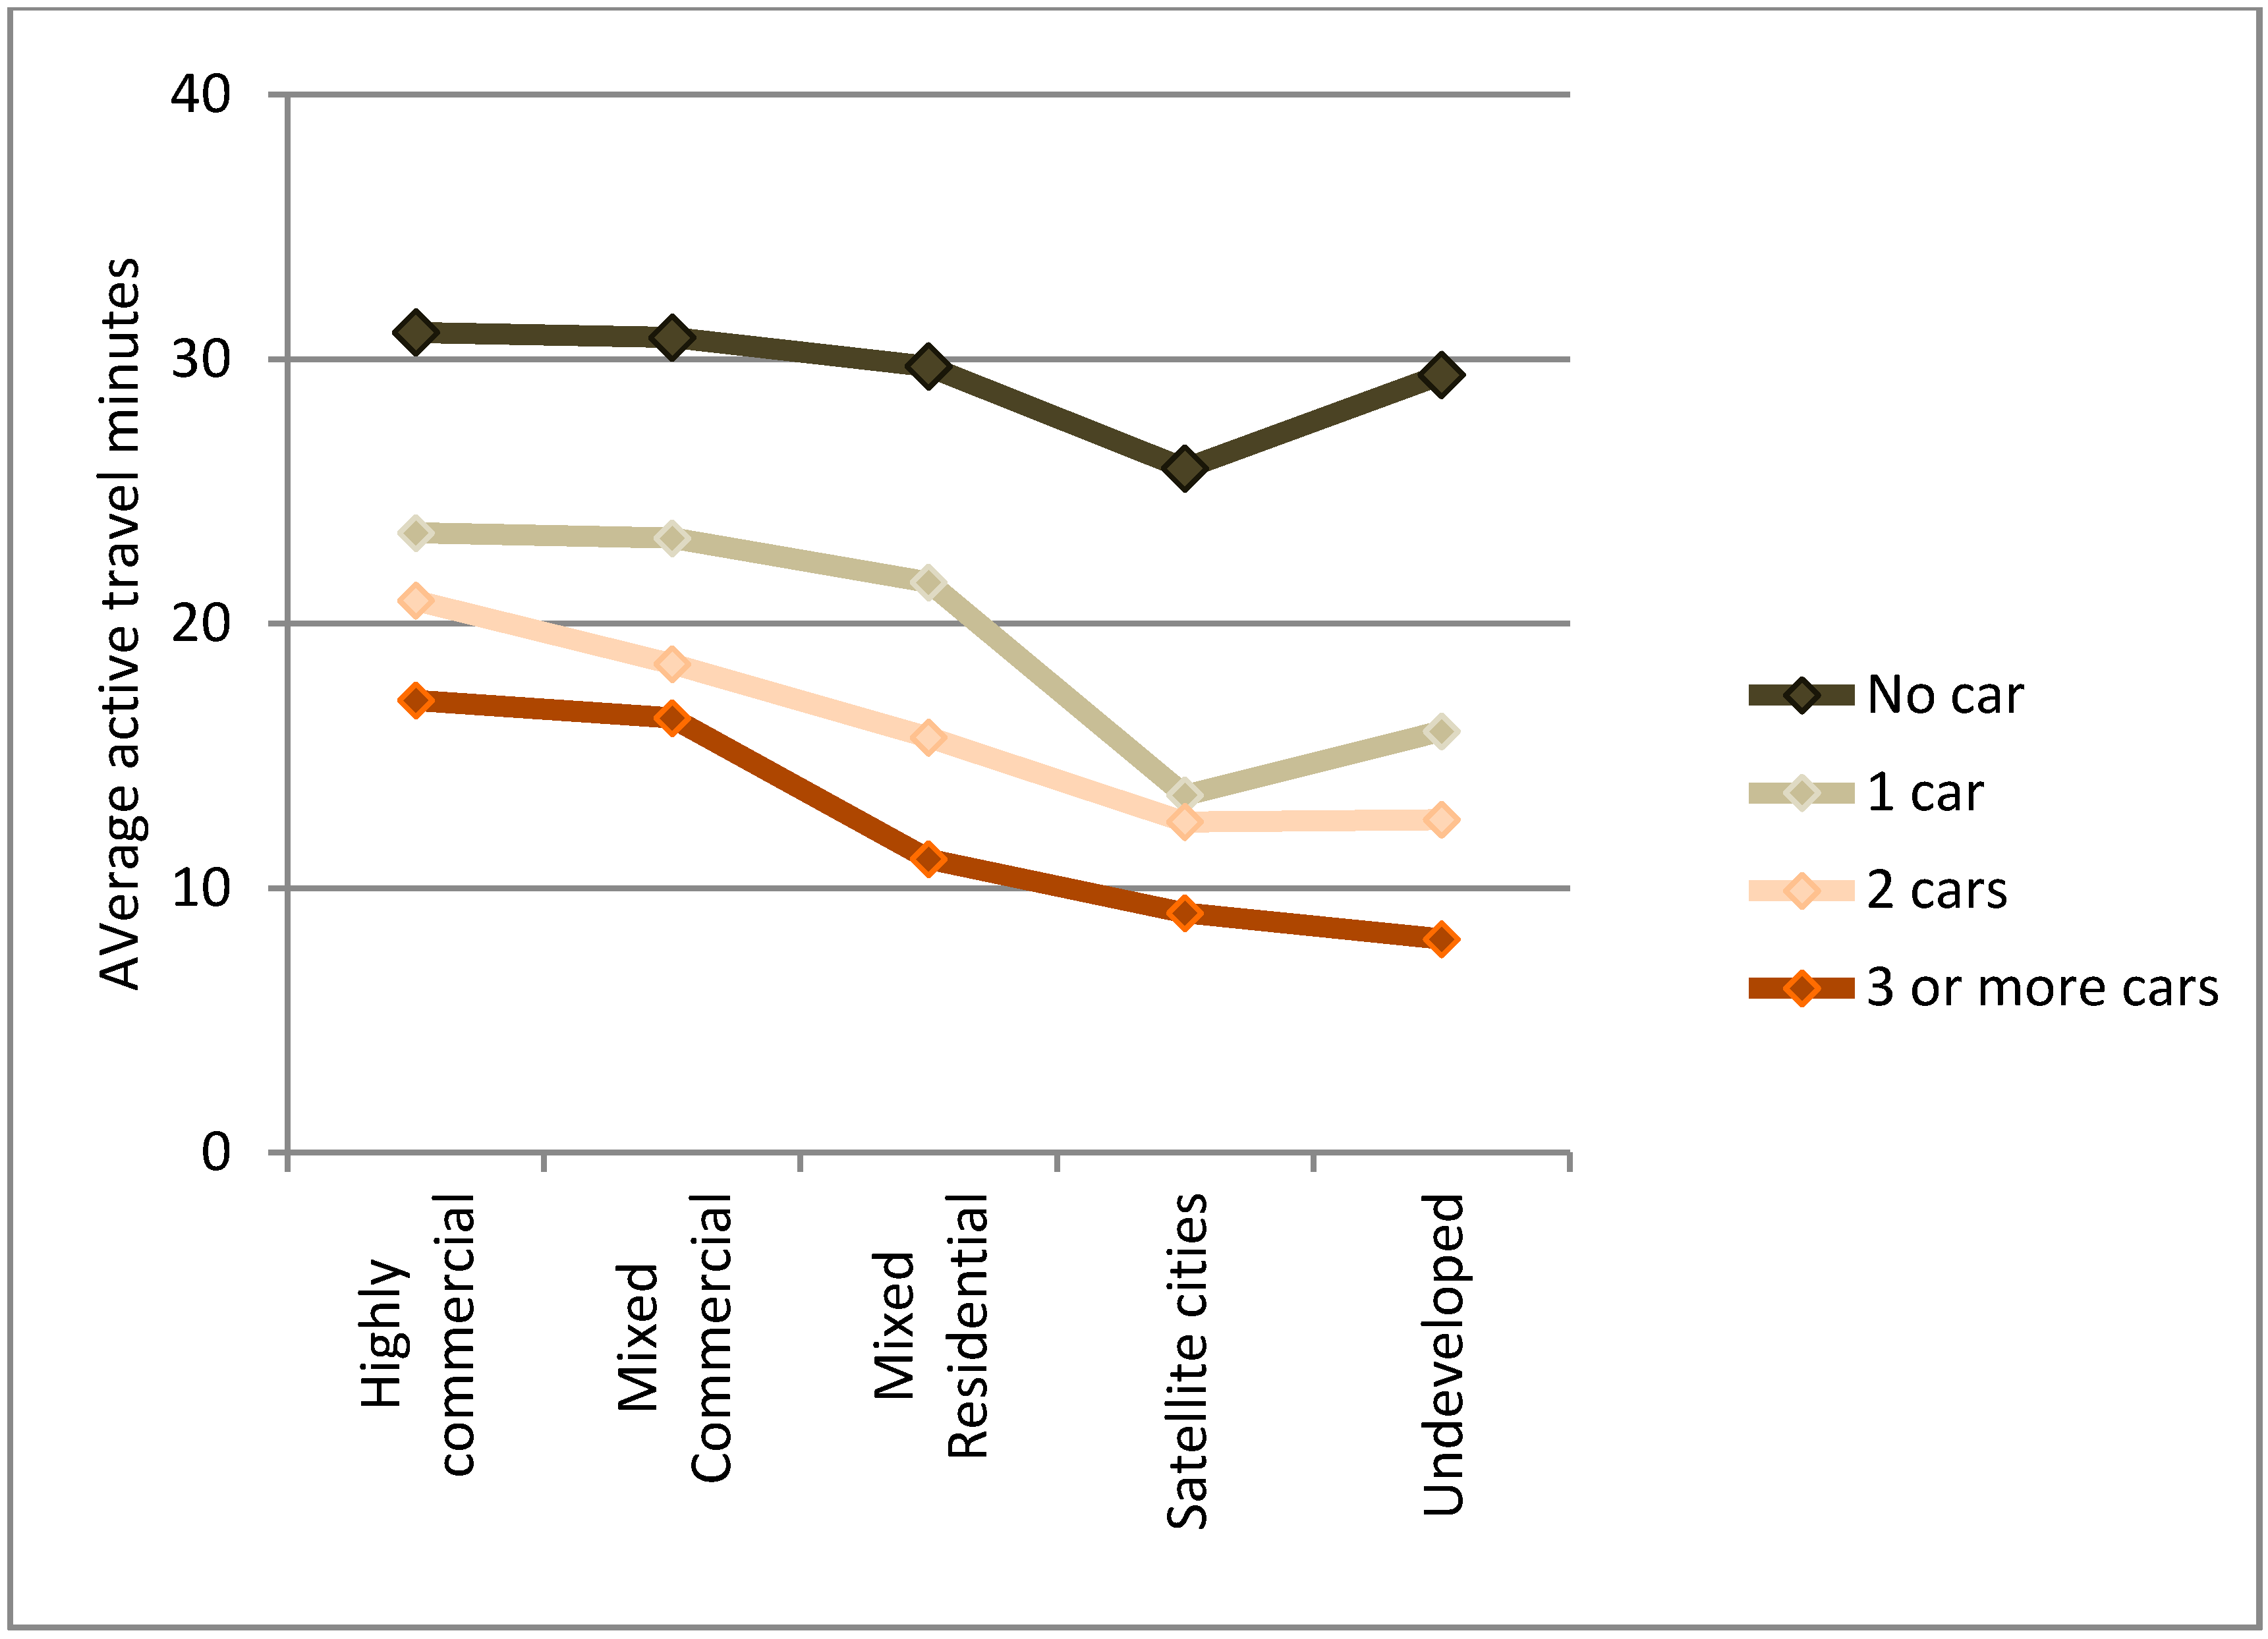
Within the more urbanized areas (those typically related to the larger cities within the metropolitan area) the association between greater average active travel min and the built environment was not linear. Examining simply the averages (
Figure 8), it would appear that the largest average min of active travel per person was a step progression away from the most urbanized area (
i.e., the Highly-commercial areas) to the least (
i.e., Unurbanized). However, in the binary regression models on the WHO recommended targets (
Table 4 and
Table 5), when the household lifecycle stage, car ownership, and individual factors (child, male) were accounted for, it was found that the order was: Mixed commercial, Mixed residential, Highly commercial, Unurbanized, and finally Autonomous. This is likely explained by a combination of two key factors that interact. The Mixed commercial area has maintained low car use over the past several decades [
37], but the distances to locations is slightly greater than the most urbanized areas. The Mixed residential areas, though having higher car use [
37], also benefit from slightly longer distances, but distances that are still in favor of active travel. The least urbanized areas (Autonomous and Unurbanized) have experienced the greatest car use increases [
37], and the development style of Autonomous areas is more car-oriented. In the Unurbanized areas, large distances decrease the likelihood of active travel.
In the study area, it was further noted that even in the less urbanized areas at least 25% of population is possibly reaching the recommended level of physical activity solely through their transport, rising to 47% and 45% in the two most urbanized areas. Taking the population by built environment type, it can be calculated at 40% of the population is reaching 30 min per day of active travel, which is similar to the 38% reported by Fishman, Böcker and Helbich [
9] for the Netherlands.
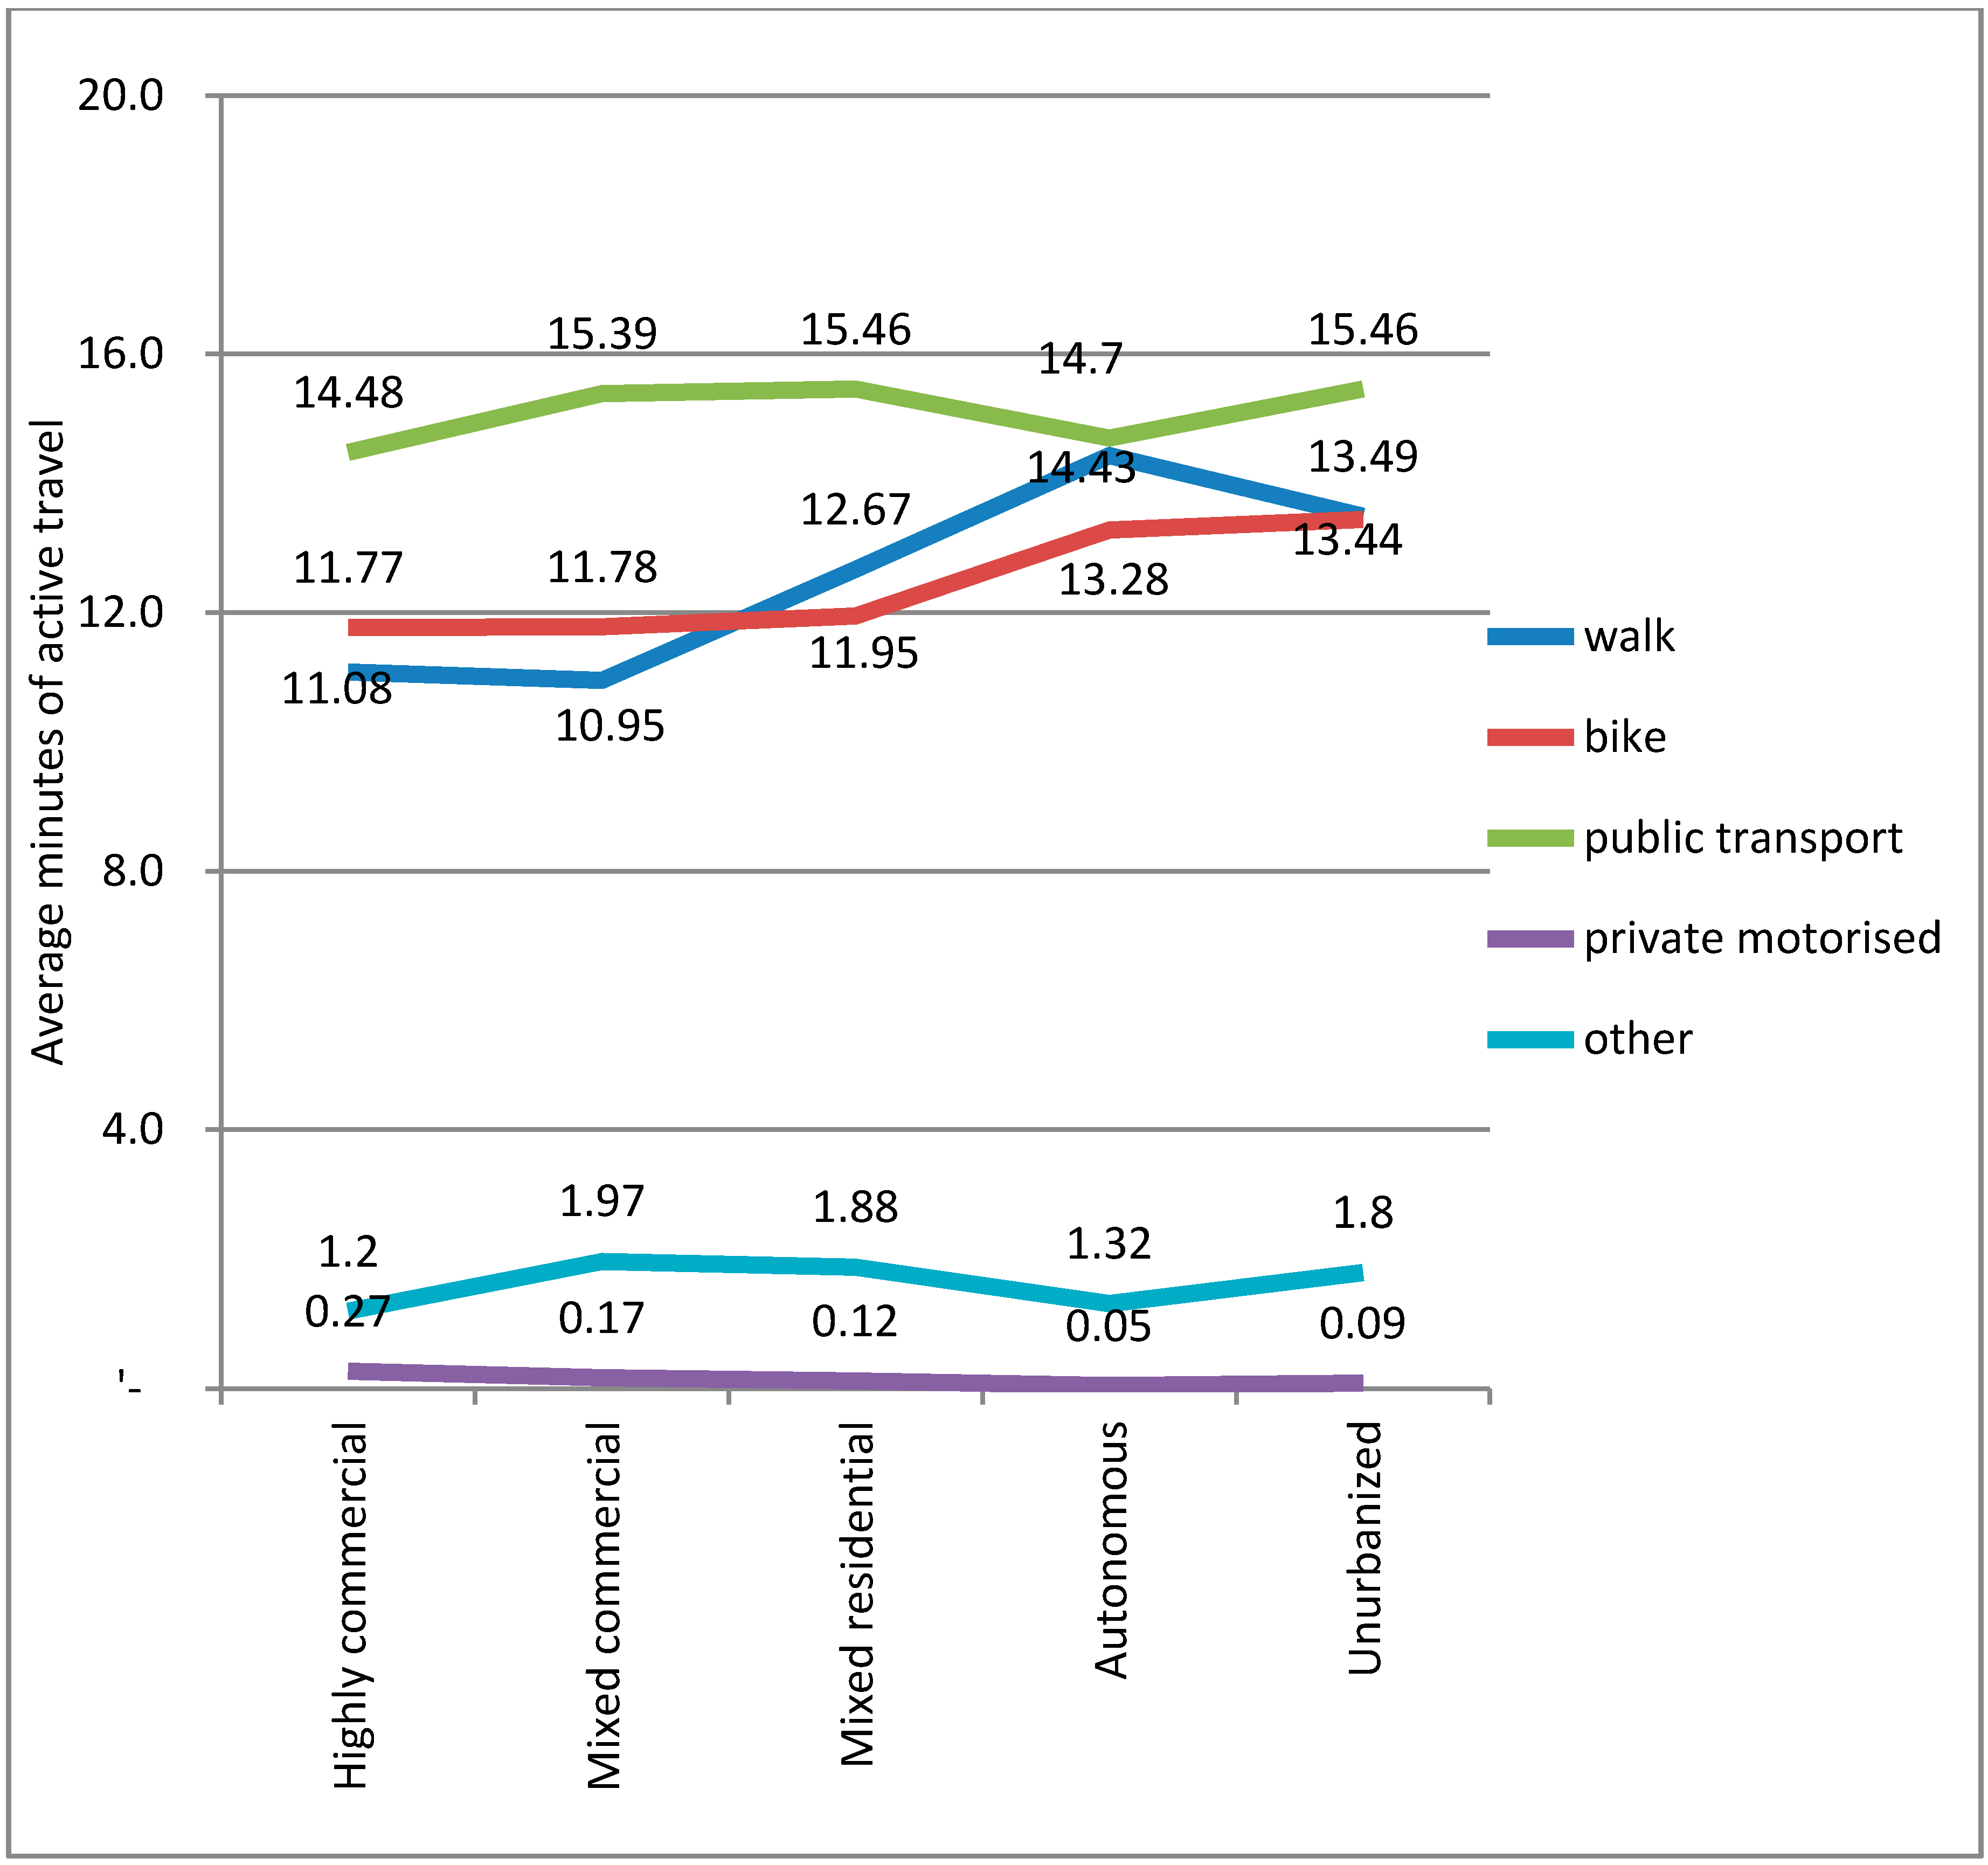
From the descriptive results, it is apparent that when considering active travel it is important to also include the min associated with public transport trips. Although not shown above, the variation for bus and rail by built environment type was not great with the average active travel for buses being 11.5 min (±0.7) and rail-based transit 15.5 min (±0.4). Active travel for walking trips was 12.5 min (±1.5) and for cycling trips it was 12.4 (±0.8). It should be noted that research suggests that such trips are generally underestimated [
68].
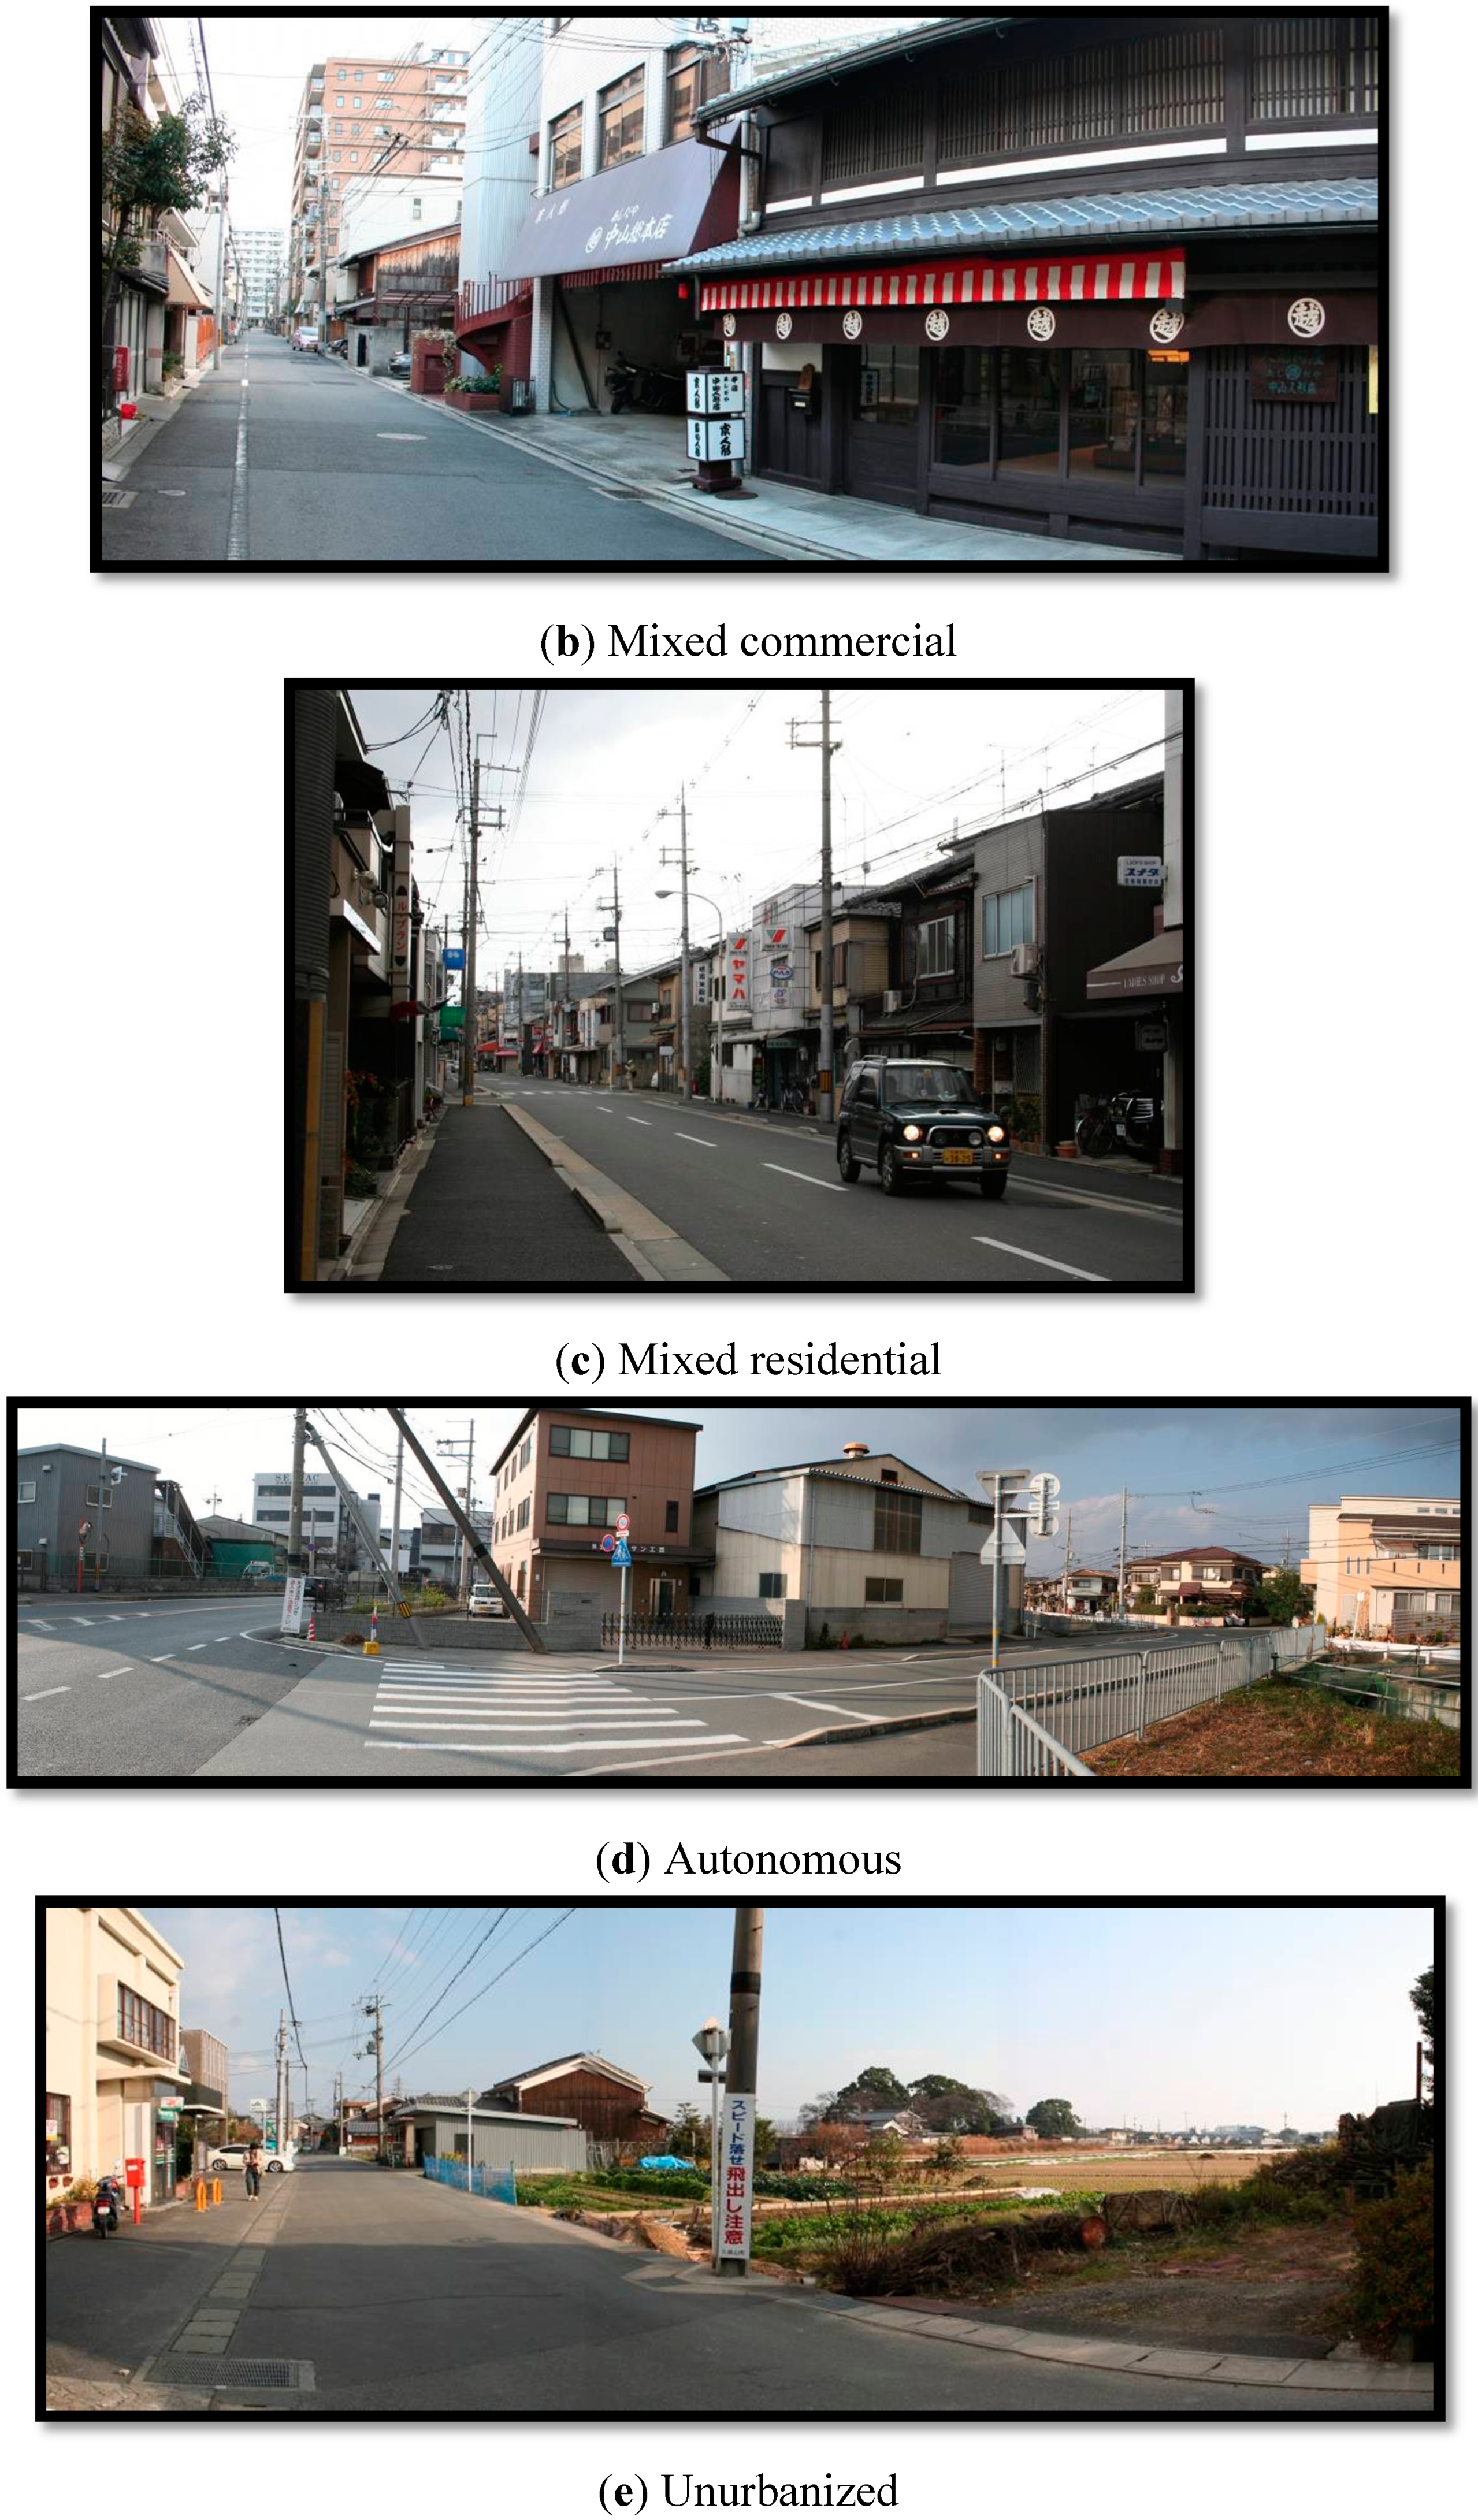
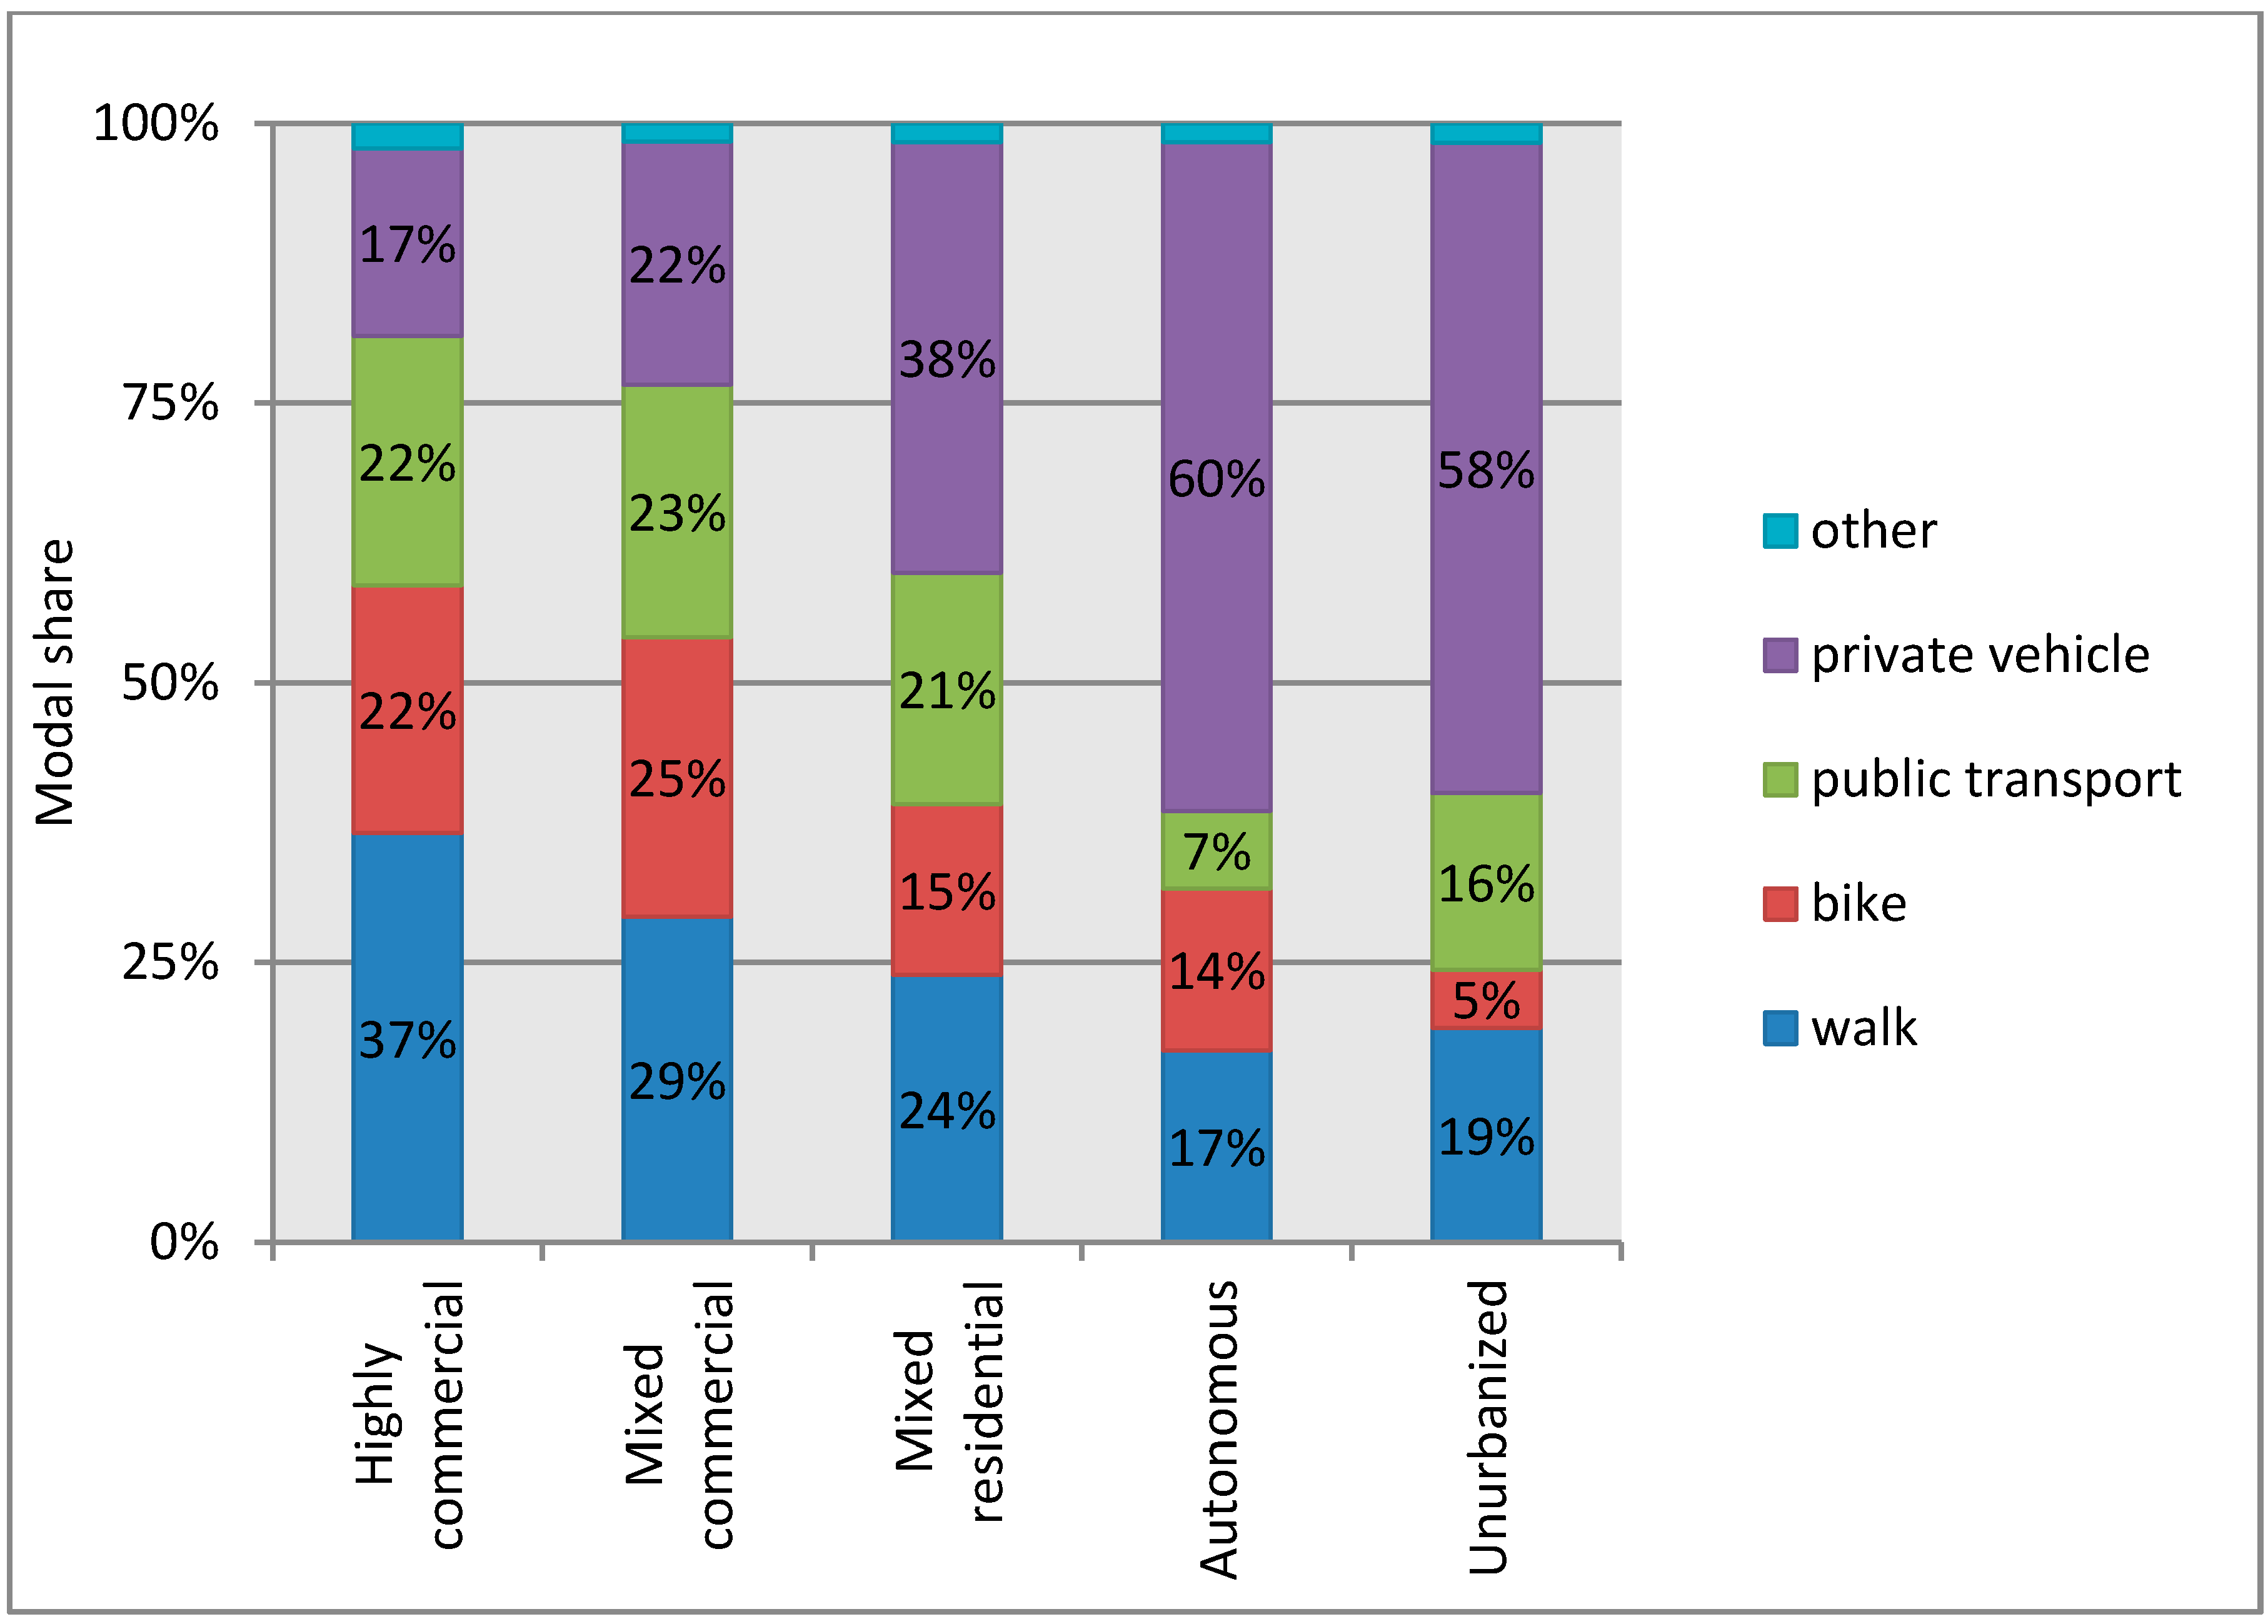
The findings suggest that car ownership is a stronger explanatory variable than the five built environment types. If the averages of active travel minutes by built environment type are compared, the differences in minutes of active travel between the most urbanized area (Highly commercial; 27.9 min) and each successive decrease in urbanization are respectively: −1.6 min (MC), −6.1 min (MR), −13.5 min (A), and −13.6 min (U). The largest step change is thus from Mixed residential (MR) area to the Autonomous (A). The latter was previously found to have the highest car use in the study area [
37]. Thus, it can be seen that a clear difference exists between the more urbanized areas and the two less developed areas. The distinctions likely relate to population and service densities, but also higher levels of service for public transit. The population density supports the service density in a mixed land-use planning system (see [
69]), while the public transit service levels support commuting and longer distance travel. The smallest impacts of car ownership on active travel minutes was observed in the two most urbanized areas (Highly and Mixed commercial).
The differences for car ownership from no car ownership (30.1 min) were: −8.55 min (1 car), −14.52 min (2 cars), and −19.11 min (3 or more cars). The impact of the car is likely related to personal preferences, so an individual who is less inclined (or less able) to take modes that would include active travel (including public transit) would be more likely to purchase a car. Thus, there is likely a combined effect of owning a car, which would reduce other mode use and an individual’s general likelihood to use those other modes. However, car ownership is related to household location with higher ownership in areas that are less urbanized [
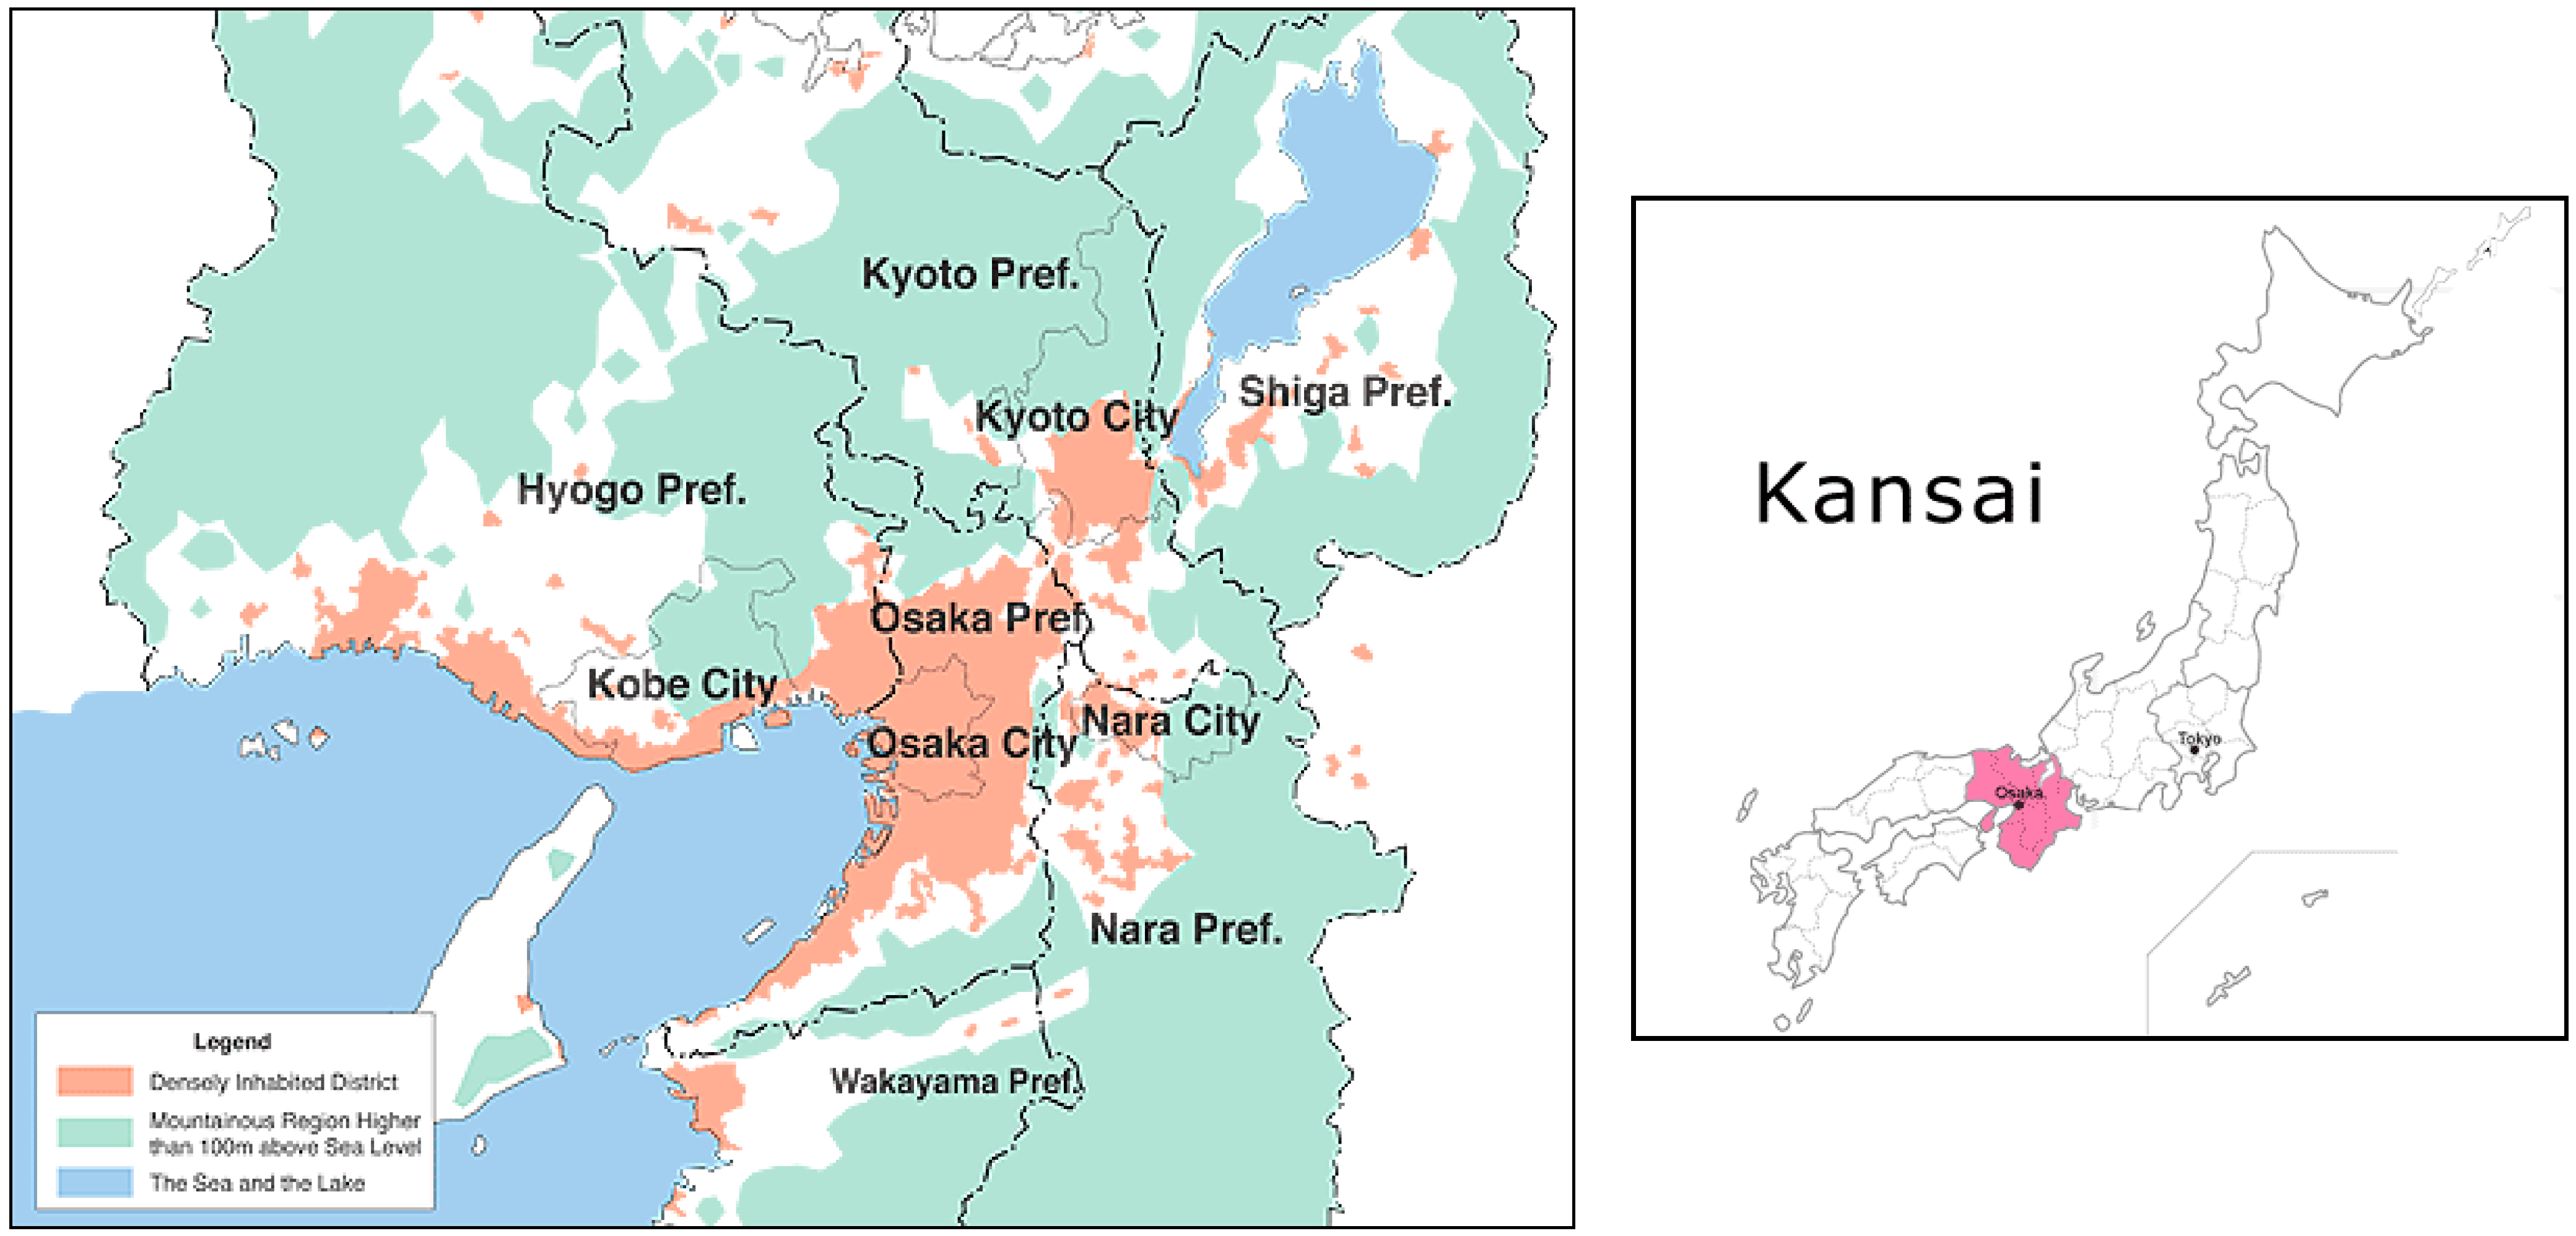
37] or farther from the main three cities of Kyoto, Kobe, and Osaka [
70]. If car ownership is to be limited, individuals require basic needs and services to be (easily) accessible by either active travel or public transport. That generally requires mixed land-use and a population density that can support local shops. Thus, although car ownership was a stronger explanatory variable, the built environment is a key means of supporting car free or low car ownership households.
In less dense areas (such as the Autonomous and Urbanized areas in this study), where being car-free is next to impossible, car-sharing programs might be part of the solution, maintaining flexibility and access to services while reducing car ownership. At the time of the data collection, such systems had not yet been introduced to the study area, so its impact cannot be seen here. Research has shown that car sharing programs lead to decreased car ownership and increased active travel [
71,
72]. The suggested explanation would be that when faced with the true costs of trips (costs of car-share trips usually involve a mileage fee), people tend to choose a cost effective mode of transportation (
i.e., walk or cycle for short trips and bus when available).
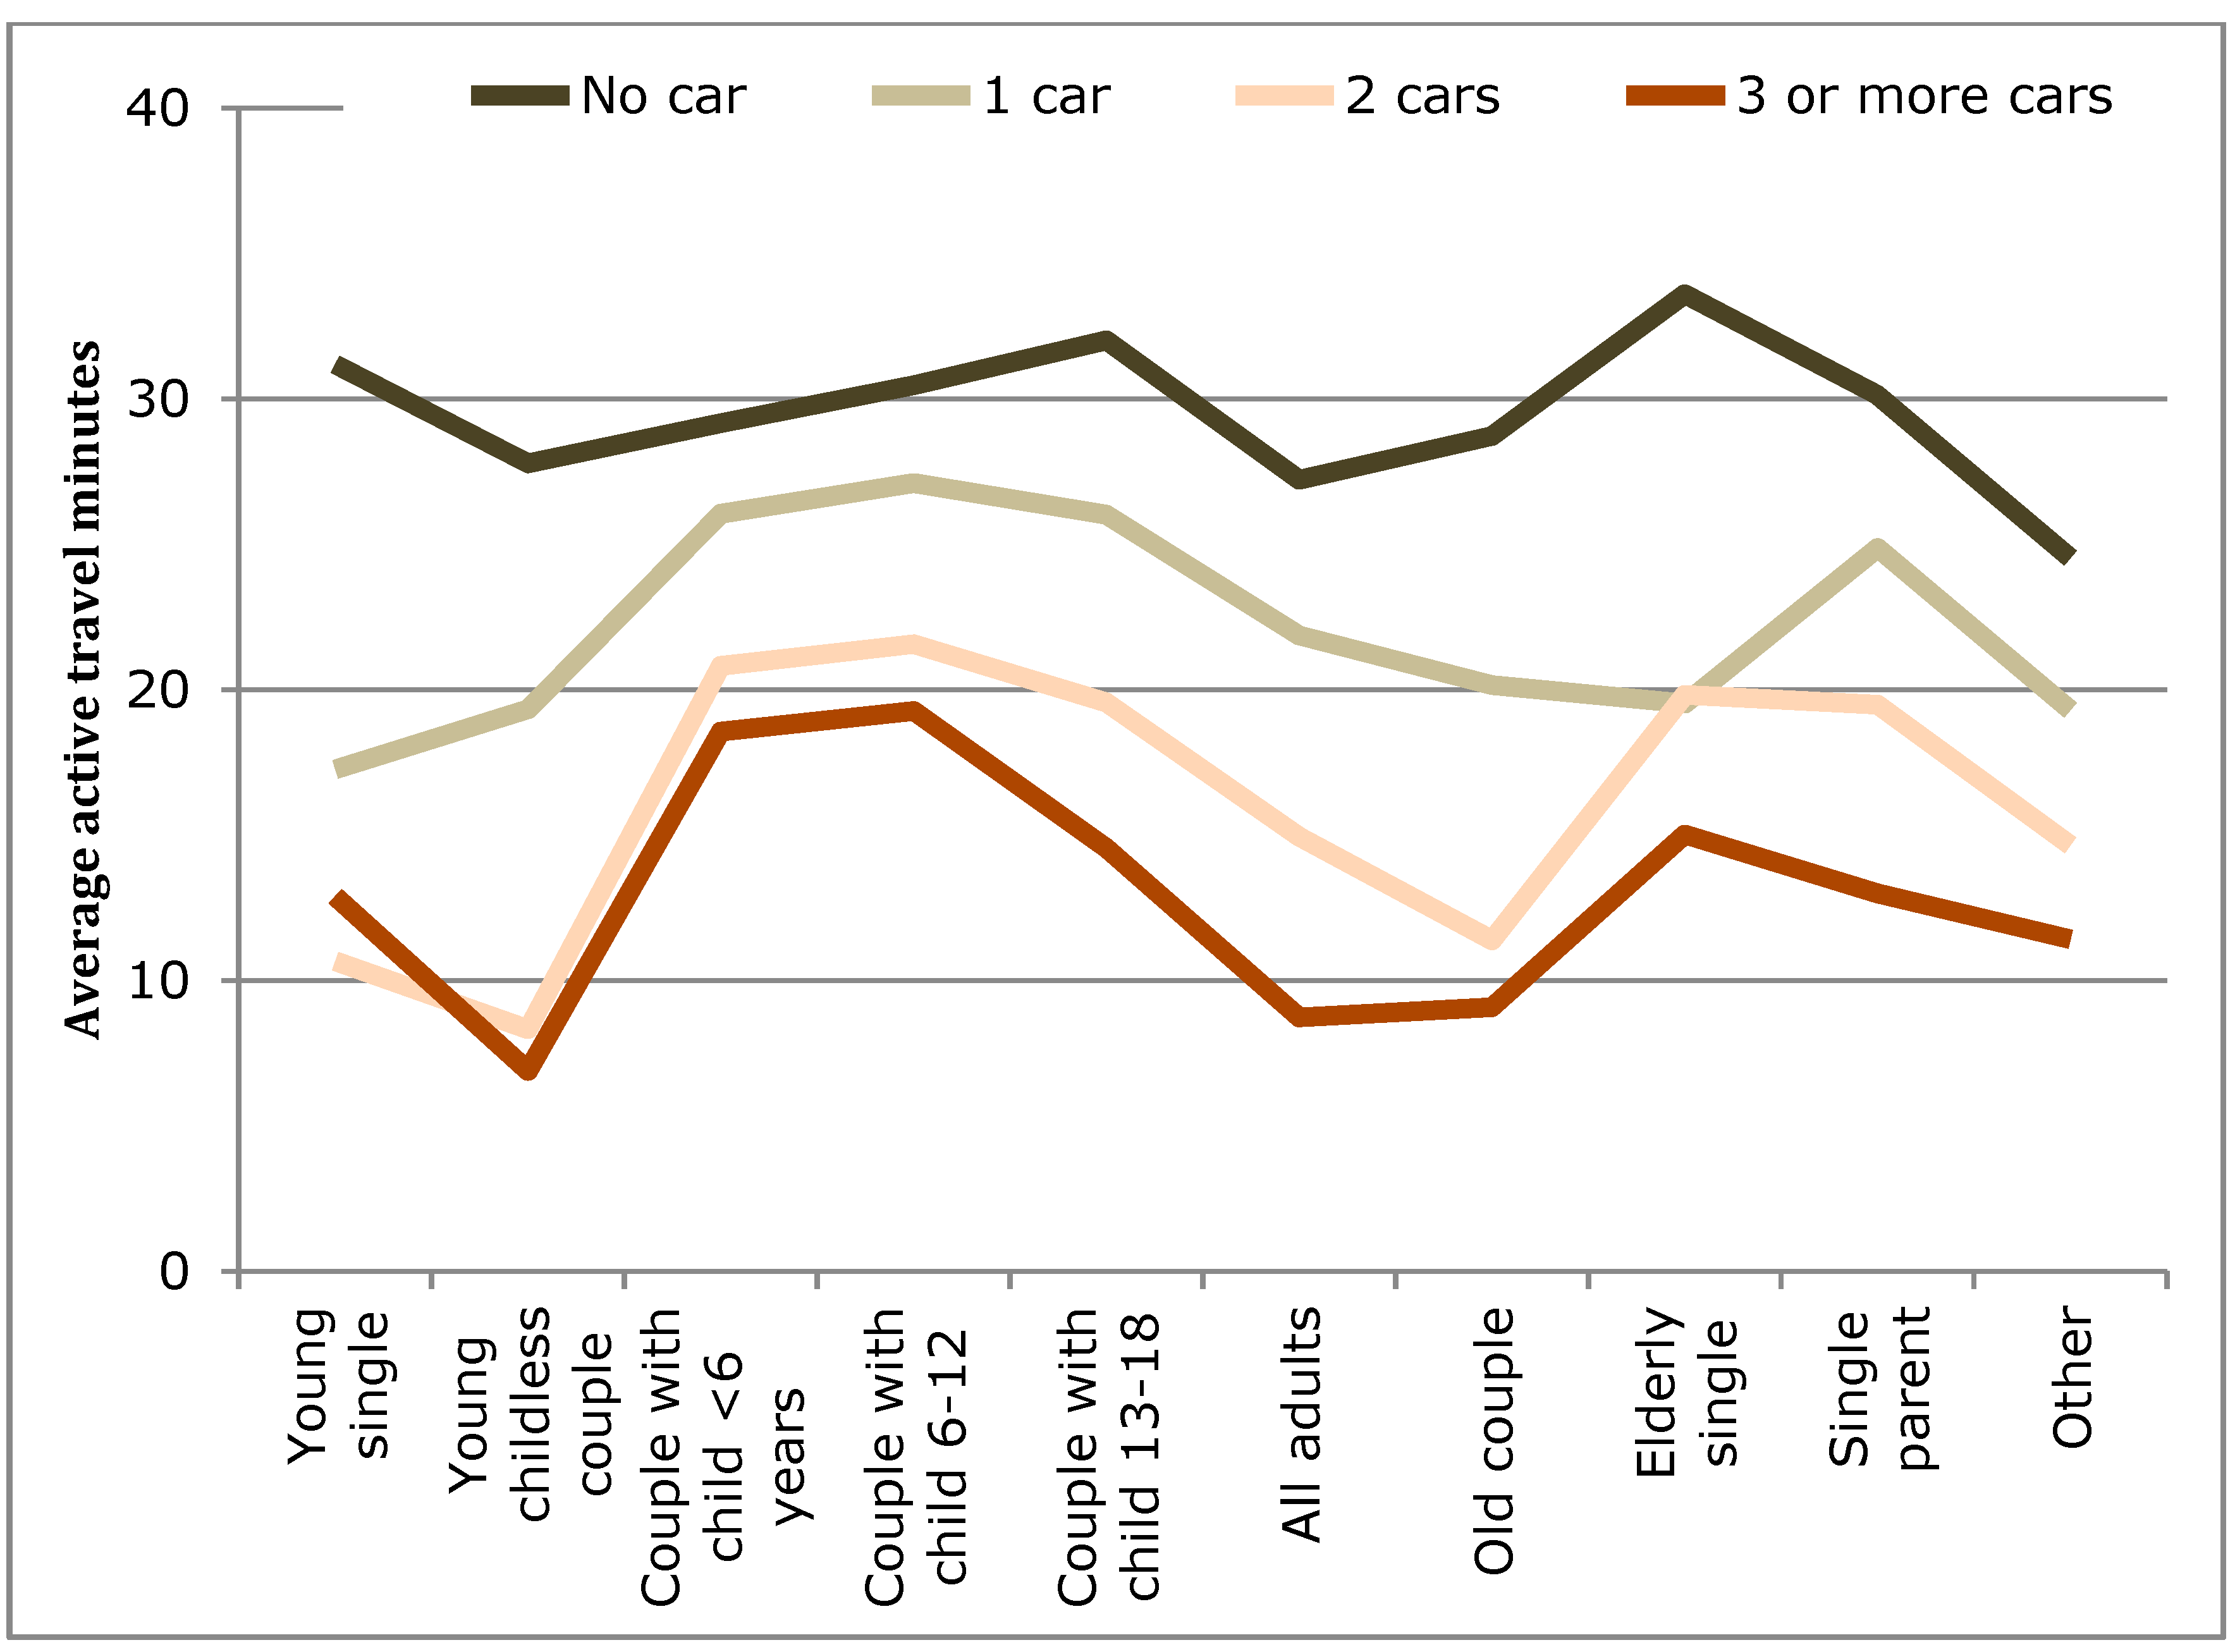
The household lifecycle stage (LCS) was found to influence active travel in a number of ways. When average AT minutes per household individual were examined (
Table 3) significant differences were found between the LCSs (
Figure 8). The peaks here were found for the elderly, single parents, young singles, and households with children. However, when children were accounted for in the analyses for the recommended measures of 10-min bouts (
Table 4 and
Table 5) and an accumulation of 30 min over a day, it was found children are achieving these targets, but they appear to have a negative influence on their parents. In fact, the greatest difference can be seen on single parents.
Other influences were examined as well. Women were found to be more likely than men to do 10-min bouts of active travel (25% more likely) and to accumulate 30 min of active travel (22% more likely). This was in-line with the findings by Fisherman
et al. (2015), but differed to findings in the U.S. [
73] and in Australia [
74]. Children were found here to be much more likely than adults to achieve 10-min bouts (5 times) and accumulate 30 min (4 times). Previous studies focused on adults, so it is not possible to make a comparison, though as previously shown by Waygood [
75] and Susilo and Waygood [
61] children in this area do not use private transportation often during the week.
The results of the household lifecycle stage suggest that the children’s age is also an important consideration. Many studies simply contain a binary variable for the presence of a child without consideration to the differences between an infant, a child who is beginning to have autonomy (e.g., able to travel without an adult), and an autonomous child. The results of this paper (in particular
Table 4) suggest that increasing children’s autonomy could increase parents’ active travel.
The World Health Organization’s (WHO) Health economic assessment tool (HEAT) [
76] can be used to measure the impact of active travel for a reduction in mortality risk (and economic impact as well, though not included here). The tool works on a dose-response relationship and takes into consideration both positive impacts (e.g., physical activity) and negative consequences (e.g., breathing in air pollution and potential road traffic collisions) [
77]. Evidence for morbidity is more limited, so a mortality measure (the risk of death) is applied which likely results in a more conservative estimation of the benefits that are disease-related Morbidity would include benefits such as mental health, energy balance, and musculosketal health, however the evidence is currently insufficient so the WHO HEAT tool only calculates the reduction in mortality risk.
The reductions in the risk of mortality to the population for this study are shown by built environment (
Table 6) and by car ownership (
Table 7) for each lifecycle stage. This is calculated using the HEAT online tool for walking [
78] based on the daily duration of active travel. This appears to be a more conservative estimate as the numbers were estimated using the HEAT online tool for cycling assuming only travel on weekdays, and the reduction in the risk of mortality is slightly increased. As can be seen, the average reductions for the urban areas
versus the more car-oriented areas are similar to the average reductions for no car ownership and two-car ownership. The average active transport by households with three or more cars shows the lowest reduction. To put this in perspective, the WHO found that for developed countries, the mortality risk factor of overweight in 2000 was 9.6% and 11.5% for men and women respectively (WHO, [
79]). In the entire list only a few attributes had higher mortality risk factors: blood pressure (20.1% men and 23.9% women), tobacco (26.3% men and 9.3% women), and cholesterol (14.5% men and 17.6% women). Physical inactivity was 6.0% and 6.7% for men and women, respectively. All of the remaining attributes were much smaller (apart from alcohol for men which was 8%).
Table 6.
Reduction in the risk of mortality to the population shown by built environment and lifecycle stage.
Table 6.
Reduction in the risk of mortality to the population shown by built environment and lifecycle stage.
| Household Lifecycle Stage | Highly Commercial Pop. 446,214 | Mixed Commercial Pop. 5,236,070 | Mixed Residential Pop. 11,204,440 | Autonomous Pop. 1,136,635 | Unurbanized Pop. 141,000 |
|---|
| Young single | 14.00 | 14.00 | 11.00 | 7.00 | 5.00 |
| Young childless couple | 11.00 | 10.00 | 8.00 | 3.00 | 7.00 |
| Couple with child <6 years | 12.00 | 12.00 | 11.00 | 10.00 | 10.00 |
| Couple with child 6–10 | 12.00 | 12.00 | 12.00 | 10.00 | 11.00 |
| Couple with child 11–20 | 13.00 | 13.00 | 11.00 | 8.00 | 8.00 |
| All adults | 11.00 | 10.00 | 8.00 | 4.00 | 5.00 |
| Old couple | 13.00 | 12.00 | 10.00 | 6.00 | 6.00 |
| Elderly single | 16.00 | 15.00 | 14.00 | 12.00 | 11.00 |
| Single parent | 14.00 | 13.00 | 12.00 | 10.00 | 8.00 |
| Other | 9.00 | 10.00 | 8.00 | 5.00 | 5.00 |
| Average | 13.00 | 12.00 | 10.00 | 7.00 | 7.00 |
Table 7.
Reduction in the risk of mortality shown to the population by car ownership and lifecycle stage.
Table 7.
Reduction in the risk of mortality shown to the population by car ownership and lifecycle stage.
| Household Lifecycle Stage | No Car | 1 Car | 2 Cars | 3 or More Cars |
|---|
| Young single | 14.00 | 7.00 | 5.00 | 5.00 |
| Young childless couple | 13.00 | 8.00 | 4.00 | 3.00 |
| Couple with child <6 years | 13.00 | 12.00 | 9.00 | 8.00 |
| Couple with child 6–10 | 14.00 | 12.00 | 9.00 | 8.00 |
| Couple with child 11–20 | 14.00 | 12.00 | 8.00 | 7.00 |
| All adults | 12.00 | 10.00 | 7.00 | 4.00 |
| Old couple | 13.00 | 8.00 | 5.00 | 4.00 |
| Elderly single | 15.00 | 8.00 | 8.00 | 7.00 |
| Single parent | 14.00 | 11.00 | 8.00 | 5.00 |
| Other | 11.00 | 8.00 | 7.00 | 5.00 |
| Average | 14.00 | 9.00 | 7.00 | 5.00 |
The Health economic assessment tool (HEAT) can be used to aid in cost-benefit analysis [
78]. As an example of a financial impact of a switch from car use to cycling for a 5 km trip, Rabl and De Nazelle [
80] found that the physical health benefits to the individual would be 1300 euros/year, and in a large city the reduction in air pollution would be an additional 30 euros/year. The negative impact of increased inhalation of air pollution would be roughly 20 euros/year, and the risk of collision varies significantly by context, but estimations are that the impacts would be an order of magnitude smaller than the benefits. For countries where cycling is common such as the Netherlands and Denmark, there appears to be an effect of either safety in numbers or general familiarity by drivers to cyclists [
80]. Cycling in Japan is not associated with the majority of crashes, and even for youth where it is associated with more crashes, motorized modes have a greater association to fatalities [
75,
81].
Related to the household type (e.g., lifecycle stage), one observation can be made from
Figure 8 and
Figure 9. Children and elderly were more likely to walk than adults. This is consistent with published work on children’s travel in Japan where nearly all elementary-aged children walk to school [
62] and are generally independent of parents [
82]. For children in middle and high school years, a combination of walking, cycling, and public transport use is the most common [
61].
Mental health benefits are more difficult to determine at this point. Active commuting and public transit use were found to have significant associations with overall psychological well-being [
11]. Further, subjective well-being as a measure for how individuals evaluate their lives [
83] finds that social relationships are an important explanatory variable and it has been hypothesized that walking contributes to building relationships and social capital, and recent findings suggest that at least for children this may be true. Thus, the benefits of active travel may not be fully appreciated in tools such as the WHO’s HEAT and more research is required to substantiate such potential advantages.
This paper did not examine the overall physical activity (PA) that individuals are achieving. In some research out of Asia, PA from transportation was not associated with environmental correlates for middle-aged adults [
39], but more urban areas were associated with greater overall PA. In the same area of Japan as this study effort, the number of vigorous physical activities recorded with a travel dairy did not significantly vary over four built environment types of central city, mixed-residential, town, and rural [
62]. That paper found that children in the less urbanized areas were on average gaining more physical activity through active travel with the explanation given as all children walk to school, children in less urbanized areas will walk for longer distances.
For trip duration, data from GPS systems would be more accurate, but it is unlikely that one could achieve sufficient information for a representative population that would allow for the analysis done here (five built environments × 11 life cycle stages × multiple car ownership levels). However, studies with GPS systems that show the biases can help with interpretation. For example, [
84] found that nearly about 60% of trips are accurately reported with ±2 min should by in a household travel survey as compared to GPS results. About 20% were off by more than ±5 min. The majority (52%) of errors estimated longer durations
versus 27% under-estimation. That study did suggest that the duration of car trips was over-estimated as compared with walking trips which would suggest that for this study, the results are likely fairly accurate.


