Abstract
This study used two kinetic mechanisms to evaluate the oxidation processes of NO and SO2 by ozone. The performance of the two models was assessed by comparisons with experimental results from previous studies. The first kinetic mechanism was a combined model developed by the author that consisted of 50 species and 172 reactions. The second mechanism consisted of 23 species and 63 reactions. Simulation results of both of the two models show under predictions compared with experimental data. The results showed that the optimized reaction temperature for NO with O3 ranged from 100~200 °C. At higher temperatures, O3 decomposed to O2 and O, which resulted in a decrease of the NO conversion rate. When the mole ratio of O3/NO was greater than 1, products with a higher oxidation state (such as NO3, N2O5) were formed. The reactions between O3 and SO2 were weak; as such, it was difficult for O3 to oxidize SO2.
1. Introduction
Air pollution is now one of the most serious environmental problems worldwide. The flue gas of coal-fired power plants usually contains fine particles such as SO2, NOX and mercury [1,2]. Although China is a country with many coal-fired power plants, emission standards have been strengthened in recent years [3]. Pollution control systems are required in order to meet these newer strict emission regulations. Conventional coal-fired power plants usually combine multiple single pollutant control facilities for emission control purposes. In recent years, various kinds of technologies have been developed to reduce worldwide SO2 and NOx emissions [4,5,6]. In order to remove SO2, several wet desulphurization technologies, including the calcium-gypsum process, magnesium oxide scrubbing and the double alkaline process have been widely applied in coal-fired power plants. Typically, one of these three methods is adopted to achieve NOx emission control [7,8]. These methods include Low-NOx burner technology (used to reduce the formation of NOx in the furnace), Selective Catalytic Reduction (SCR) technology and Selective Non-Catalytic Reduction technology (SNCR).
A multi-pollutant control system is defined as: a system that can remove two or more of the principle regulated pollutants (SO2, NOx particulate matter, mercury and CO2) in a single reactor or a single system designed for control purposes [9]. Numerous simultaneous removal techniques have been previously investigated [10,11], including the dry absorption method [12], the electron beam process [13] and the wet oxidation method [14]. In the wet oxidation method, various oxidation agents are used to oxidize NOx and SO2, including chlorine dioxide [15], sodium chlorite [16], hydrogen peroxide [17] and ozone [18,19]. As a stable molecule, O3 is a potentially useful oxidant in practical applications. O3 is generated in a non-thermal plasma reactor and then injected into the flue gas duct or a NOx reactor. NOX and SO2 are then oxidized into higher oxides and mercury is able to be oxidized into mercury oxide. Numerous studies have investigated the O3 oxidation of flue gas [20,21,22,23,24,25,26]. These studies demonstrated that ozone could be an efficient oxidizing agent for the oxidation of NO. Wang et al. experimentally investigated the simultaneous removal of NOx and SO2 in the nitrogen flow of a narrow reactor by ozone injection [20]. The results showed that the injection of ozone could simultaneously react with both NO and SO2, with NO being oxidized to a higher oxidation state. Also, in this study, the optimal temperature for NO oxidation of 473 K was suggested. Sun et al. studied the O3 oxidation processes of NO and SO2 using an in situ IR spectrometer [21]. Experimental results showed that the O3 concentration and the reaction temperature played critical roles in the O3 oxidation process of NO. When the molar ratio of O3/NO was greater than 1, the oxidation products were NO2, N2O5 and HNO3; however, O3 did not significantly oxidized SO2 for that this reaction has high energy barrier. Skalska et al. investigated the intensification of the NOx absorption process by means of ozone injection into the exhaust gas stream; results showed that, due to oxidation, the efficiency of the NOx absorption was much higher than without the ozone injection [22], the reason is that NO could be efficiently oxidized by O3 into NO2 and other products of higher oxidation state of NO, these products are water-soluble and can be absorbed by alkaline solution. Mok proposed a two-stage process consisting of an ozonizing chamber and an absorber containing a reducing agent solution. The injection of ozone led to rapid oxidation of NO to a higher oxidation state and NOx removal was achieved by absorption using sodium sulfide along with the removing of SO2 [23]. Sun et al. studied the simultaneous absorption process of NOx and SO2 from flue gas with a pyrolusite slurry combined with a gas-phase oxidation of NO using ozone [24]. The results revealed that ozone could oxidized NO to NO2 with a high degree of efficiency. The MnO2 in the pyrolusite slurry oxidized SO2 and NO2 into MnSO4 and Mn(NO3)2, respectively, in the liquid phase.
Due to a lack of kinetic models, previous studies rarely provided a detailed chemical process of NO and SO2 oxidization by O3. As such, the interactions of NO and SO2 during the oxidation process have not been fully investigated. This paper focuses on the chemical process in its presentation of a detailed study on the kinetic mechanisms of the oxidation of NO and SO2 by O3. Based on the findings, the optimized reaction conditions for the practical application of O3 injections for multi-pollutant controls in coal-fired power plants are provided. In particular, this study considers two mechanisms in order to evaluate the oxidation process. The performance of the two mechanisms are first assessed by comparisons with experimental data from Mok et al. [25] and Stamate et al. [26]. The oxidation of NO and SO2 by O3 are then discussed by comparisons of simulation results with experimental results from Wang et al. [27] (in Chinese) and Wang et al. [28] (in Chinese). Next, further insights are provided into the kinetic mechanisms that control the oxidation process of NO and SO2 with O3.
2. Experimental Setup
A multi-layers plug-flow quartz reactor was used for the experiment setup [20]. The experiment apparatus consisted of ozone generation, a quartz flow reactor, an O3 analysis system and an online gas analysis system (Figure 1).

Figure 1.
Schematic diagram of the experimental apparatus [20].
Figure 1.
Schematic diagram of the experimental apparatus [20].
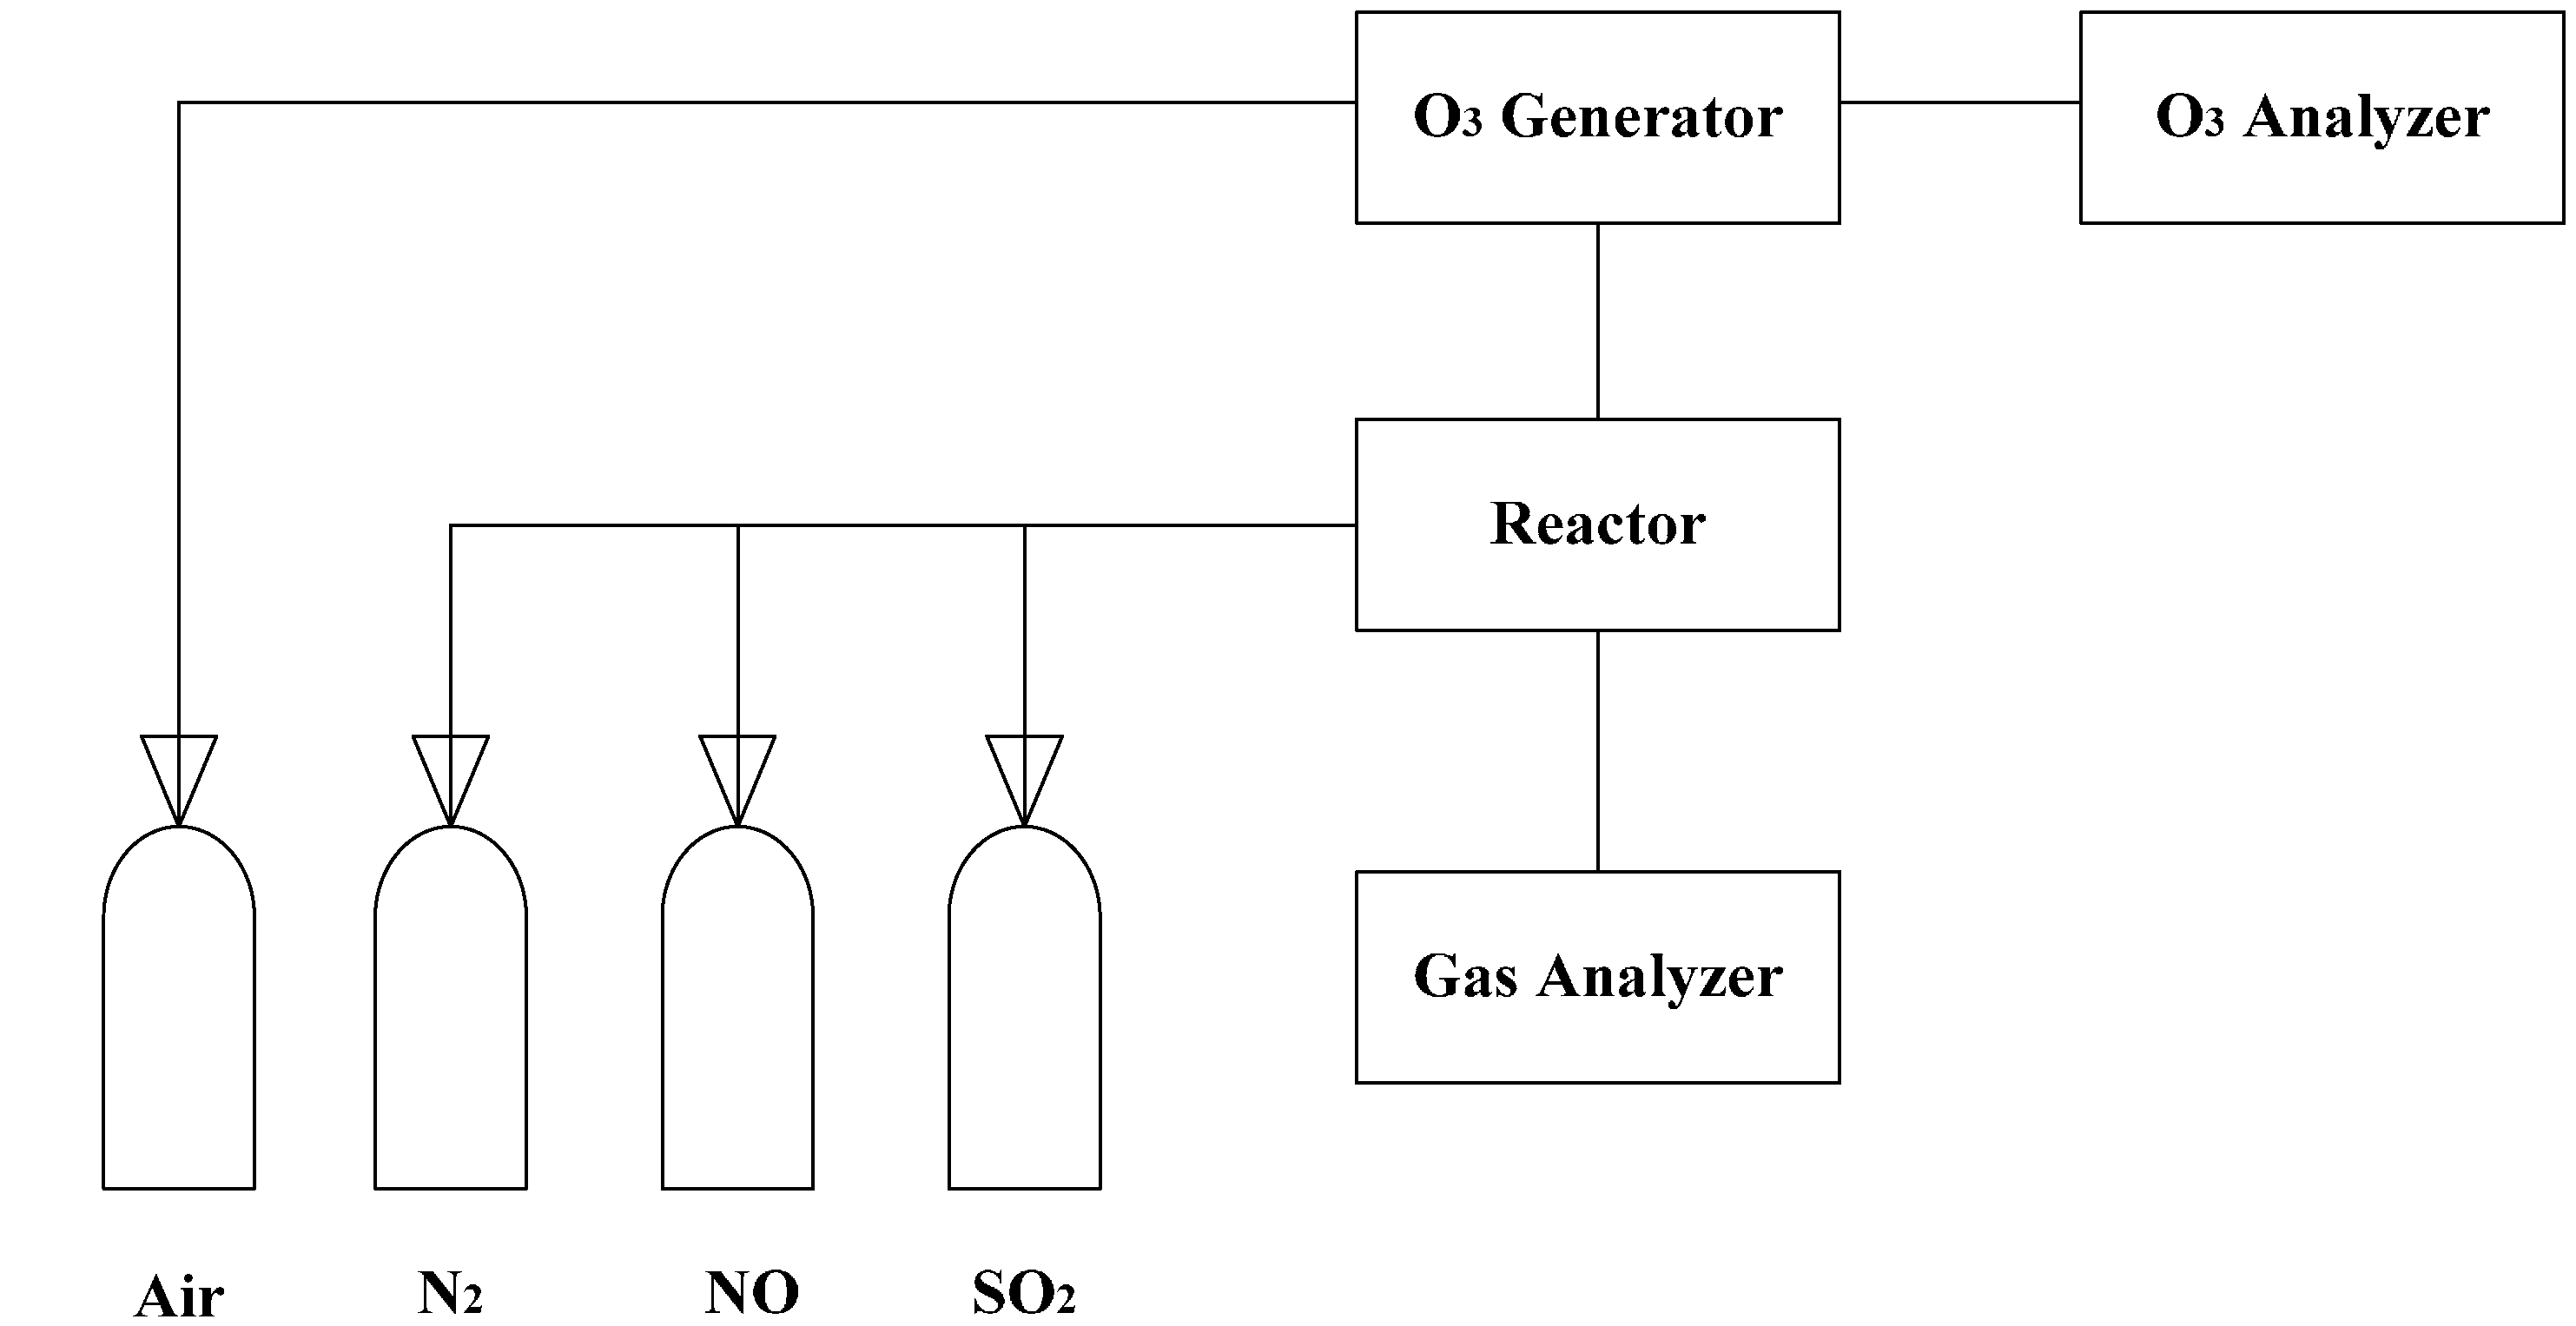
The oxidation reactions occurred in the quartz flow reactor, as shown in Figure 2. A special delicate flow reactor (with a three-channels homocentric reaction tube) was designed and made by quartz glass in order to reduce the impact of the non-uniform temperature profile of the furnace. The reactor had a total length of 642 mm and an outer-diameter of 20 mm. The heating length of the electric furnace was 600 mm. The reactions occurred in the center tube. The tube had an inside diameter of 5 mm and a length of 100 mm. The center tube was surrounded by O3, and the temperatures of O3 and the mixtures in the center tube were identical, thus it could be considered that there was no heat transfer between the center tube and outside. Therefore, the center tube was treated as an isothermal reactor. The NO/SO2/N2 mixtures entered the reactor through inlet 2 and then passed through a reciprocating preheating channel before entering the center tube. O3 was generated in the ozone generator; it then flowed into the reactor through inlet 1 where it was heated by a separate preheating channel. The two well-preheated streams instantly mixed with each other at the nozzle of center tube.
The ozone was generated by a dielectric barrier discharge (DBD) device with 3.7–4 kVAC voltage and 5 kHz (model CF-G-3-010G). The output concentration of O3 was continuously monitored by an ozone analyzer. The simulated flue gas was prepared by N2 and small amount of concentrated NO gas and SO2 gas. Oxygen was not absent in the main flow in these experiments. The flow rate of the gas was all controlled by mass flow controller [20]. The total flow rate of all reactants, including O3 and simulated flue gas, were fixed to 1000 mL/min. The residence time in the center tube ranged from 0.049‒0.089 s and varied with temperature (calculated by 33.3 K/T s).
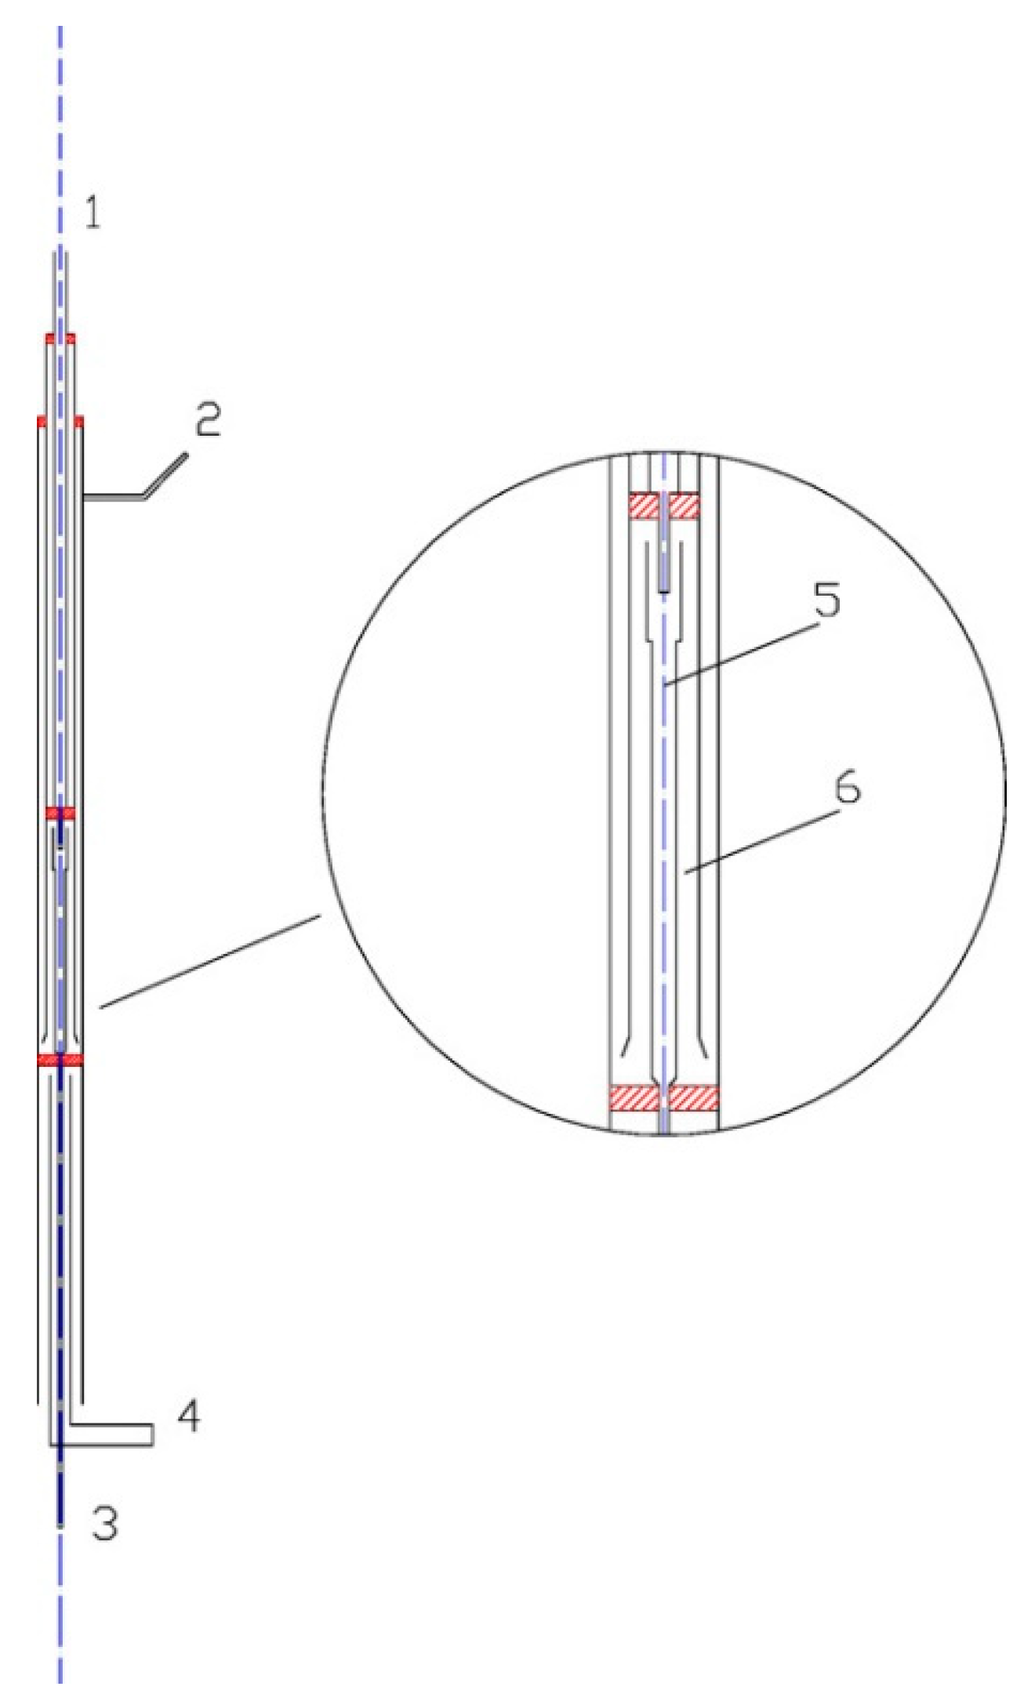
Figure 2.
Schematic of the quartz flow reactor. (1) Inlet 1; (2) Inlet 2; (3) Outlet; (4) Air cooling; (5) Quartz flow reactor; (6) Preheat channels [20].
Figure 2.
Schematic of the quartz flow reactor. (1) Inlet 1; (2) Inlet 2; (3) Outlet; (4) Air cooling; (5) Quartz flow reactor; (6) Preheat channels [20].
3. Kinetic Modeling and Numerical Simulation Methodology
3.1. Kinetic Mechanism Description
This study used two kinetic mechanisms to model the oxidation process of NO/O3, SO2/O3 and NO/SO2/O3. The first kinetic mechanism is a combined model developed by the author, consisting of 50 species and 172 reactions (Model I). Model I considered three kinds of reactions: NO/O3 reactions (referenced in Wen et al. [29]); SO2/O3 reactions (referenced in Wang [28]); and NO/SO2 reactions (referenced online [30]). The second kinetic mechanism was developed by Sun et al. [21] based on the situ IR spectrometer measurements. It consisted of 23 species and 63 reactions (Model II). Table 1 shows the key reactions and parameters for Model I and Model II. The key reactions of the two models were identical and the parameters were different. The supplementary file lists the other reactions of the two models. Most of the reactions of the two models were different. For example, there were 112 reactions to describe the oxidation process of SO2 and SO2/NO in Model I and 8 reactions for Model II.

Table 1.
Comparisons of parameters for key reactions of Model I and Model II.
| Reactions | Model I | Model II | ||
|---|---|---|---|---|
| A (cm3/mol-s) | Ea (cal/mol) | A (cm3/mol-s) | Ea (cal/mol) | |
| O3 + NO = NO2 + O2 (R1) | 1.8E + 12 | 2722 | 8.43E + 11 | 2605 |
| O3 + NO2 = O2 + NO3 (R2) | 7.22E + 10 | 4870 | 8.43E + 10 | 4913 |
| O3 + SO2 = O2 + SO3 (R3) | 1.81E + 12 | 13,910 | 1.81E + 12 | 13,923 |
| O3 = O2 + O (R4) | 2.0E + 15 | 23,250 | 4.31E + 14 | 22,277 |
| O3 + O = O2 + O2 (R5) | 4.82E + 12 | 4093 | 4.82E + 12 | 4098 |
Model I is a detailed mechanism in which the three kinds of reactions are validated by experimentation [28,29,30]. Model II is relatively small and can reduce computational costs when used for predictions. The differences in the reaction parameters may be the result of differences in the reaction paths and, therefore, the prediction results. The following sections address this matter in further detail.
3.2. Simulation Strategy
The present kinetic calculations were performed using the Plug Flow Reactor (PFR) computer code [31] which was used to predict the oxidation process of NO/O3, SO2/O3 and NO/SO2/O3 in a multi-layers plug-flow quartz reactor. The PFR model was used to describe a suitable steady-state, tube flow reactor for process design, optimization and control. The mixing in the axial flow direction was ignored, but perfect mixing in the directions transverse to this were taken into account for the PFR models. Thermodynamic curve fits were obtained from the National Institute of Standards and Technology chemical species database [32].
The gaseous mixtures were introduced into the PFR at 101.3 kPa. The starting point of the distance was x = 0. In Section 4.1, the initial NO concentration, the molar ratio of NO/O3 and the temperature were maintained in accordance with experiments from Mok et al. [25] and Stamate et al. [26], detailed experimental conditions are introduced in Section 4.1. In Section 4.2 and Section 4.3, the diameter and the length of the PFR reactor were kept at 5 mm and 100 mm. The residence time were ranged from 0.049‒0.089 according to different temperatures. In Section 4.1, the initial NO concentration, the molar ratio of NO/O3 and the temperature were maintained in accordance with experiment [27]. Regard to the discussion of temperature effect on the NO conversion rate, the initial NO concentration was 300 ppm, O3/NO mole fraction was 1.0, the residence time was kept at 1 s. Regard to the discussion of the effect of the molar ratio of O3/NO on reaction products, the temperatures were kept at 100 °C and 200 °C respectively, the initial NO mole fraction was maintained at 300 ppm, O3/NO mole fraction was 1.5 and 2.0, the residence time was kept at 1s. In Section 4.3, the initial SO2 concentration, the molar ratio of SO2/O3 and the temperature were maintained in accordance with experiment [28]. In Section 4.4, the O3/NO/SO2 mole fraction was 2:1:1 and the initial concentration of NO and SO2 was 300 ppm.
4. Results and Discussion
4.1. Model Validation
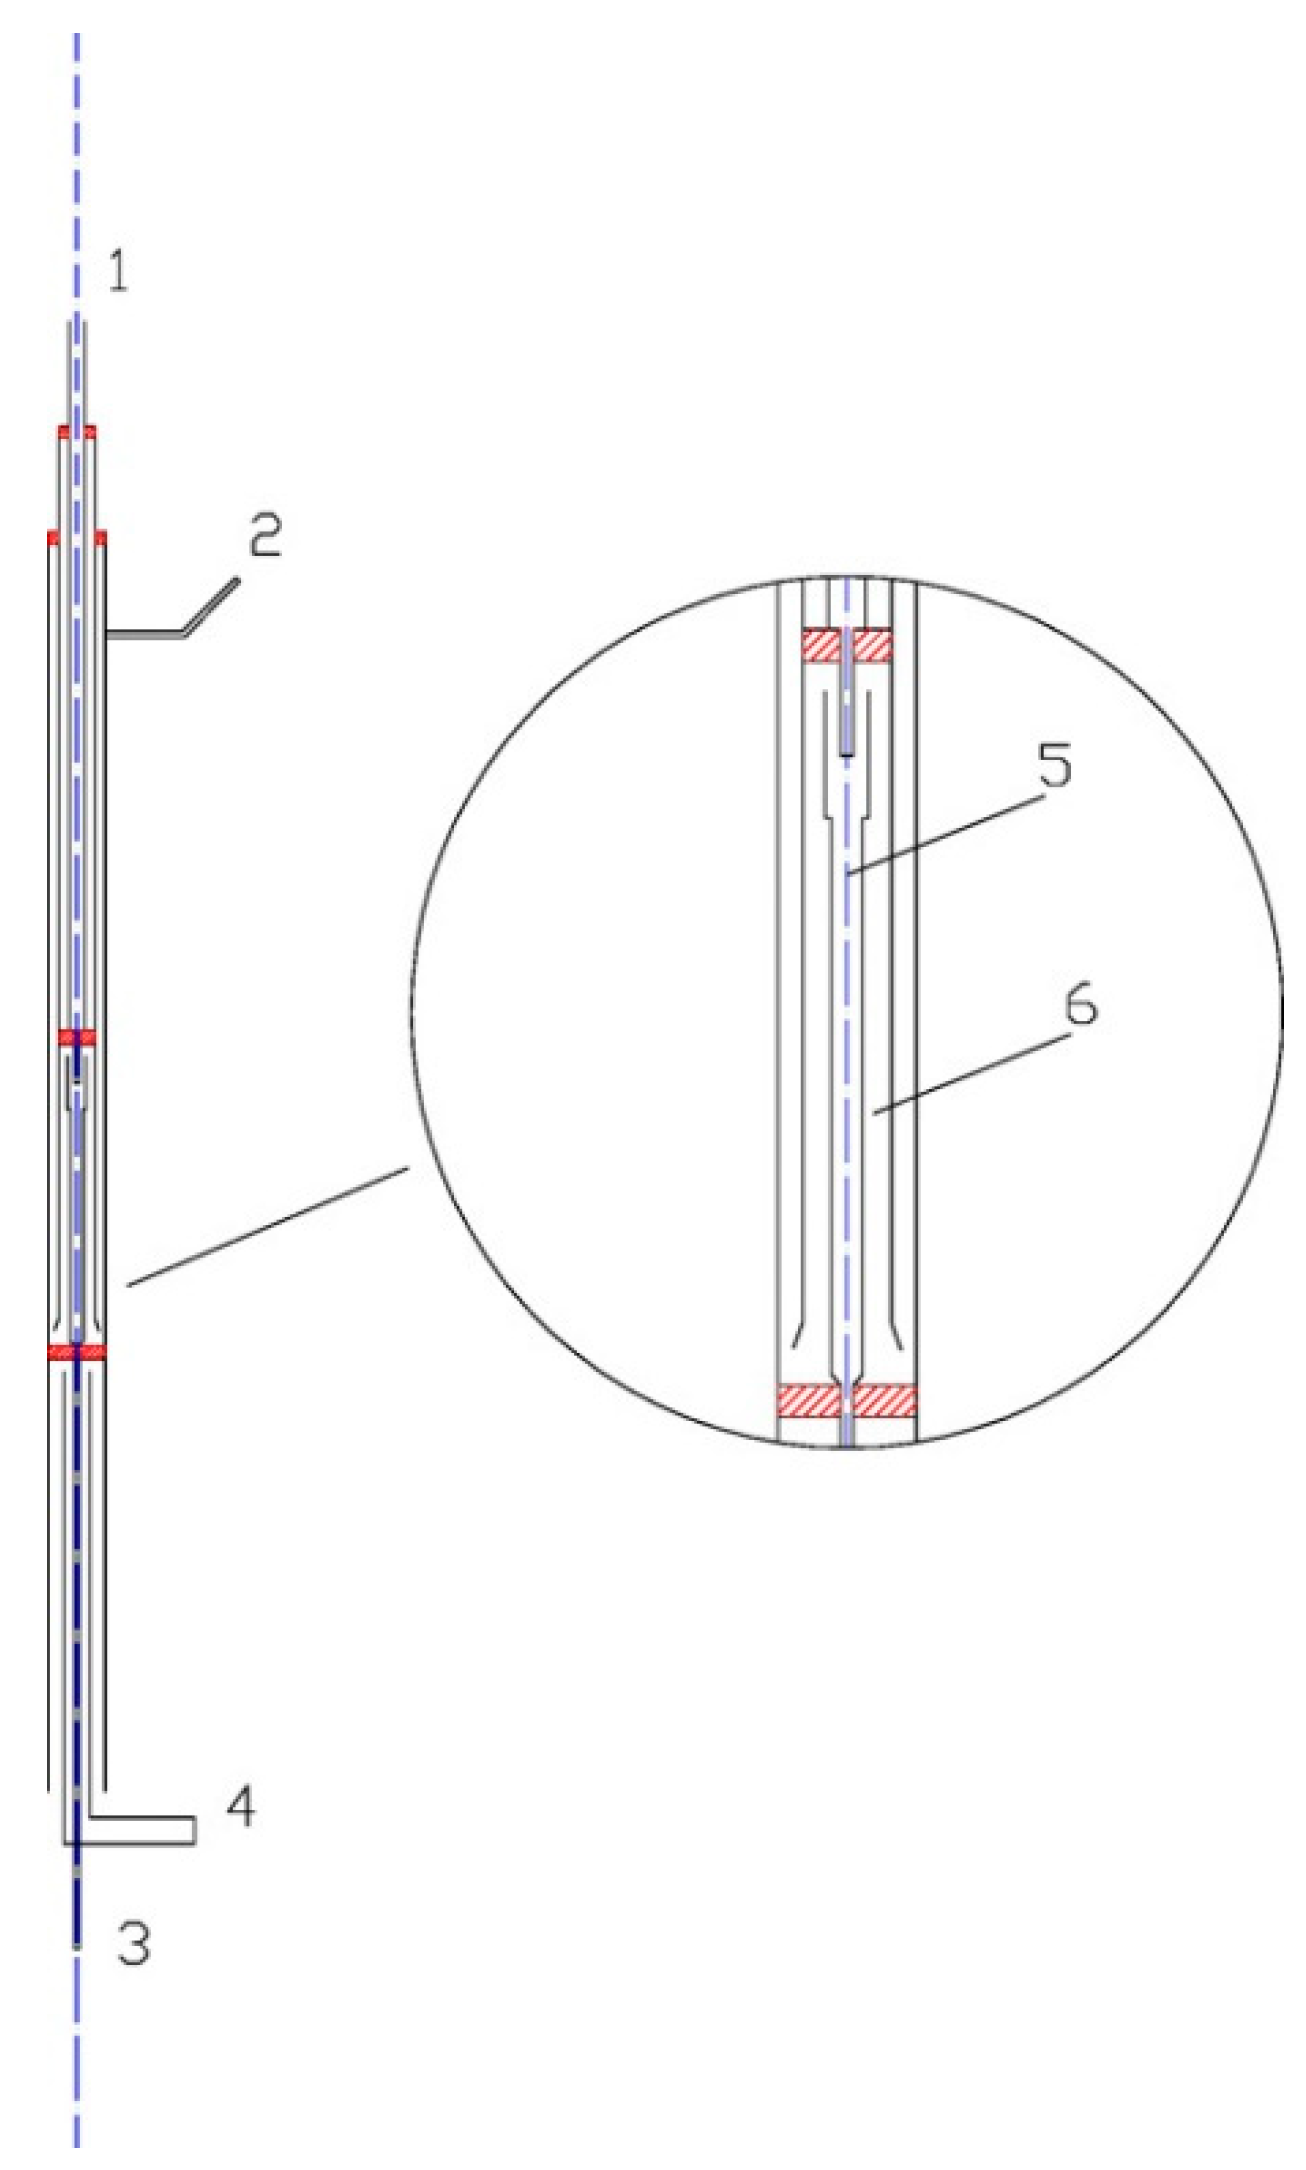
The two kinetic models are first validated with the published experimental results. Figure 3 depicts the comparison of predicted results with the experimental data of NO2 concentration from Mok et al. [25] and Stamate et al. [26]. The experiments in Ref. [25] were conducted in an ozonizing chamber. O3 produced in a DBD device was continuously fed to the ozonizing chamber to convert NO into NO2. The exhaust gas was prepared by mixing air and small amounts of concentrated NO gas balanced with N2. The residence time was kept at 2.9 s. In Ref. [26], a 4.5 m long and 0.6 m in diameter reactor with a residence time of the flue gas of about 5 s was used to oxidize the NO. NO2 in the reactor were measured by FTIR. As shown in Figure 3, the numerical simulation results calculated by the two models were lower than those of the experimental results. The NO2 concentrations first increased and then decreased. Where the molar ratio O3/NO equaled 1.0, the concentration of NO2 reached a maximum value. This is in accordance with previous findings [33]. Skalska et al. investigated the mole concentration of products at different O3/NO mole fractions experimentally [33], results revealed that if the molar ratio of O3/NO is higher than 1.0, NO2 will react with O3 and generate higher nitrogen oxides, NO3. Also, N2O5 is formed as a result of the reaction of NO2 with NO3. The under-predictions of simulations shown in Figure 3a,b are probably caused by both the experimental uncertainties and the estimation uncertainties of reaction parameters in the reactions of the two kinetic models. More work is necessary to be conducted on the kinetic modeling in the future.
Figure 3.
Comparison of predicted results with experimental data. (a) Initial NO: 280 ppm, NO2: 20 ppm, 25 °C; (b) Initial NO: 80 ppm, 40 °C.
Figure 3.
Comparison of predicted results with experimental data. (a) Initial NO: 280 ppm, NO2: 20 ppm, 25 °C; (b) Initial NO: 80 ppm, 40 °C.

4.2. NO Oxidation by O3
Figure 4 depicts the concentrations of NO obtained by varying the O3/NO concentrations at temperature T = 100 °C. Here, the O3/NO concentrations ranged from 0.0 to 1.1. Figure 4 also provides comparisons of the experimental data [27] and simulation results with Model I and Model II. The NO concentration decreased as the O3/NO concentrations increased. Where the O3/NO concentration was less than 1.0, O3 reacted with NO via O3 + NO = NO2 + O2 (R1) and generated NO2. This conclusion is also confirmed by Figure 3a, as shown in Figure 3a, NO2 was first increased as NO decreased, which proved that R1 plays an important role in the process of NO oxidation. Higher nitrogen oxides were more difficult to form because there was not enough O3 to react with NO2. For O3/NO, the concentration was 1, the experiment determined the NO concentration as 56 ppm and the simulation results of Model I and Model II were 48 ppm and 25 ppm, respectively. Hence, at T = 100 °C, the effect of the O3 injection into NO was that O3 could provide stronger oxidization help to transform NO into a higher oxidation state.
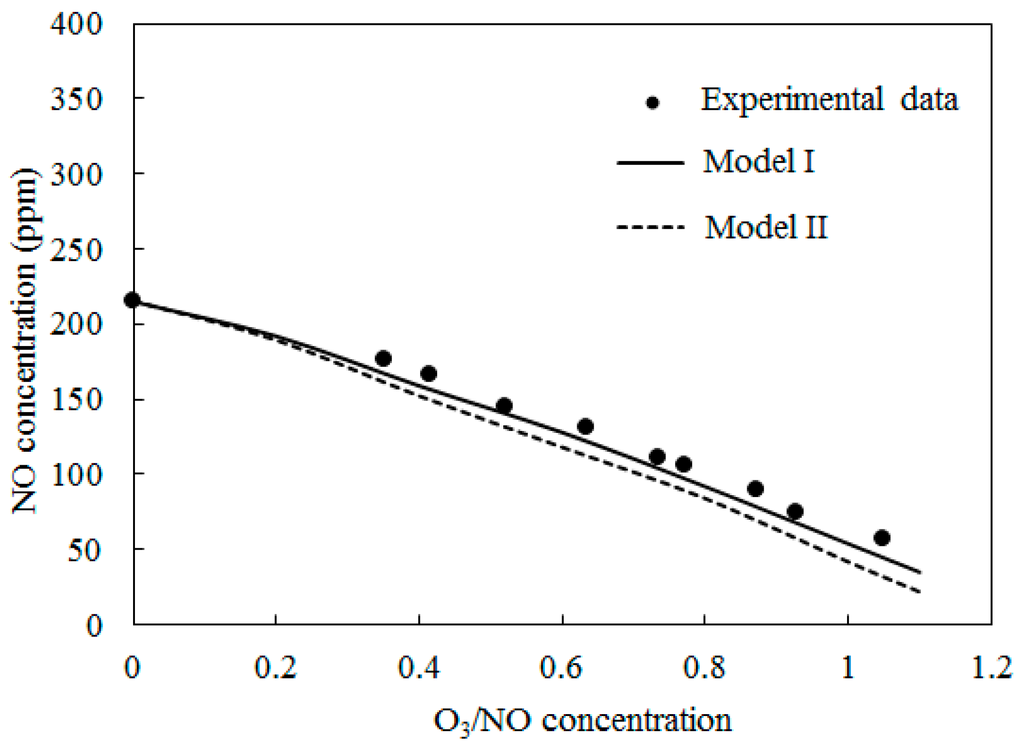
Figure 4.
Variations of NO concentration with O3/NO concentrations at T = 100 °C.
Figure 4.
Variations of NO concentration with O3/NO concentrations at T = 100 °C.

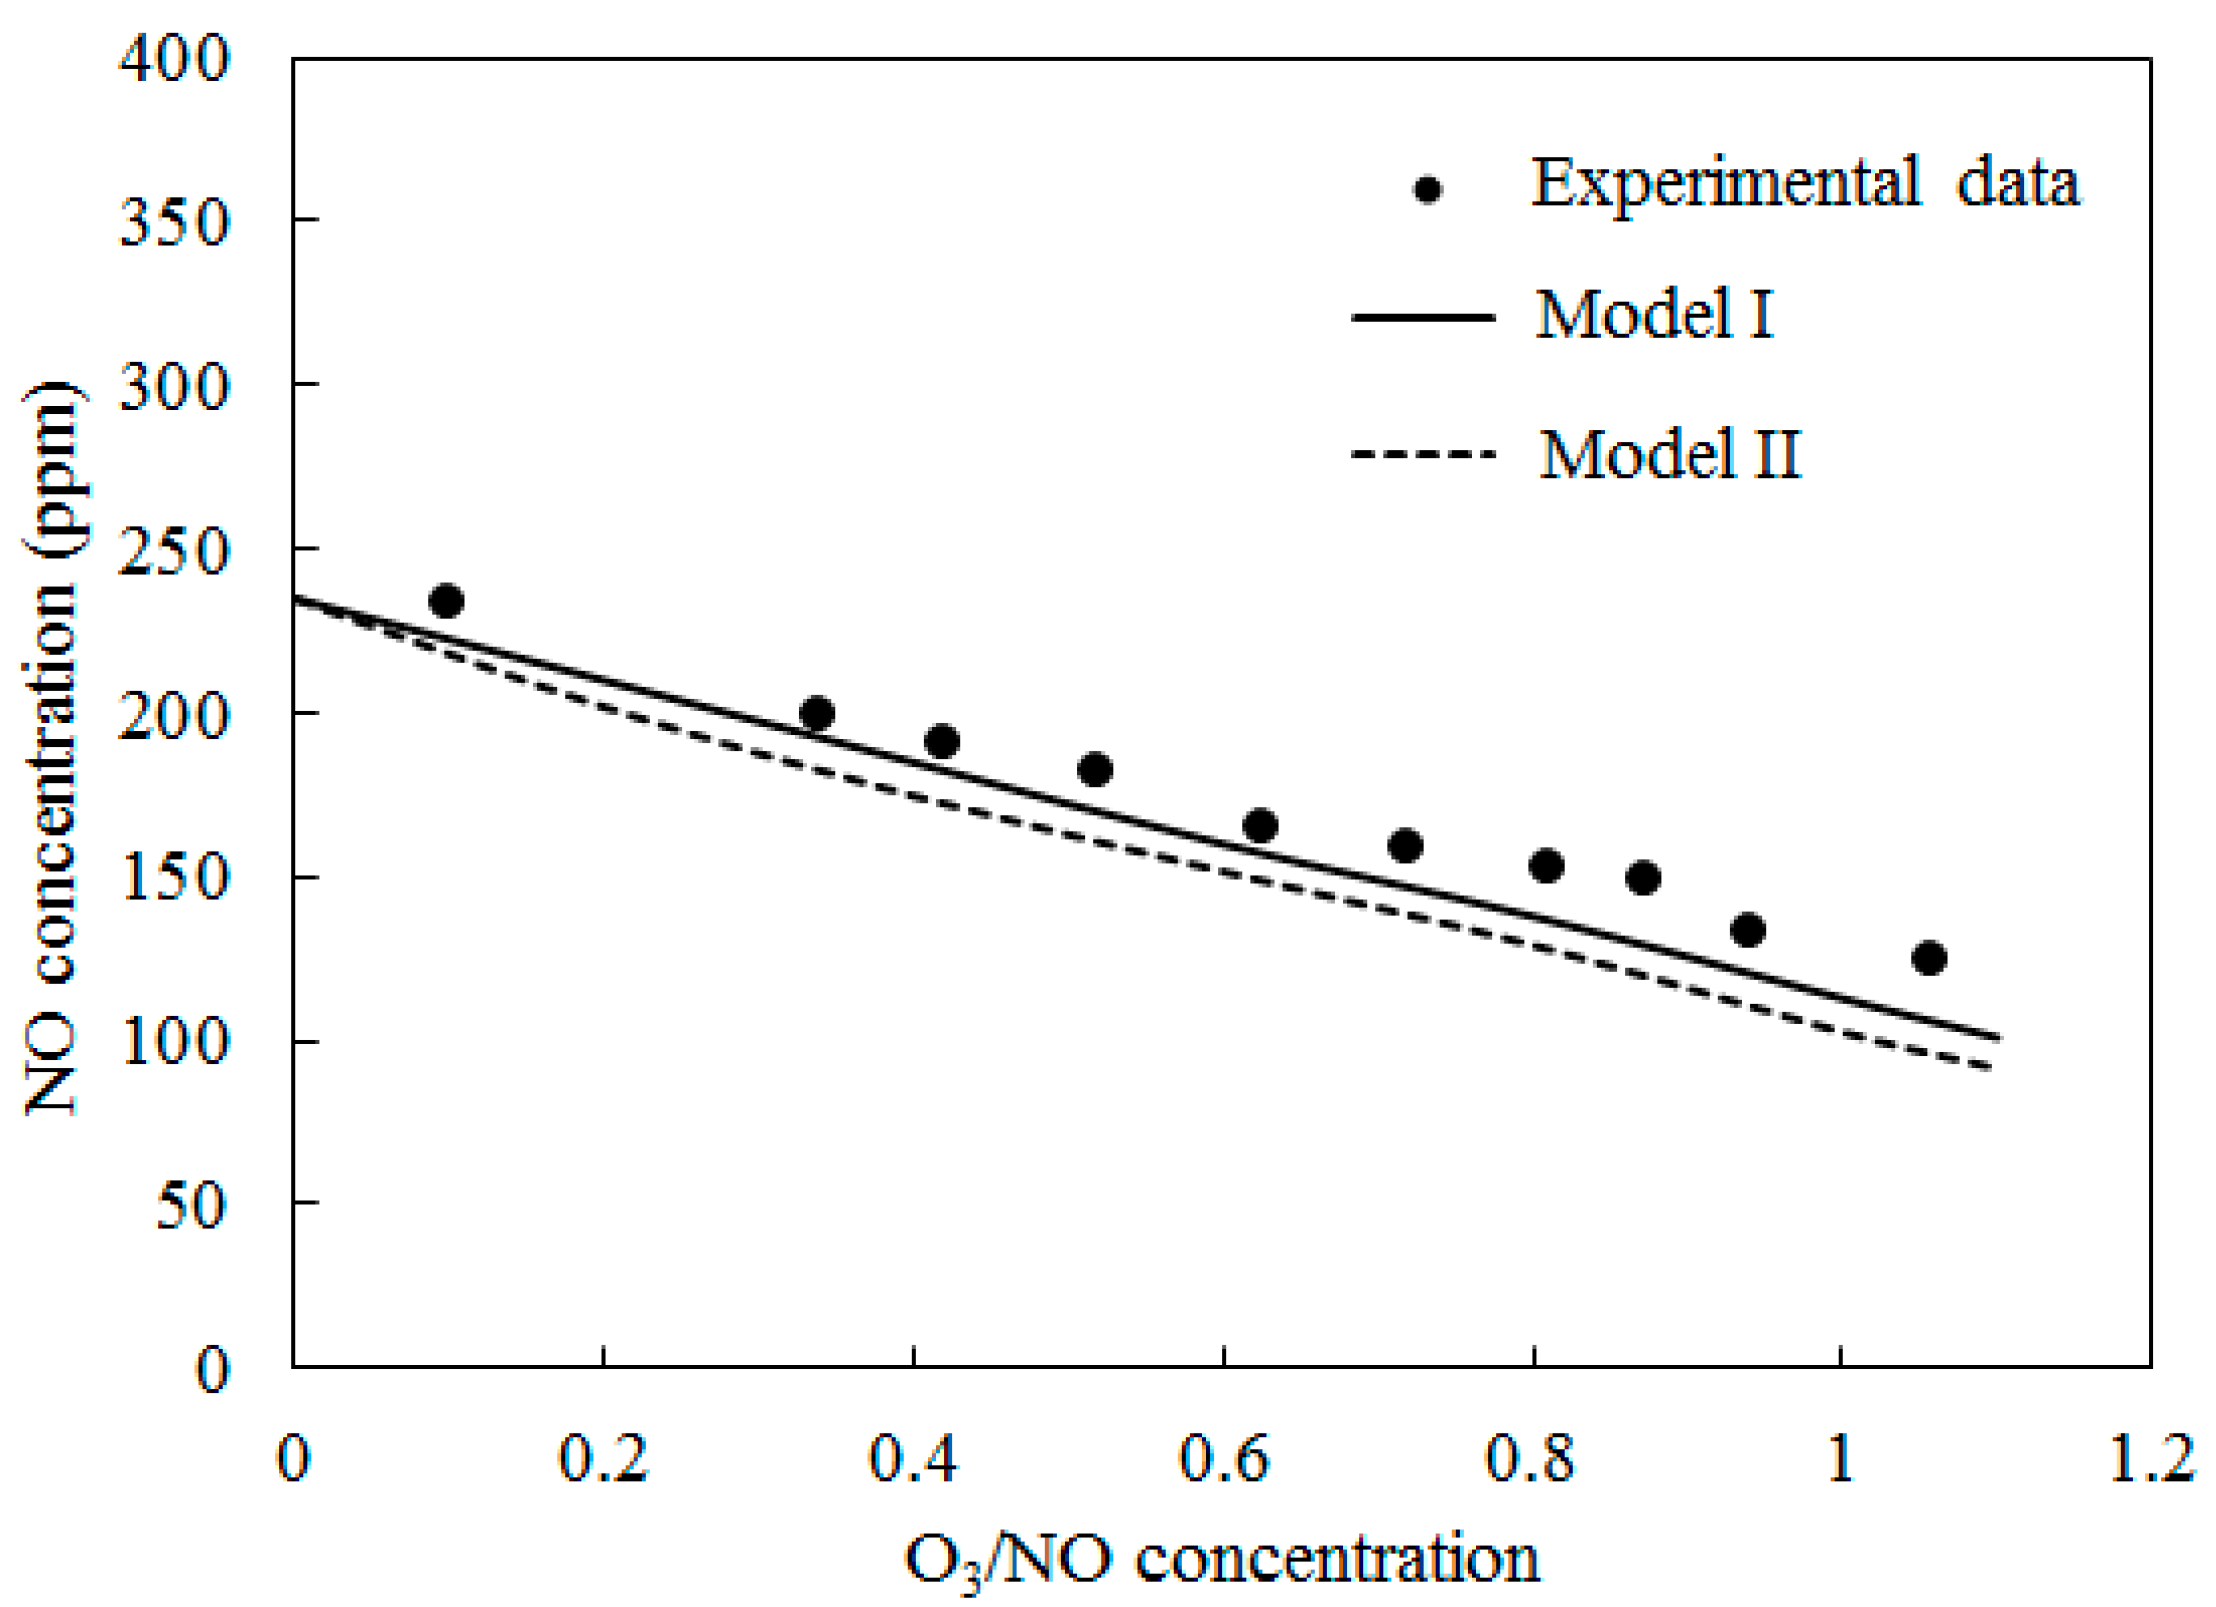
Figure 5 depicts the comparisons of the computed NO concentration using Model I and Model II along with experimental data [27] at T = 200 °C. The O3/NO concentrations ranged from 0.0 to 1.1. A similar trend to Figure 4 was obtained.
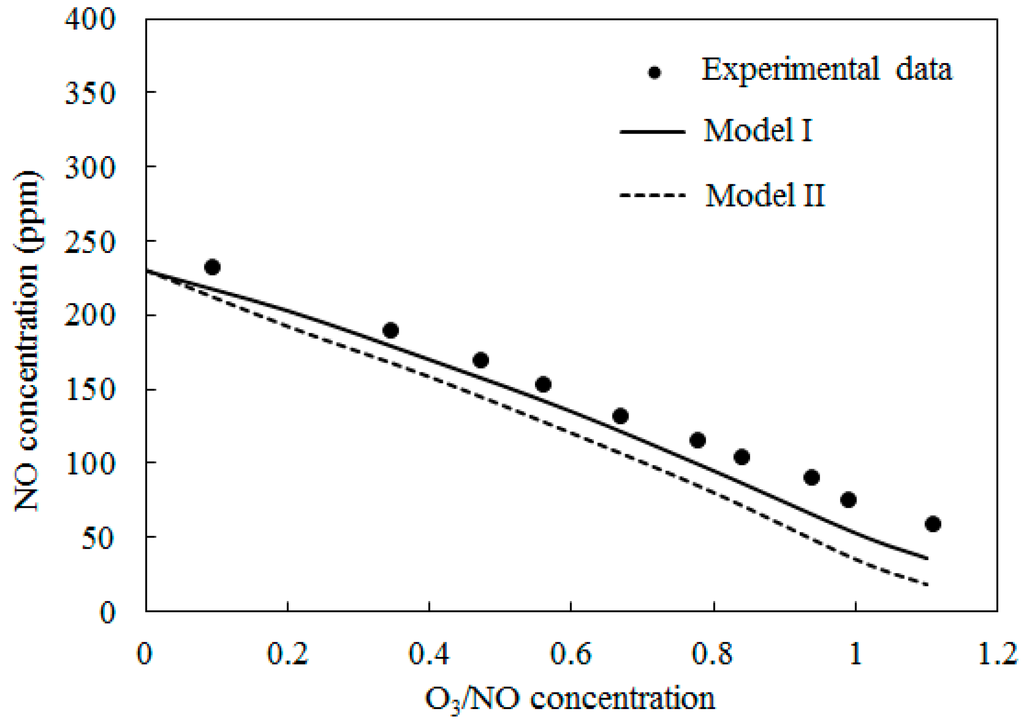
Figure 5.
Variations of NO concentration with O3/NO concentrations at T = 200 °C.
Figure 5.
Variations of NO concentration with O3/NO concentrations at T = 200 °C.
The simulation results of both Model I and Model II under-predicted the experimental data. Where the O3/NO concentration equaled 1, the experiment determined NO concentration as 73 ppm; the simulation results of Model I and Model II were 53 ppm and 35 ppm, respectively.
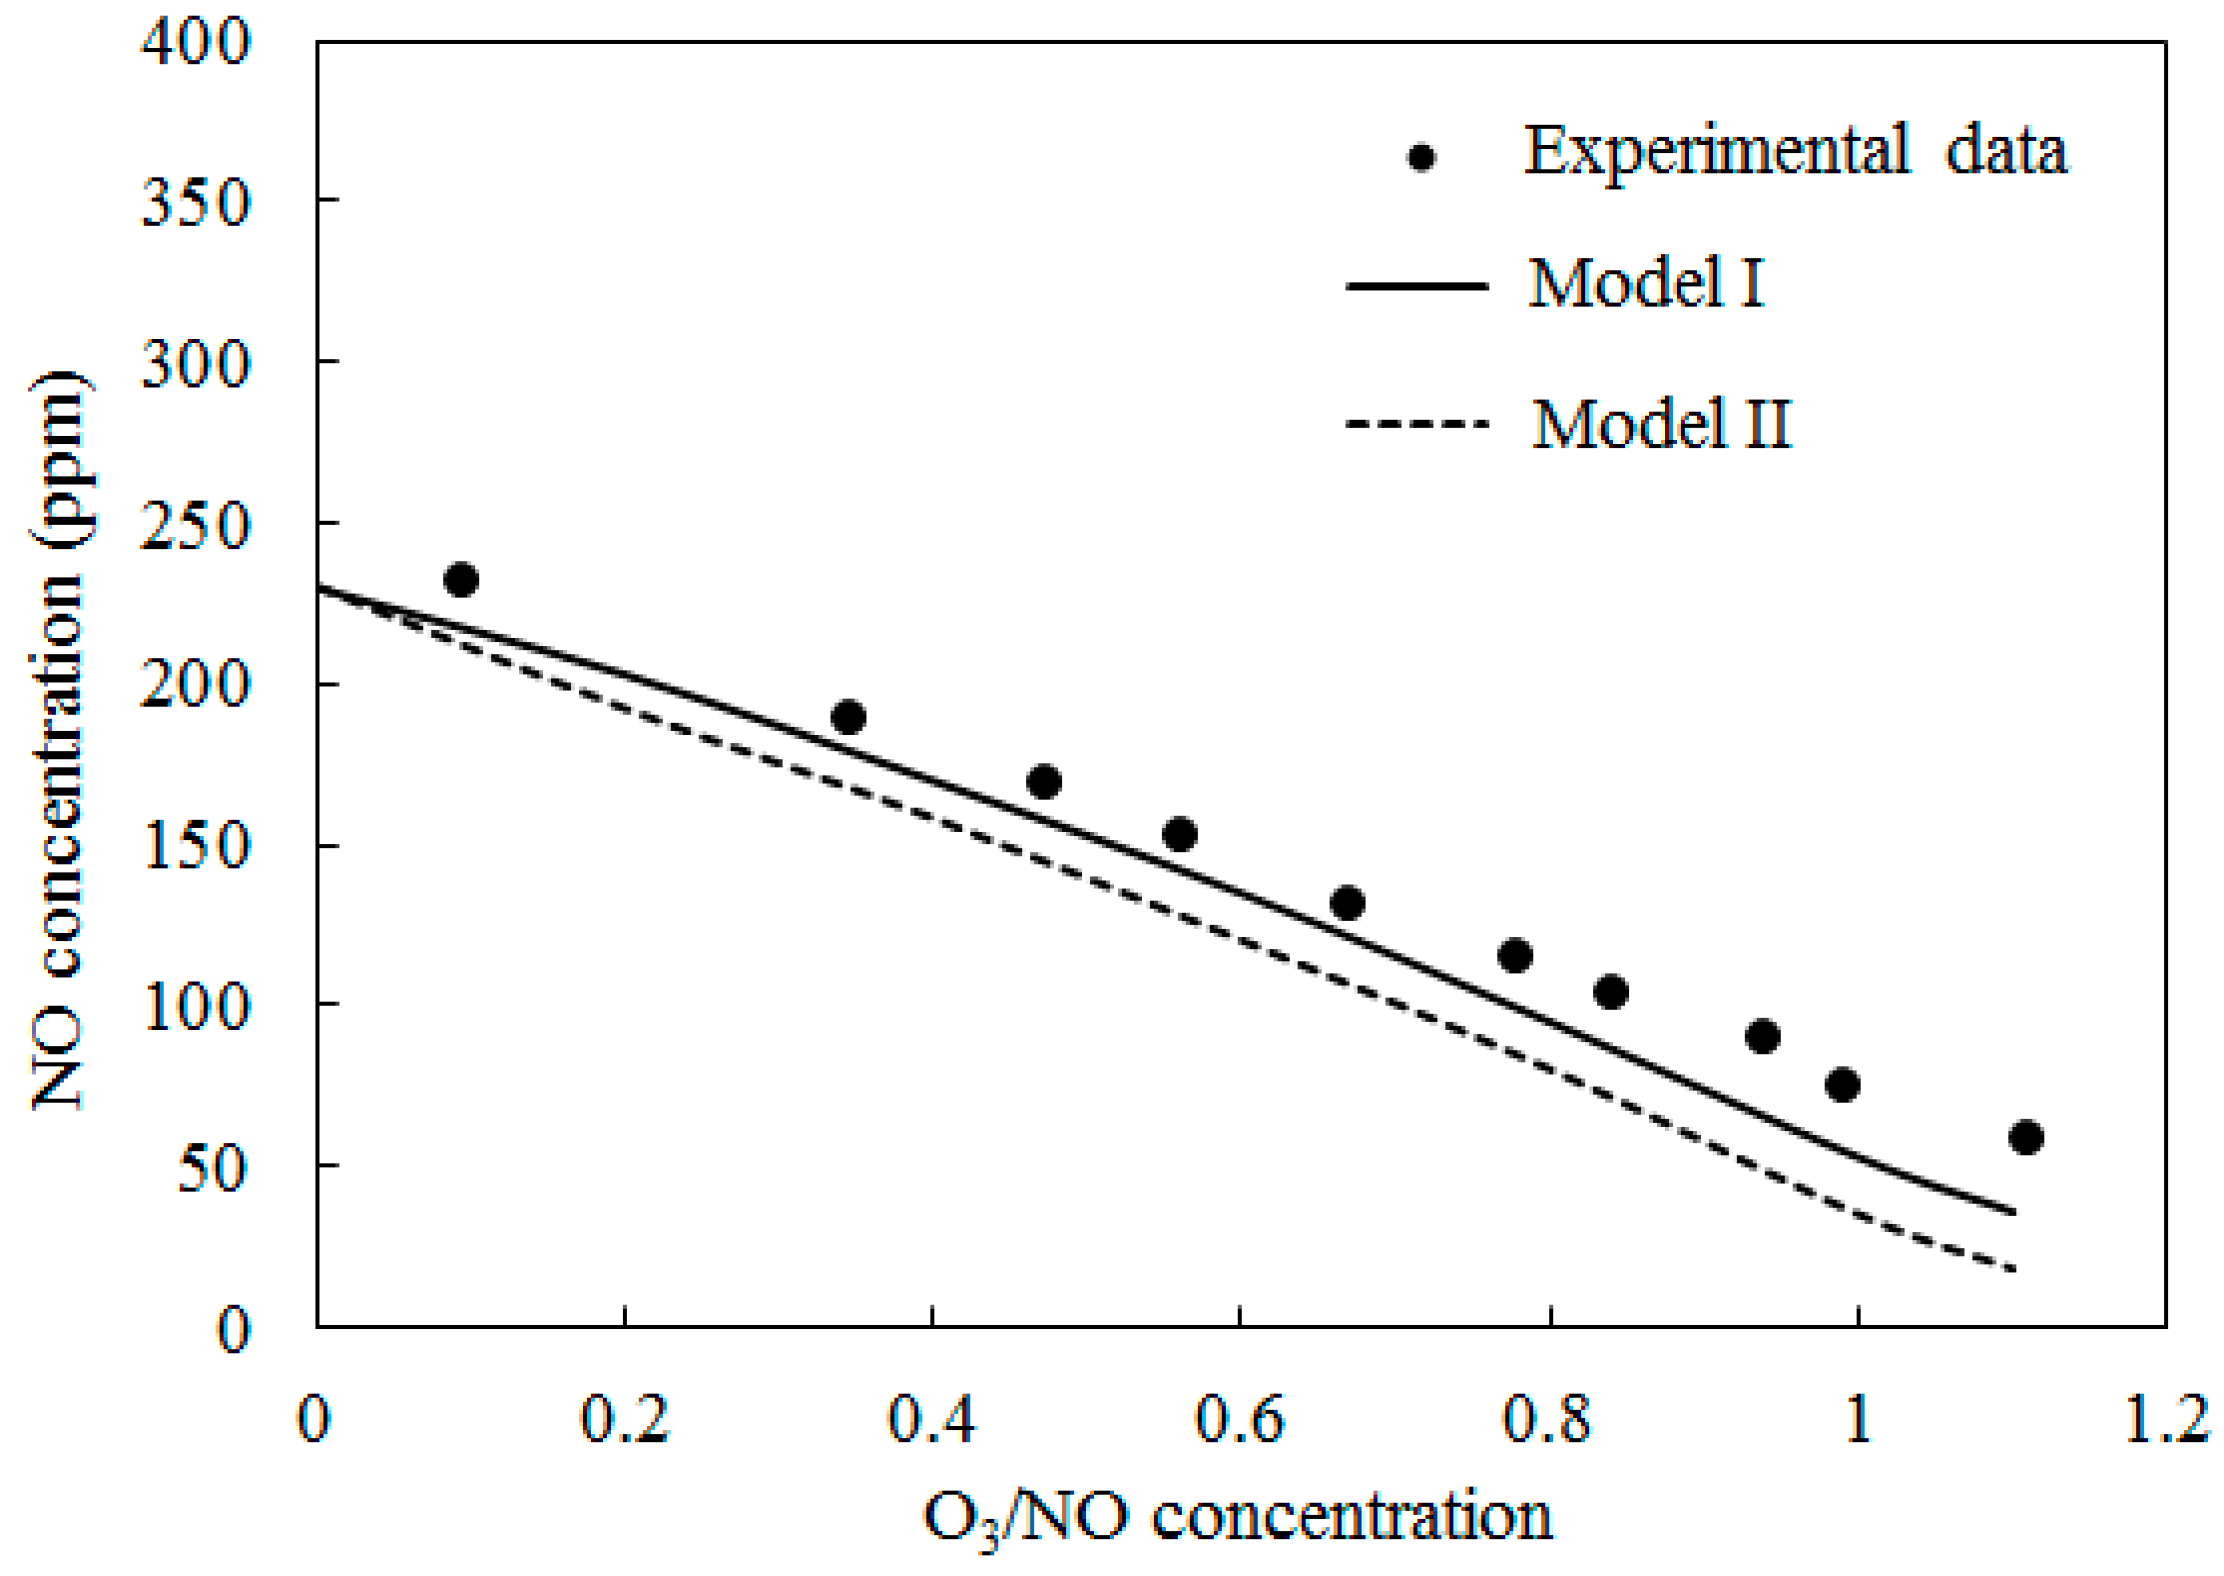
Figure 6 shows the comparisons of computed NO concentration using Model I and Model II along with experimental data [27] at T = 300 °C. The O3/NO concentrations ranged from 0.0 to 1.1. The trends were similar to T = 100 °C and T = 200 °C. The NO concentration decreased as the O3/NO concentrations increased. Where the O3/NO concentrations equaled 1, the experiment determined the NO concentration as 124 ppm, and simulation results of Model I and Model II were 113 ppm and 93 ppm, respectively. Furthermore, compared with T = 100 °C and T = 200 °C, it was more difficult for NO to react with O3 at T = 300 °C.
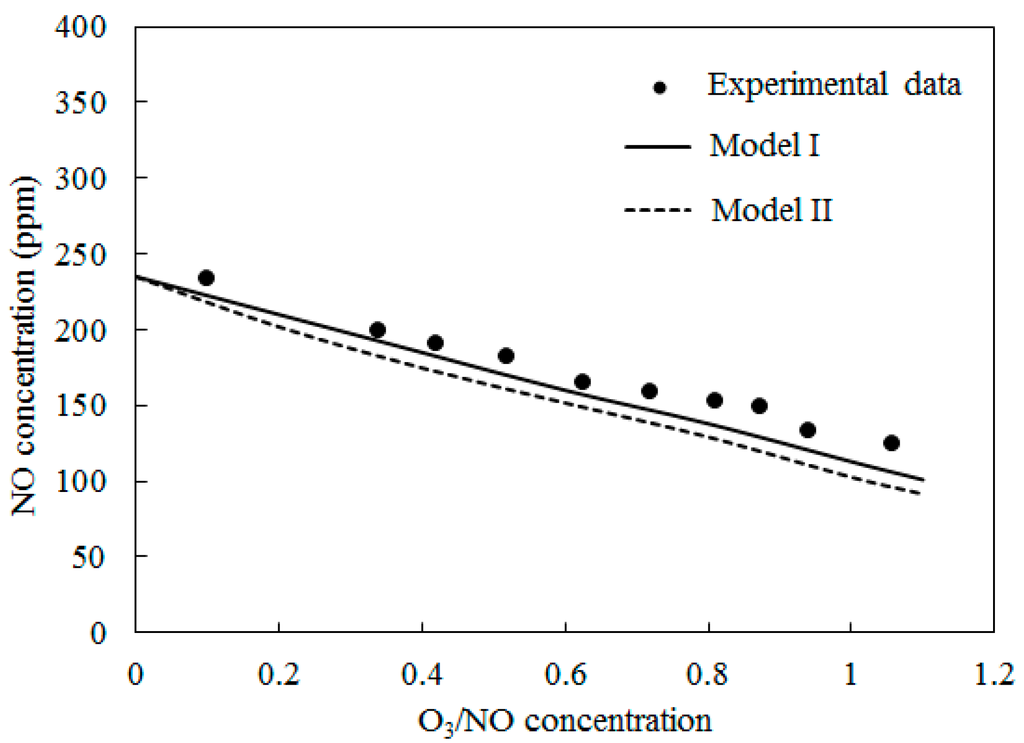
Figure 6.
Variations of NO concentration with O3/NO concentrations at T = 300 °C.
Figure 6.
Variations of NO concentration with O3/NO concentrations at T = 300 °C.
In Figure 4, Figure 5 and Figure 6, Model I shows closer agreement with experimental data compared with Model II. However, the two models exhibit the same prediction results in Figure 3 at lower temperature (T = 25 °C and T = 40 °C). This result could be attributed to the differences of the reactions in the two models. At higher temperature, reaction O3 = O2 + O (R4) is more easy to be triggered and provides enough O2 for reaction NO + NO + O2 = NO2 + NO2 (R12) is responsible for consuming NO and generating NO2, this reaction is included in Model II and it is not included in Model I. Therefore the NO concentration is slightly lower in prediction results of Model II compared with Model I in Figure 4, Figure 5 and Figure 6.
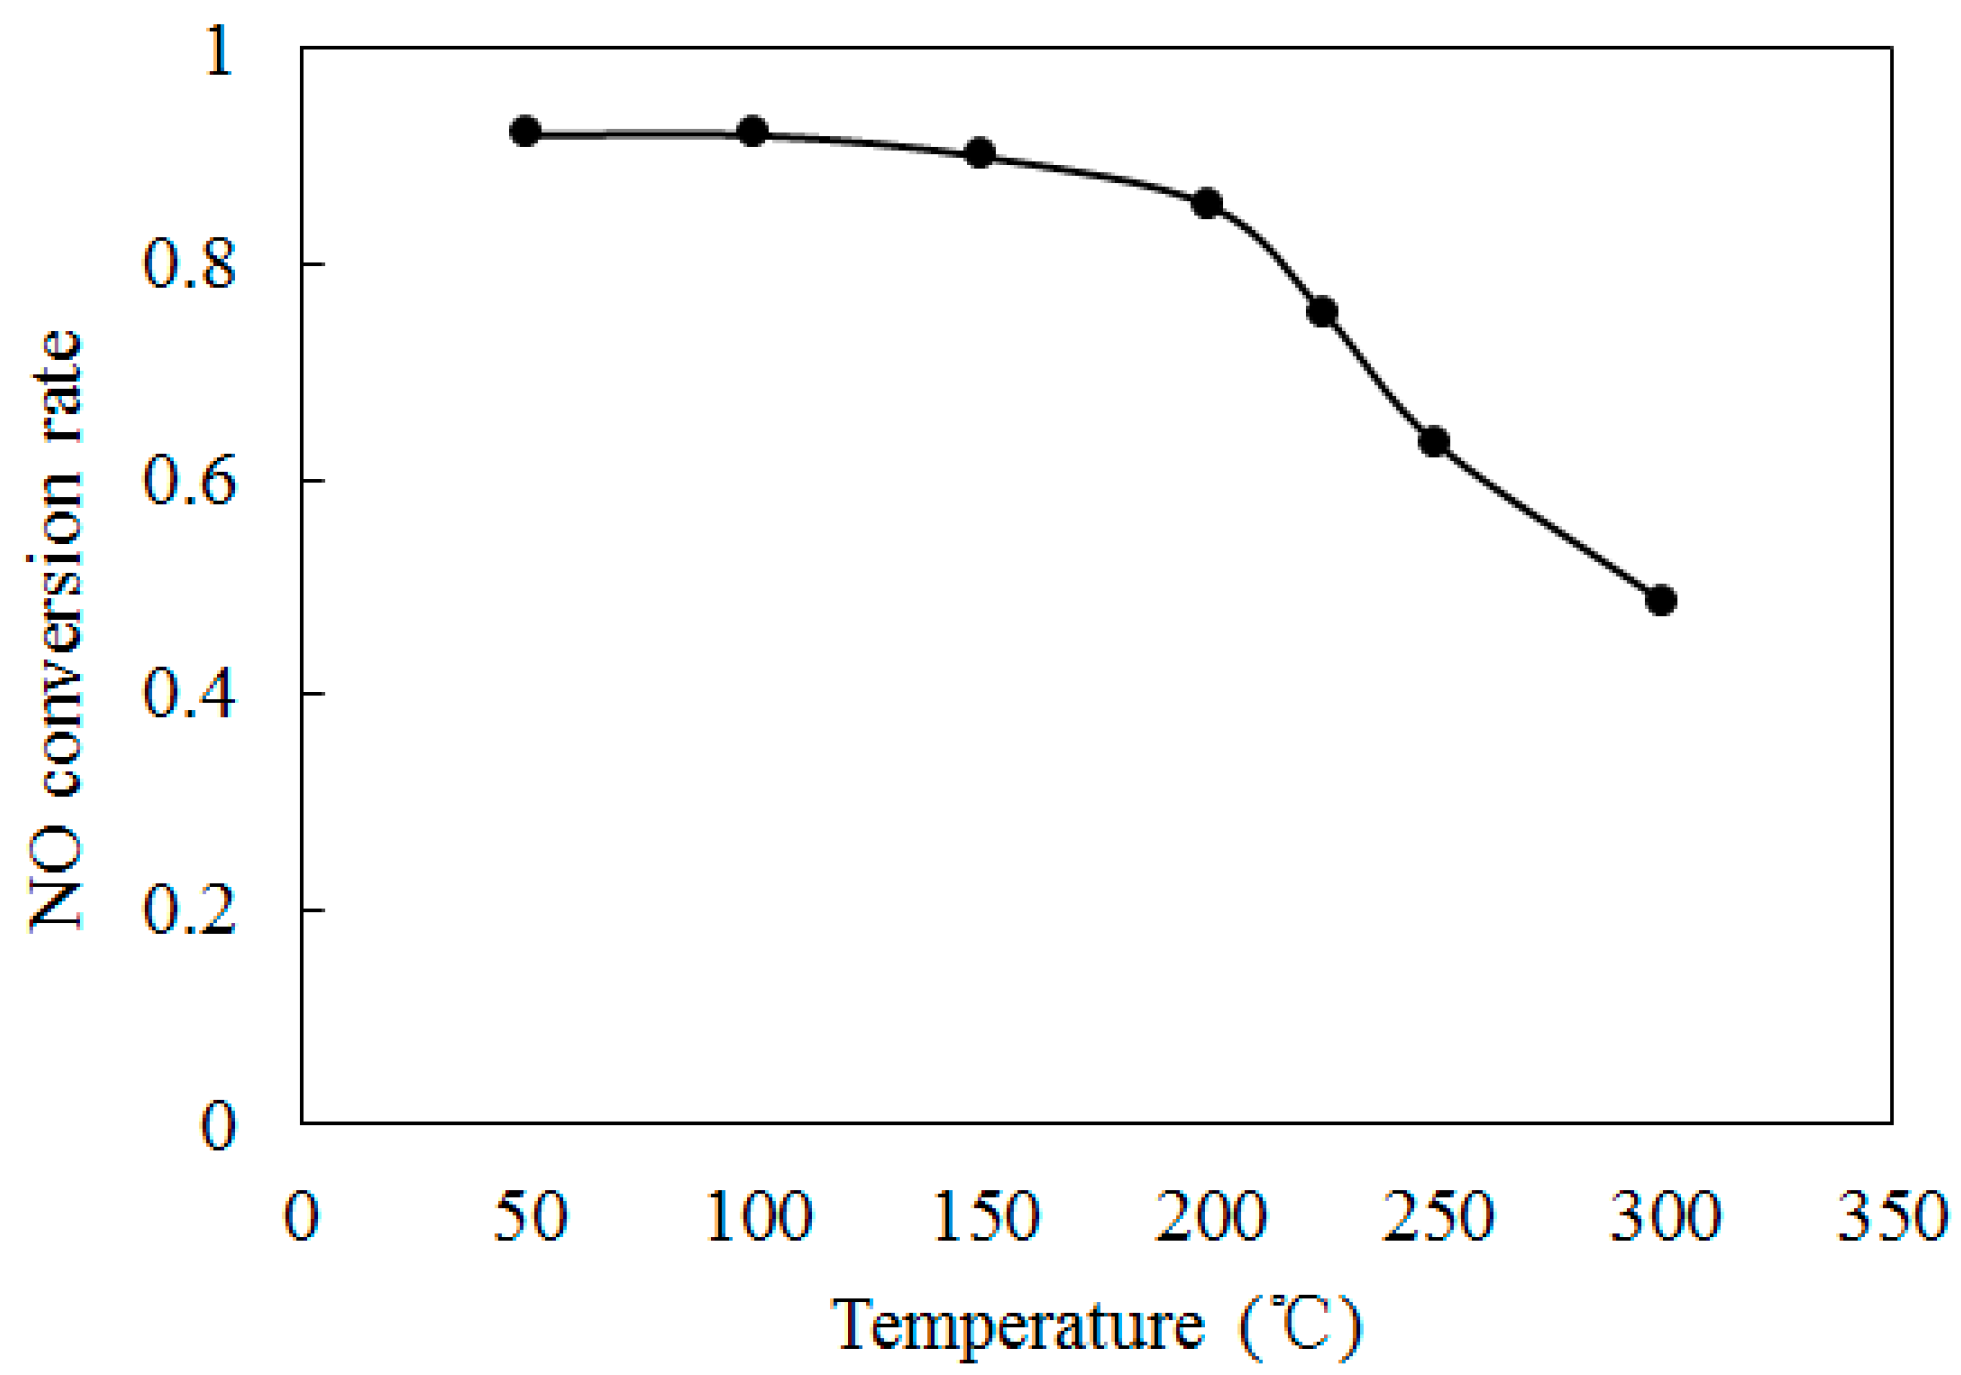
To further discuss the effect of initial temperature on the NO conversion, Figure 7 shows the variations of NO conversion rate with temperatures T at O3/NO concentration equals 1.0. The initial NO concentration and O3 concentration were kept at 300 ppm. The residence time was kept at 1 s. As shown in Figure 7, where temperatures were higher than 200°C, the NO conversion rate was reduced sharply. At T = 300 °C, the NO conversion rate is 48.5%. Previous studies [26,27] demonstrated that O3 becomes unstable at higher temperatures and decomposes to O2. According to O3 = O2 + O (R4), NO will react with O through NO + O = NO2 (R6), which is more difficult trigger than R1. Therefore, a lesser amount of NO was transformed into NO2 at T = 300 °C. The O3 decomposition at higher temperature leads to the decrease of NO conversion rate.
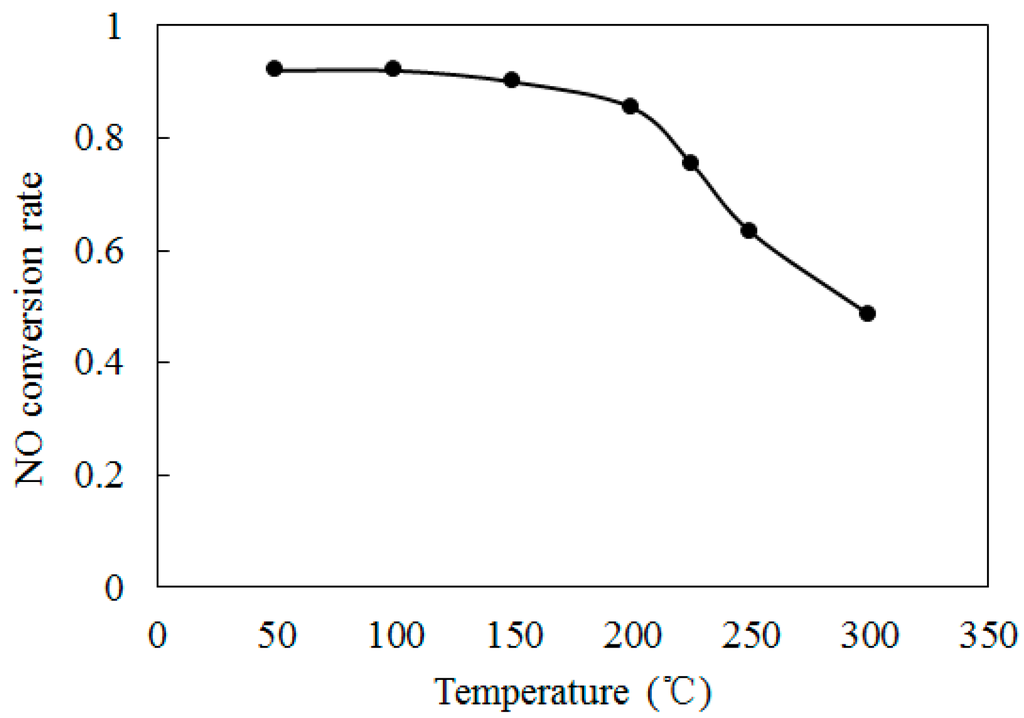
Figure 7.
Variations of NO conversion rate with temperatures at O3/NO concentration equals 1.0.
Figure 7.
Variations of NO conversion rate with temperatures at O3/NO concentration equals 1.0.
In order to obtain further insight into the controlling chemical mechanism of the oxidation process, a sensitivity analysis of NO formation and NO2 formation was conducted for comparison purposes. Figure 8 depicts the ranked logarithmic sensitivity coefficients of NO formation where the O3/NO concentration equaled 1.
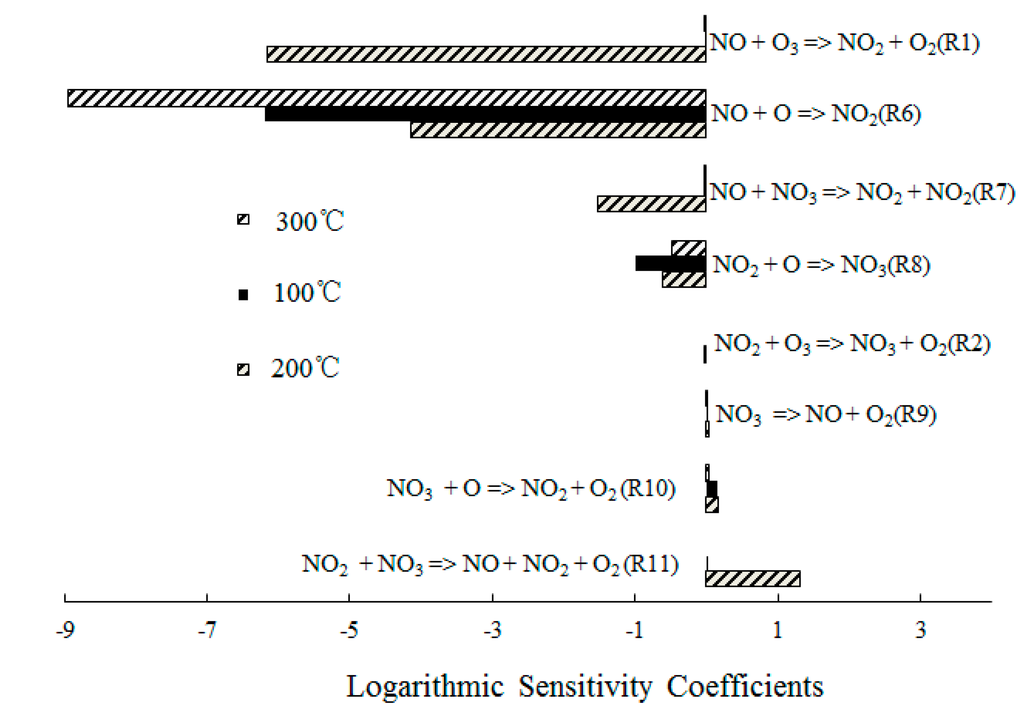
Figure 8.
Ranked logarithmic sensitivity coefficients of NO formation where O3/NO concentration equals 1.
Figure 8.
Ranked logarithmic sensitivity coefficients of NO formation where O3/NO concentration equals 1.
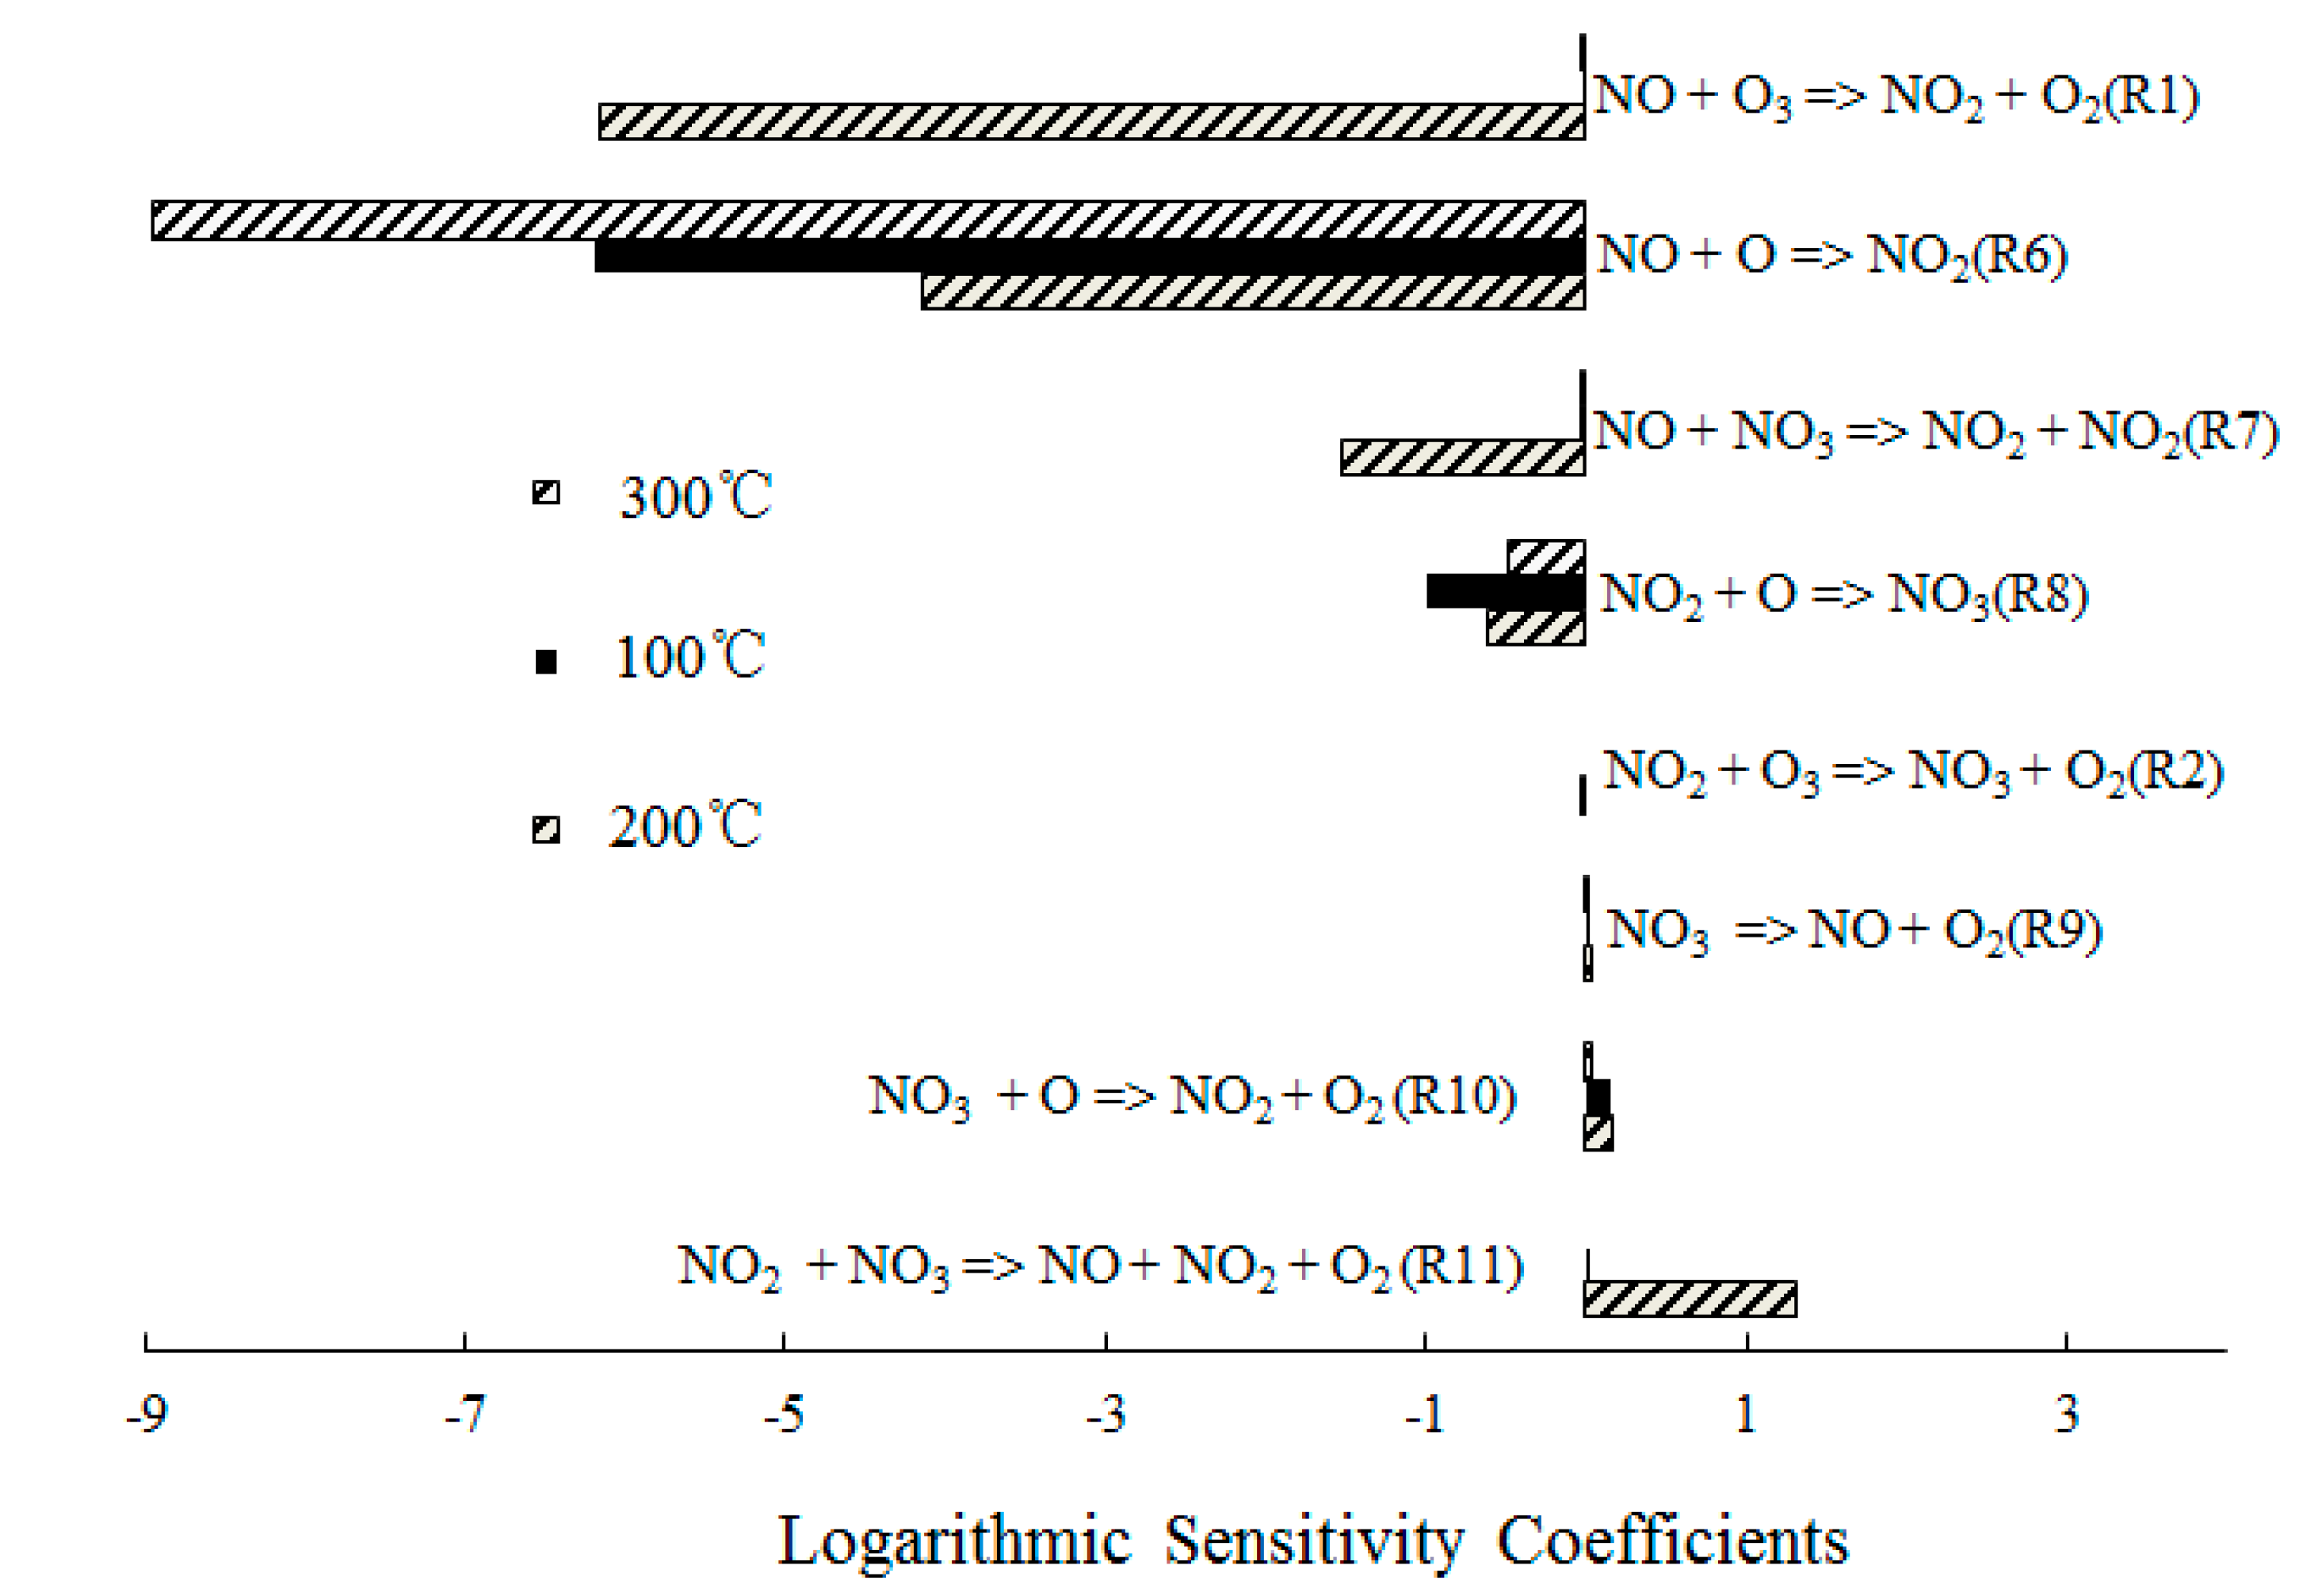
Reaction O3 + NO = NO2 + O2 (R1) showed significant results at T = 100 °C, which indicated that the direct oxidation of NO by O3 was the main reaction path of NO consumption. However, NO + O = NO2 (R6) dominated the oxidation process of NO at T = 300 °C, which was expected for T = 300 °C; The O3 decomposed to O2 and O, a large amount of O was formed and then reacted with the excess NO. In addition, the reactions NO + NO3 = NO2 + NO2 (R7) and NO2 + O = NO3 (R8) also showed significant results for the NO consumption. Hence, where a molar ratio of O3/NO equaled 1, a small amount of NO3 was generated and reacted with NO.
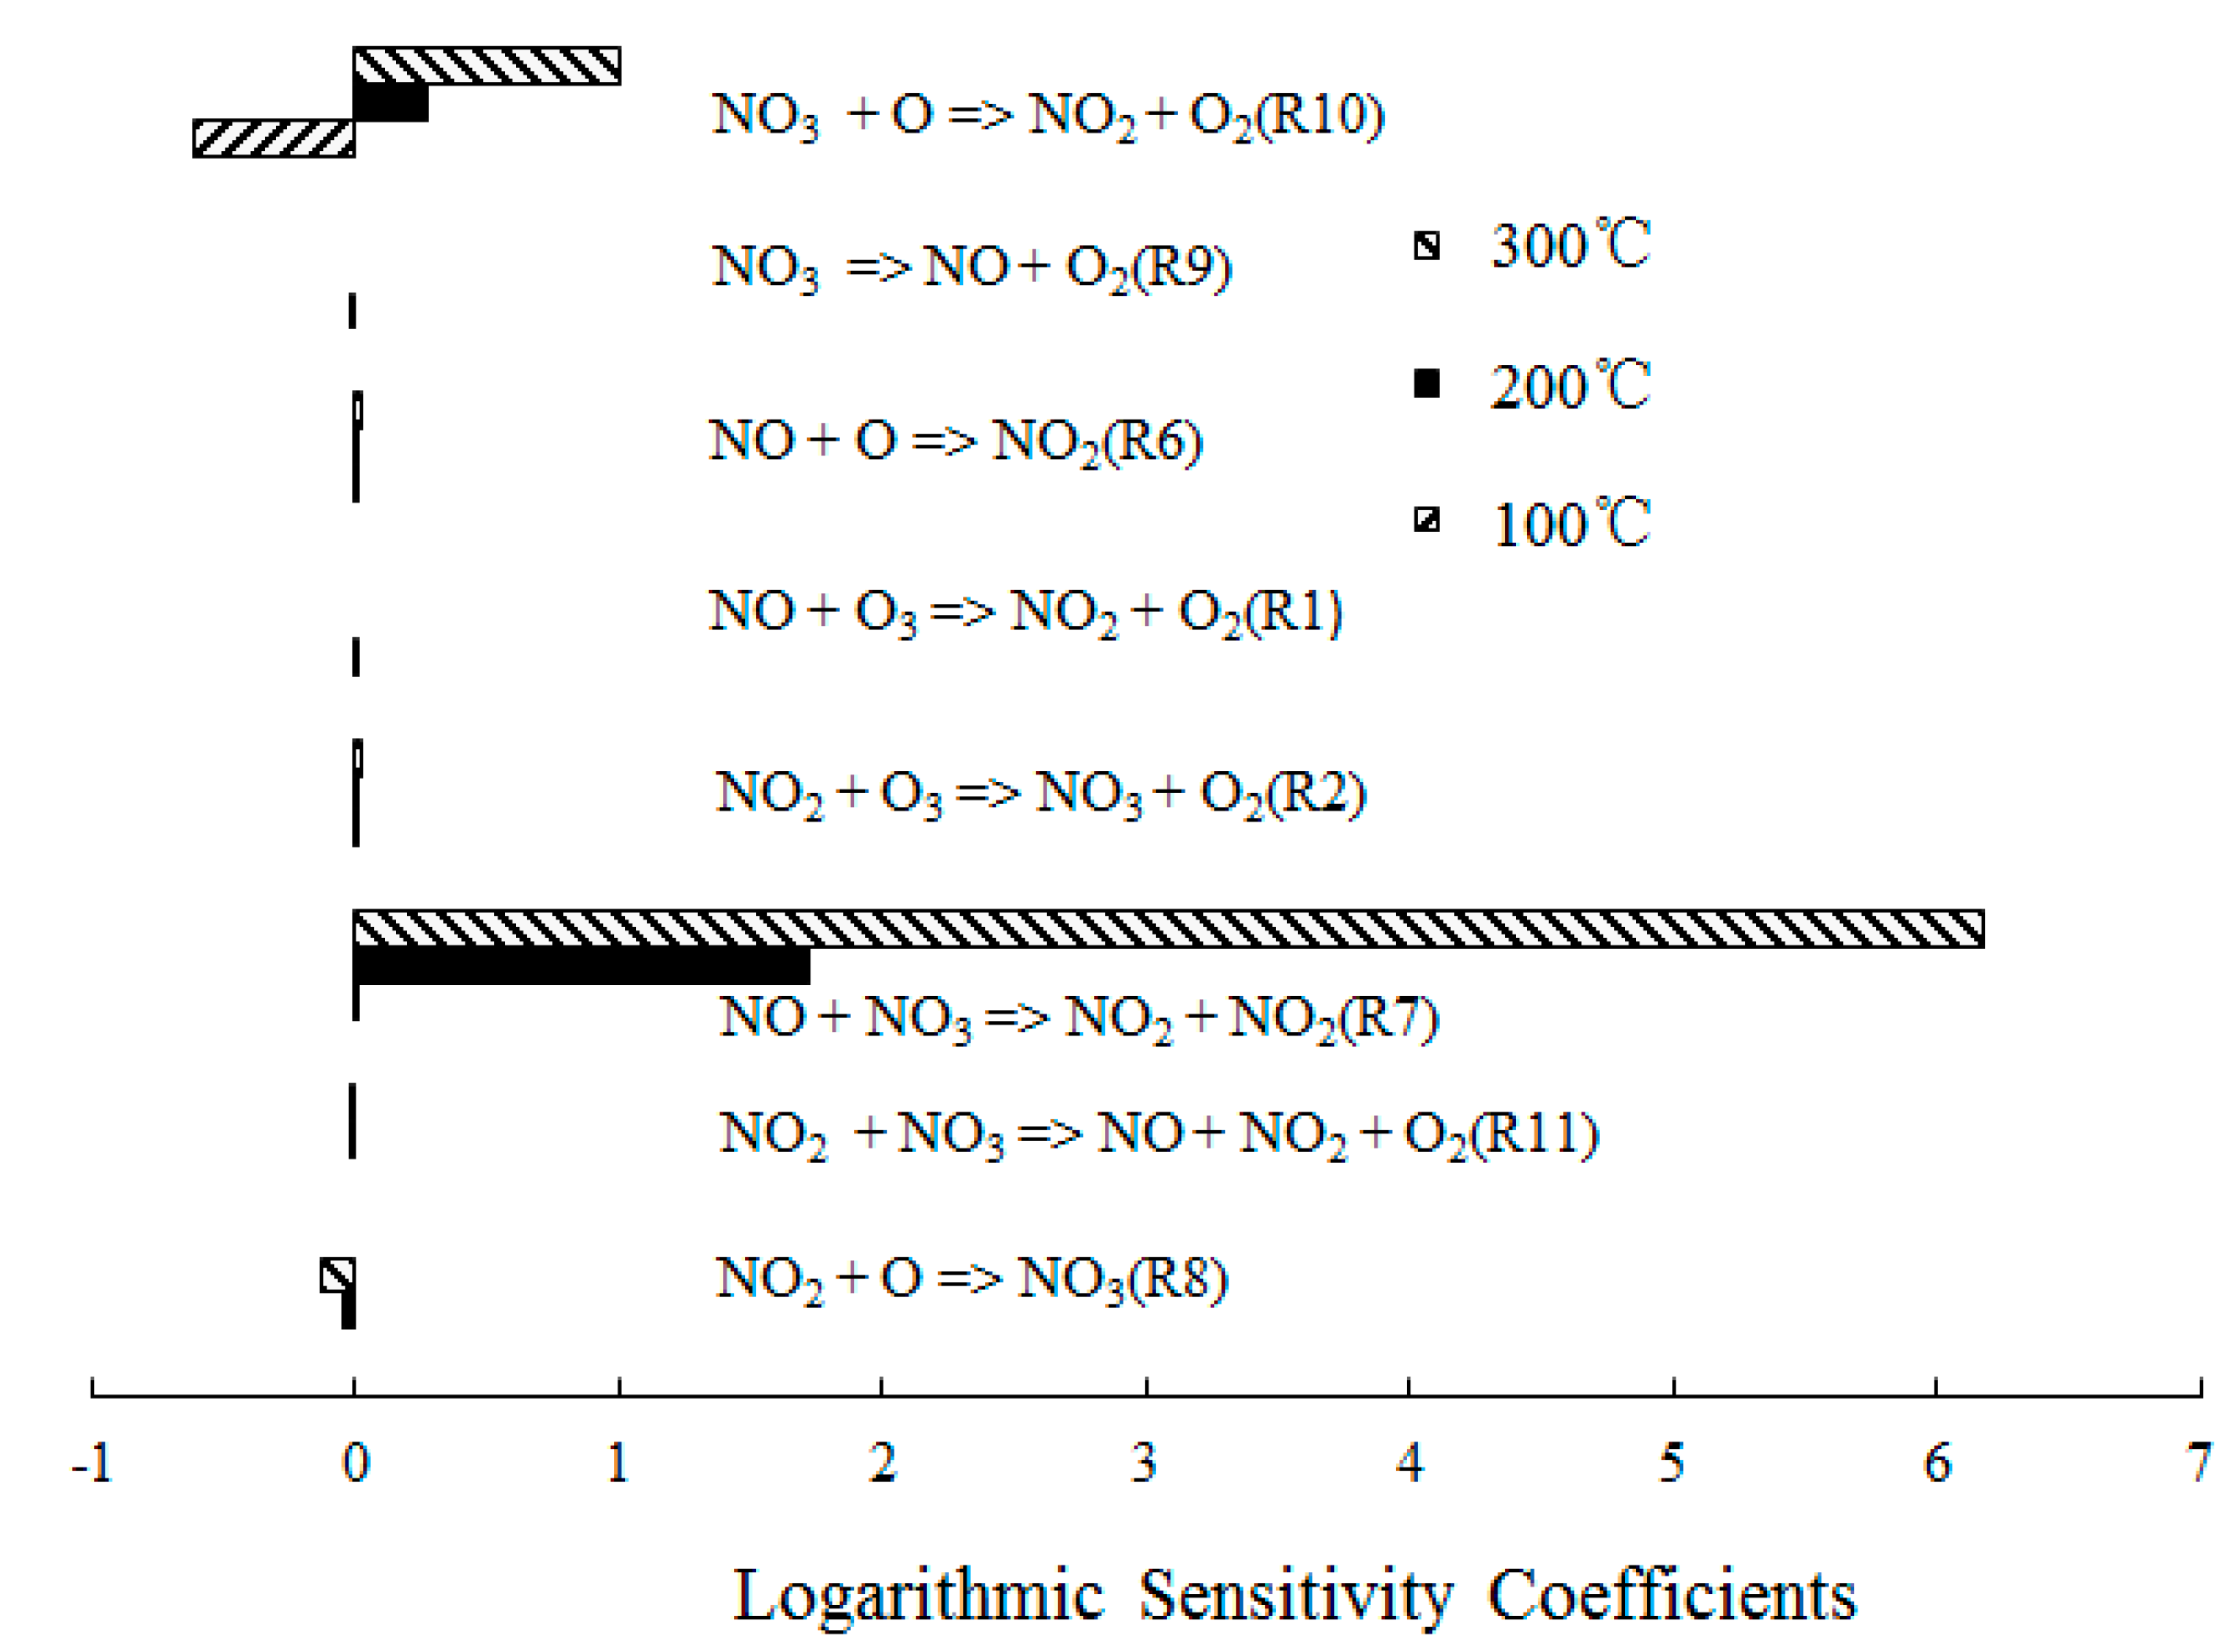
Figure 9 depicts the ranked logarithmic sensitivity coefficients of NO2 formation where the O3/NO concentration equaled 1. NO + NO3 = NO2 + NO2 (R7) dominated the overall reactivity and also the NO2 formation at T = 300 °C. At T = 200 °C, NO + O3 = NO2 + O2 (R1), NO2 + O3 = NO3 + O2 (R2), NO + O = NO2 (R6) and NO3 = NO + O2 (R9) had a positive effect on NO2 formation. The sensitivity coefficient of NO + O3 = NO2 + O2 (R1) was 0 at T = 300 °C, which confirmed that O3 decomposed at T = 300 °C [27]. There was insufficient O3 to react with NO; therefore, the reaction NO + O3 = NO2 + O2 (R1) was subsequently difficult to trigger. Furthermore, NO3 + O = NO2 + O2 (R10) showed significant results in the NO2 formation due to a large amount of O formation.
Based on the previous discussion, the optimal reaction temperature for O3/NO ranged from 100 to 200 °C. As the temperature increased, O3 decomposed into O and O2 before reacting with NO. The main oxidation reaction NO + O3 = NO2 + O2 (R1) of NO with O3 was difficult to trigger; therefore, the NO conversion rates were lower at T = 300 °C compared with T = 100 °C and T = 200 °C. These conclusions indicate that in a coal-fired power plant, the O3 injection point should be set before or after the dust removal system, where the temperature of the flue gas is approximately 100~200°C.
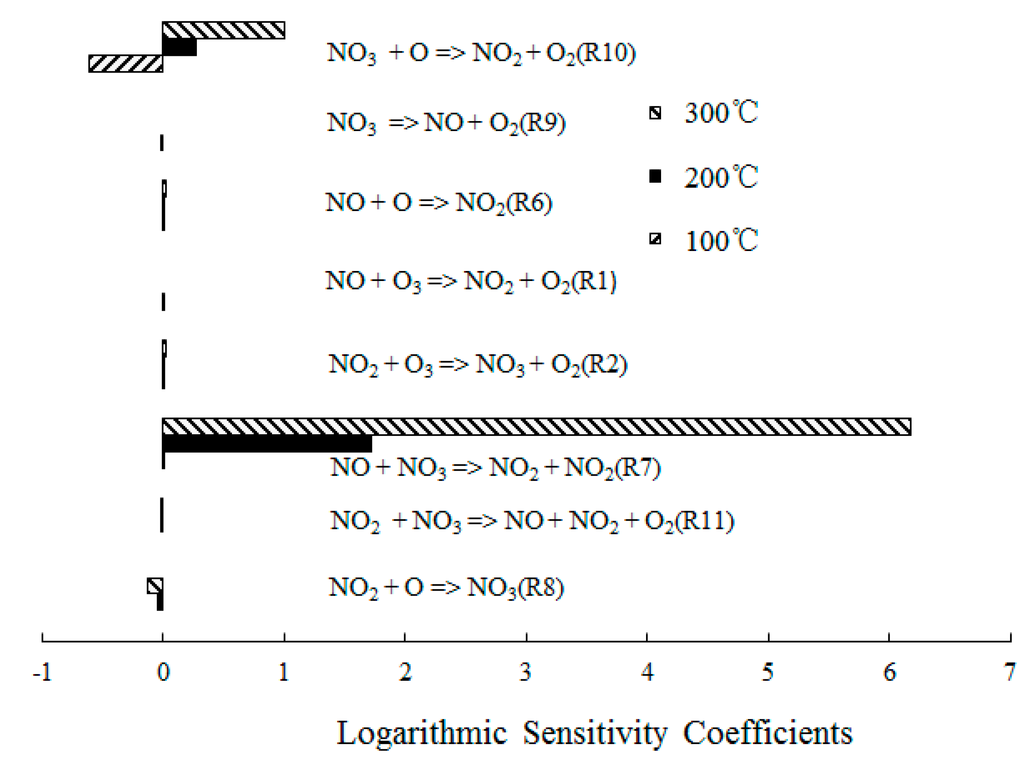
Figure 9.
Ranked logarithmic sensitivity coefficients of NO2 formation where O3/NO concentration equals 1.
Figure 9.
Ranked logarithmic sensitivity coefficients of NO2 formation where O3/NO concentration equals 1.
The above discussions show that when the O3/NO concentration was less than 1, most of the NO was oxidized into NO2, and a higher oxidation state of NO2 was difficult produced due to insufficient O3. For a further understanding of possible higher oxidative level NOx species producing in the oxidation process at higher O3/NO mole fraction ratios, the molar fraction variations of NO, NO2, NO3 and N2O5 for different temperatures where the O3/NO concentration equaled 1.5 and 2.0 are discussed in Figure 10 and Figure 11.
Figure 10 depicts the molar fraction variations of NO, NO2, NO3 and N2O5 for different temperatures where the O3/NO concentration equaled 1.5 (with variable residence time). Figure 10a shows that at T = 100 °C, NO was first consumed, then NO2, NO3 and N2O5 were generated. Figure 10b shows similar trends to Figure 10a for T = 200 °C. Compared to an O3/NO concentration equal to 1, a higher oxidation state of NO was produced where the O3/NO concentration was higher than 1. The reactions R1, R2 and R12 are show significant importance at O3/NO concentrations larger than 1.0, which is also confirmed by previous studies [27,33]. At the beginning of the reaction, the NO oxidized to NO2 by O3 via reaction NO + O3 = NO2 + O2 (R1). As excess O3 reacted with NO2 via NO2 + O3 = NO3 + O2 (R2), NO2 rapidly decreased and NO3 began to generate. N2O5 was formed via reaction NO2 + NO3 = N2O5 (R12). Hence, NO3 and N2O5 have a higher oxidization state than NO and they can be generated where there is an excess of O3. As demonstrated by previous study [25], reaction R2 was much slower than reaction R1, thus the NO3 concentration was lower than NO2 concentration. In addition, the N2O5 produced by R12 decomposed into NO2 and NO3 by its reverse reaction, thus, the N2O5 concentration was very low compared with NO2 and NO3. Additionally, compared with T = 100 °C, the NO3 mole fractions were higher at T = 200 °C, whereas the N2O5 mole fractions were lower, this trend was also confirmed by calculated results from Mok et al. [25], indicating that at higher temperature, N2O5 is more easy to be consumed by the reverse reaction of NO2 + NO3 = N2O5 (R12).
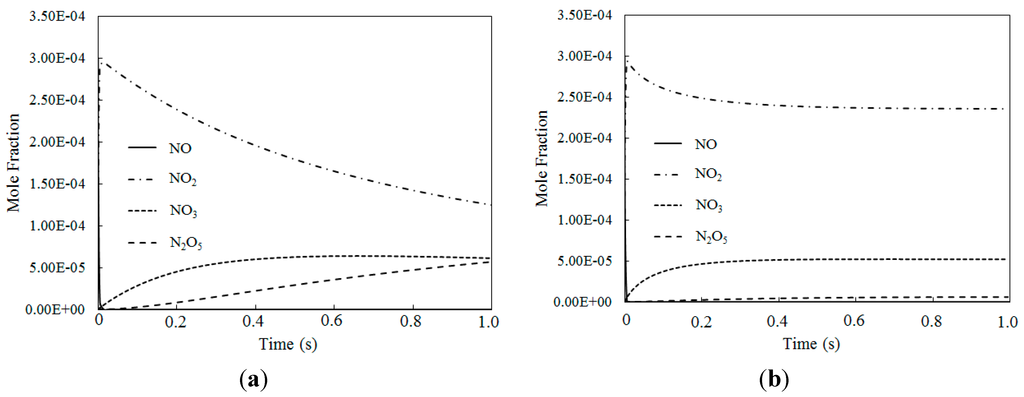
Figure 10.
The mole fraction variations for NO, NO2, NO3 and N2O5 of different temperatures where O3/NO concentrations equal 1.5 for T = 100 °C and T = 200 °C. (a) T = 100 °C; (b) T = 200 °C.
Figure 10.
The mole fraction variations for NO, NO2, NO3 and N2O5 of different temperatures where O3/NO concentrations equal 1.5 for T = 100 °C and T = 200 °C. (a) T = 100 °C; (b) T = 200 °C.
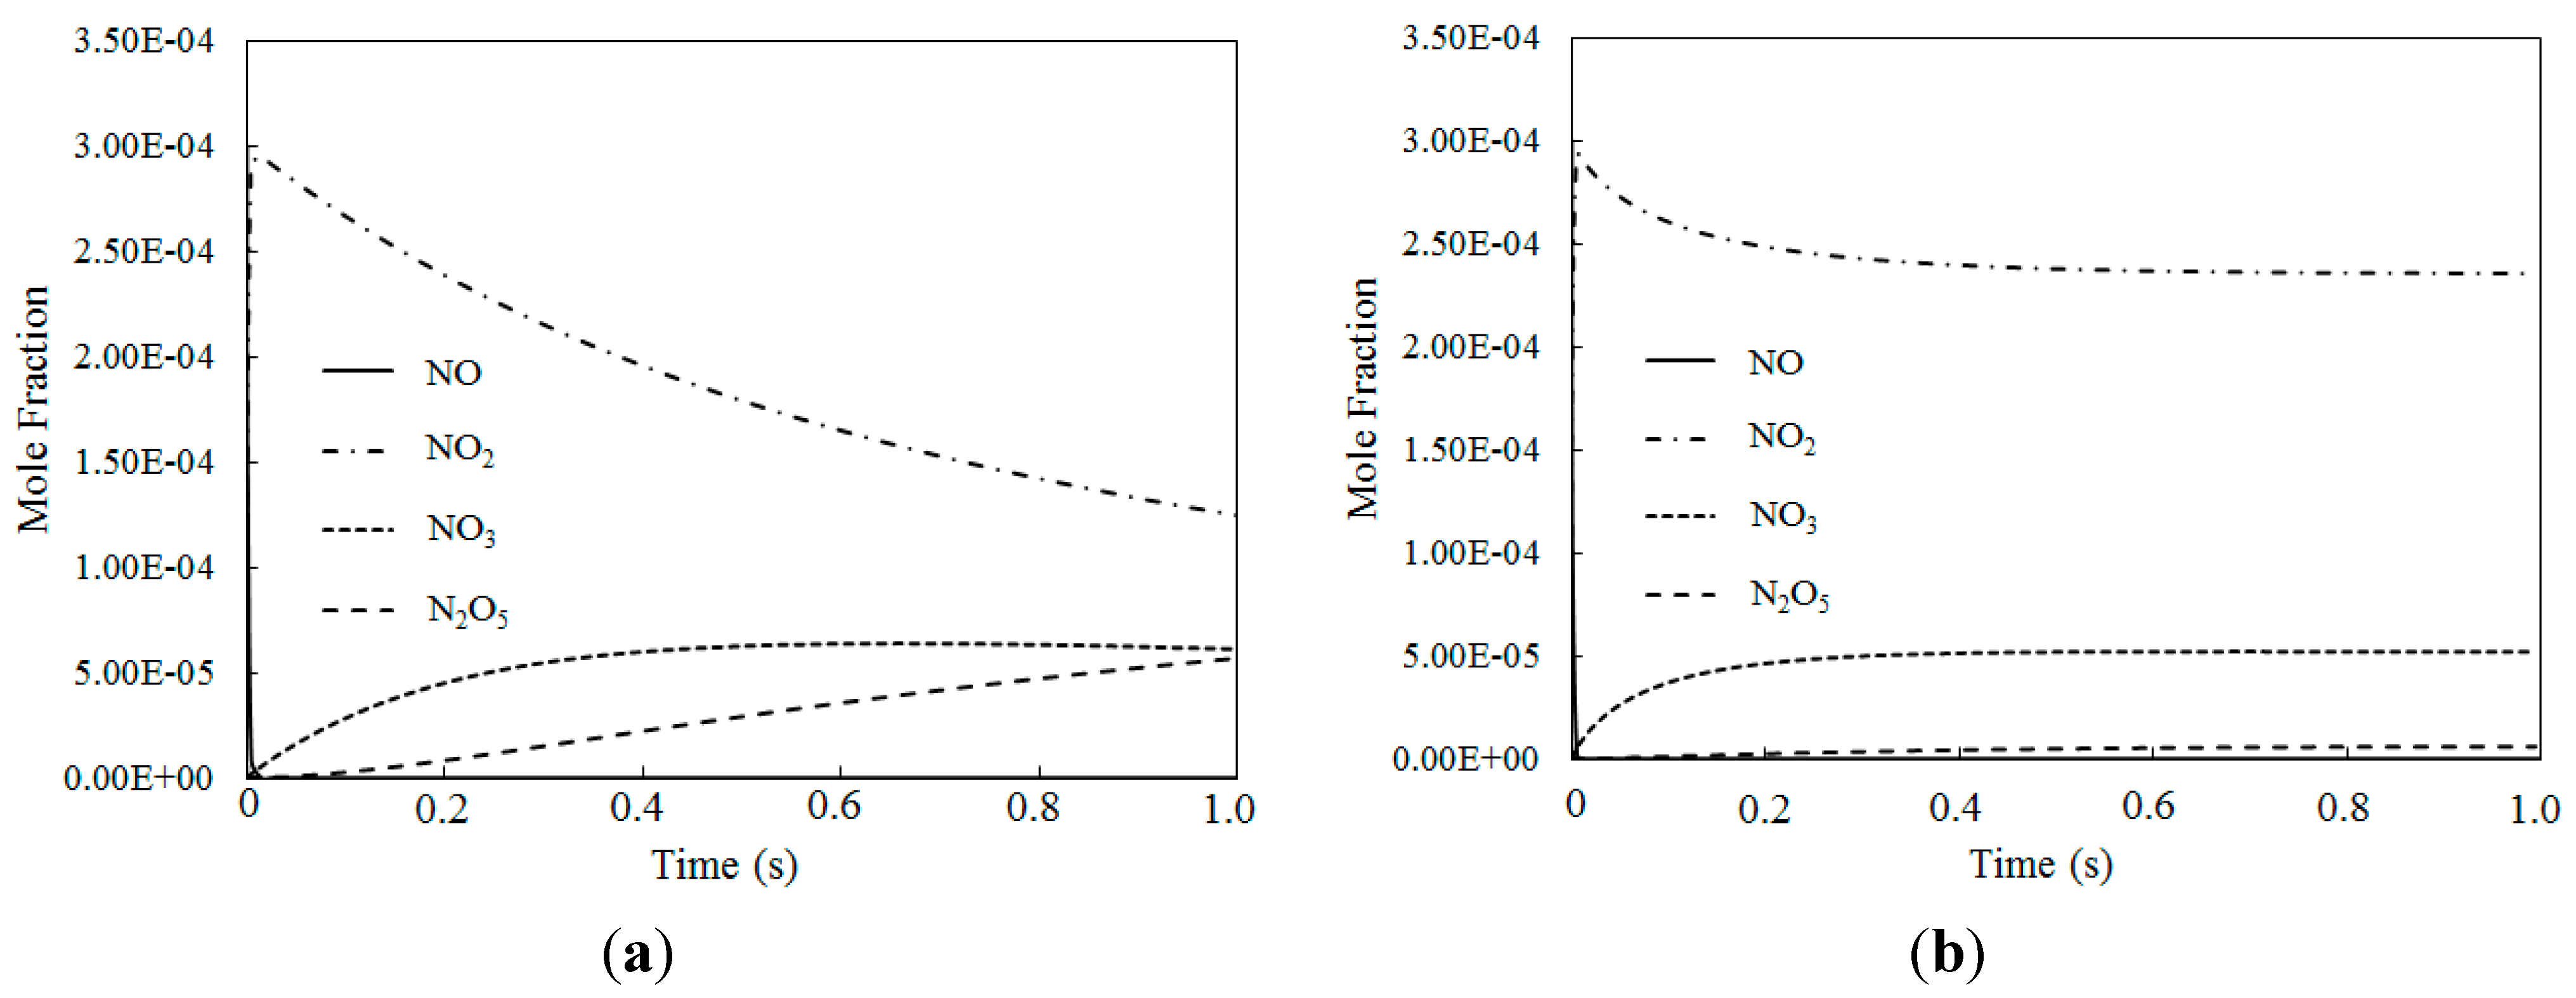
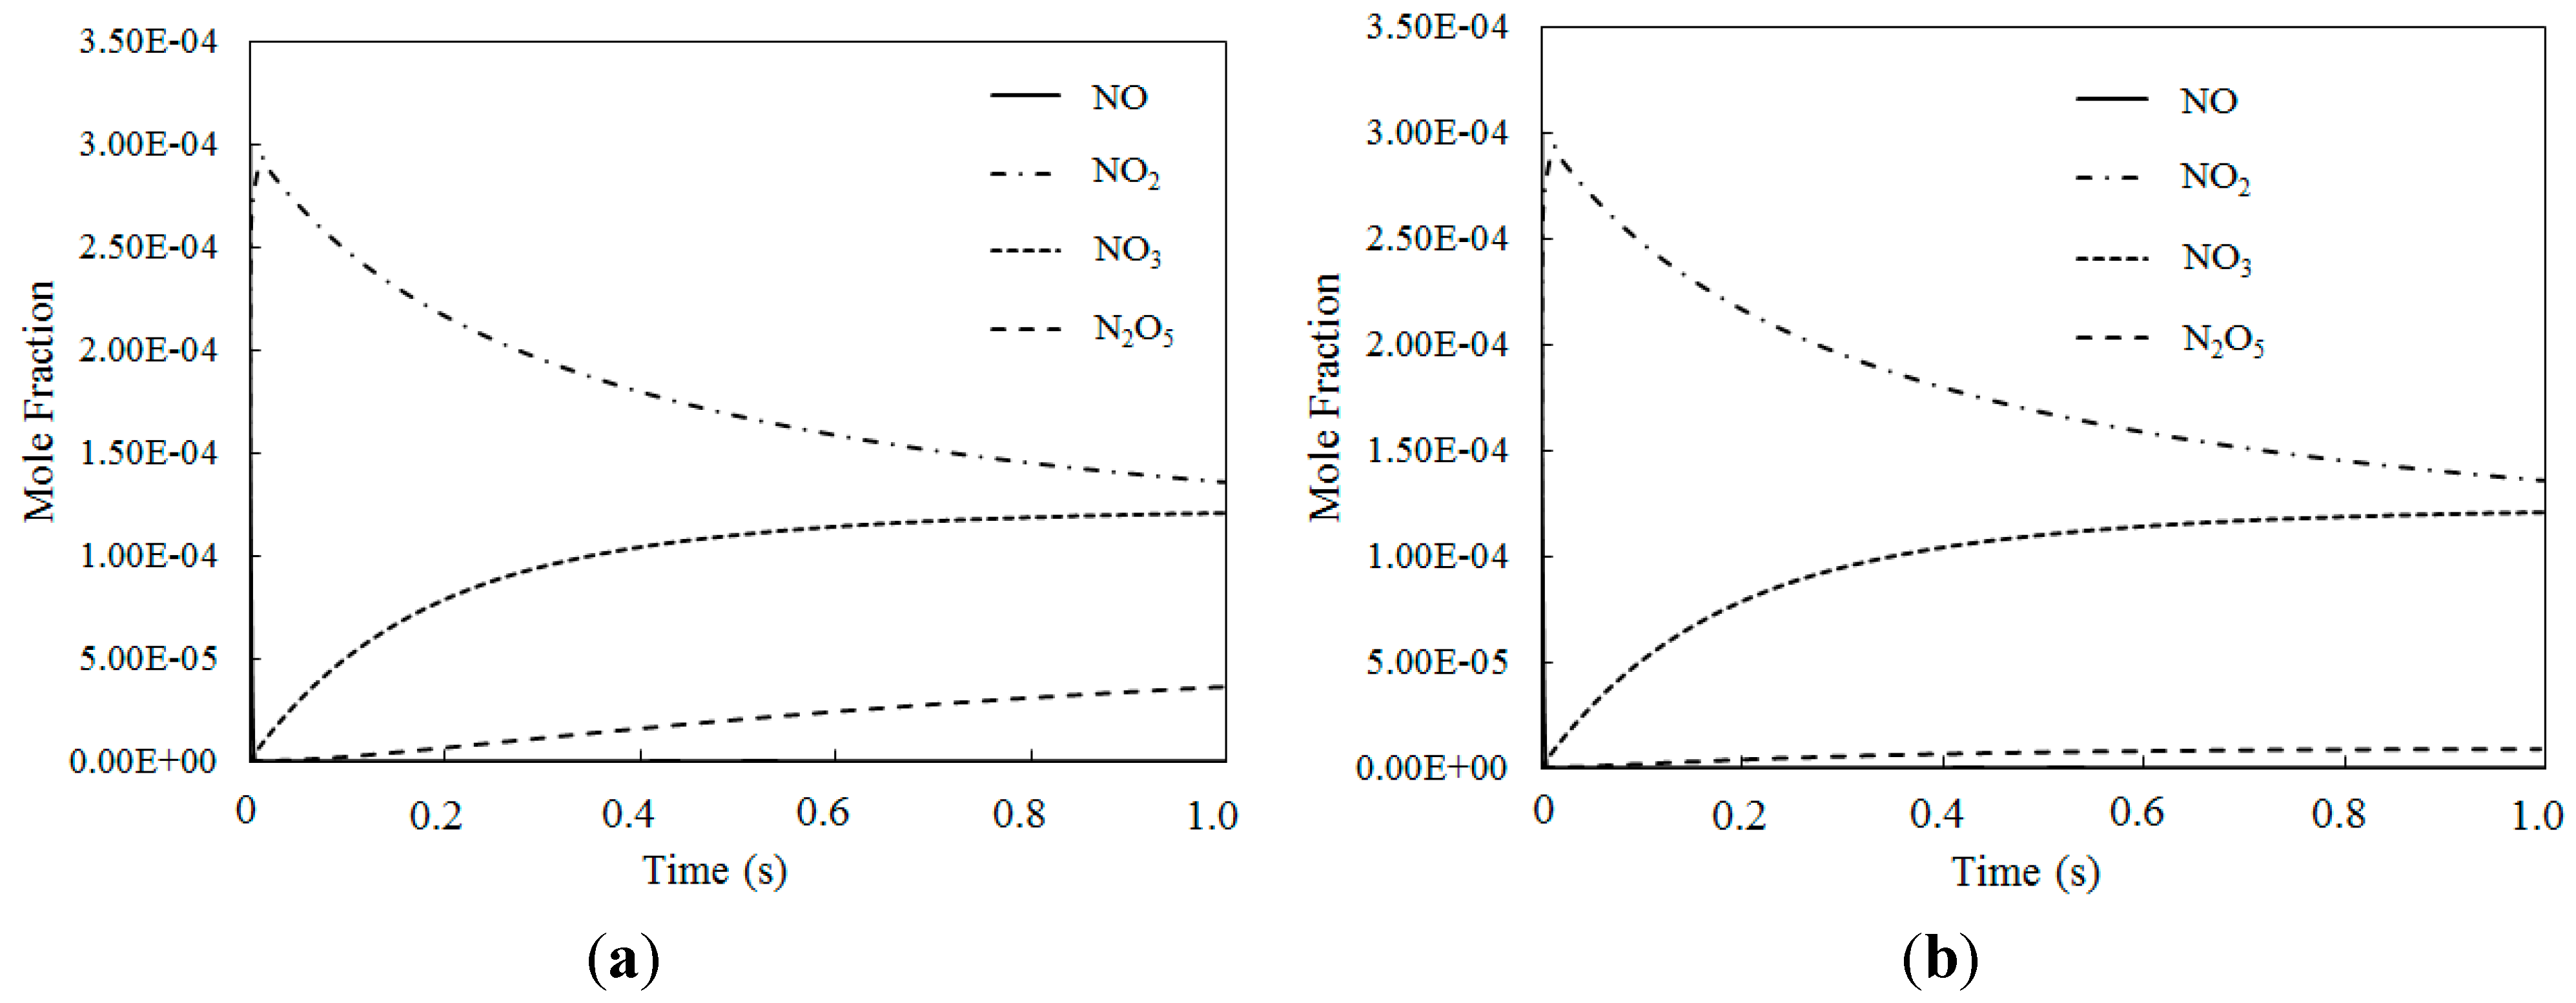
Figure 11 depicts the mole fraction variations of NO, NO2, NO3 and N2O5 for different temperatures where the O3/NO concentrations equaled 2.0 (with variable residence time). The NO2 mole fraction was nearly identical where the O3/NO concentrations equaled 1.5 and 2.0. However, where the O3/NO concentrations equaled 2, the NO3 mole fraction was higher than when the O3/NO concentration equaled 1.5, which indicated that the O3/NO concentration had a significant effect on the mole fractions of the nitrogen oxidized products.
Figure 10 and Figure 11 show that when the O3/NO concentration was greater than 1, higher oxidized products were formed (such as NO3, N2O5). NO2 was first oxidized to produce NO3 by the excess of O3, and then NO3 reacted with NO2 to produce N2O5, obtaining a higher oxidized state of NO.
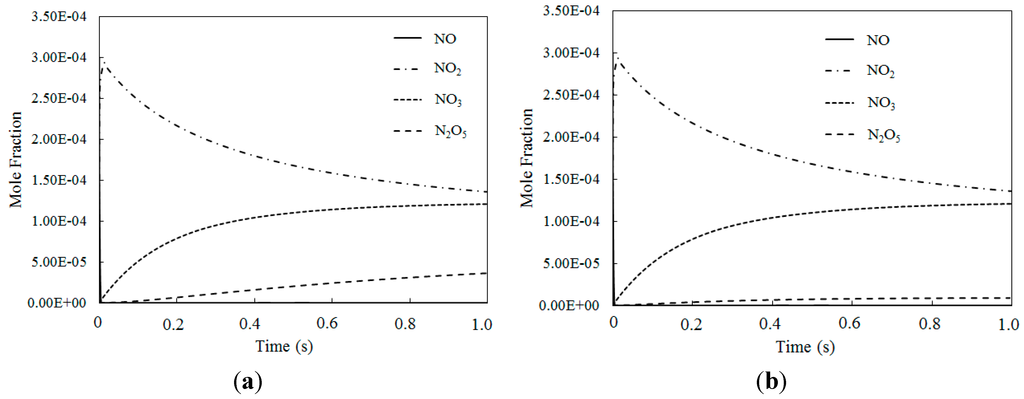
Figure 11.
The mole fraction variations of NO, NO2, NO3 and N2O5 at different temperatures where O3/NO concentration equals 2 for T = 100 °C and T = 200 °C. (a) T = 100 °C; (b) T = 200 °C.
Figure 11.
The mole fraction variations of NO, NO2, NO3 and N2O5 at different temperatures where O3/NO concentration equals 2 for T = 100 °C and T = 200 °C. (a) T = 100 °C; (b) T = 200 °C.
Simulation results for reaction products where the O3/NO concentrations were greater than 1 yielded clear evidence that NO could be oxidized to higher state oxidations such as NO3 and N2O5 by O3 with appropriate O3/NO concentrations. Additionally, the results confirmed that Model I and Model II could both be used in modelling the experimental data or in predicting the effect of ozone injection into flue gas in practical applications. Finally, to ensure that all NO is transformed into a high oxidation state (such as NO2, NO3 and N2O5), molar ratios where O3/NO is greater than 1 should be taken into account for practical applications.
4.3. SO2 Oxidation by O3
Figure 12 depicts the variations of SO2 concentrations with temperatures where the molar ratio of O3/SO2 was equal to 1; SO2 reduction rates are also shown. Experimental data provided by Wang [28], along with the simulation results of Model II, are also provided. The initial SO2 concentration feeding into the reactor was 500 ppm and the temperature ranged from 100 to 250 °C. Figure 12 also shows that the temperature variations had little effect on the SO2 mole concentration.
Simulations on the effect of the molar ratio of O3/SO2 on variations of SO2 concentrations were performed in order to obtain further insight into the interactions between O3 and SO2. Figure 13 depicts the variations of SO2 concentrations with O3/SO2 mole fractions at different temperatures. The O3/SO2 mole fractions ranged from 0 to 1.0. Simulations were performed with Model II. As discussed in Wang [28], Model I also demonstrated similar trends (not presented in the current study). Figure 12 shows that it was difficult for O3 to oxidize SO2 at various molar ratios of O3/SO2. Additionally, at lower temperatures (T = 100 °C), 10 ppm SO2 could be transformed into SO3 where the mole ratio of O3/SO2 equaled 1; however, it appeared that the injection of ozone still had little effect on the oxidation of SO2. This may be caused by the reaction O3 + SO2 = O2 + SO3 (R1), which is the first step for SO2 oxidation, had a large energy barrier in both Model I (13,910) and Model II (13,923). As such, it was difficult to trigger this reaction and, therefore, it was difficult for SO2 to be oxidized.
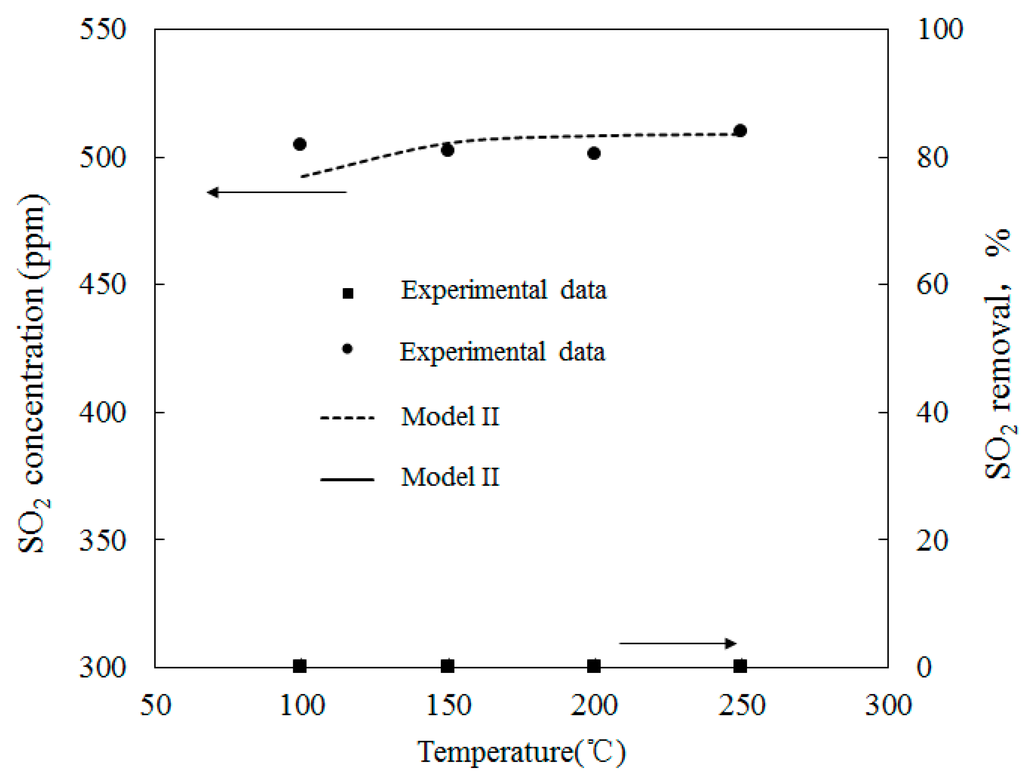
Figure 12.
Variations of SO2 concentration with temperatures where the mole ratio of O3/SO2 equals.
Figure 12.
Variations of SO2 concentration with temperatures where the mole ratio of O3/SO2 equals.
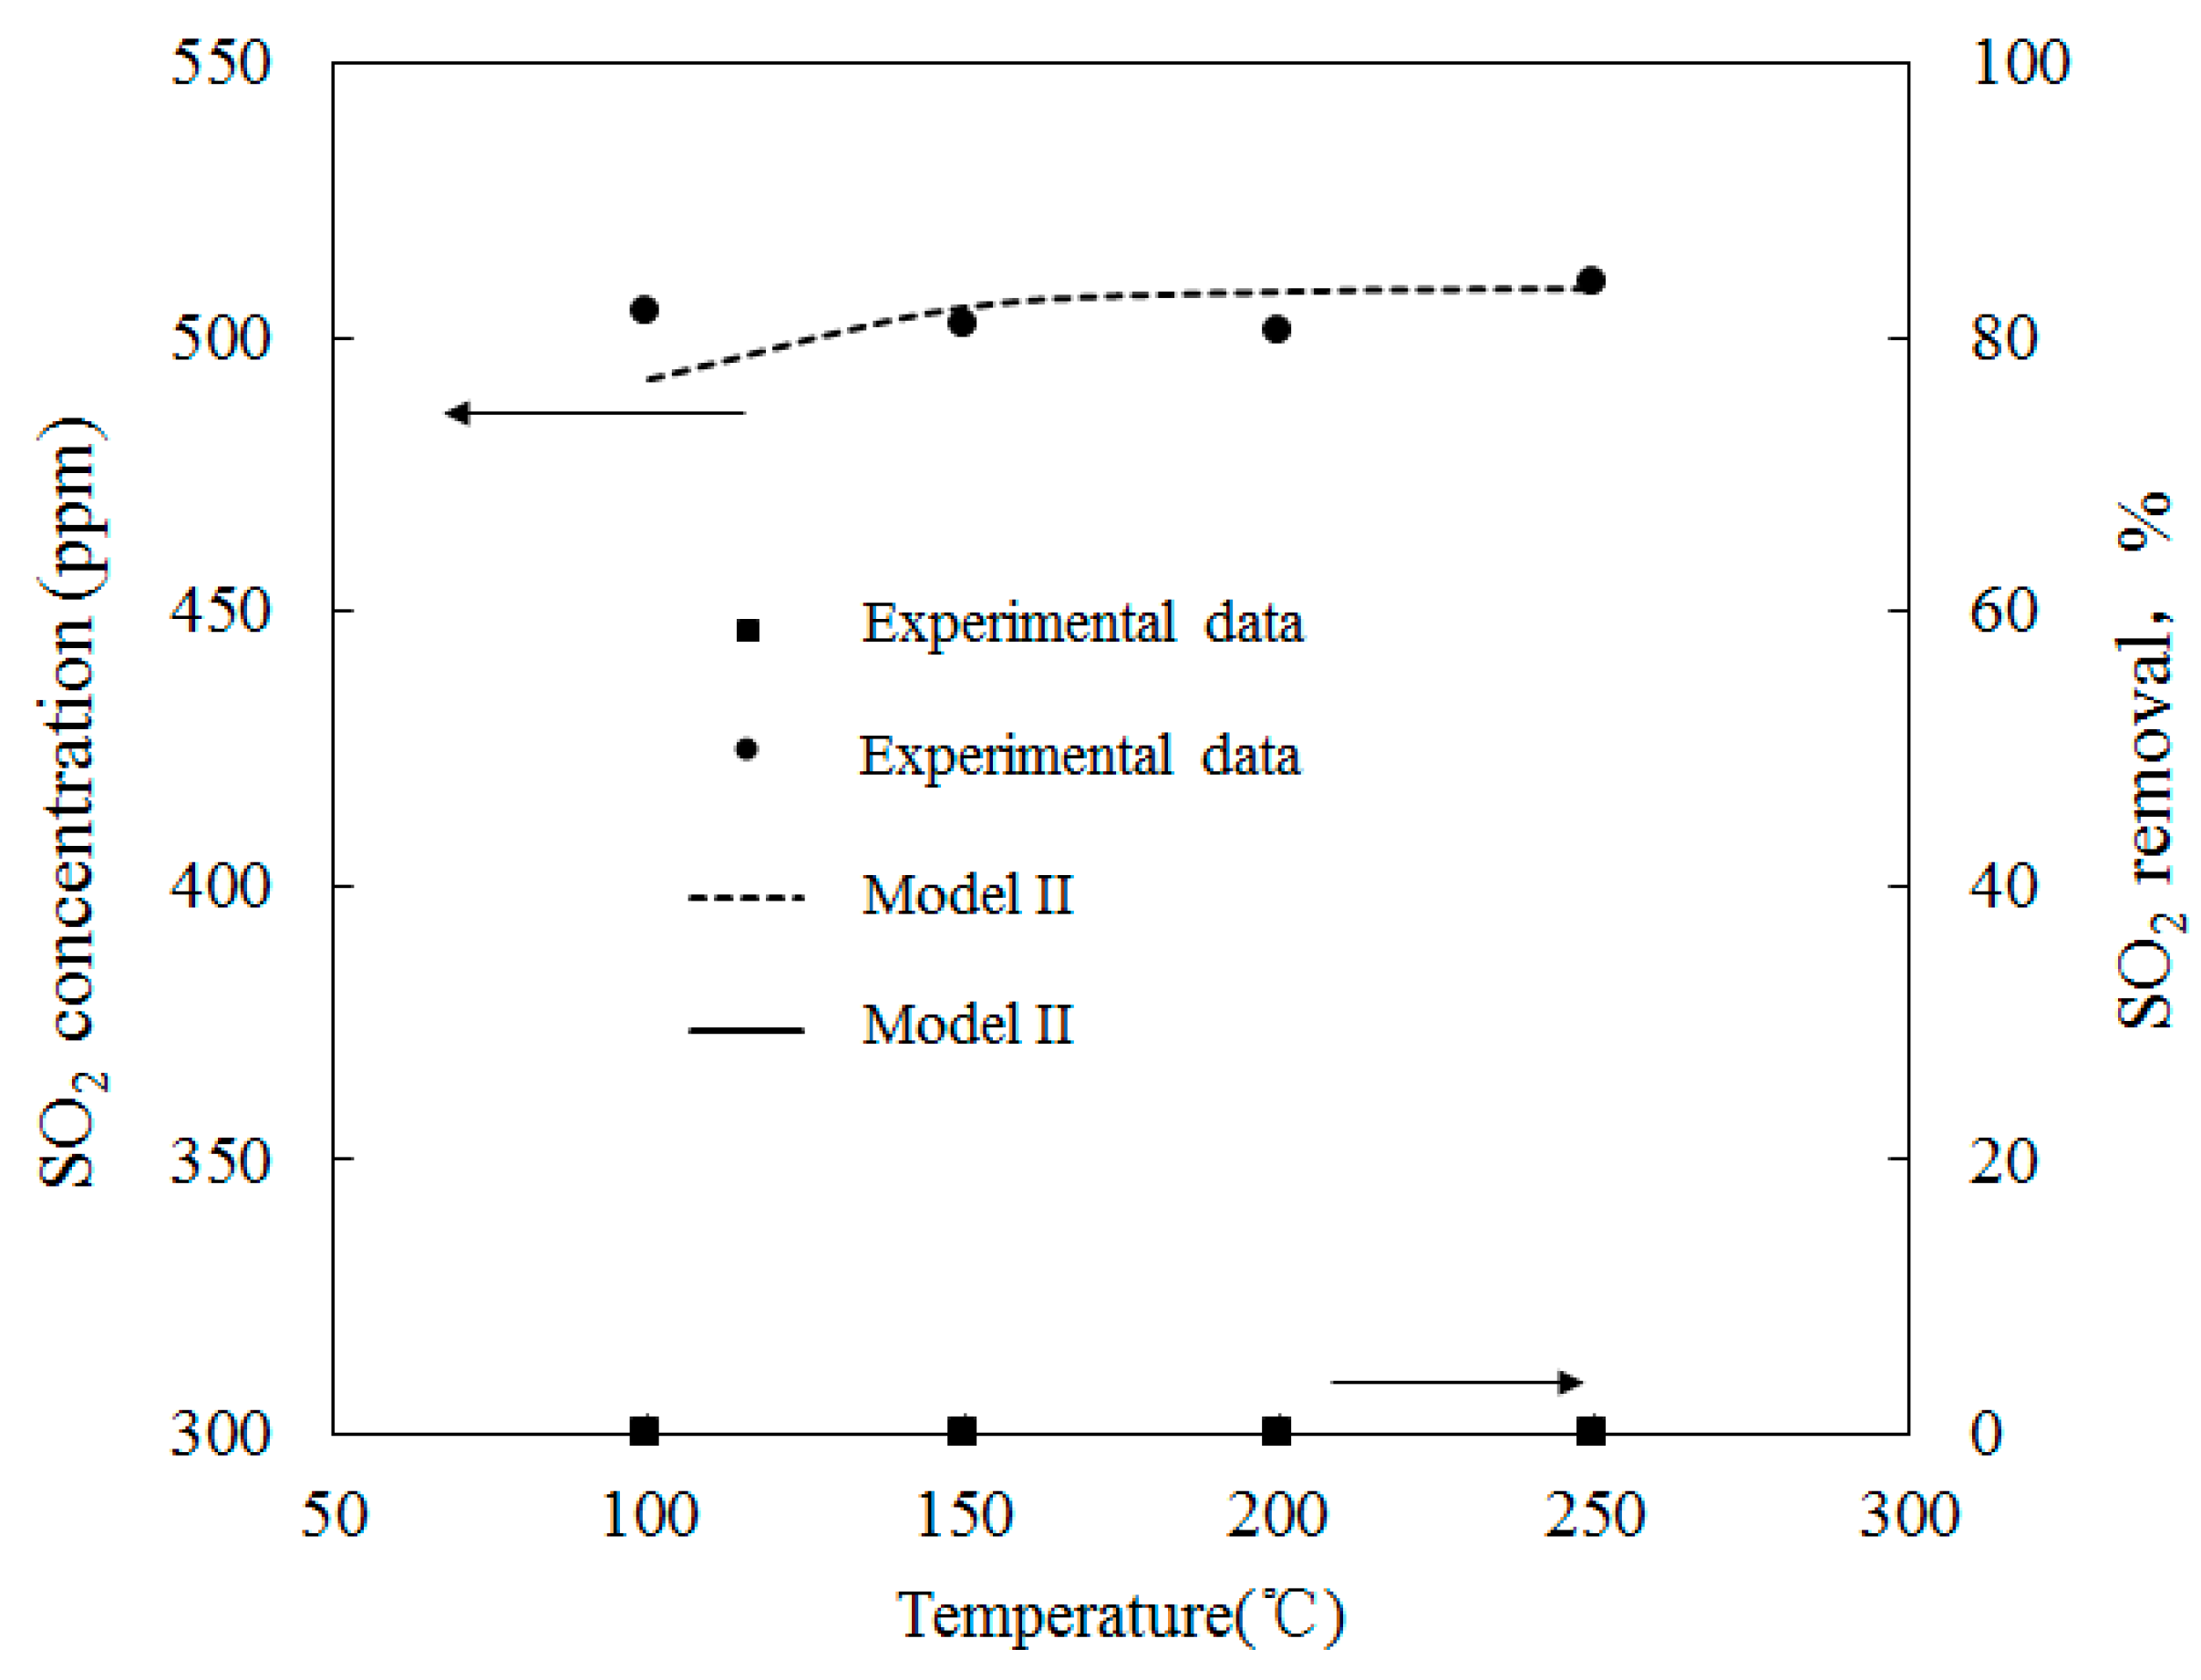
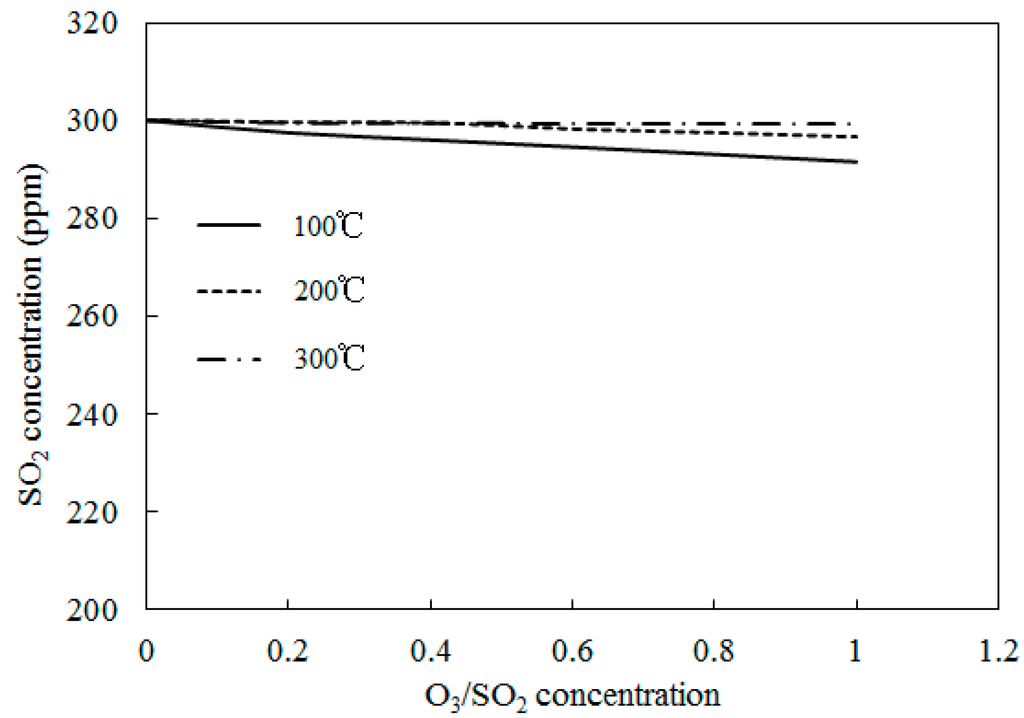
Figure 13.
Variations of SO2 concentrations with O3/SO2 mole fractions at different temperatures.
Figure 13.
Variations of SO2 concentrations with O3/SO2 mole fractions at different temperatures.

For the process of SO2 oxidation by O3, the results of both experiments and simulations indicated that SO2 was not significantly oxidized and that variations of reaction temperatures and O3/SO2 mole fractions had little effect on the SO2 reduction. The appearance of SO2 in the flue gas did not consume a large amount of O3.
4.4. Simultaneous Oxidation of NO and SO2 by O3
In the flue gas of a coal-fired power plant, large amounts of NO and SO2 are mixed; therefore, the interactions between SO2 and NO should be taken into account for practical applications of O3 injection. Simulations of Model I and Model II, where the O3/NO/SO2 mole fraction was 2:1:1, were conducted at different temperatures ranging from 100 to 250 °C. The results show that the appearance of NO did not promote the oxidation of SO2 by O3 and that the conversion of SO2 was difficult. Furthermore, the NO conversion rate was not affected by the addition of SO2, which shows that SO2 had little effect on the oxidation of NO in the simultaneous oxidation of NO and SO2 by ozone injection. This conclusion was also confirmed by Sun et al. [21] with situ IR measurements. Therefore, with respect to actual applications, O3 injections could help NO transform into NO2, NO3 and N2O5, which can then be absorbed in the scrubbing tower of the subsequent process with alkaline solution. Almost all of the SO2 will be absorbed with the alkaline solution because it is difficult for SO2 to be oxidized by the O3 injection. Therefore, a scrubbing tower should be applied in order to achieve the simultaneous removal of NO and SO2.
5. Conclusions
This study used numerical simulations with two kinetic models to investigate the oxidation process of NO, SO2 and NO/SO2 mixtures by O3. The computed results were compared with experimental data from previous research. Two kinetic mechanisms were taken into account for modeling issues.
Both of the models showed satisfactory agreement with the experimental data with regards to NO oxidization by O3. The results showed that NO concentration decreased as the mole ratio of O3/NO increased (where the mole ratio of O3/NO was less than 1). NO2 was the main product of the NO oxidation. The optimal reaction temperature for O3/NO ranged from 100 to 200 °C. As the temperature increased, O3 easily decomposed to O and O2 before reacting with NO. As such, the main oxidation reaction R1 of NO with O3 was difficult to trigger. Therefore, the NO conversion rates were lower at T = 300 °C compared with T = 100 °C and T = 200 °C.
When the molar ratio of O3/NO was greater than 1, a higher oxidation state of NO (such as NO3 and N2O5) was formed. Reaction NO3 + O3 = NO2 + O2 and reaction NO2 + NO3 = N2O5 showed significant results in the oxidation process. First, NO2 was generated; NO3 was then produced by the oxidization of NO2 and finally N2O5 was produced by NO3 reacting with NO2. Therefore, for practical applications, mole ratios of O3/NO greater than 1 are recommended in order to ensure that all NO is transformed into a high oxidation state (such as NO2, NO3 and N2O5).
Both the experimental results and numerical simulation results showed that the oxidation of SO2 was unaffected by injected ozone at different temperatures and mole ratios of O3/SO2. Computations of NO/SO2/O3 showed that the NO conservation rate was not affected by the addition of SO2 and that SO2 had little effect on the oxidation of NO in the simultaneous oxidation of NO and SO2 by the ozone injection. In summary, this study used two kinetic models for modeling the oxidation process of NO and SO2 by O3 injections. The optimized temperatures and mole ratios for NO/O3 for further applications of O3 injection for the control of pollutant emission in coal-fired power plants were suggested. Based on this study, a potentially viable facility for the simultaneous removal of NO, SO2 and PM2.5 was proposed.
Supplementary Files
Supplementary File 1Author Contributions
Bo Li presented the original idea for the study. The study itself was conducted by Bo li and the co-authors. Bo Li carried out the simulations and analysis, and also drafted the manuscript, which was subsequently revised by all authors. All authors have read and approved the final manuscript.
Conflicts of Interest
The authors declare no conflict of interest.
References
- Zhong, L.P.; Cao, Y.; Li, W.Y.; Pan, W.P.; Xie, K.C. Effect of the existing air pollutant control devices on mercury emission in coal-fired power plants. J. Fuel Chem. Technol. 2010, 38, 641–646. [Google Scholar] [CrossRef]
- Schopp, W.; Amann, M.; Cofala, J.; Heyes, C.; Klimont, Z. Integrated assessment of European air pollution emission control strategies. Environ. Model. Softw. 1999, 14, 1–9. [Google Scholar] [CrossRef]
- Schreifels, J.J.; Fu, Y.; Wilson, E.J. Sulfur dioxide control in China, policy evolution during the 10th and 11th Five-year Plans and lessons for the future. Energy Policy 2012, 48, 779–789. [Google Scholar] [CrossRef]
- Wang, F.; Du, Y.; Liu, Y.; Wang, X. The present development of flue gas denitrification technologies in domestic coal-fired power plants. Electr. Power Environ. Prot. 2007, 23, 20–23. [Google Scholar]
- Song, X.; Yan, M. Influence fctor analysis of the flue gas denitration of SCR design in the coal-fired power plant. Saf. Environ. Eng. 2013, 20, 68–71. [Google Scholar]
- Bao, J.; Yang, L.; Song, S.; Xiong, G. Separation of fine particles from gassed in wet flue gas desulfurization system using a cascade of double tower. Energy Fuel 2012, 26, 2090–2097. [Google Scholar] [CrossRef]
- Ma, Y. The Selection of Flue Gas DeNOx Technology in the Power Plant of China. Master’s Thesis, North China Electric Power University, Beijing, China, December 2005. [Google Scholar]
- Zhang, M.; Chen, J. The present situation and the development of the nitrogen oxides control in China’s coal-fired power plant. Sichuan Chem. Eng. 2009, 5, 44–52. (In Chinese) [Google Scholar]
- Carpenter, A.M. Advances in Multi-Pollutant Control; IEA: London, UK, 2013. [Google Scholar]
- Yan, J.Y.; Zheng, Z.; Yu, G.F. Progress in study on multi-pollutant control technology for coal-fired flue gas. Therm. Power Gener. 2011, 40, 9–13. [Google Scholar]
- Tavoulareas, E.S.; Jozewicz, W. Multi-Pollutant Emission Control Technology Options for Coal-Fired Power Plants; EPA Report EPA-600/R-05/034; EPA: McLean, VA, USA, 2005. [Google Scholar]
- Ghorishi, S.B.; Keeney, R.M.; Serre, S.D.; Gullett, B.K.; Jozewicz, W.S. Development of a Cl-impregnated activated carbon for entrained-flow capture of element mercury. Environ. Sci. Technol. 2002, 36, 4454–4459. [Google Scholar] [CrossRef] [PubMed]
- Callen, M.S.; Cruz, M.T.; Marinov, S.; Murillo, R.; Stefanova, M.; Mastral, A.M. Flue gas cleaning in power stations by using electron beam technology influence on PAH emission. Fuel Process. Technol. 2007, 88, 251–258. [Google Scholar] [CrossRef]
- Zhao, Y. Experiments and reaction characteristics of liquid phased simultaneous removal of SO2 and NO. Sci. China 2009, 52, 1768–1775. [Google Scholar] [CrossRef]
- Jin, D.S.; Deshwal, B.R.; Park, Y.S.; Lee, H.K. Simultaneous removal of SO2 and NO by wet scrubbing using aqueous chlorine dioxide solution. J. Hazard. Mater. 2006, 135, 412–417. [Google Scholar] [CrossRef] [PubMed]
- Yang, C.L. Aqueous absorption of nitric oxide induced by sodium chlorite oxidation in the presence of sulphur dioxide. Environ. Prog. 1998, 17, 80–85. [Google Scholar] [CrossRef]
- Liu, Y.; Zhang, J.; Sheng, C. Kinetic model of NO removal from SO2-containing simulated flue gas by wet UV/H2O2 advanced oxidation process. J. Chem. Eng. 2011, 168, 183–189. [Google Scholar] [CrossRef]
- Sun, W.Y.; Ding, S.L.; Zeng, S.S.; Su, S.; Jiang, W. Simultaneous absorption of NOx and SO2 from flue gas with pyrolusite slurry combined with gas-phase oxidation of NO using ozone. J. Hazard. Mater. 2011, 192, 124–130. [Google Scholar] [CrossRef] [PubMed]
- Wei, L.S.; Zhou, J.H.; Wang, Z.H.; Cen, K.F. Kinetic modelling of homogeneous low temperature multi-pollutant oxidation by ozone, the importance of SO and HCl in predicting oxidation. J. Zhejiang Uni. Sci. A 2006, 7, 335–339. [Google Scholar] [CrossRef]
- Wang, Z.H.; Zhou, J.; Zhu, Y.; Wen, Z.; Liu, J.; Cen, K. Simultaneous removal of NOx, SO2 and Hg in nitrogen flow in a narrow reactor by ozone injection, experimental results. Fuel Process. Technol. 2007, 88, 817–823. [Google Scholar] [CrossRef]
- Sun, C.; Zhao, N.; Zhuang, Z.K.; Wang, H.; Liu, Y.; Weng, X.; Wu, Z. Mechanisms and reaction pathways for simultaneous oxidation of NOx and SO2 by ozone determined by in situ IR measurements. J. Hazard. Mater. 2014, 274, 376–383. [Google Scholar] [CrossRef] [PubMed]
- Skalska, K.; Miller, J.S.; Ledakowicz, S. Intensification of NOx absorption process by means of ozone injection into exhaust gas stream. Chem. Eng. Process. Process Intensif. 2012, 61, 69–74. [Google Scholar] [CrossRef]
- Mok, Y.S. Absorption-reduction technique assisted by ozone injection and sodium sulfide for NOx removal from exhaust gas. Chem. Eng. J. 2006, 118, 63–67. [Google Scholar] [CrossRef]
- Sun, W.; Wang, Q.Y.; Ding, S.L.; Su, S. Simultaneous absorption of SO2 and NOx with pyrolusite slurry combined with gas-phase oxidation of NO using ozone, Effect of molar ratio of O2/(SO2 + 0.5 NOx) in flue gas. Chem. Eng. J. 2013, 228, 700–707. [Google Scholar] [CrossRef]
- Stamate, E.; Chen, W.; Jorgensen, L.; Jensen, T.K.; Fateev, A.; Michelsen, P.K. IR and UV gas absorption measurements during NOx reduction on an industrial nature gas fired power plant. Fuel 2010, 89, 978–985. [Google Scholar] [CrossRef]
- Mok, Y.S.; Lee, H.J. Removal of sulfur dioxide and nitrogen oxides by using ozone injection and absorption-reduction technique. Fuel Process. Technol. 2006, 87, 591–597. [Google Scholar] [CrossRef]
- Wang, Z.H. Mechanism Study on Multi-Pollution Control Simultaneously during Coal Combustion and Direct Numerical Simulation of Reaction Jet Flow. Ph.D. Thesis, Zhejiang University, Hangzhou, China, 2005. [Google Scholar]
- Wang, J. The Experimental Study of Oxidative-Desulfurization in the O3 Multi-Pollutant Control Technology. Master’s Thesis, Zhejiang University, Hangzhou, China, 2008. [Google Scholar]
- Wen, Z.C. Mechanism Investigation on the Oxidation and Degradation of Multiple Pollutants in Flue Gas by Ozone. Ph.D. Thesis, Zhejiang University, Hangzhou, China, 2009. [Google Scholar]
- Leeds NOx & SO2 Mechanism. Available online: http://garfield.chem.elte.hu/combustion/nox.htm (accessed on 17 December 2014).
- Kee, R.J.; Rupley, F.M.; Miller, J.A. Chemkin II: A Fortran Chemical Kinetics Package for the analysis of Gas-Phase Chemical Kinetics; Sandia Report, SAND 89-8009; Sandia National Laboratories: Livermore, CA, USA, 1989. [Google Scholar]
- Mallard, W.G.; Westley, F.; Herron, J.T.; Hampson, R.F.; Frizzell, D.H. NIST Chemical Kinetics Database; NIST: Gaithersburg, MD, USA, 1998. [Google Scholar]
- Skalska, K.; Miller, J.S.; Wilk, M.; Ledakowicz, S. Nitrogen oxidizes ozonation as a method for NOx emission abatement. Ozone Sci. Eng. 2012, 34, 252–258. [Google Scholar] [CrossRef]
© 2015 by the authors; licensee MDPI, Basel, Switzerland. This article is an open access article distributed under the terms and conditions of the Creative Commons Attribution license (http://creativecommons.org/licenses/by/4.0/).