
Beneficial Effect of Higher Dietary Fiber Intake on Plasma HDL-C and TC/HDL-C Ratio among Chinese Rural-to-Urban Migrant Workers

Abstract
:1. Introduction
2. Experimental Section
2.1. Study Subjects
2.2. Data Collection
2.2.1. Questionnaire Interview
2.2.2. Dietary Assessment
2.2.3. Anthropometric and Blood Pressure Measurement
2.2.4. Laboratory Assay
2.3. Statistical Analysis
3. Results and Discussion
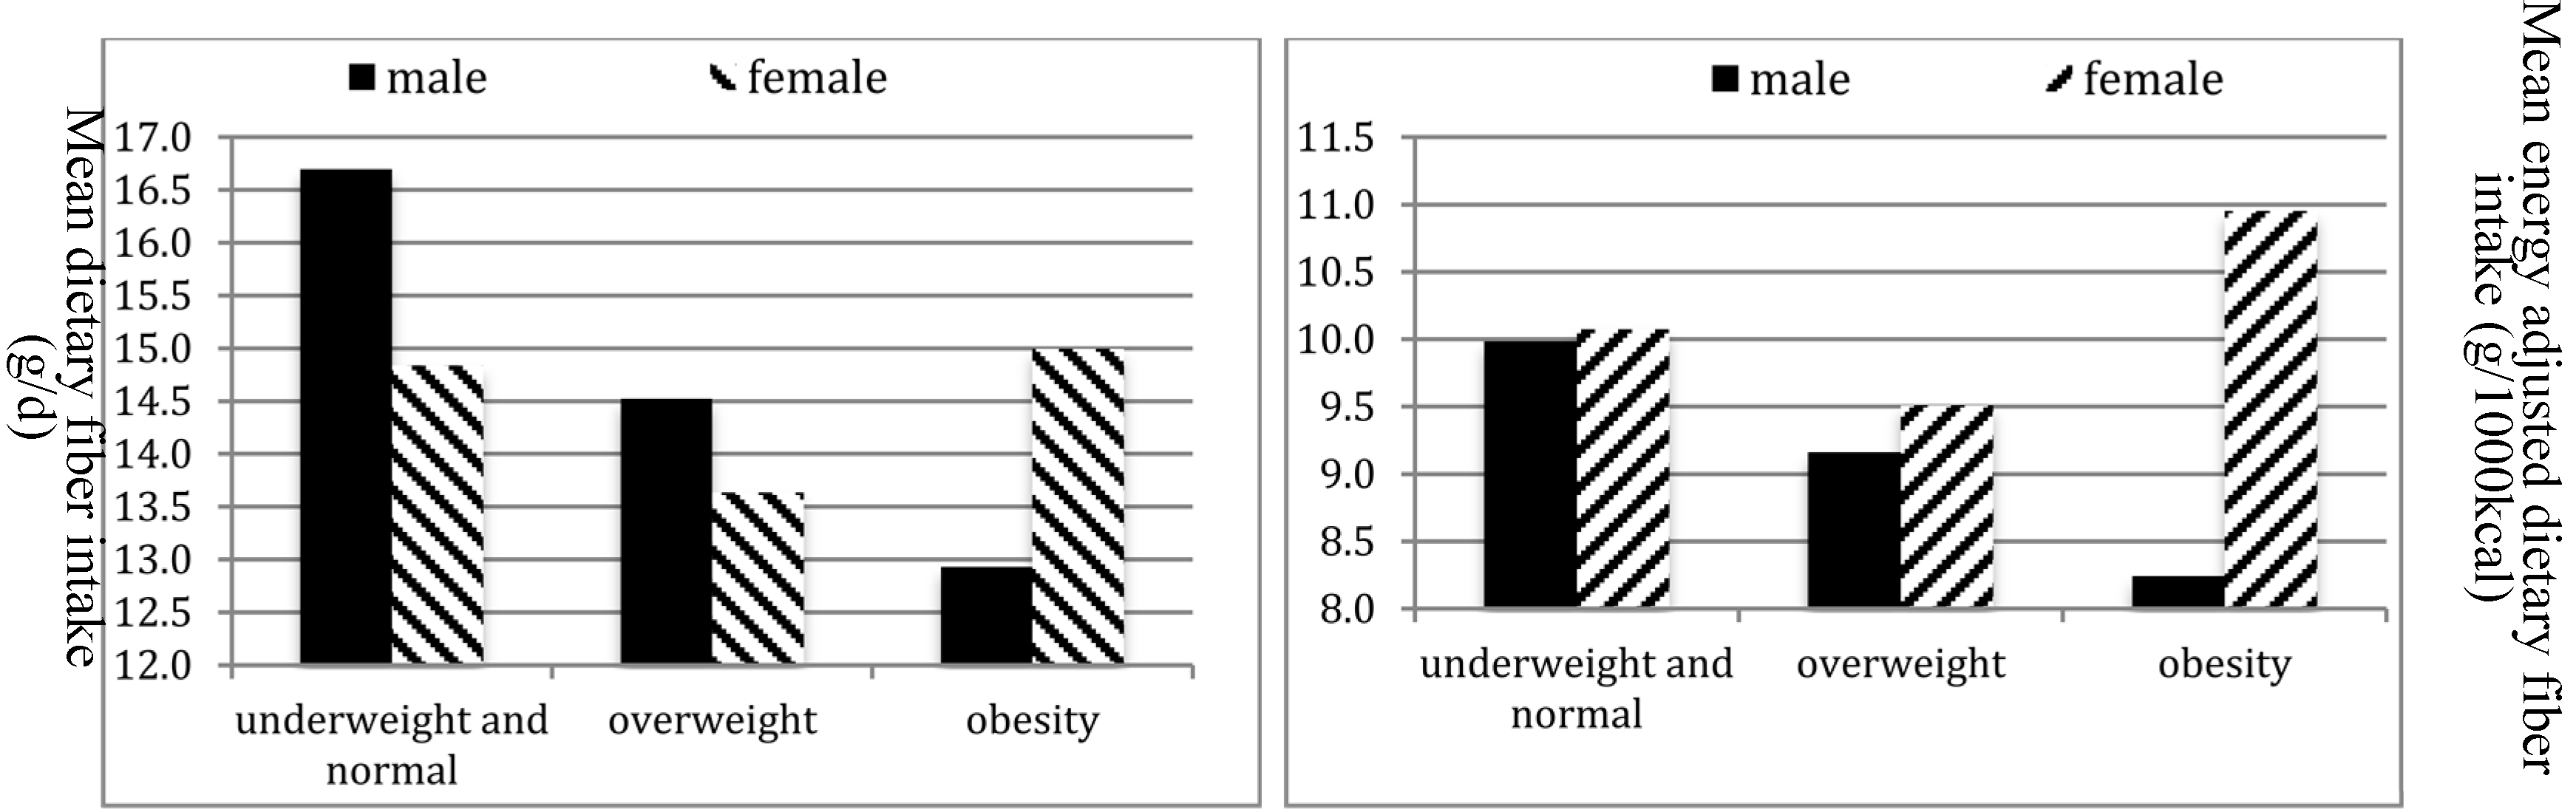
3.1. Results

| Men (n = 134) | Women (n = 272) | p-Value | |
|---|---|---|---|
| Age (year) | 36.7 ± 8.1 | 36.4 ± 7.5 | 0.628 |
| Weight (kg) | 60.8 ± 9.1 | 55.8 ± 8.9 | <0.001 |
| Height (cm) | 161.2 ± 7.0 | 152.9 ± 6.2 | <0.001 |
| Body mass index (kg/m2) | 24.1 ± 3.2 | 23.8 ± 3.3 | 0.235 |
| BMI category (%) | 0.043 | ||
| Underweight | 0.5 | 2.7 | |
| Normal weight | 53.9 | 57.1 | |
| Overweight | 34.7 | 29.0 | |
| Obesity | 10.4 | 11.3 | |
| Waist circumference (cm) | 77.2 ± 8.1 | 75.5 ± 8.8 | 0.006 |
| Hip circumference (cm) | 89.0 ± 5.7 | 90.1 ± 6.4 | 0.016 |
| Waist to hip ratio | 0.9 ± 0.06 | 0.8 ± 0.1 | <0.001 |
| Systolic blood pressure (mmHg) | 119.8 ± 15.7 | 115.3 ± 13.9 | <0.001 |
| Diastolic blood pressure (mmHg) | 73.6 ± 13.1 | 70.6 ± 9.8 | <0.001 |
| Smoking | <0.001 | ||
| Non-smoker (%) | 40.5 | 98.9 | |
| Ex-smoker (%) | 6.3 | 0.0 | |
| Current-smoker (%) | 53.2 | 1.1 | |
| Diet intake | |||
| Energy (kcal/day) | 1874.8 ± 694.9 | 1657.0 ± 638.8 | <0.001 |
| Protein (g/day) | 62.5 ± 34.4 | 54.0 ± 32.2 | 0.001 |
| Total fat (g/day) | 70.3 ± 36.1 | 64.2 ± 31.6 | 0.120 |
| Saturated fatty acids (%kcal) | 14.6 ± 12.8 | 15.4 ± 11.7 | 0.344 |
| Polyunsaturated fatty acids (%kcal) | 9.7 ± 6.7 | 10.6 ± 7.4 | 0.079 |
| Energy adjusted dietary fiber (g/1000 kcal) | 9.5 ± 6.7 | 10.0 ± 6.2 | 0.298 |
| Total dietary fiber (g/day) | 15.5 ± 8.0 | 14.5 ± 7.0 | 0.061 |
| Total dietary fiber category | 0.313 | ||
| ~18 g/day | 73.9 | 78.6 | |
| ~30 g/day | 20.5 | 17.1 | |
| ≥30 g/day | 5.6 | 4.3 | |
| Serum biomarkers | |||
| Total cholesterol (mmonl/L) | 4.6 ± 0.9 | 4.4 ± 0.8 | 0.006 |
| HDL cholesterol (mmol/L) | 1.4 ± 0.3 | 1.5 ± 0.3 | <0.001 |
| LDL cholesterol (mmol/L) | 2.2 ± 0.5 | 2.1 ± 0.5 | 0.001 |
| Triglycerides (mmol/L) | 1.5 ± 0.9 | 1.0 ± 0.8 | <0.001 |
| TC to HDL-C ratio | 3.4 ± 0.9 | 3.1 ± 0.7 | <0.001 |
| Blood Glucose (mmol/L) | 5.0 ± 0.9 | 5.1 ± 0.9 | 0.427 |

| Low | Mid | High | % Difference (high vs. low) | p for one-way ANOVA | p for linear trend | ||||||
|---|---|---|---|---|---|---|---|---|---|---|---|
| Mean | S.D. | Mean | S.D. | Mean | S.D. | ||||||
| Men (n = 502) | |||||||||||
| Systolic BP (mmHg) | 120.2 | 16.2 | 119.9 | 15.4 | 120.8 | 14.9 | 0.5 | 0.971 | 0.873 | ||
| Diastolic BP (mmHg) | 73.6 | 13.2 | 74.7 | 12.3 | 76.7 | 11.8 | 4.0 | >0.511 | 0.306 | ||
| Total cholesterol (mmol/L) | 4.6 | 0.9 | 4.6 | 1.0 | 4.4 | 0.9 | −4.1 | >0.599 | 0.379 | ||
| HDL cholesterol (mmol/L) | 1.3 | 0.3 | 1.4 | 0.3 | 1.5 * | 0.3 | 11.3 | >0.014 | 0.006 | ||
| LDL cholesterol (mmol/L) | 2.2 | 0.5 | 2.2 | 0.5 | 2.0 | 0.5 | −8.8 | >0.301 | 0.135 | ||
| TC/HDL-C | 3.5 | 0.9 | 3.4 | 0.8 | 3.0 * | 0.5 | −17.5 | 0.011 | 0.004 | ||
| Triglycerides (mmol/L) | 1.5 | 0.8 | 1.6 | 1.0 | 1.6 | 0.8 | 7.4 | 0.841 | 0.613 | ||
| Blood Glucose (mmol/L) | 5.0 | 0.9 | 5.0 | 0.7 | 4.8 | 0.6 | −3.7 | 0.642 | 0.347 | ||
| Age (year) | 36.5 | 8.3 | 37.5 | 7.7 | 36.2 | 8.9 | −1.1 | 0.630 | 0.841 | ||
| Body mass index (kg/m2) | 24.5 | 3.3 | 23.2 * | 2.5 | 21.8 * | 2.8 | −12.2 | <0.001 | <0.001 | ||
| Waist circumference (cm) | 77.7 | 8.9 | 77.7 | 8.9 | 75.7 | 6.9 | −2.6 | 0.613 | 0.323 | ||
| Waist-to-hip ratio | 0.9 | 0.1 | 0.9 | 0.1 | 0.9 | 0.1 | −1.2 | 0.970 | 0.807 | ||
| Total dietary energy (kcal/day) | 1875 | 725 | 1887 | 701 | 2093 | 861 | 10.4 | 0.423 | 0.190 | ||
| Total dietary protein (g/day) | 54.9 | 27.1 | 80.2 * | 45.4 | 100.2 * | 34.5 | 45.2 | <0.001 | <0.001 | ||
| Total dietary carbohydrate (g/day) | 427.9 | 338.5 | 259.7 * | 125.2 | 206.1 * | 97.6 | −107.6 | <0.001 | <0.001 | ||
| Total dietary fat (g/day) | 64.9 | 48.8 | 86.2 * | 73.9 | 90.7 | 61.7 | 28.4 | 0.003 | 0.041 | ||
| Dietary saturated fat (% of energy) | 13.8 | 9.8 | 17.4 | 20.6 | 16.2 | 9.5 | 15.0 | 0.081 | 0.400 | ||
| Dietary polyunsaturated fat (% of energy) | 9.0 | 4.6 | 12.2 * | 9.6 | 11.1 | 5.9 | 18.4 | <0.001 | 0.140 | ||
| Women (n = 532) | |||||||||||
| Systolic BP (mmHg) | 115.7 | 14.6 | 117.1 | 16.1 | 113.0 | 10.4 | −2.4 | 0.594 | 0.473 | ||
| Diastolic BP (mmHg) | 70.8 | 10.5 | 71.8 | 9.5 | 71.3 | 9.0 | 0.6 | 0.793 | 0.867 | ||
| Total cholesterol (mmol/L) | 4.5 | 0.8 | 4.4 | 0.7 | 4.5 | 0.9 | 1.3 | 0.492 | 0.758 | ||
| HDL cholesterol (mmol/L) | 1.3 | 0.3 | 1.5 | 0.3 | 1.5 | 0.2 | 11.5 | 0.089 | 0.031 | ||
| LDL cholesterol (mmol/L) | 2.1 | 0.5 | 1.9 | 0.5 | 2.3 | 0.6 | 7.1 | 0.025 | 0.201 | ||
| TC/HDL-C | 3.6 | 0.7 | 3.0 | 0.5 | 3.2 * | 0.9 | −12.7 | 0.021 | 0.022 | ||
| Triglycerides (mmol/L) | 1.0 | 0.8 | 1.2 | 0.9 | 1.1 | 0.8 | 12.3 | 0.369 | 0.508 | ||
| Blood Glucose (mmol/L) | 5.0 | 0.8 | 5.0 | 0.6 | 5.1 | 0.6 | 0.6 | 0.892 | 0.887 | ||
| Age (year) | 36.5 | 7.4 | 36.3 | 7.6 | 35.4 | 8.4 | −3.1 | 0.831 | 0.554 | ||
| Body mass index (kg/m2) | 23.8 | 3.2 | 23.7 | 3.9 | 23.6 | 2.8 | −1.0 | 0.918 | 0.772 | ||
| Waist circumference (cm) | 76.0 | 9.4 | 73.4 | 9.5 | 76.7 | 9.0 | 0.9 | 0.119 | 0.765 | ||
| Waist-to-hip ratio | 0.8 | 0.1 | 0.8 | 0.1 | 0.8 | 0.1 | 0.0 | 0.204 | 0.888 | ||
| Total dietary energy (kcal/day) | 1646 | 656 | 1687 | 680 | 1708 | 848 | 3.6 | 0.848 | 0.715 | ||
| Total dietary protein (g/day) | 49.3 | 28.0 | 67.4 * | 41.1 | 83.9 * | 34.5 | 41.2 | <0.001 | <0.001 | ||
| Total dietary carbohydrate (g/day) | 270.7 | 119.2 | 223.5 * | 81.3 | 178.3* | 79.6 | −51.8 | <0.001 | <0.001 | ||
| Total dietary fat (g/day) | 62.0 | 48.7 | 64.3 | 56.7 | 62.0 | 48.7 | 0.0 | 0.105 | 0.034 | ||
| Dietary saturated fat (% of energy) | 14.8 | 9.9 | 16.2 | 16.3 | 19.9 | 15.6 | 25.5 | 0.181 | 0.088 | ||
| Dietary polyunsaturated fat (% of energy) | 9.8 | 5.0 | 12.1 | 11.3 | 18.2 * | 15.6 | 46.1 | <0.001 | <0.001 | ||
3.2. Discussion
| Low | Median | High | %Difference (high vs. low) | p for ANCOVA | p for linear trend | ||||
|---|---|---|---|---|---|---|---|---|---|
| Mean | S.E.M | Mean | S.E.M | Mean | S.E.M | ||||
| Men (n = 502) a | |||||||||
| Total cholesterol (mmol/L) | 4.6 | 0.04 | 4.5 | 0.10 | 4.5 | 0.19 | −3.4 | 0.585 | 0.472 |
| HDL cholesterol (mmol/L) | 1.3 | 0.02 | 1.4 | 0.03 | 1.5 * | 0.06 | 10.1 | 0.020 | 0.007 |
| LDL cholesterol (mmol/L) | 2.2 | 0.03 | 2.2 | 0.06 | 2.0 | 0.11 | −8.9 | 0.316 | 0.135 |
| TC/HDL-C | 3.5 | 0.05 | 3.3 | 0.09 | 3.1 * | 0.17 | −14.4 | 0.028 | 0.014 |
| Triglycerides (mmol/L) | 1.5 | 0.06 | 1.6 | 0.14 | 1.7 | 0.27 | 9.0 | 0.361 | 0.184 |
| Blood Glucose (mmol/L) | 5.0 | 0.04 | 5.0 | 0.10 | 4.8 | 0.19 | −3.7 | 0.939 | 0.940 |
| Systolic BP (mmHg) | 120.3 | 0.76 | 119.8 | 1.79 | 123.6 | 3.45 | 2.7 | 0.603 | 0.339 |
| Diastolic BP (mmHg) | 73.7 | 0.62 | 74.4 | 1.46 | 78.1 | 2.82 | 5.7 | 0.298 | 0.127 |
| Women (n = 532) a | |||||||||
| Total cholesterol (mmol/L) | 4.4 | 0.04 | 4.4 | 0.10 | 4.5 | 0.19 | 1.1 | 0.831 | 0.689 |
| HDL cholesterol (mmol/L) | 1.4 | 0.01 | 1.4 | 0.03 | 1.5 | 0.07 | 6.9 | 0.112 | 0.037 |
| LDL cholesterol (mmol/L) | 2.1 | 0.02 | 1.94 | 0.06 | 2.2 | 0.12 | 6.7 | 0.034 | 0.233 |
| TC/HDL-C | 3.5 | 0.04 | 3.1 | 0.08 | 3.1 * | 0.17 | −11.1 | 0.048 | 0.024 |
| Triglycerides (mmol/L) | 1.0 | 0.03 | 1.0 | 0.09 | 1.0 | 0.18 | −1.0 | 0.786 | 0.519 |
| Blood Glucose (mmol/L) | 5.0 | 0.04 | 5.1 | 0.10 | 5.0 | 0.20 | 0.3 | 0.803 | 0.508 |
| Systolic BP (mmHg) | 115.4 | 0.68 | 117.6 | 1.85 | 113.6 | 3.51 | −1.5 | 0.450 | 0.624 |
| Diastolic BP (mmHg) | 70.8 | 0.49 | 72.0 | 1.33 | 71.1 | 2.52 | 0.5 | 0.688 | 0.900 |
4. Conclusions
Acknowledgements
Author contributions
Conflicts of Interest
References
- World Health Organization. The 10 Leading Causes of Death in the World, 2000 and 2012; World Health Organization: Geneva, Switzerland, 2014. [Google Scholar]
- World Health Organization. Global Status Report on Noncommunicable Diseases 2010; World Health Organization: Geneva, Switzerland, 2011. [Google Scholar]
- EFSA Panel on Dietetic Products and Allergies (NDA). Scientific opinion on dietary reference values for carbohydrates and dietary fibre. EFSA J. 2010, 8. [Google Scholar] [CrossRef]
- Joint FAO/WHO expert consultation on diet NatPoCD. In Diet, Nutrition, and the Prevention of Chronic Diseases; WHO Technical Report series; WHO: Geneva, Switzerland, 2003; pp. 91634–91663.
- Trowell, H. Ischemic heart disease and dietary fiber. Am. J. Clin. Nutr. 1972, 25, 926–932. [Google Scholar] [PubMed]
- Truswell, A.S. Cereal grains and coronary heart disease. Eur. J. Clin. Nutr. 2002, 56, 1–14. [Google Scholar] [CrossRef] [PubMed]
- Van Horn, L.; McCoin, M.; Kris-Etherton, P.M.; Burke, F.; Carson, J.A.; Champagne, C.M.; Karmally, W.; Sikand, G. The evidence for dietary prevention and treatment of cardiovascular disease. J. Am. Diet Assoc. 2008, 108, 287–331. [Google Scholar]
- Mente, A.; de Koning, L.; Shannon, H.S.; Anand, S. A systematic review of the evidence supporting a causal link between dietary factors and coronary heart disease. Arch. Internal Med. 2009, 169, 659–669. [Google Scholar] [CrossRef]
- Ballesteros, M.N.; Cabrera, R.M.; Saucedo, M.S.; Yepiz-Plascencia, G.M.; Ortega, M.I.; Valencia, M.E. Dietary fiber and lifestyle influence serum lipids in free living adult men. J. Am. Coll. Cardiol. 2001, 20, 649–655. [Google Scholar]
- Zhai, F.; He, Y.; Hu, Y.; Wang, Z.; Yu, W.; Yang, X. The status of dietary fiber intake of Chinese people in 2002. Acta Nutrimenta Sinica 2005, 27, 444–447. [Google Scholar]
- Emerging Risk Factors Collaboration; Di Angelantonio, E.; Sarwar, N.; Perry, P.; Kaptoge, S.; Ray, K.K.; Thompson, A.; Wood, A.M.; Lewington, S.; Sattar, N.; et al. Major lipids, apolipoproteins, and risk of vascular disease. JAMA 2009, 302, 1993–2000. [Google Scholar]
- Yanai, H.; Katsuyama, H.; Hamasaki, H.; Abe, S.; Tada, N.; Sako, A. Effects of carbohydrate and dietary fiber intake, glycemic index and glycemic load on HDL metabolism in Asian populations. J. Clin. Med. Res. 2014, 6, 321–326. [Google Scholar] [PubMed]
- Zhang, J.; Li, L.; Song, P.; Wang, C.; Man, Q.; Meng, L.; Kurilich, A. Randomized controlled trial of oatmeal consumption versus noodle consumption on blood lipids of urban Chinese adults with hypercholesterolemia. Nutr. J. 2012, 11. [Google Scholar] [CrossRef]
- Dietary Guidelines for Chinese Residents; Chinese Nutrition Society: Beijing, China, 2009.
- Möller, J.R. Dietary Fibre—Codex Definition and Methods of Analysis; A White Paper from FOSS; FOSS: Hilleroed, Denmark, 2011. [Google Scholar]
- Deriemaeker, P.A.D.; Hebbelinck, M.; Clarys, P. Validation of a 3-day diet diary: Comparison with a 7-day diet diary and a FFQ. Med. Sci. Sports Exerc. 2006, 38, S328. [Google Scholar] [CrossRef]
- Yang, Y.X.; Wang, G.Y.; Pan, X.C. China Food Composition 2002; Peking University Medical Press: Beijing, China, 2002. [Google Scholar]
- Stookey, J.D. Energy density, energy intake and weight status in a large free-living sample of Chinese adults: Exploring the underlying roles of fat, protein, carbohydrate, fiber and water intakes. Eur. J. Clin. Nutr. 2001, 55, 349–359. [Google Scholar] [CrossRef] [PubMed]
- Multiple Source Method; Department of Epidemiology of the German Institute of Human Nutrition Potsdam-Rehbrucke: Nuthetal, Germany, 2009.
- Kitamura, A.; Iso, H.; Naito, Y.; Iida, M.; Konishi, M.; Folsom, A.R.; Sato, S.; Kiyama, M.; Nakamura, M.; Sankai, T.; et al. High-density lipoprotein cholesterol and premature coronary heart disease in urban Japanese men. Circulation 1994, 89, 2533–2539. [Google Scholar] [CrossRef] [PubMed]
- Mertens, A.; Holvoet, P. Oxidized LDL and HDL: Antagonists in atherothrombosis. FASEB J. Off. Publ. Fed. Am. Soc. Exp. Biol. 2001, 15, 2073–2084. [Google Scholar]
- Schaffer, A.; Verdoia, M.; Barbieri, L.; Aprami, T.M.; Suryapranata, H.; Marino, P.; Luca, G.D.; Novara Atherosclerosis Study Group. High-density lipoproteins and coronary artery disease: A single-center cohort study. Angiology 2014, 65, 696–702. [Google Scholar] [CrossRef] [PubMed]
- Eshak, E.S.; Iso, H.; Date, C.; Kikuchi, S.; Watanabe, Y.; Wada, Y.; Wakai, K.; Tamakoshi, A.; JACC Study Group. Dietary fiber intake is associated with reduced risk of mortality from cardiovascular disease among Japanese men and women. J. Nutr. 2010, 140, 1445–1453. [Google Scholar] [CrossRef] [PubMed]
- Threapleton, D.E.; Greenwood, D.C.; Burley, V.J.; Aldwairji, M.; Cade, J.E. Dietary fibre and cardiovascular disease mortality in the UK women’s cohort study. Eur. J. Epidemiol. 2013, 28, 335–346. [Google Scholar] [CrossRef] [PubMed]
- Fujii, H.; Iwase, M.; Ohkuma, T.; Ogata-Kaizu, S.; Ide, H.; Kikuchi, Y.; Idewaki, Y.; Joudai, T.; Jirakawa, Y.; Uchida, K.; et al. Impact of dietary fiber intake on glycemic control, cardiovascular risk factors and chronic kidney disease in Japanese patients with type 2 diabetes mellitus: The Fukuoka Diabetes Registry. Nutr. J. 2013, 12. [Google Scholar] [CrossRef] [Green Version]
- Singh, R.B.; Rastogi, S.S.; Singh, R.; Ghosh, S.; Niaz, M.A. Effects of guava intake on serum total and high-density lipoprotein cholesterol levels and on systemic blood pressure. Am. J. Cardiovas. 1992, 70, 1287–1291. [Google Scholar] [CrossRef]
- Singh, R.B.; Rastogi, S.S.; Singh, N.K.; Ghosh, S.; Gupta, S.; Niaz, M.A. Can guava fruit intake decrease blood pressure and blood lipids? J. Hum. Hypertens. 1993, 7, 33–38. [Google Scholar] [PubMed]
- Zhang, M.Y.; Huang, C.Y.; Wang, X.; Hong, J.R.; Peng, S.S. The effect of foods containing refined Konjac meal on human lipid metabolism. Biomed. Environ. Sci. 1990, 3, 99–105. [Google Scholar] [PubMed]
- Reid, R.; Fodor, G.; Lydon-Hassen, K.; D’Angelo, M.S.; McCrea, J.; Bowlby, M.; Difrancesco, L. Dietary counselling for dyslipidemia in primary care: Results of a randomized trial. Can. J. Diet. Pract. Res. 2002, 63, 169–175. [Google Scholar] [CrossRef] [PubMed]
- Maki, K.C.; Carson, M.L.; Miller, M.P.; Anderson, W.H.; Turowski, M.; Reeves, M.S.; Kaden, V.; Dicklin, M.R. Hydroxypropylmethylcellulose lowers cholesterol in statin-treated men and women with primary hypercholesterolemia. Eur. J. Clin. Nutr. 2009, 63, 1001–1007. [Google Scholar] [CrossRef]
- Maki, K.C.; Beiseigel, J.M.; Jonnalagadda, S.S.; Gugger, C.K.; Reeves, M.S.; Farmer, M.V.; Kaden, V.N.; Rains, T.M. Whole-grain ready-to-eat oat cereal, as part of a dietary program for weight loss, reduces low-density lipoprotein cholesterol in adults with overweight and obesity more than a dietary program including low-fiber control foods. J. Am. Diet Assoc. 2010, 110, 205–214. [Google Scholar] [CrossRef] [PubMed]
- Kelly, S.A.; Summerbell, C.D.; Brynes, A.; Whittaker, V.; Frost, G. Wholegrain cereals for coronary heart disease. Cochrane Database Syst. Rev. 2007. [Google Scholar] [CrossRef] [Green Version]
- Wanders, A.J.; van den Borne, J.J.; de Graaf, C.; Hulshof, T.; Jonathan, M.C.; Kristensen, M.; Mars, M.; Schols, H.A.; Feskend, E.J. Effects of dietary fibre on subjective appetite, energy intake and body weight: A systematic review of randomized controlled trials. Obes. Rev. Off. J. Int. Assoc. Stud. Obes. 2011, 12, 724–739. [Google Scholar]
- Cheng, G.; Karaolis-Danckert, N.; Libuda, L.; Bolzenius, K.; Remer, T.; Buyken, A.E. Relation of dietary glycemic index, glycemic load, and fiber and whole-grain intakes during puberty to the concurrent development of percent body fat and body mass index. Am. J. Epidemio 2009, 169, 667–677. [Google Scholar] [CrossRef]
- Pal, S.; Khossousi, A.; Binns, C.; Dhaliwal, S.; Ellis, V. The effect of a fibre supplement compared to a healthy diet on body composition, lipids, glucose, insulin and other metabolic syndrome risk factors in overweight and obese individuals. Br. J. Nutr. 2011, 105, 90–100. [Google Scholar] [CrossRef] [PubMed]
- Lin, Y.; Huybrechts, I.; Vereecken, C.; Mouratidou, T.; Valtuena, J.; Kersting, M.; Gonzalez-Gross, M.; Bolca, S.; Warnberg, J.; Cuenca-Garcia, M.; et al. Dietary fiber intake and its association with indicators of adiposity and serum biomarkers in European adolescents: The Helena study. Eur. J. Nutr. 2014. [Google Scholar] [CrossRef]
- Aeberli, I.; Kaspar, M.; Zimmermann, M.B. Dietary intake and physical activity of normal weight and overweight 6 to 14 year old swiss children. Swiss Med. Wkly. 2007, 137, 424–430. [Google Scholar] [PubMed]
© 2015 by the authors; licensee MDPI, Basel, Switzerland. This article is an open access article distributed under the terms and conditions of the Creative Commons Attribution license (http://creativecommons.org/licenses/by/4.0/).
Share and Cite
Zhou, Q.; Wu, J.; Tang, J.; Wang, J.-J.; Lu, C.-H.; Wang, P.-X. Beneficial Effect of Higher Dietary Fiber Intake on Plasma HDL-C and TC/HDL-C Ratio among Chinese Rural-to-Urban Migrant Workers. Int. J. Environ. Res. Public Health 2015, 12, 4726-4738. https://doi.org/10.3390/ijerph120504726
Zhou Q, Wu J, Tang J, Wang J-J, Lu C-H, Wang P-X. Beneficial Effect of Higher Dietary Fiber Intake on Plasma HDL-C and TC/HDL-C Ratio among Chinese Rural-to-Urban Migrant Workers. International Journal of Environmental Research and Public Health. 2015; 12(5):4726-4738. https://doi.org/10.3390/ijerph120504726
Chicago/Turabian StyleZhou, Quan, Jiang Wu, Jie Tang, Jia-Ji Wang, Chu-Hong Lu, and Pei-Xi Wang. 2015. "Beneficial Effect of Higher Dietary Fiber Intake on Plasma HDL-C and TC/HDL-C Ratio among Chinese Rural-to-Urban Migrant Workers" International Journal of Environmental Research and Public Health 12, no. 5: 4726-4738. https://doi.org/10.3390/ijerph120504726
APA StyleZhou, Q., Wu, J., Tang, J., Wang, J.-J., Lu, C.-H., & Wang, P.-X. (2015). Beneficial Effect of Higher Dietary Fiber Intake on Plasma HDL-C and TC/HDL-C Ratio among Chinese Rural-to-Urban Migrant Workers. International Journal of Environmental Research and Public Health, 12(5), 4726-4738. https://doi.org/10.3390/ijerph120504726