Abstract
Drought is expected to increase in frequency and severity due to global warming, and its impacts on vegetation are typically extensively evaluated with climatic drought indices, such as multi-scalar Standardized Precipitation Evapotranspiration Index (SPEI). We analyzed the covariation between the SPEIs of various time scales and the anomalies of the normalized difference vegetation index (NDVI), from which the vegetation type-related optimal time scales were retrieved. The results indicated that the optimal time scales of needle-leaved forest, broadleaf forest and shrubland were between 10 and 12 months, which were considerably longer than the grassland, meadow and cultivated vegetation ones (2 to 4 months). When the optimal vegetation type-related time scales were used, the SPEI could better reflect the vegetation’s responses to water conditions, with the correlation coefficients between SPEIs and NDVI anomalies increased by 5.88% to 28.4%. We investigated the spatio-temporal characteristics of drought and quantified the different responses of vegetation growth to drought during the growing season (April–October). The results revealed that the frequency of drought has increased in the 21st century with the drying trend occurring in most of China. These results are useful for ecological assessments and adapting management steps to mitigate the impact of drought on vegetation. They are helpful to employ water resources more efficiently and reduce potential damage to human health caused by water shortages.
1. Introduction
Drought is a complex natural hazard that affects water resources, natural ecosystems, agriculture, and society more frequently than any other natural disaster [1,2,3]. Over 900 million people worldwide were affected by drought during the period of 1999 to 2010 [4]. Drought has occurred in most places of the world, including wet and humid regions [5,6], and it is expected to increase in frequency and severity due to decreasing precipitation and increasing evapotranspiration driven by global warming [7,8,9,10]. In China, drought has become one of the most severe natural disasters [6], and the affected area has increased in the past 50 years [11]. Serious drought events occur frequently in China, especially in Yunnan Province [12,13]. Many efforts have been made to develop methodologies to assess the drought. The most widely used method is to propose a climatic drought index, which is simple to use to reflect the fluctuation of water conditions [14,15,16].
There are several climatic drought indices that are widely used for evaluating drought conditions, including the Palmer Drought Severity Index (PDSI) [17], the Standardized Precipitation Index (SPI) [18] and the Standardized Precipitation Evapotranspiration Index (SPEI) [19]. The PDSI is based on the supply and demand concept of the water balance equation; however, the primary limitation of the PDSI is that it has a fixed temporal scale and autoregressive characteristics [20]. The SPI is a probabilistic precipitation approach that is based on the cumulative precipitation available and incorporates different time scales [21], but it only involves precipitation and does not consider other variables (e.g., temperature and evapotranspiration), which can potentially affect the frequency of drought [19]. The SPEI, however, is based on the monthly water balance derived from both precipitation and potential evapotranspiration (PET), and it can be compared with the self-calibrated PDSI [22].
The main advantages of SPEI over other climatic drought indicators are its ability to identify the evapotranspiration and temperature variability in the drought assessments [23]. The SPEI is more appropriate to investigate the characteristics of drought in that it is temporally flexible and spatially consistent, and reflects the water deficits at different time scales; thus, it has become a significant tool to assess moisture conditions [24]. However, due to the complexity of different vegetation’s responses to water balance at different time scales, the SPEI at fixed time scales (e.g., 12-month time scale, SPEI-12) is usually applied to investigate the drought trend [15,25], which tends to produce system biases when the region contains different types of vegetation.
As the impact of drought on the growth of vegetation varies among different species and leads to distinct responses according to the different time scales considered [26,27], it is essential to determine the vegetation type-specific optimal time scale of SPEI for each type of vegetation before assessing drought by SPEI. Additionally, although the climatic drought indicators are important tools to investigate the extent of drought, they contain no vegetation-specific information that might directly reflect different physiological strategies for coping with water deficits. Thus, it is necessary to build a linkage between the climatic drought index and the vegetation’s response index. An appropriate SPEI with an optimal time scale should have a good correlation between the SPEI and physiological drought-related indicators. The normalized difference vegetation index (NDVI) is widely used to monitor the vegetation activity and its anomaly is a good surrogate to reflect vegetation’s physiologic drought conditions [28,29,30]. As a result, through the comparison of correlation coefficients between the SPEIs of various time scales and the anomaly of NDVIs, the vegetation type-related optimal time scales could be revealed. That is, the SPEI with the optimal time scale should have the strongest correlation with the NDVI anomalies.
In this study, we aimed to estimate the vegetation type-related optimal time scales of SPEI by analyzing the covariation between the SPEIs of various time scales and NDVI anomalies. After that, based on these estimated optimal time scales of SPEI (SPEIopt), the spatio-temporal characteristics of drought were investigated and then compared with those derived from the SPEI-12. Finally, regression models were built to compare the responses of vegetation to the drought based on both the SPEI-12 and the SPEIopt during the growing season (April to October).
2. Data and Methods
2.1. Climatic Data and Multi-Scalar SPEI Drought Indicator
The climatic data employed in this study include the monthly average temperature (MAT) and the monthly precipitation (P) of 505 meteorological stations across the entirety of China from 1960 to 2013. These precipitation and temperature data are collected from the National Climate Center of the Chinese Meteorological Administration (CMA). The homogeneity and reliability of the monthly meteorological data are checked and firmly controlled by the CMA before its release [15]. This study applies 5-year running means before and after the missing data to ensure that the time series are continuous. The stations with missing meteorological data for more than 12 consecutive months are rejected and not used in this study.
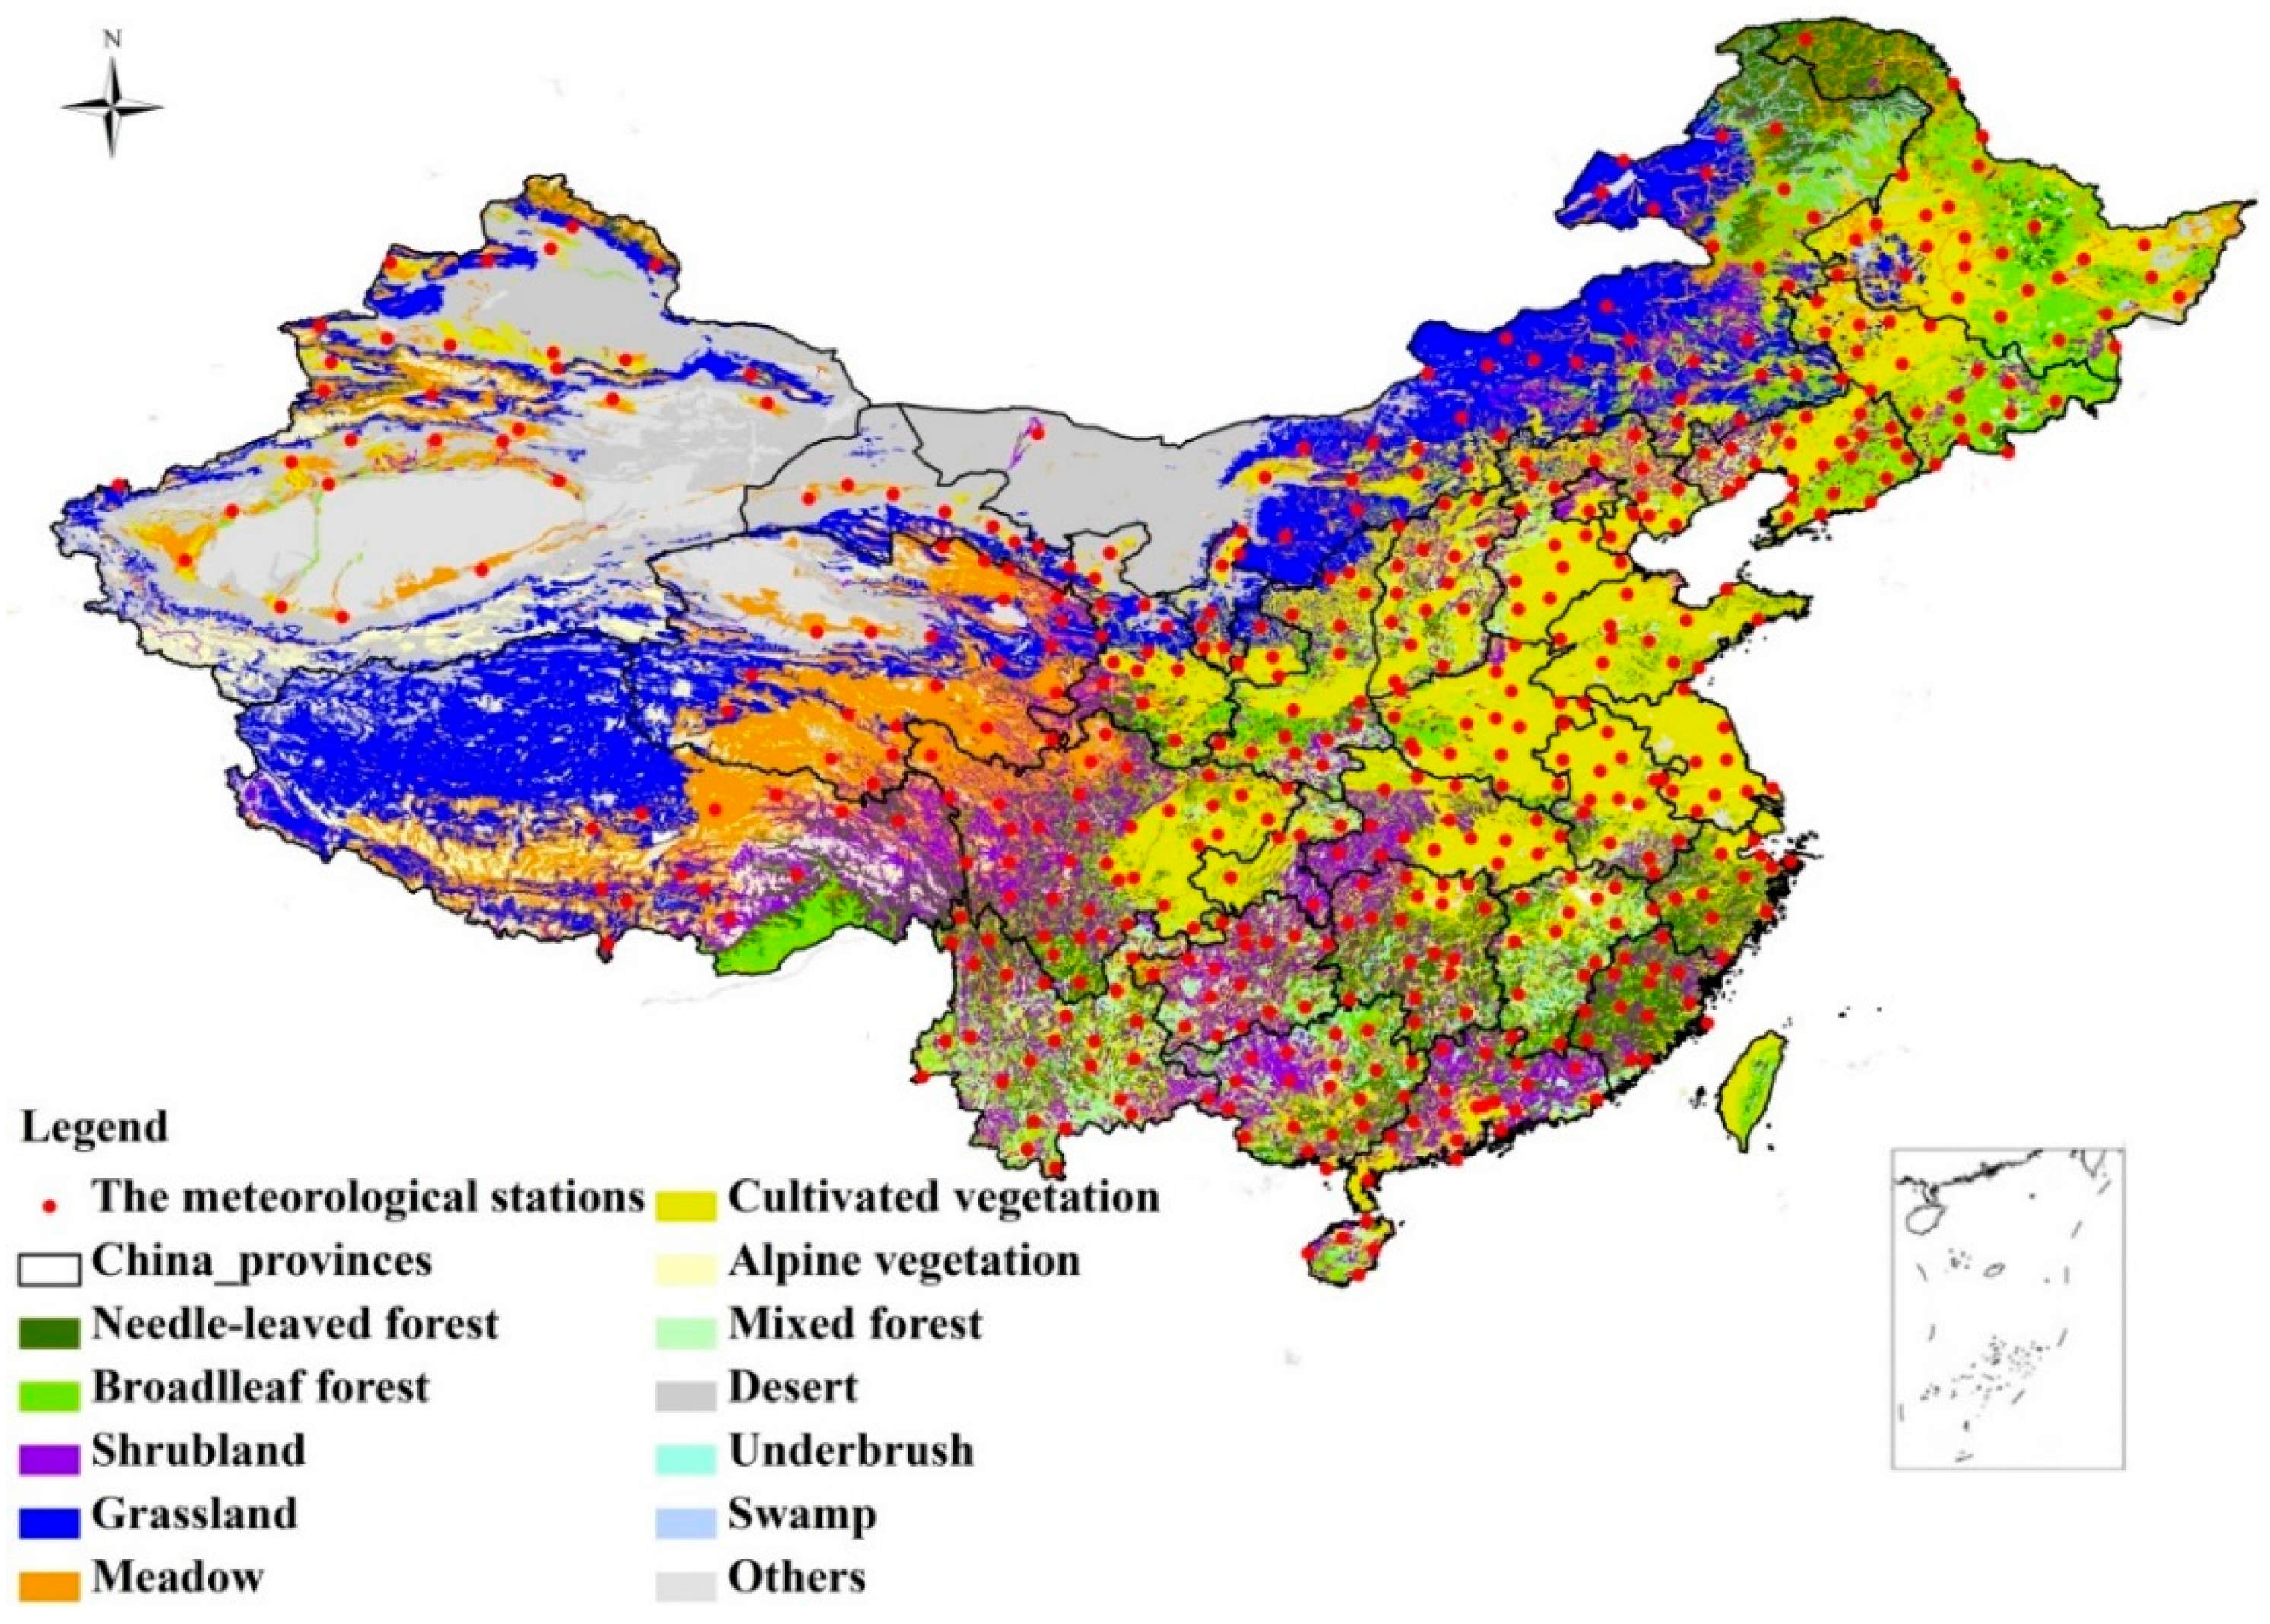
The SPEI is a site-specific drought indicator with multi-time scales. The calculation of SPEI is based on the monthly average temperature and precipitation. There are three major steps to calculate the SPEI with different time scales [19,31]. The first is to calculate the potential evapotranspiration (PET) based on the scheme of Thornthwaite [32]. The second is to calculate the water balance at various time scales (P-PET). The last is to normalize the water balance into a log-logistic probability distribution to obtain the SPEI series. The SPEI time series obtained for different time scales represent the cumulative water balance over the previous n months [33,34], and this study considers the time scales from 1 to 12 months to cover the impact of the inter-annual variability of SPEI on vegetation. As the SPEI is a standardized value, it could be compared with other SPEI values over time and space, and also allows one to determine the patterns of spatial and temporal variability, trend and extent of drought [23,35]. The drought categories (i.e., groups) based on SPEI values are listed in Table 1 [15,24,34]. The time scales of SPEI are separated into three groups: short time scales (1–4 months), medium time scales (5–9 months) and long time scales (10–12 months) [36]. The study period is from 1982 to 2011 to match the time range of NDVI dataset. The representative vegetation type for each meteorological station is determined from a 1:1,000,000 vegetation map of the People’s Republic of China [37], and the 505 meteorological stations cover most regions in China with six major land cover types, including needle-leaved forest, broadleaf forest, shrubland, grassland, meadow and cultivated vegetation (Figure 1).

Table 1.
The drought categories based on SPEIs.
| SPEI | Drought Category | Probability |
|---|---|---|
| ≥2.00 | Extreme wet | 0.02 |
| [1.50, 2.00) | Severe wet | 0.06 |
| [1.00, 1.50) | Moderate wet | 0.10 |
| (−1.00, 1.00) | Normal | 0.65 |
| (−1.50, −1.00] | Moderate drought | 0.10 |
| (−2.00, −1.50] | Severe drought | 0.05 |
| ≤−2.00 | Extreme drought | 0.02 |
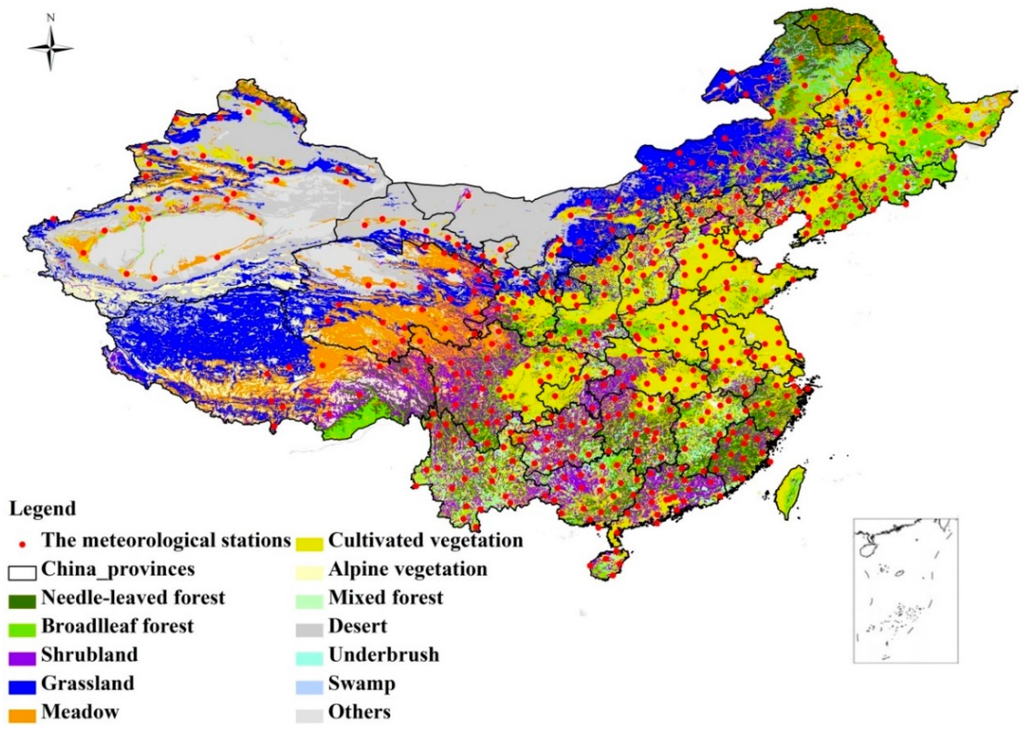
Figure 1.
The distribution of the meteorological stations and the major vegetation types of China.
Figure 1.
The distribution of the meteorological stations and the major vegetation types of China.
2.2. Remote Sensing Data
The normalized difference vegetation index (NDVI) derived from remote sensing data is defined as the ratio of the difference between near-infrared reflectance and red visible reflectance to their sum [38]. It is widely used to detect the spatio-temporal characteristics of drought [26,39,40,41,42,43,44]. The Global Inventory Monitoring and Modeling Systems (GIMMS3g) NDVI dataset used in this study is produced from the National Oceanographic and Atmospheric Administration (NOAA) with the Advanced Very High Resolution Radiometer (AVHRR) instruments [45]. During the pre-processing, data with large solar zenith angle are excluded and maximum value composite algorithm is used to obtain NDVI for each two week period [46]. The calibration is employed to alleviate known limitations of the AVHRR measurements induced by intersensor calibration, orbital drift and atmospheric contamination [38,47]. The GIMMS3g NDVI dataset has a spatial resolution of 8 km and a temporal resolution of 15 days [48], and it has been widely used for global vegetation monitoring due to its longest time range [49,50]. The quality and consistency of this dataset are assured by correcting for sensor degradation, sensor inter-calibration differences, solar zenith and viewing angles, volcanic aerosols, atmospheric water vapor and cloud cover [33]. To correspond with the temporal resolution of site-specific SPEI time series, the NDVI series are transformed into a monthly composited dataset based on the maximum value composite (MVC) method. The remote sensing data (NDVI) is extracted by the point that was corresponding to the coordinates of the meteorological stations. The extracted value of a specific meteorological station in the remote sensing data is the central value of the pixel that the point is located. As we directly analyze the relationship between the station-based SPEI and the corresponding NDVI, it could avoid some potential uncertainties caused by spatial interpolation of climate observations.
As the variation of NDVI is widely used to monitor drought-related environmental stress, we develop an NDVI anomaly index, NDVIanomaly, to reflect the variation of vegetation activity. For a specific meteorological station:
where y and m separated represent the year and the month, represents the value of NDVI for a specific year and month, represents the average value of the NDVI for a special month, N is the total year from 1982 to 2011 (N = 30). The calculation of NDVIanomaly is based on the ratio of the differences between the NDVI value and the corresponding NDVI averaged value (the multi-year mean of the specific month) to the standard deviation. As a result, the mean of NDVIanomaly is 0 and the standard deviation of NDVIanomaly is 1. As the NDVIanomaly value is the standardized value, it could be compared in both time and space.
2.3. Drought Assessment Index
There are two widely used drought assessment indices; one is the ratio of meteorological stations involved droughts (Pi), and the other is the drying trends based on each meteorological station (aj). These indices can better reflect patterns of spatial and temporal variability, trend and frequency of drought on a large scale [51].
The ratio of meteorological stations involved droughts (Pi) is employed to assess the frequency of drought and the extent of drought impact on vegetation growth over temporal evaluation:
where m is the number of meteorological stations that involved droughts based on SPEI (SPEI ≤ −1) [34,52], M is the number of all the meteorological stations (M = 505), and i is the specific year during 1982 to 2011.
The meteorological station-based drying trend (aj) is used to reflect the drying trends across China over spatial distribution:
where j is the meteorological station, x is the time series of SPEI of each meteorological station, and aj and bj are the regression coefficients.
2.4. Statistical Methods
As the calculated value of SPEI depended on the time scales of water balance, it was necessary to consider the rationality of the selected time scale on the drought responses of various vegetation types. To determine the vegetation type-specific time scale, that is, the optimal time scales of various vegetation types, we should combine the climatic drought indicator (e.g., SPEI) determined by climatic factors with the physiological drought indicator of vegetation (e.g., NDVI anomaly) determined by water stress.
Based on the multi-scalar SPEI (1–12 months) and the monthly NDVIanomaly (April–October) during the growing season at different meteorological stations, the Pearson correlations were conducted for 7 monthly NDVI anomaly series (i.e., April–October) vs. 12 SPEI series (i.e., SPEIs with the time scale of 1-, 2-, …, and 12-month). That is, there were 84 correlation coefficients for each meteorological station. The correlation coefficients that passed the significance test (p < 0.05) and their corresponding time scales were kept for further study. The meteorological stations were grouped by the vegetation types. For each vegetation type, the highest frequency of the time scale of SPEI with the maximum correlation coefficients for each meteorological station was picked up as the optimal time scale (SPEIopt) for this vegetation type.
The optimal time scales of various vegetation types (SPEIopt) were compared with the fixed 12 month time scale (SPEI-12) to show the degree of the responses of vegetation to the drought. To analyze the spatio-temporal patterns of drought at annual scale, the NDVI value which could represent the optimum growth conditions of vegetation activity in a year should be employed to show the vegetation activity. The maximum NDVI value a year mainly concentrated in growing season, and could better reflect the exuberant vegetation activity [53]. The drought assessment indices based on the SPEI time series were used to assess the characteristics of the drought. The regression models for different vegetation types were compared based on the relationship between the anomaly of NDVI and the SPEI with both the fixed (SPEI-12) and the vegetation type-dependent optimal time scale (SPEIopt).
3. Results
3.1. Drought Derived from the SPEI-12
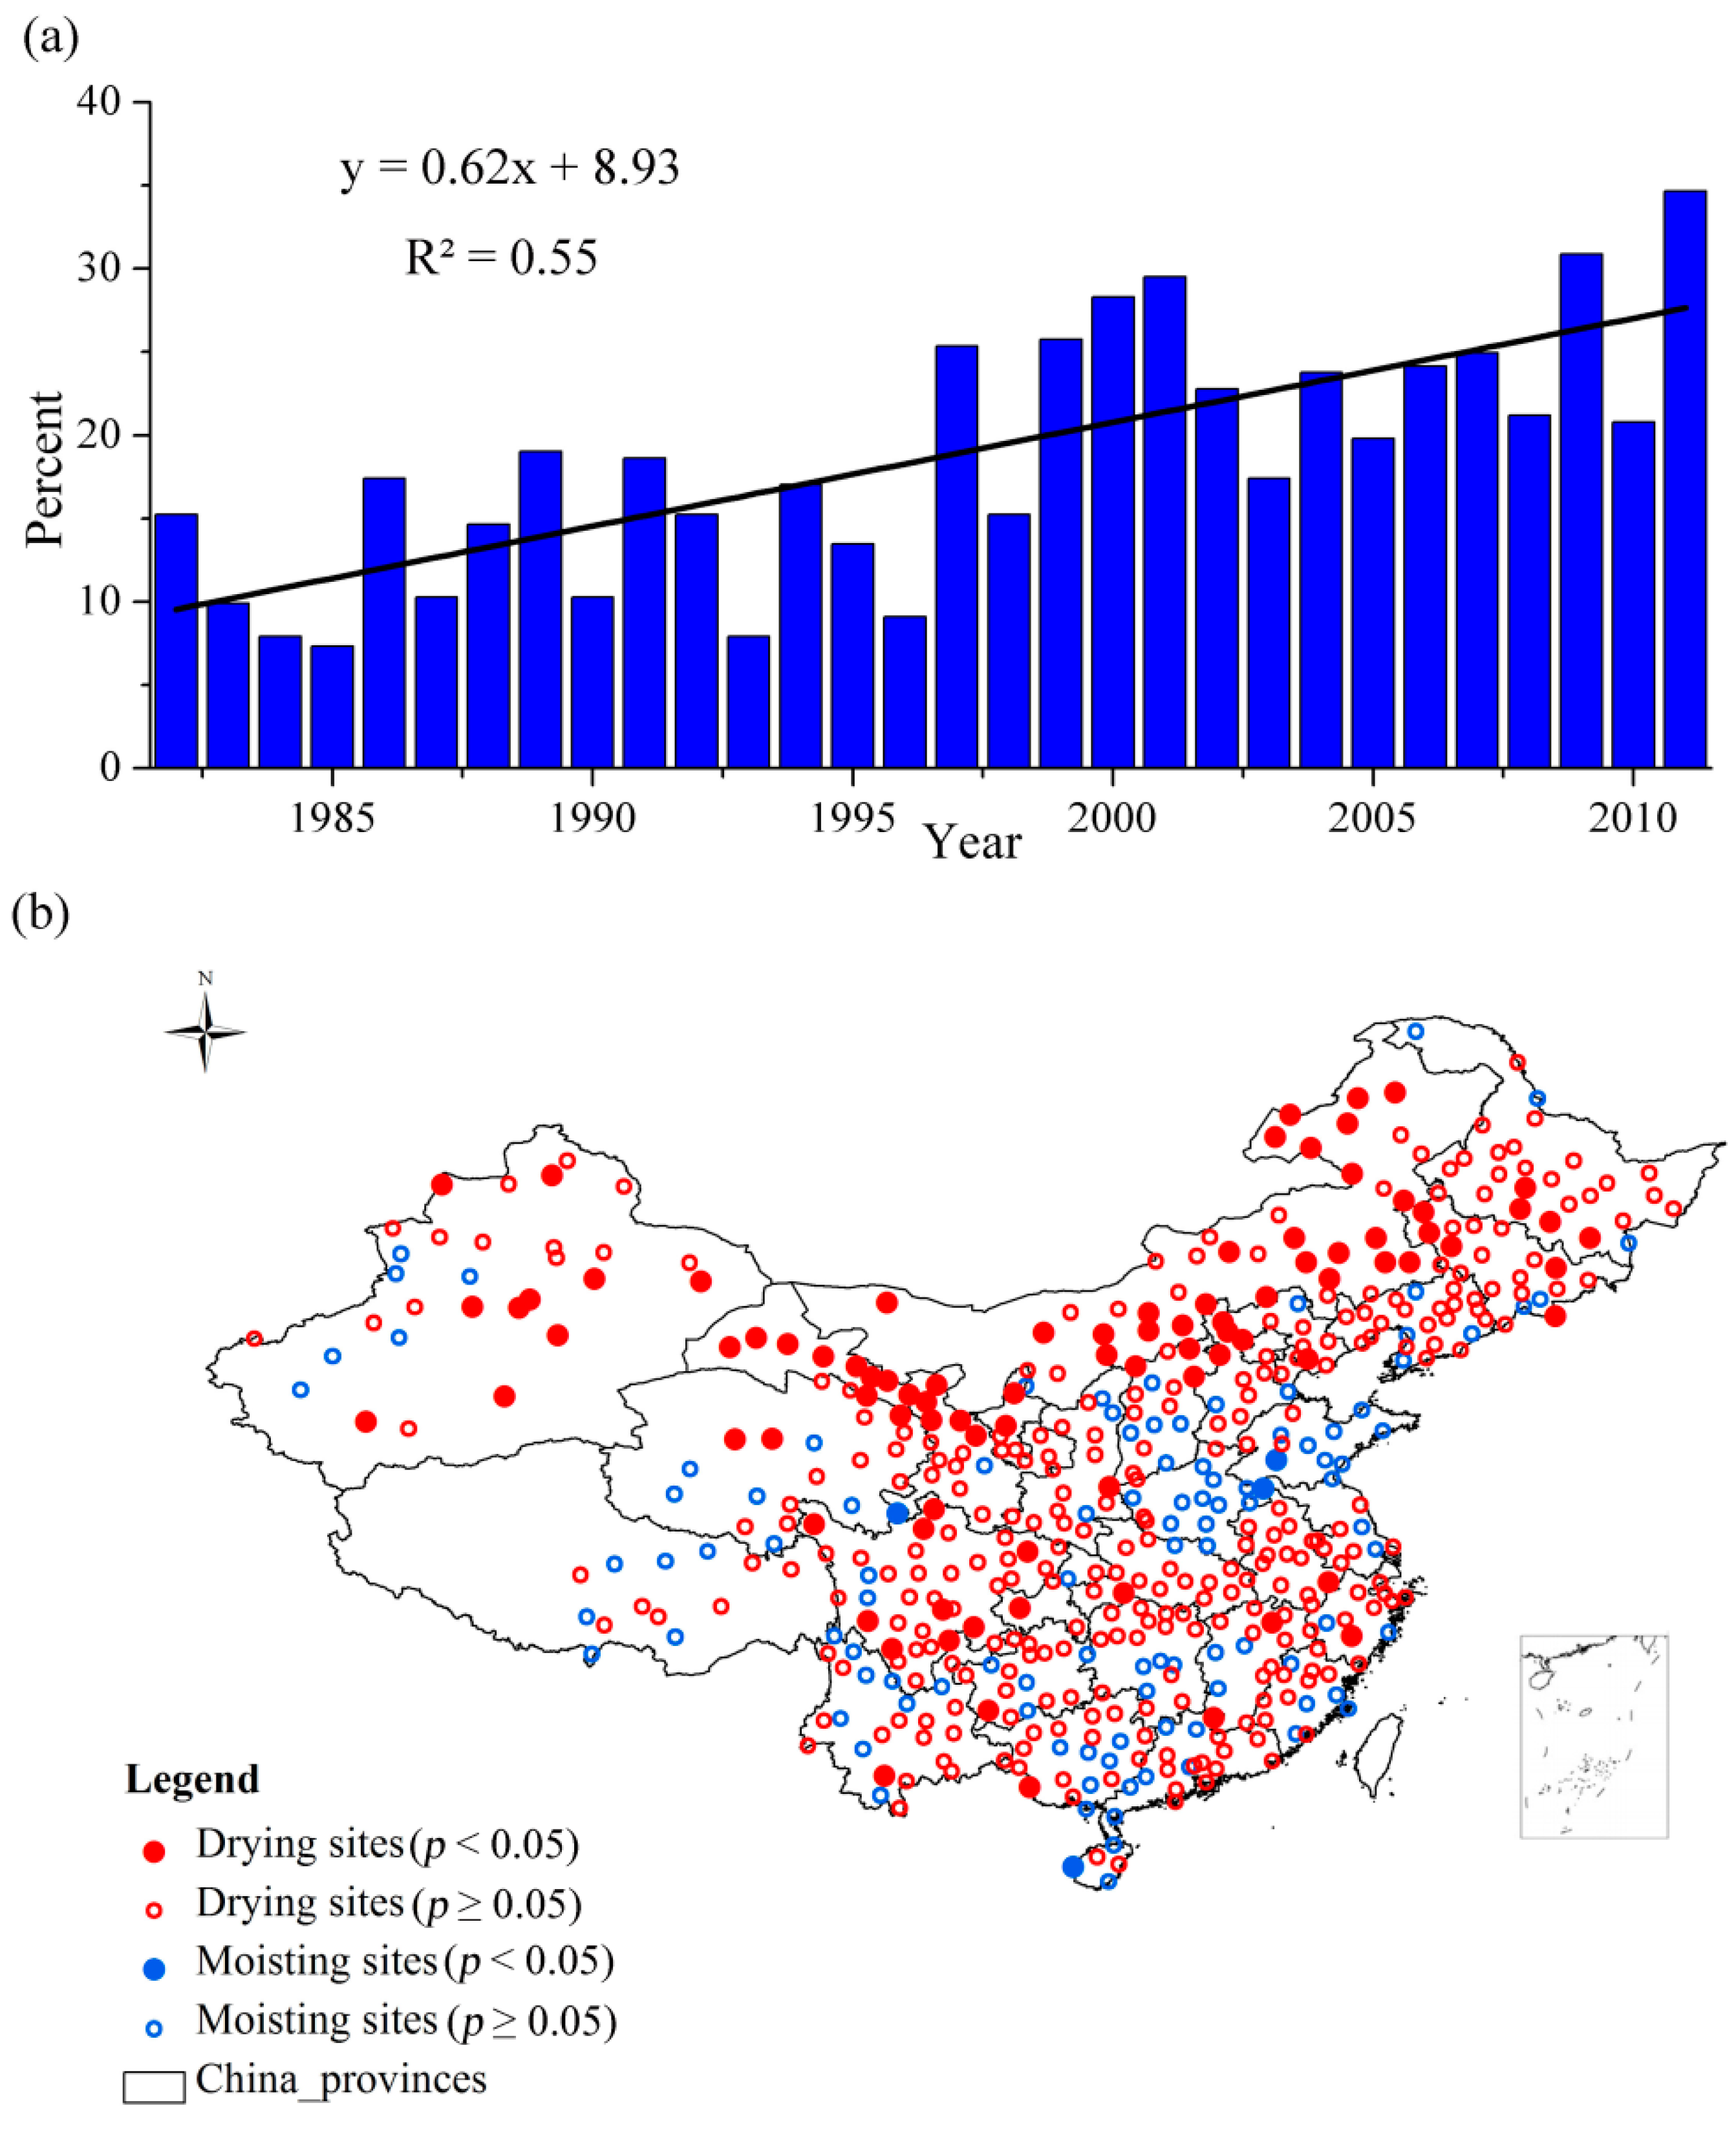
The SPEI with a specific time scale was helpful to monitor the drought in that it considered the cumulative water balance. However, many studies [25,54] used a fixed 12 month time scale of SPEI (SPEI-12) as it is simply calculated to evaluate the drought. Figure 2a showed the frequency of drought from 1982 to 2011 based on the ratio of the number of meteorological stations when the SPEI was less than −1 (i.e., SPEI ≤ −1) to the whole number of the meteorological stations.
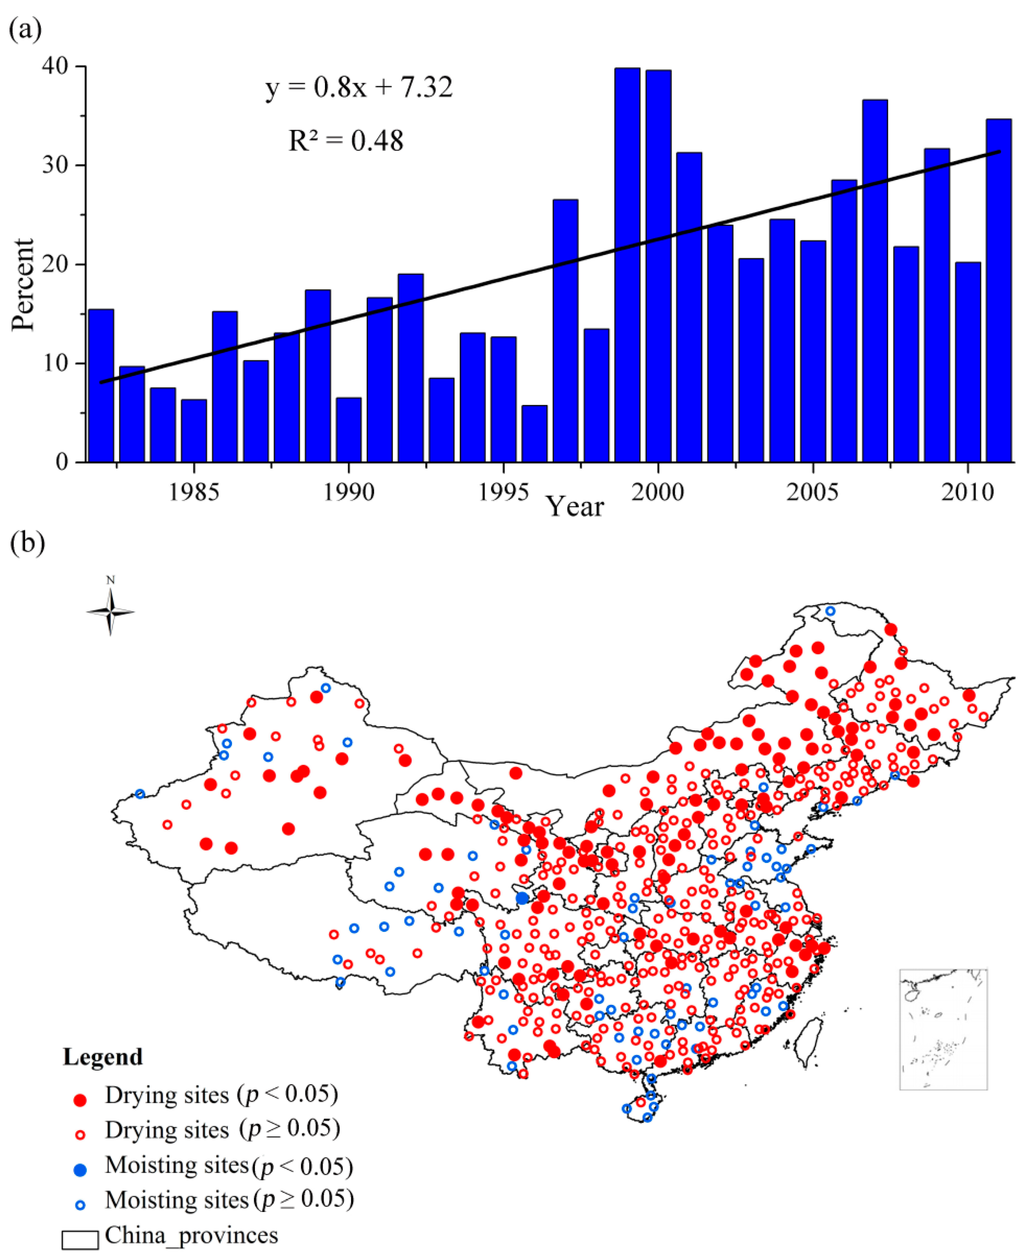
Figure 2.
(a) The frequency of drought from 1982 to 2011 based on the SPEI-12; (b) The drying trend based on the SPEI-12 time series for each meteorological station over China.
Figure 2.
(a) The frequency of drought from 1982 to 2011 based on the SPEI-12; (b) The drying trend based on the SPEI-12 time series for each meteorological station over China.
The value of −1 was a critical value of drought (Table 1). When the SPEI of a specific meteorological station was less than −1, it was regarded as the drought. The temporal evaluation of drought based on the Pi showed the frequency of drought has increased especially from the beginning of the 21st century (Figure 2a). Figure 2 showed the drying trend based on the SPEI time series (SPEI-12) over China for each meteorological station. For a specific meteorological station, if the SPEI time series had a decreased trend, it meant that it had a drying trend, but the value of SPEI was not necessarily less than −1 (for example, from severe wet to moderate wet). The spatial evaluation of drought based on the aj showed that the drying trend and extent have covered most of China (Figure 2b). Approximately 434 out of 505 meteorological stations, distributed in most regions in China, exhibited a drying trend. The meteorological stations that passed the significance test (p < 0.05) were concentrated in Northern China. However, Southern China also exhibited the drying trend, although most of the stations did not pass the significance test. The regions that had wetting trends were mainly located at regions in the east part of central China and Southeast China.
3.2. Drought Derived from the Optimal Time Scales of SPEI
The SPEI with the optimal time scales (i.e., SPEIopt) considered the characteristics of different vegetation types and their sensitivity to accumulated water balance. The statistics of the optimal time scales of SPEI and the related season for various vegetation types are shown in Table 2. The optimal time scales of the needle-leaved forest, the broadleaf forest and the shrubland were separately 11, 10, 12 months, and they all were related to the long time scales (10–12 months). For the grassland, the meadow and the cultivated vegetation, the optimal time scales were 3, 4, and 2 months, respectively, and they responded to the short time scales (2–4 months).

Table 2.
The optimal time scales of SPEIs for different vegetation types.
| Vegetation Types | Number of Stations | Optimal Time Scales (months) | Season |
|---|---|---|---|
| Needle-leaved forest | 39 | 11 | Summer |
| Broadleaf forest | 26 | 10 | Summer |
| Shrubland | 46 | 12 | Summer |
| Grassland | 39 | 3 | Summer |
| Meadow | 32 | 4 | Autumn |
| Cultivated vegetation | 323 | 2 | Summer |
As differences exist in the SPEI time scales for various vegetation types, the correlation coefficients between the SPEIs and the NDVIanomaly also exhibited discrepancies. The correlation coefficients based on the corresponding optimal SPEI time scales (SPEIopt) for the vegetation types increased compared with the fixed SPEI time scale (SPEI-12) (Table 3).

Table 3.
The improvements of correlation coefficients for SPEIopt.
| Vegetation Types | Increased Proportion of the Correlation Coefficients (%) |
|---|---|
| Needle-leaved forest | 5.9 |
| Broadleaf forest | 10.6 |
| Shrubland | 0 |
| Grassland | 20 |
| Meadow | 16.3 |
| Cultivated vegetation | 28.4 |
All the vegetation types except the shrubland exhibited increased correlation coefficients. As the optimal time scale of shrubland was 12 months, there was no difference in the correlation coefficients for shrubland. For the forests, the increased proportion of the correlation coefficients were separately approximately 5.9% and 10.6% compared with the SPEI-12. The forests had similar optimal time scales (the needle-leaved forest: 11 months; the broadleaf forest: 10 months) compared with the SPEI-12, and the differences of SPEI values were small among the long time scales (10–12 months). For the grassland, the meadow and the cultivated vegetation, the optimal time scales were 3 months, 4 months and 2 months, respectively. The optimal time scales for these three vegetation types were much shorter than the SPEI-12, and the increased proportion of the correlation coefficients were 20%, 16.3% and 28.4%. In sum, the SPEI with optimal time scale (SPEIopt) had better responses to drought than the fixed 12-month SPEI (SPEI-12), especially for the grassland, meadow and cultivated vegetation.
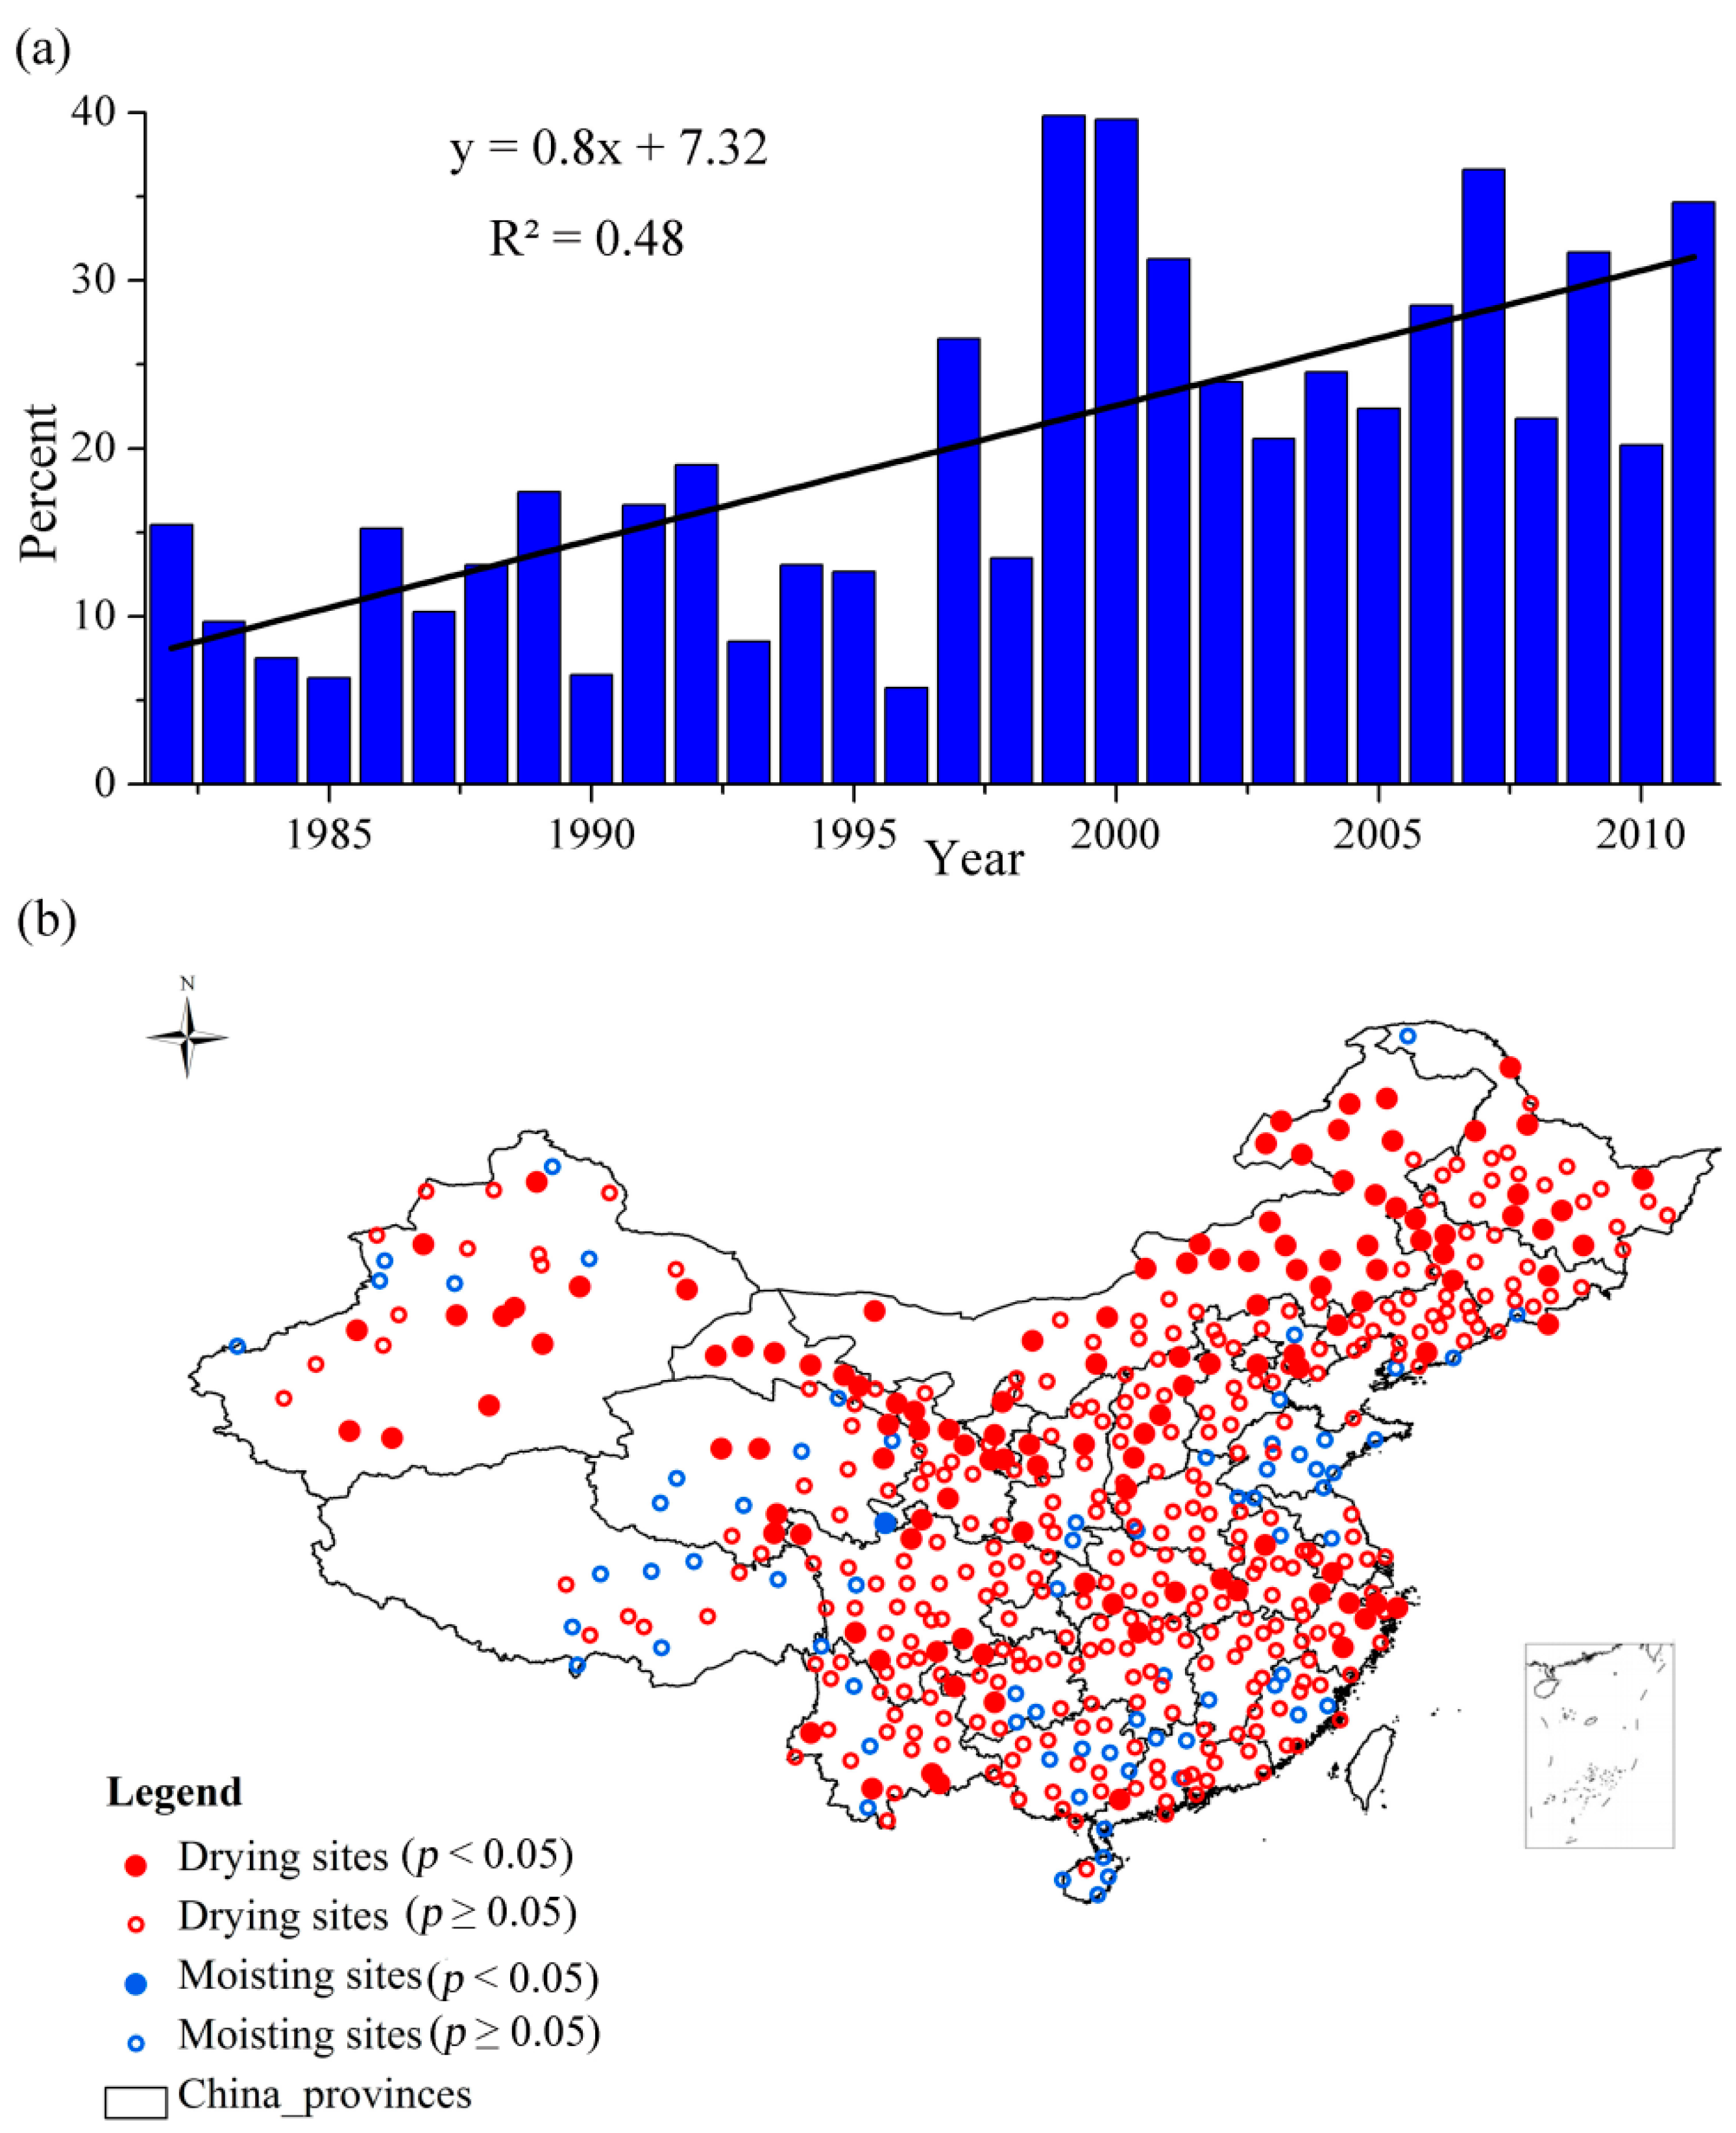
The vegetation type-dependent SPEIopt could provide us with more specific and comprehensive understanding of the spatio-temporal characteristics of drought (Figure 3). From the perspective of temporal evolution, the frequency of drought has increased especially from the 21st century during the period 1982–2011 (Figure 3a).
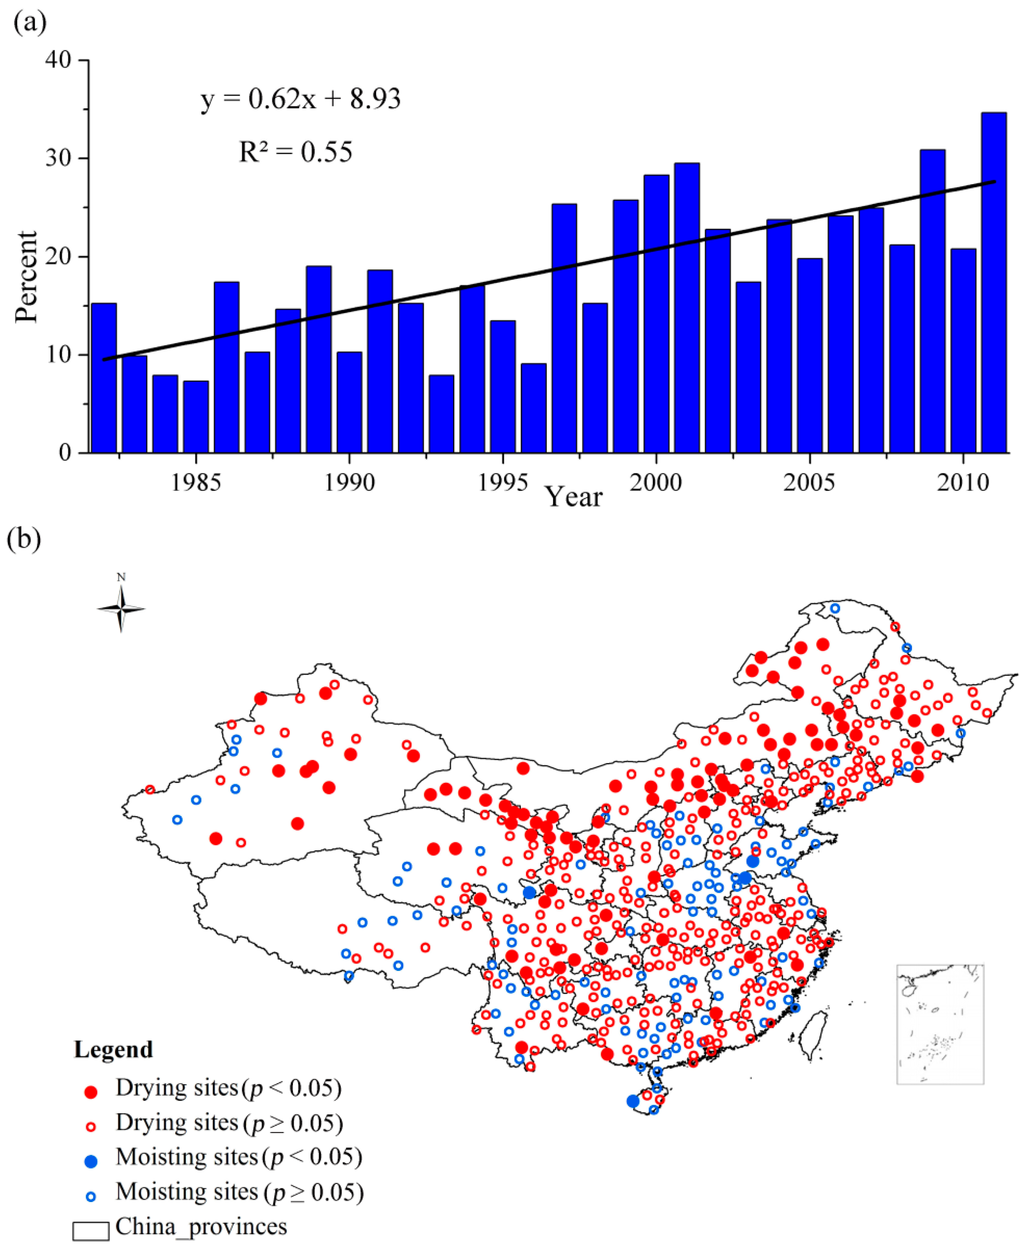
Figure 3.
(a) The frequency of drought from 1982 to 2011 based on the SPEIopt; (b) The drying trend based on the time series of SPEIopt.
Figure 3.
(a) The frequency of drought from 1982 to 2011 based on the SPEIopt; (b) The drying trend based on the time series of SPEIopt.
The R2 based on the SPEIopt was approximately 7% higher in R2 than that derived from the SPEI-12. From the perspective of spatial distribution of drought in China, the drying trend was obvious during the period from 1982 to 2011 (Figure 3b). The 395 out of 505 meteorological stations exhibited the drying trend. The meteorological stations that passed the significance test (p < 0.05) were mostly concentrated in Northern China compared with the SPEI-12. Southern China also had a drying trend, which was not as widely spread as that based on the SPEI-12.
3.3. Comparison of Large-Scale Drought Events
Two large-scale drought events obtained from the temporal evolution of the SPEI time series. The first drought event happened during the period from 1999 to 2001, and the other occurred from 2009 to 2011 (Figure 2a and Figure 3a). The spatial distribution of these two large-scale drought events was shown in Figure 4. The severity of large-scale drought events from 1999 to 2001 based on the SPEI-12 (Figure 4a) was more serious than that employed the SPEIopt for various vegetation types (Figure 4b).
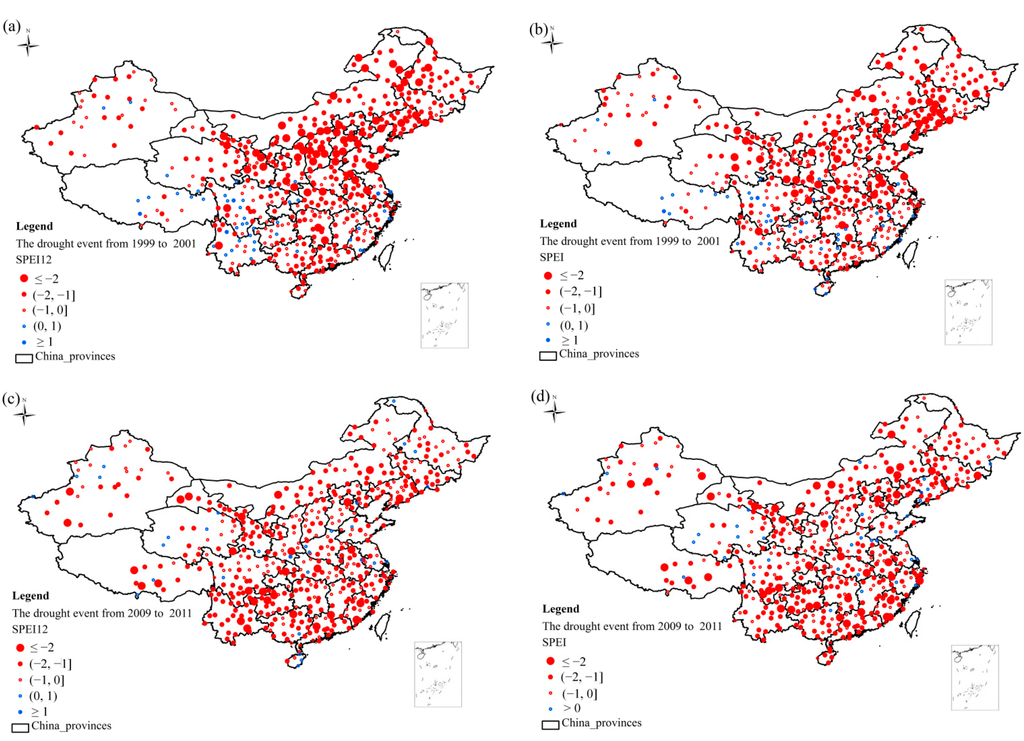
Figure 4.
(a) The spatial distribution of large-scale drought events from 1999 to 2001 based on the SPEI-12; (b) The spatial distribution of large-scale drought events from 1999 to 2001 based on the SPEIopt; (c) The spatial distribution of large-scale drought events from 2009 to 2011 based on the SPEI-12; (d) The spatial distribution of large-scale drought events from 2009 to 2011 based on the SPEIopt.
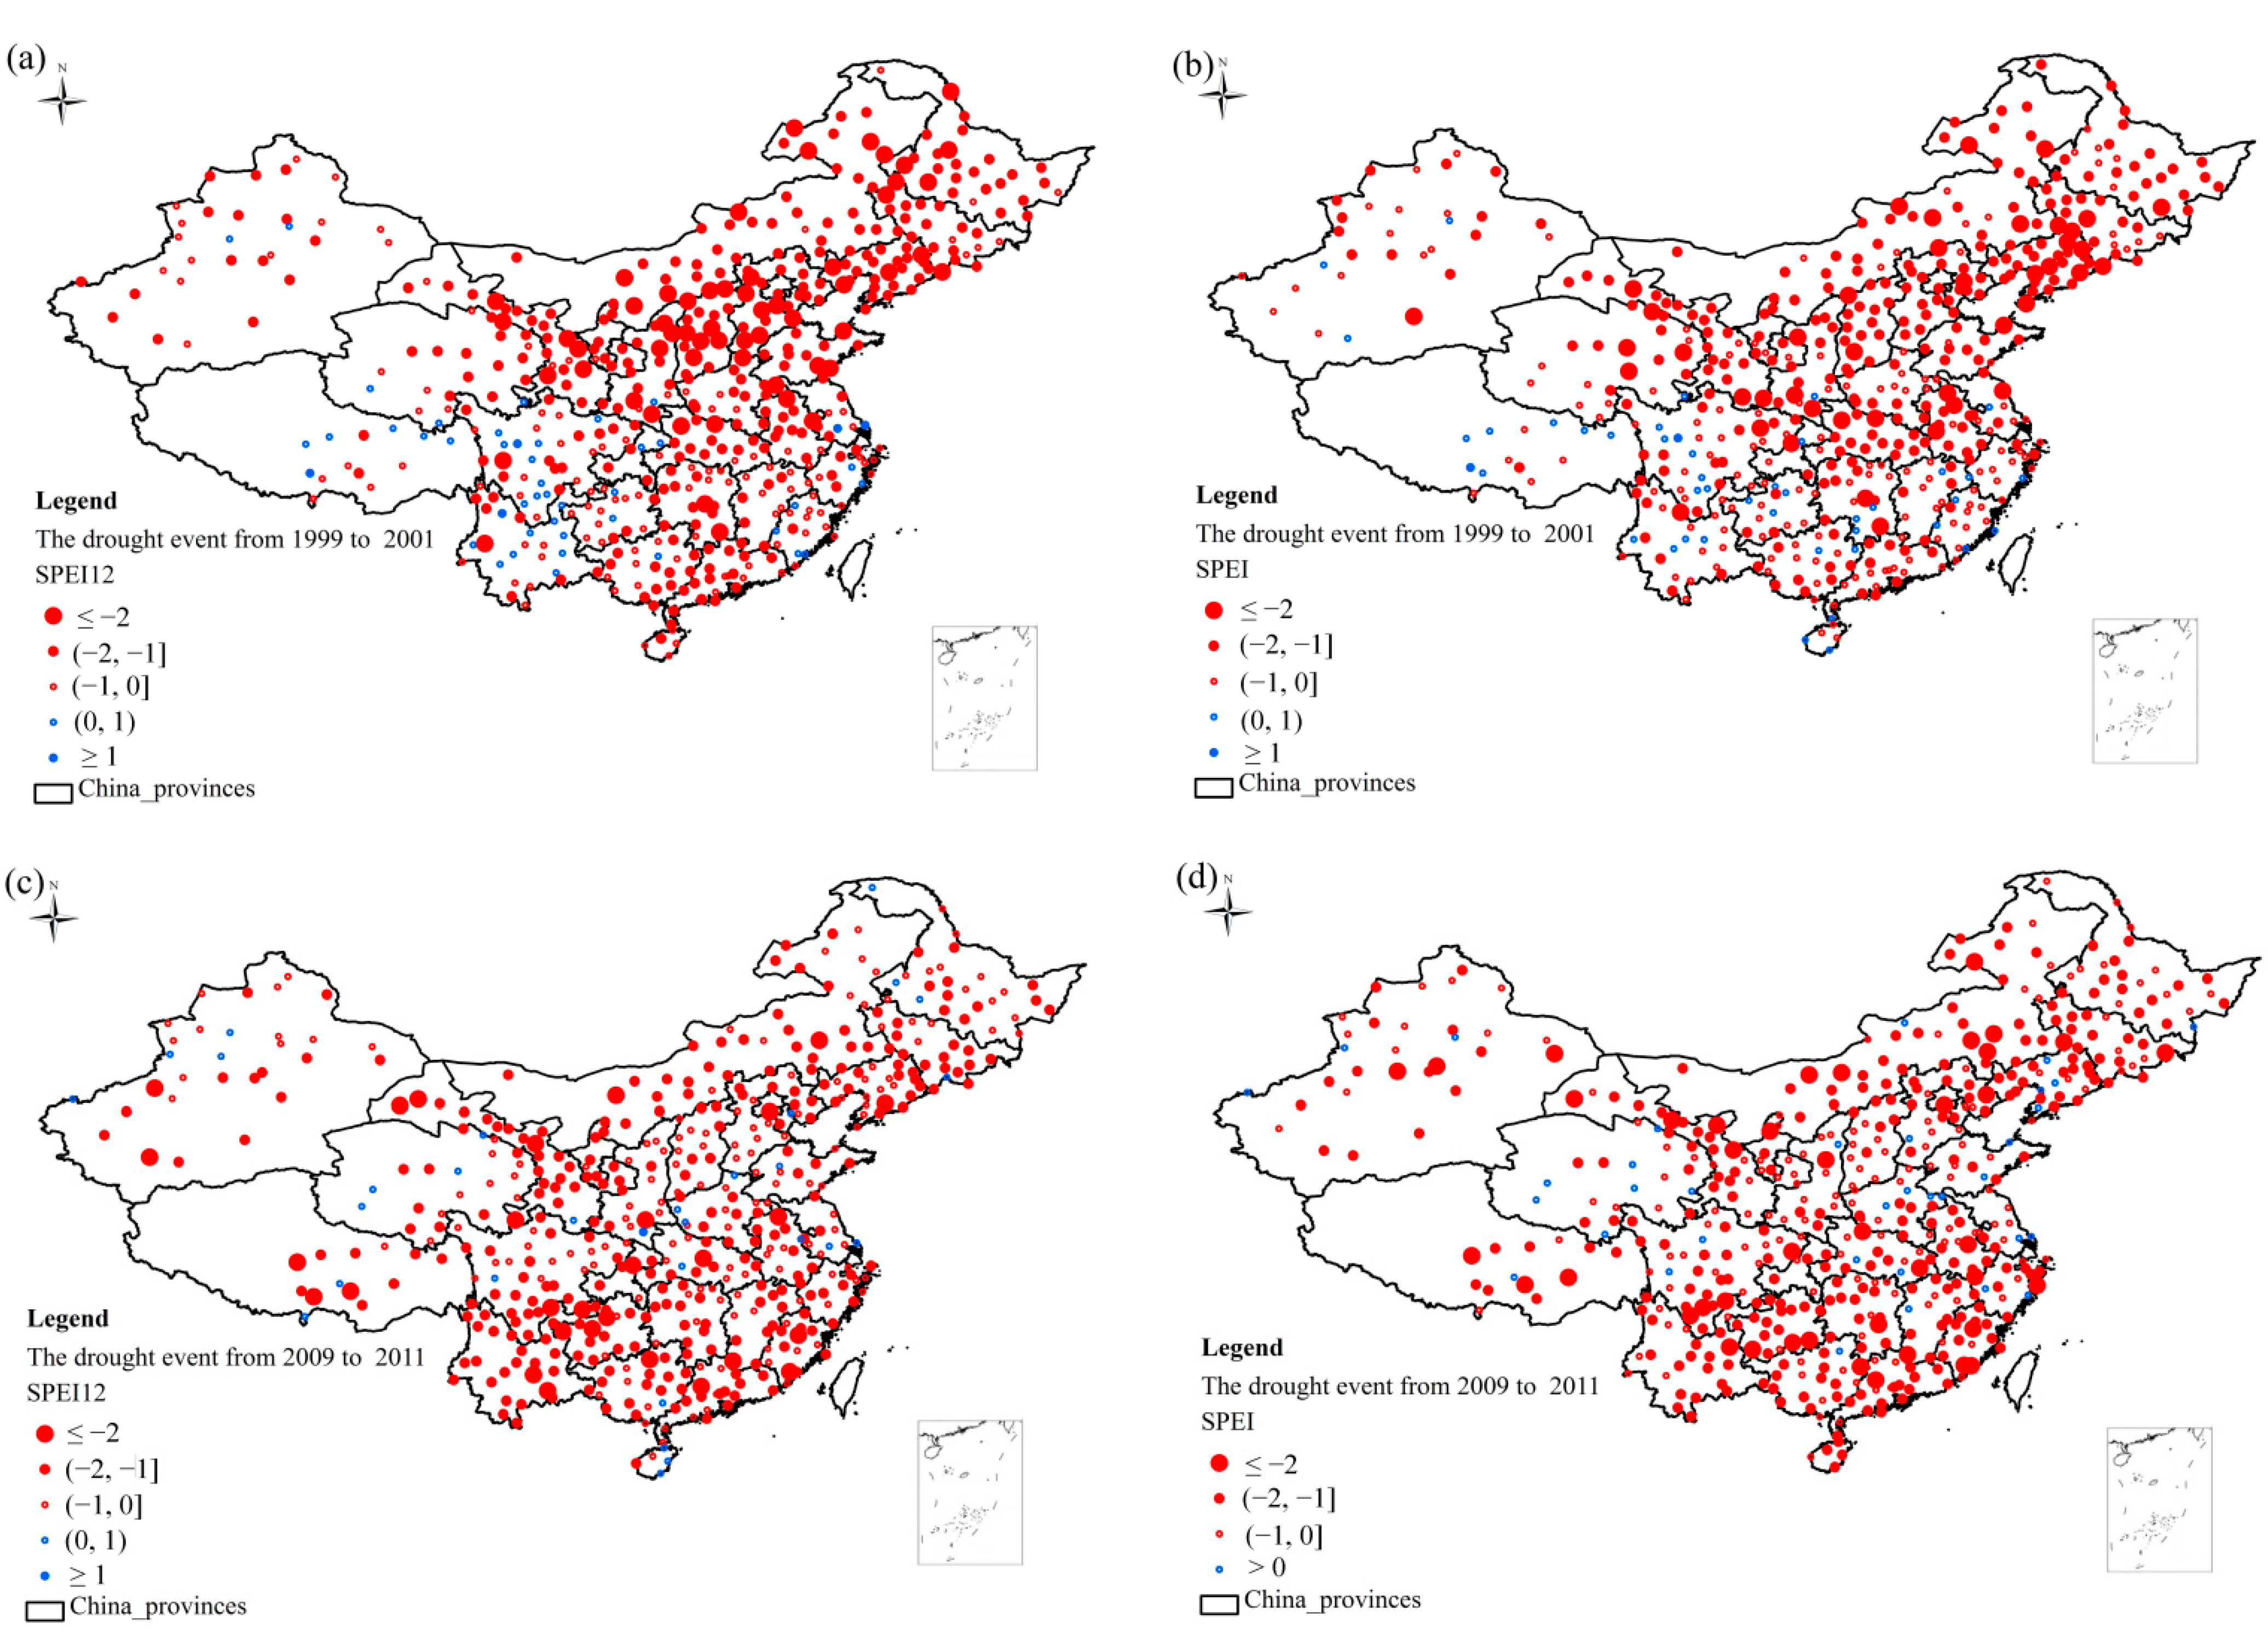
The spatial pattern of drought with the SPEI-12 was mainly concentrated in Northeast China and also east of central China. The severity of the drought was more serious in Northeast China and lesser east of central China based on the SPEIopt. The drought that occurred from 2009 to 2011 based on the SPEI-12 (Figure 4c) had less clear pattern than the SPEIopt (Figure 4d). The drought based on the SPEIopt was more concentrated in Southern China and Northern China, especially in Northeast China. Central China, however, did not have obvious drought signals based on the SPEIopt.
An extreme drought event occurred in Yunnan Province from October of 2009 to March of 2010 due to decreased precipitation and increased temperature [55]. The SPEIs with both the SPEI-12 and the optimal time scale (SPEIopt) detected the extreme drought conditions (Figure 5a,b). Most meteorological stations based on the SPEIopt detected the drought (SPEI ≤ −1), while the drought detected by the SPEI-12 did not show obvious drought conditions. The correlation between the NDVIanomaly and the SPEI-12 was not significant (Figure 5c) which indicated that the SPEI-12 could not reflect the impact of drought on the variations of NDVI, while the NDVIanomaly and the SPEIopt showed a significant positive correlation (r = 0.425, p < 0.05) (Figure 5d), The drought based on the SPEIopt also showed a clearly spatial difference from the west to the east, and the droughts in the middle and east were much more serious than that in the west. The spatial pattern and the severity of the drought based on the SPEIopt were in line with previous studies concerning the drought in Yunnan [55,56].
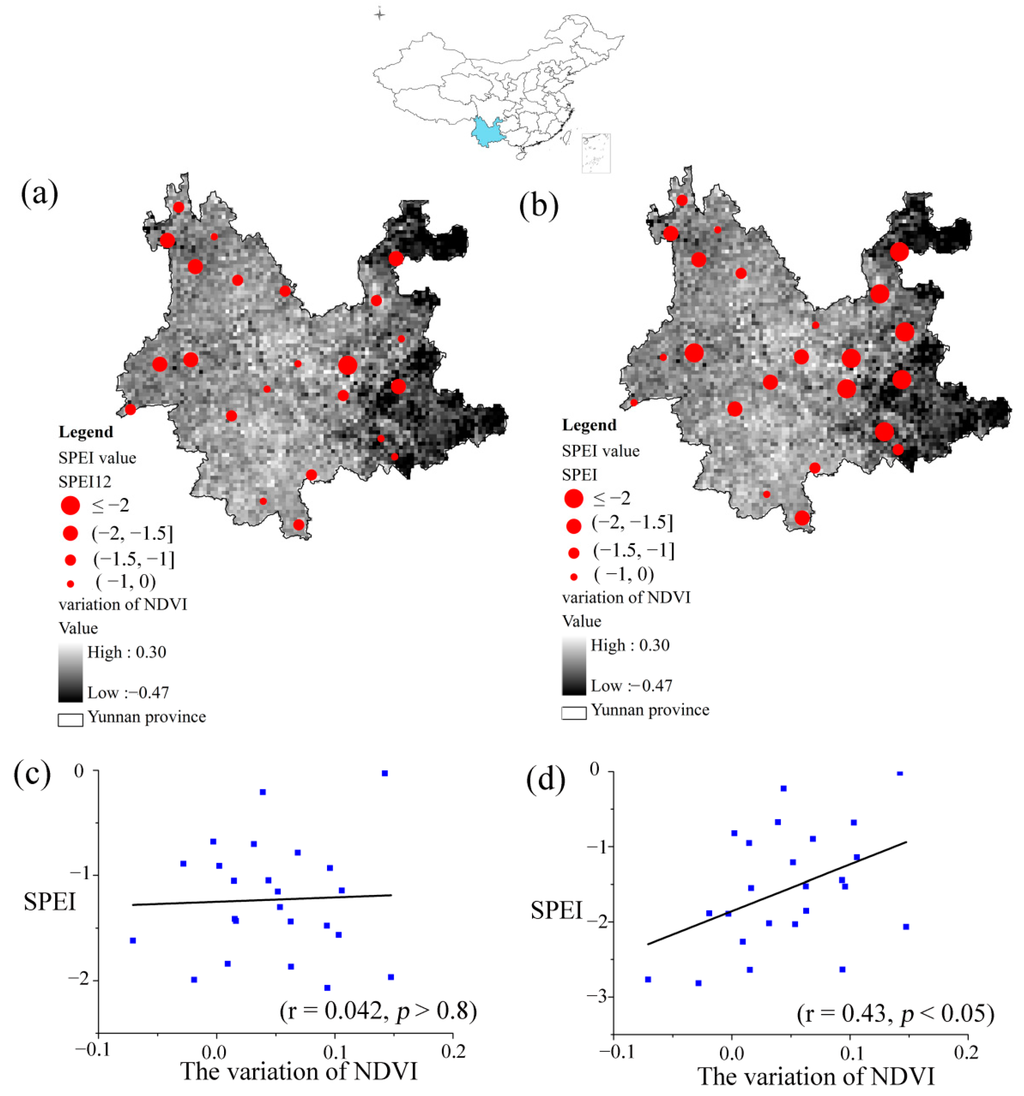
Figure 5.
The extreme drought event in the Yunnan province based on the SPEI-12 (a) and on the SPEIopt (b); The base map is the variation of NDVI in October of 2009; (c) The scatter plot based on the SPEI-12; (d) The scatter plot based on the SPEIopt. It considers both the growing season (April to October) and the time when the extreme drought condition happened.
3.4. Regression Models Between Vegetation Growth and Drought with Both SPEI-12 and SPEIopt
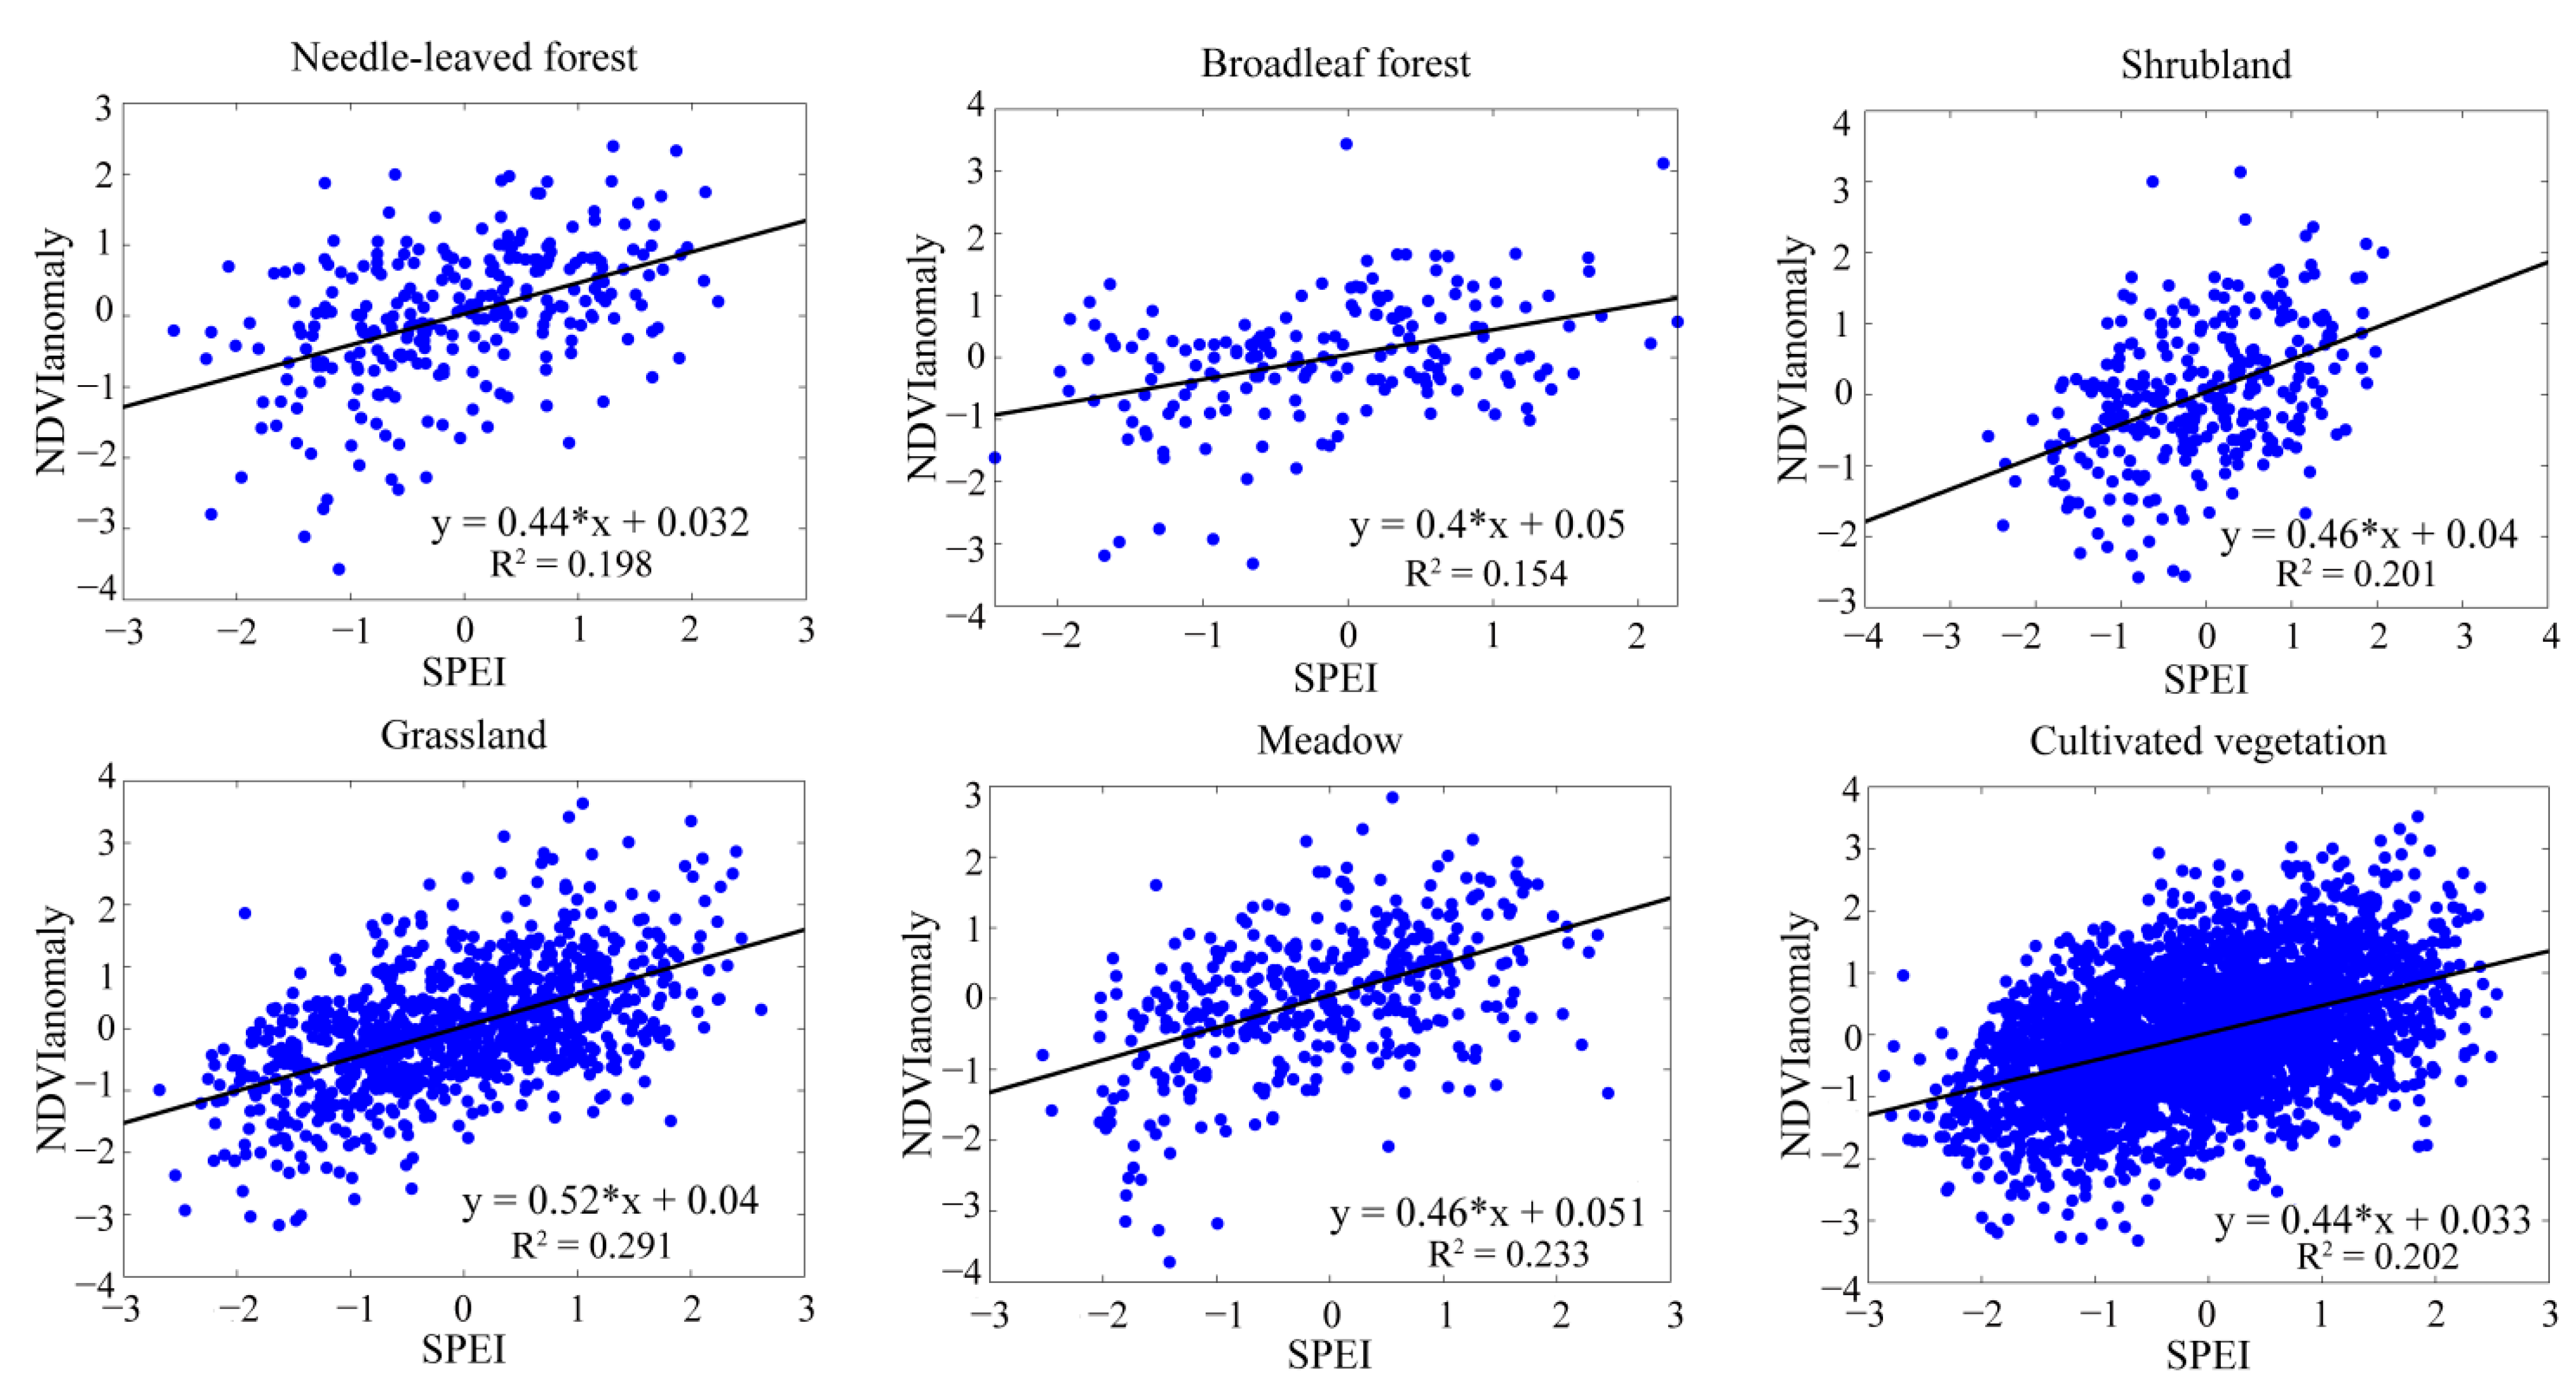
To compare the responses of various vegetation types to the drought during the growing season, the regression models between the NDVIanomaly and the time series of SPEI with both the optimal time scales and the SPEI-12 were employed. The regression analysis between the anomaly of NDVI and the SPEIopt (SPEI-12) could reflect the responses of vegetation to drought, and all the vegetation types passed the significance test. Based on the SPEI-12 (Figure 6), the vegetation types located in both the wet regions and the arid regions showed similar results, and the differences among all the vegetation types were not evident. The responses of vegetation to the drought based on the SPEIopt (Figure 7) showed better results than the SPEI-12. The coefficients of determination (R2) for all the vegetation types have increased (2.1% to 12.6%), except for shrubland. The vegetation types such as grassland, meadow and cultivated vegetation located in the arid sites had a higher percentage of increased R2 than the other three vegetation types. They were related to the short time scales and usually had water deficits during the growing season, so they were more sensitive to the water conditions. The forests were usually located in water surplus sites and corresponded to the long time scales close to the SPEI-12; thus, the R2 improvement was relatively small.
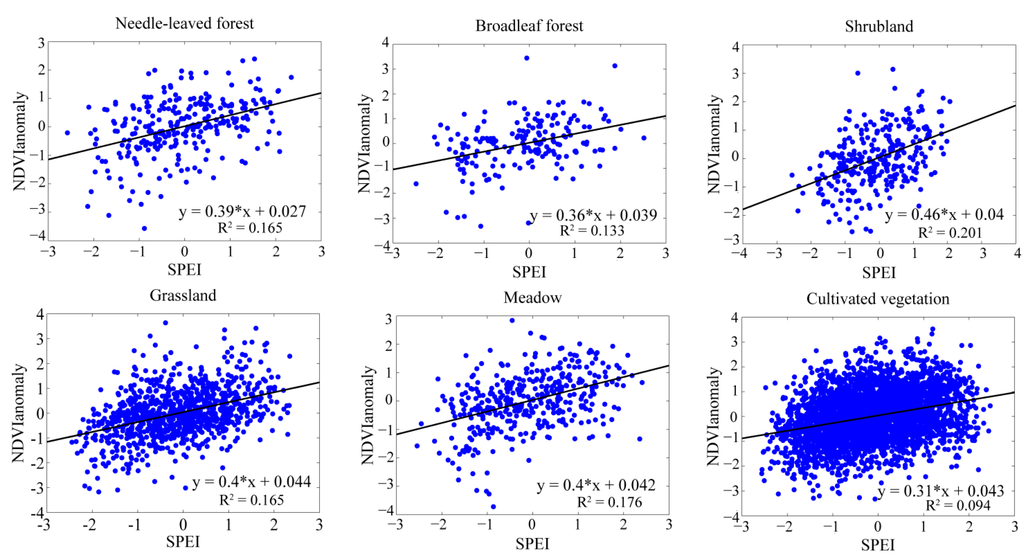
Figure 6.
The responses of vegetation to the drought based on the SPEI-12.
Figure 6.
The responses of vegetation to the drought based on the SPEI-12.
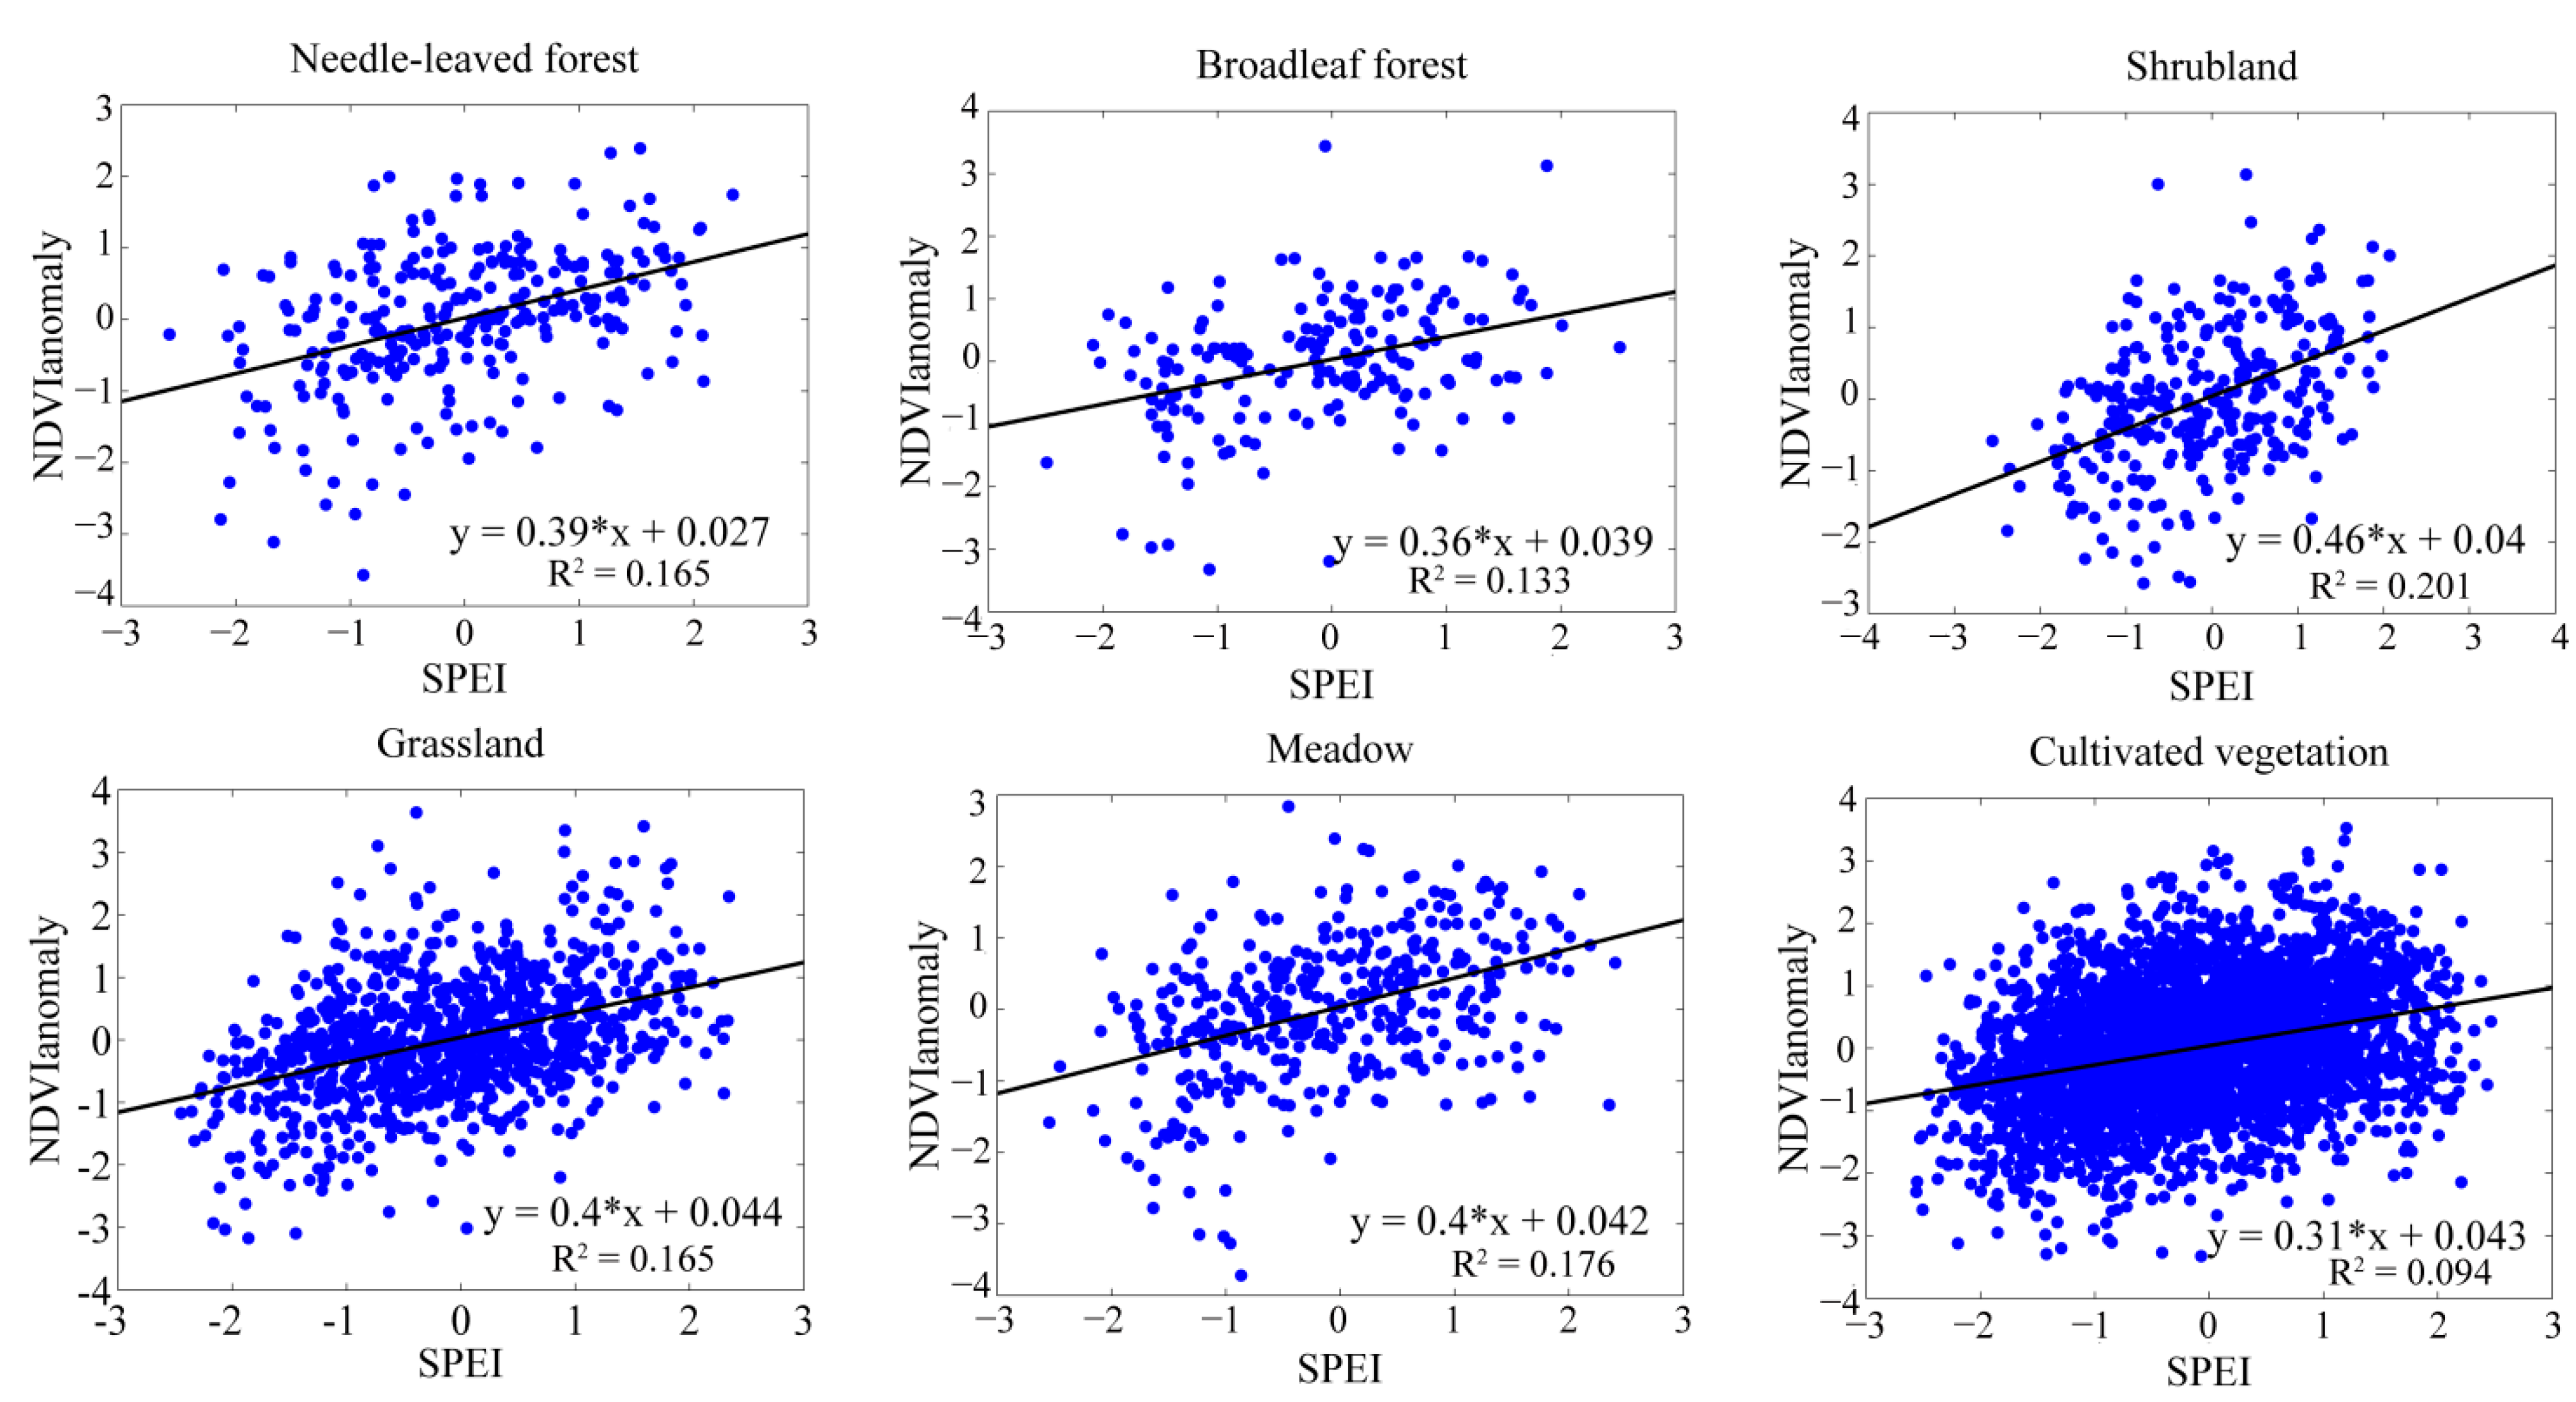
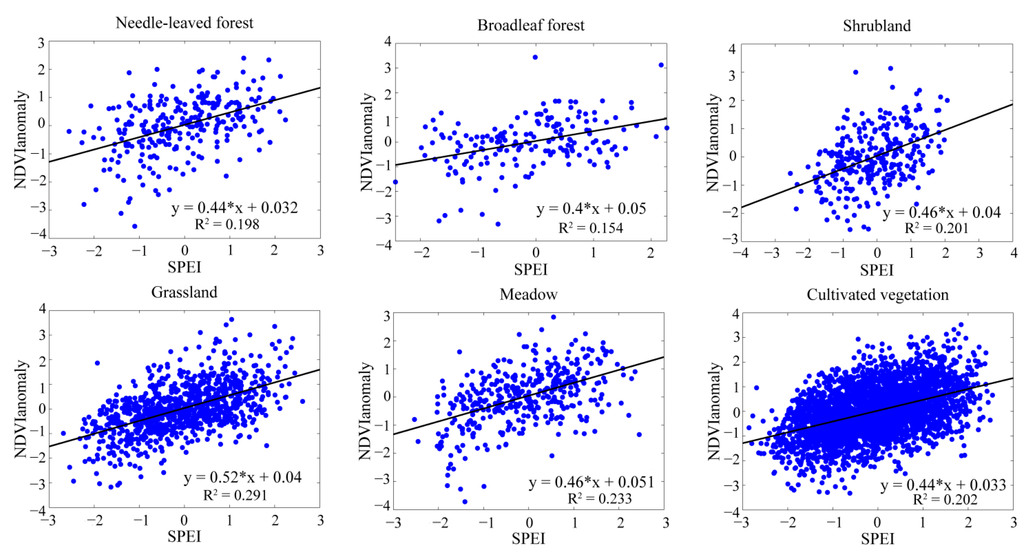
Figure 7.
The responses of vegetation to the drought based on the SPEIopt.
Figure 7.
The responses of vegetation to the drought based on the SPEIopt.
4. Discussion
The SPEI with various time scales is a new climatic drought indicator that could contain information on the evapotranspiration on drought, thereby making it possible to reflect the changes in the water demands under the background of global warming [23]. This study aimes to determine the optimal time scales of SPEI (SPEIopt) for various vegetation types, and further analyze the spatio-temporal characteristics of the drought and compare two large-scale drought events and extreme drought events based on the SPEI with both the SPEI-12 and the optimal time scales (SPEIopt). The covariation between the SPEIs with various time scales (1–12 months) and the anomalies of the normalized difference vegetation index (NDVI) is employed to determine the optimal time scales for various vegetation types. To the best of our knowledge, this is the first study to reflect the differences among various vegetation types based on the different SPEI time scales in China. The responses of vegetation to the drought are different for each land covers and the different responses of vegetation to the drought are investigated based on the regression models between the anomaly of NDVI and the SPEI with the optimal time scales.
Humid vegetation types, such as needle-leaved forest, broadleaf forest and shrubland, and arid vegetation types, such as grassland, meadow and cultivated vegetation, are all affected by drought, which indicate that the persistence of water deficit (i.e., the drought time scale) could play a significant role in determining the sensitivity of vegetation types to drought. For needle-leaved forest, broadleaf forest and shrubland, the optimal time scales are related to long time scales from 10 to 12 months. This indicates that the forests could be insensitive to short droughts, but the long and intense drought could affect their physiological structure [57,58]. These vegetation types may have conservative water and deeper root systems that can mitigate the effects of short water shortages on vegetation [59,60].
The optimal time scales for grassland, meadow and cultivated vegetation correspond to short time scales from 2 to 4 months. The arid vegetation types have rapid reactions when water deficits below the normal conditions occur, and they could be explained by the fact that the vegetation types are more sensitive to atmospheric drought [61] and have physiological anatomical and functional strategies to rapidly adapt to the changing water availability [33,62].
The correlation coefficients based on the optimal time scales for various vegetation types are higher than that based on the fixed time-scale (SPEI-12). For the forests, such as needle-leaved forest and broadleaf forest, the increased proportions of the correlation coefficients are relatively lower. This could be explained by the fact that they all related to the time lags from 10 to 11 months, which is close to the SPEI-12. The forests exhibit strong responses to the drought with long time scales (10–12 months) [33], and the determination of the optimal time scales could also reflect the differences in the forest types. The grassland, the meadow and the cultivated vegetation have increased correlation coefficients, mainly in that they respond to the short time scales (2 to 4 months), which show evident differences compared with the SPEI-12. The shorter time scales show the rapid responses of these three vegetation types to the drought, and as the time scales increased to medium and long time scales, the responses are weaker [26]. These results are meaningful in that they show the significance of detecting the optimal time scales for various vegetation types.
The spatio-temporal characteristics of drought based on the SPEI with the optimal time scales for all the vegetation types show that the frequency of drought has increased during the 21st century, and a drying trend has occurred in most of China. This result is similar to those of previous studies employing various other methods to investigate the drought situation in China [15,16,63]. Two large-scale drought events based on the SPEI with both the SPEI-12 and the optimal time scales (SPEIopt) show discrepancies. The large-scale drought event from 1999 to 2001 is mainly concentrated in Northern China, where the major vegetation types are grassland and cultivated vegetation, with relatively short time scales; thus, there exist evident differences between the two SPEI time scales and the severity of drought is less serious based on the short time scales. The large-scale drought event from 2009 to 2011 is distributed in North China and South China. The situation in North China is more serious based on the SPEI-12, while Southern China does not show clear differences, mainly because forests and shrubland are located in these regions with related long time scales close to the SPEI-12. The extreme drought event in Yunnan Province shows a better spatial pattern based on the SPEIopt, and these results are in line with many studies concerning the extreme Yunnan Province drought event [55,56].
The regression models between the NDVIanomaly and the SPEI with both the SPEI-12 and the optimal time scale (SPEIopt) for various vegetation types are compared, and the results show that the relationship between the NDVIanomaly and the SPEIopt has better linear trends, as the R2 increased by 2.1% to 12.6%. This further indicates that the vegetation type-specific SPEIopt for various vegetation types is better at showing the differences in the responses of water deficits. The grassland, meadow and cultivated vegetation display increased R2 values relative to the other three vegetation types in that they are related to the short time scales (2–4 months) that have clear differences with the SPEI-12. The water deficits with short time scales have large impacts on vegetation located in the arid/sub-arid sites where the water balance constrains the main physiological processes of vegetation relative to mesic sites [19,27,64,65,66,67]. The forests have relatively smaller increases in R2 in that they are related to the long time scales close to the SPEI-12. The water conditions are no longer the limiting factor for vegetation growth, and temperature and radiation are much more important [21].
The results show that the impact of drought on vegetation varies among different vegetation types. The aridity and associated characteristics could also explain the spatial differences of the drought. There are still other factors such as wildfire disturbances, tree mortality and land cover change that could lead to NDVI decreases. Ruling out these infrequent incidents should prove helpful to study drought in further studies. Given the large spatial heterogeneity of China, additional studies are needed to assess the impact of local conditions, such as the topography, on the vegetation’s responses to the drought at different time scales. Our findings are helpful in ecological assessments and understanding the impacts of drought on vegetation.
5. Conclusions
The climatic drought index (SPEI) derived from meteorological observations was extensively used to evaluate potential impacts of water deficits on terrestrial ecosystems. In this study, we estimated the optimal time scales for different vegetation types and found that forests had much longer time scales (10 to 12 months) than those of grassland, meadow and cultivated vegetation (2 to 4 months), which implied that the prior precipitation had different impacts on different vegetation types. When the vegetation type-related optimal time scales were used, the SPEI could better reflect the vegetation’s responses to water conditions, with the correlation coefficients between SPEIs and NDVI anomalies increased by 5.88% to 28.4%. The SPEI with the optimal time scales further indicated that the extent of drought across the entirety of China displayed an increasing trend during the period from 1982 to 2011, with the frequency of drought increasing during the 21st century and the drying trend occurring in most of China. The regression analysis between the anomaly of NDVI and the SPEI with the optimal time scales for various vegetation types showed that R2 increased by 2.1% to 12.6%. These results are helpful in assessing the sensitivity of vegetation to the drought and adapting appropriate management strategies to mitigate the impact of increasing droughts on vegetation growth.
Acknowledgments
This work was supported by the National Basic Research Program of China (2012CB955401), the National Natural Science Foundation of China (41321001 and 30970514), the Fundamental Research Funds for the Central University (2015KJJCB33), and the New Century Excellent Talents in University (NCET-10-0251).
Author Contributions
Tao Zhou, Zheng Li and Xiang Zhao designed the research. Zheng Li carried out the data calculation and cartography. Zheng Li and Tao Zhou drafted the manuscript. Xiang Zhao, Kaicheng Huang, Shan Gao, Hao Wu, and Hui Luo participated in the discussion and provided useful comments. All authors contributed to the manuscript and approved the final version.
Conflicts of Interest
The authors declare no conflict of interest.
References
- Beguería, S.; Vicente-Serrano, S.M.; Angulo, M. A multi-scalar global drought data set: The SPEI base: A new gridded product for the analysis of drought variability and impacts. Bull. Am. Meteorol. Soc. 2010, 91, 1351–1354. [Google Scholar] [CrossRef]
- Bryant, E.A. Natural Hazards, 2nd ed.; Cambridge University Press: Cambridge, UK, 2005. [Google Scholar]
- Wilhite, D. Drought as a natural hazard: Concepts and definitions. In Drought: A Global Assessment; Whihite, D.A., Ed.; Routledge: London, UK, 2000; pp. 3–18. [Google Scholar]
- Centre for Research on the Epidemiology of Disasters-CRED. EM-DAT: The OFDA/CRED International Disaster Database. Université Catholique de Louvain: Brussels, Belgium, 2011; Available online: www.emdat.be (accessed on 8 May 2015).
- Dai, A. Drought under global warming: A review. Wiley Interdiscip. Rev. Clim. Chang. 2011, 2, 45–65. [Google Scholar] [CrossRef]
- Xu, K.; Yang, D.W.; Yang, H.B.; Li, Z.; Qin, Y.; Shen, Y. Spatio-temporal variation of drought in China during 1961–2012: A climatic perspective. J. Hydrol. 2015, 526, 253–264. [Google Scholar] [CrossRef]
- Dai, A. Increasing drought under global warming in observations and models. Nat. Clim. Chang. 2013, 3, 52–58. [Google Scholar] [CrossRef]
- Seneviratne, S.I. Climate science: Historical drought trends revisited. Nature 2012, 491, 338–339. [Google Scholar] [CrossRef] [PubMed]
- Sheffield, J.; Andreadis, K.M.; Wood, E.F.; Lettenmaier, D.P. Global and continental drought in the second half of the twentieth century: Severity-area-duration analysis and temporal variability of large-scale events. J. Clim. 2009, 22, 1962–1981. [Google Scholar] [CrossRef]
- Sheffield, J.; Wood, E.F.; Roderick, M.L. Little change in global drought over the past 60 years. Nature 2012, 491, 435–440. [Google Scholar] [CrossRef] [PubMed]
- Wang, X.J.; Zhang, J.Y.; Shamsuddin, S.; Amgad, E.; He, R.M.; Bao, Z.X.; Ali, M. Water resources management strategy for adaptation to droughts in China. Mitig. Adapt. Strateg. Glob. Chang. 2012, 17, 923–937. [Google Scholar]
- Zhang, L.; Xiao, J.; Li, J.; Wang, K.; Lei, L.; Guo, H. The 2010 spring drought reduced primary productivity in southwestern China. Environ. Res. Lett. 2012, 7, 1–10. [Google Scholar] [CrossRef]
- Zhao, C.; Deng, X.; Yuan, Y.; Yan, H.; Liang, H. Prediction of drought risk based on the WRF model in Yunnan province of China. Adv. Meteorol. 2013, 2013, 1–9. [Google Scholar] [CrossRef]
- Zou, X.K.; Ren, G.Y.; Zhang, Q. Droughts variations in China based on a compound index of meteorological drought. Clim. Environ. Res. 2010, 15, 371–378. (in Chinese). [Google Scholar]
- Yu, M.X.; Li, Q.F.; Hayes, M.J.; Svoboda, M.D.; Heim, R.R. Are droughts becoming more frequent or severe in China based on the Standardized Precipitation Evapotranspiration Index: 1951–2010? Int. J. Climatol. 2014, 34, 545–558. [Google Scholar] [CrossRef]
- Wang, H.L.; Cheng, A.; Wang, Q.; He, B. Drought dynamics and impacts on vegetation in China from 1982 to 2011. Ecol. Eng. 2015, 75, 303–307. [Google Scholar] [CrossRef]
- Palmer, W.C. Meteorological Drought; U.S. Department of Commerce Weather Bureau Research Paper: Washington, DC, USA, 1965; pp. 45–58.
- McKee, T.B.; Doesken, N.J.; Kleist, J. The relationship of drought frequency and duration to time scales. In Proceedings of the Eighth Conference on Applied Climatology, Anaheim, CA, USA, 17–22 January 1993; pp. 17–22.
- Vicente-Serrano, S.M.; Beguería, S.; López-Moreno, J.I. A multiscalar drought index sensitive to global warming: The Standardized Precipitation Evapotranspiration Index. J. Clim. 2010, 23, 1696–1718. [Google Scholar] [CrossRef]
- Guttman, N.B. Comparing the Palmer drought index and the standardized precipitation index. J. Am. Water Resour. Assoc. 1998, 34, 113–121. [Google Scholar] [CrossRef]
- Vicente-Serrano, S.M.; Camarero, J.J.; Azorin-Molina, C. Diverse responses of forest growth to drought time-scales in the Northern Hemisphere. Glob. Ecol. Biogeogr. 2014, 23, 1019–1030. [Google Scholar] [CrossRef]
- Wells, N.; Goddard, S.; Hayes, M.J. A self-calibrating Palmer Drought Severity Index. J. Clim. 2004, 17, 2335–2351. [Google Scholar] [CrossRef]
- Potop, V.; Možny, M.; Soukup, J. Drought evolution at various time scales in the lowland regions and their impact on vegetable crops in the Czech Republic. Agric. For. Meteorol. 2012, 156, 121–133. [Google Scholar] [CrossRef]
- Potopová, V.; Štĕpánek, P.; Možný, M.; Türkott, L.; Soukup, J. Performance of the standardized precipitation evapotranspiration index at various lags for agricultural drought risk assessment in the Czech Republic. Agric. For. Meteorol. 2015, 202, 26–38. [Google Scholar] [CrossRef]
- Ivits, E.; Horion, S.; Fensholt, R.; Cherlet, M. Drought footprint on European ecosystems between 1999 and 2010 assessed by remotely sensed vegetation phenology and productivity. Glob. Chang. Biol. 2014, 20, 581–593. [Google Scholar] [CrossRef] [PubMed]
- Vicente-Serrano, S.M. Evaluating the impact of drought using remote sensing in a Mediterranean, semi-arid region. Nat. Hazards 2007, 40, 173–208. [Google Scholar] [CrossRef]
- Pasho, E.; Camarero, J.J.; Luis, M.; Vicente-Serrano, S.M. Impacts of drought at different time scales on forest growth across a wide climatic gradient in north-eastern Spain. Agric. For. Meteorol. 2011, 151, 1800–1811. [Google Scholar] [CrossRef]
- Kim, Y.; Kimball, J.; Zhang, K.; Didan, K.; Velicogna, I.; McDonald, K. Attribution of divergent northern vegetation growth responses to lengthening non-frozen seasons using satellite optical-NIR and microwave remote sensing. Int. J. Remote Sens. 2014, 35, 3700–3721. [Google Scholar] [CrossRef]
- Bi, J.; Xu, L.; Samanta, A.; Zhu, Z.; Myneni, R. Divergent arctic-boreal vegetation changes between North America and Eurasia over the past 30 years. Remote Sens. 2013, 5, 2093–2112. [Google Scholar] [CrossRef]
- Parida, B.; Buermann, W. Increasing summer drying in North American ecosystems in response to longer nonfrozen periods. Geophys. Res. Lett. 2014, 41, 5476–5483. [Google Scholar] [CrossRef]
- Beguería, S.; Vicente-Serrano, S.M.; Reig, F.; Latorre, B. Standardized precipitation evapotranspiration index (SPEI) revisited: Parameter fitting, evapotranspiration models, tools, datasets and drought monitoring. Int. J. Climatol. 2014, 34, 2001–2023. [Google Scholar] [CrossRef]
- Thornthwaite, C.W. An approach toward a rational classification of climate. Geogr. Rev. 1948, 38, 55–94. [Google Scholar] [CrossRef]
- Vicente-Serrano, S.M.; Gouveia, C.; Camarero, J.J.; Beguería, S.; Trigo, R.; López-Moreno, J.I.; Azorín-Molina, C.; Pasho, E.; Lorenzo-Lacruz, J.; Revuelto, J.; et al. Response of vegetation to drought time-scales across global land biomes. Proc. Natl. Acad. Sci. USA. 2013, 110, 52–57. [Google Scholar] [CrossRef] [PubMed]
- Potop, V.; Boroneant, C.; Možný, M.; Štĕpánek, P.; Skalák, P. Observed spatiotemporal characteristics of drought on various time scales over the Czech Republic. Theor. Appl. Climatol. 2014, 115, 563–581. [Google Scholar] [CrossRef]
- Pasho, E.; Toromani, E.; Alla, A.Q. Climatic impact on tree-ring widths in Abies Borisii-regis forests from South-East Albania. Dendrochronologia 2014, 32, 237–244. [Google Scholar] [CrossRef]
- López-Moreno, J.I.; Vicente-Serrano, S.M.; Beguería, S.; Lorenzo-Lacruz, J.; Azorin-Molina, C.; Zabalza, J.; Morán-Tejeda, E. Hydrological response to climate variability at different time scales: A study in the Ebro basin. J. Hydrol. 2013, 477, 175–188. [Google Scholar] [CrossRef]
- Zhang, X.S. Vegetation Map of the People’s Republic of China (1:1,000,000) and Its Illustration Put to Press; Geological Publishing House: Beijing, China, 2007. [Google Scholar]
- Mohammat, A.; Wang, X.; Xu, X.; Peng, L.; Yang, Y.; Zhang, X.; Myneni, R.; Piao, S. Drought and spring cooling induced recent decrease in vegetation growth in Inner Asia. Agric. For. Meteorol. 2013, 178–179, 21–30. [Google Scholar] [CrossRef]
- Henricksen, B.L.; Durkin, J.W. Growing period and drought early warning in Africa using satellite data. Int. J. Remote Sens. 1986, 7, 1583–1608. [Google Scholar] [CrossRef]
- Groten, S.M.E.; Ocatre, R. Monitoring the length of the growing season with NOAA. Int. J. Remote Sens. 2002, 23, 2797–2815. [Google Scholar] [CrossRef]
- Ji, L.; Peters, A.J. Assessing vegetation response to drought in the northern Great Plains using vegetation and drought indices. Remote Sens. Environ. 2003, 87, 85–98. [Google Scholar] [CrossRef]
- Jain, S.K.; Keshri, R.; Goswami, A.; Sarkar, A.; Chaudhry, A. Identification of drought-vulnerable areas using NOAA AVHRR data. Int. J. Remote Sens. 2009, 30, 2653–2668. [Google Scholar] [CrossRef]
- Karnieli, A.; Agam, N.; Pinker, R.T.; Anderson, M.; Imhoff, M.L.; Gutman, G.G.; Panov, N.; Goldberg, A. Use of NDVI and land surface temperature for drought assessment: Merits and limitations. J. Clim. 2010, 23, 618–633. [Google Scholar] [CrossRef]
- Son, N.T.; Chen, C.F.; Chen, C.R.; Chang, L.Y.; Minh, V.Q. Monitoring agricultural drought in the Lower Mekong Basin using MODIS NDVI and land surface temperature data. Int. J. Appl. Earth Obs. Geoinf. 2012, 18, 417–427. [Google Scholar] [CrossRef]
- Tucker, C.J.; Pinzon, J.E.; Brown, M.E.; Slayback, D.A.; Pak, E.W.; Mahoney, R.; Vermote, E.; Saleous, N.E. An extended AVHRR 8-km NDVI dataset compatible with MODIS and SPOT vegetation NDVI data. Int. J. Remote Sens. 2005, 26, 4485–4498. [Google Scholar] [CrossRef]
- Holben, B. Characteristics of maximum-value composite images from temporal AVHRR data. Int. J. Remote Sens. 1986, 7, 1417–1434. [Google Scholar] [CrossRef]
- Pinzon, J.; Tucker, C. A non-stationary 1981–2012 AVHRR NDVI3g time series. Remote Sens. 2014, 6, 6929–6960. [Google Scholar] [CrossRef]
- Fensholt, R.; Proud, S. Evaluation of earth observation based global long term vegetation trends—Comparing GIMMS and MODIS global NDVI time series. Remote Sens. Environ. 2012, 119, 131–147. [Google Scholar] [CrossRef]
- Wu, D.; Zhao, X.; Liang, S.; Zhou, T.; Huang, K.; Tang, B.; Zhao, W. Time-lag effects of global vegetation responses to climate change. Glob. Chang. Biol. 2015. [Google Scholar] [CrossRef] [PubMed]
- Mao, J.; Shi, X.; Thornton, P.; Hoffman, F.; Zhu, Z.; Myneni, R. Global latitudinal-asymmetric vegetation growth trends and their driving mechanisms: 1982–2009. Remote Sens. 2013, 5, 1484–1497. [Google Scholar] [CrossRef]
- Huang, W.H.; Yang, X.G.; Li, M.S.; Zhang, X.Y.; Wang, M.T.; Dai, S.W.; Ma, J.H. Evolution characteristics of seasonal drought in the south of China during the past 58 years based on standardized precipitation index. Trans. CSAE. 2010, 26, 50–59. [Google Scholar]
- Merlin, M.; Perot, T.; Perret, S.; Korboulewsky, N.; Vallet, P. Effects of stand composition and tree size on resistance and resilience to drought in sessile and Scots pine. For. Ecol. Manag. 2015, 339, 22–33. [Google Scholar] [CrossRef]
- Huang, K.C.; Yi, C.X.; Wu, D.H.; Zhou, T.; Zhao, X.; Blanford, W.J.; Wei, S.H.; Wu, H.; Du, L.; Li, Z. Tipping point of a conifer forest ecosystem under severe drought. Environ. Res. Lett. 2015, 10. [Google Scholar] [CrossRef]
- Xiong, G.J.; Zhang, B.K.; Li, C.Y.; Shang, K.Z.; Wang, S.G. Characteristics of drought variations in Southwest China in 1961–2013 based on SPEI. Progress. Inquis. Mutat. Clim. 2013, 3, 192–198. [Google Scholar]
- Zhang, W.C.; Zheng, J.M.; Ren, J.Z. Climate characteristics of extreme drought events in Yunnan. J. Catastrophol. 2013, 28, 59–64. [Google Scholar]
- Wang, J.J.; Meng, Y.B.; Zhang, Z.; Shi, P.J. Establishment of Palmer drought severity model for Yunnan Province: Analysis of characteristics of drought disaster in 2010. J. Nat. Disaster 2012, 21, 190–197. [Google Scholar]
- Orwing, D.A.; Abrams, M.D. Variation in radial growth responses to drought among species, site and canopy strata. Trees 1997, 11, 474–484. [Google Scholar] [CrossRef]
- Jonsson, S.; Gunnarson, B.; Criado, C. Drought is the major limiting factor for tree-ring growth of high-altitude Canary island pines on Tenerife. Geogr. Ann. 2002, 84, 51–71. [Google Scholar] [CrossRef]
- Hacke, U.G.; Sperry, J.S. Functional and ecological xylem anatomy. Perspect. Plant Ecol. 2001, 4, 97–115. [Google Scholar] [CrossRef]
- Willson, C.J.; Manos, P.S.; Hackson, R.B. Hydraulic traits are influenced by phylogenetic history in the drought-resistant, invasive genus Juniperus (Cupressaceae). Am. J. Bot. 2008, 95, 299–314. [Google Scholar] [CrossRef] [PubMed]
- Guehl, J.M.; Aussenac, G.; Bouachorine, J.; Zimmermann, R.; Pennes, J.M.; Ferhi, A.; Grieu, P. Sensitivity of leaf gas exchange to atmospheric drought, soil drought, and water-use efficiency in some Mediterranean Abies species. Can. J. For. Res. 1991, 21, 1507–1515. [Google Scholar] [CrossRef]
- Schwinning, S.; Sala, O.E. Hierarchy of responses to resource pulses in arid and semi-arid ecosystems. Oecologia 2004, 141, 211–220. [Google Scholar] [CrossRef] [PubMed]
- Li, W.G.; Yi, X.; Hou, M.T.; Chen, H.L.; Chen, Z.L. Standardized precipitation evapotranspiration index shows drought trend in China. Chin. J. Eco. Agric. 2012, 20, 643–649. [Google Scholar] [CrossRef]
- Vicente-Serrano, S.M. Differences in spatial patterns of drought on different time scales: An analysis of Iberian Peninsula. Water Resour. Manag. 2006, 20, 37–60. [Google Scholar] [CrossRef]
- Jump, A.S.; Hunt, J.M.; Peñuelas, J. Rapid climate change-related growth decline at the southern range edge of Fagus sylvatica. Glob. Chang. Biol. 2006, 12, 2163–2174. [Google Scholar] [CrossRef]
- Sarris, A.; Christodoulakis, D.; Kӧrner, C. Recent decline in precipitation and tree growth in the eastern Mediterranean. Glob. Chang. Biol. 2007, 13, 1–14. [Google Scholar] [CrossRef]
- Martínez-Vilalta, J.; López, B.C.; Adell, N.; Badiella, L.; Ninyerola, M. Twentieth century increase of Scots pine radial growth in NE Spain shows strong climate interactions. Glob. Chang. Biol. 2008, 14, 2868–2881. [Google Scholar] [CrossRef]
© 2015 by the authors; licensee MDPI, Basel, Switzerland. This article is an open access article distributed under the terms and conditions of the Creative Commons Attribution license (http://creativecommons.org/licenses/by/4.0/).
