
Burden of Outdoor Air Pollution in Kerala, India—A First Health Risk Assessment at State Level

Abstract
:1. Introduction
2. Data and Methods
2.1. Quantification Method
2.2. Data Input

| Data | Reference area | Source | Reference Year | Stratified by | ||
|---|---|---|---|---|---|---|
| Age | Sex | Rural/ Urban | ||||
| PM data | Measured data for six cities in Kerala | CPCB [23] | 2008–2011 | – | – | Urban only |
| Concentration-response function for PM and all-cause mortality/cardiovascular mortality | Meta-analyses based on studies from the U.S.A., Germany, the Netherlands, Switzerland, Canada, China and New Zealand | Hoek et al. [24] | 1976–2008 (range of the follow-up period in the meta-analyses) | Applicable only for people aged 30 years and older | – | – |
| Four cities in northern China | Zhang et al. [25] | 1998–2009 | Applicable only for people aged 30 years and older | Yes | – | |
| Population data | Kerala | Government of India [14] | 2011 | Yes (1 year age groups) | Yes | Yes |
| Life table | Kerala | Registrar General India [22] | 2006–2010 | Yes (1 year age groups) | Yes | Yes |
| Cause specific mortality data | Kerala (coverage only 12.2% of total deaths) | Office of the registrar general, India [26] | 2010 | Yes (10 years age groups) | Yes | – |
| Mortality data | Kerala (no ICD for cause of death) | Office of the registrar India [27] | 2011 | Yes (10 years age groups) | Yes | Yes |
2.2.1. Particulate Matter Data
| City | Number of Stations | 2008 | 2009 | 2010 | 2011 |
|---|---|---|---|---|---|
| Kochi | 7 | 43 | 42 | 36 | 38 |
| Kozhikode | 2 | 34 | 32 | 42 | 46 |
| Thrissur | 1 | – | – | 31 | 33 |
| Mallapuram | 1 | – | – | 39 | 30 |
| Trivandrum | 4 | 67 | 61 | 56 | 58 |
| Kollam | 2 | – | – | 47 | 53 |
2.2.2. Concentration-Response Functions
| Source | All-Cause Mortality (ICD-10: A00-R99) | Cardiovascular mortality (ICD-10: I00-I99) | Unit |
|---|---|---|---|
| Hoek et al. [24] | 1.062 (95% CI: 1.04–1.083) | 1.11 (95% CI: 1.05–1.16) | per 10 μg/m3 change in PM2.5 |
| Zhang et al. [25] | 1.24 (95% CI: 1.22–1.27) | 1.23 (95% CI: 1.19–1.26) | per 10 μg/m3 change in PM10 |
2.2.3. Population Data
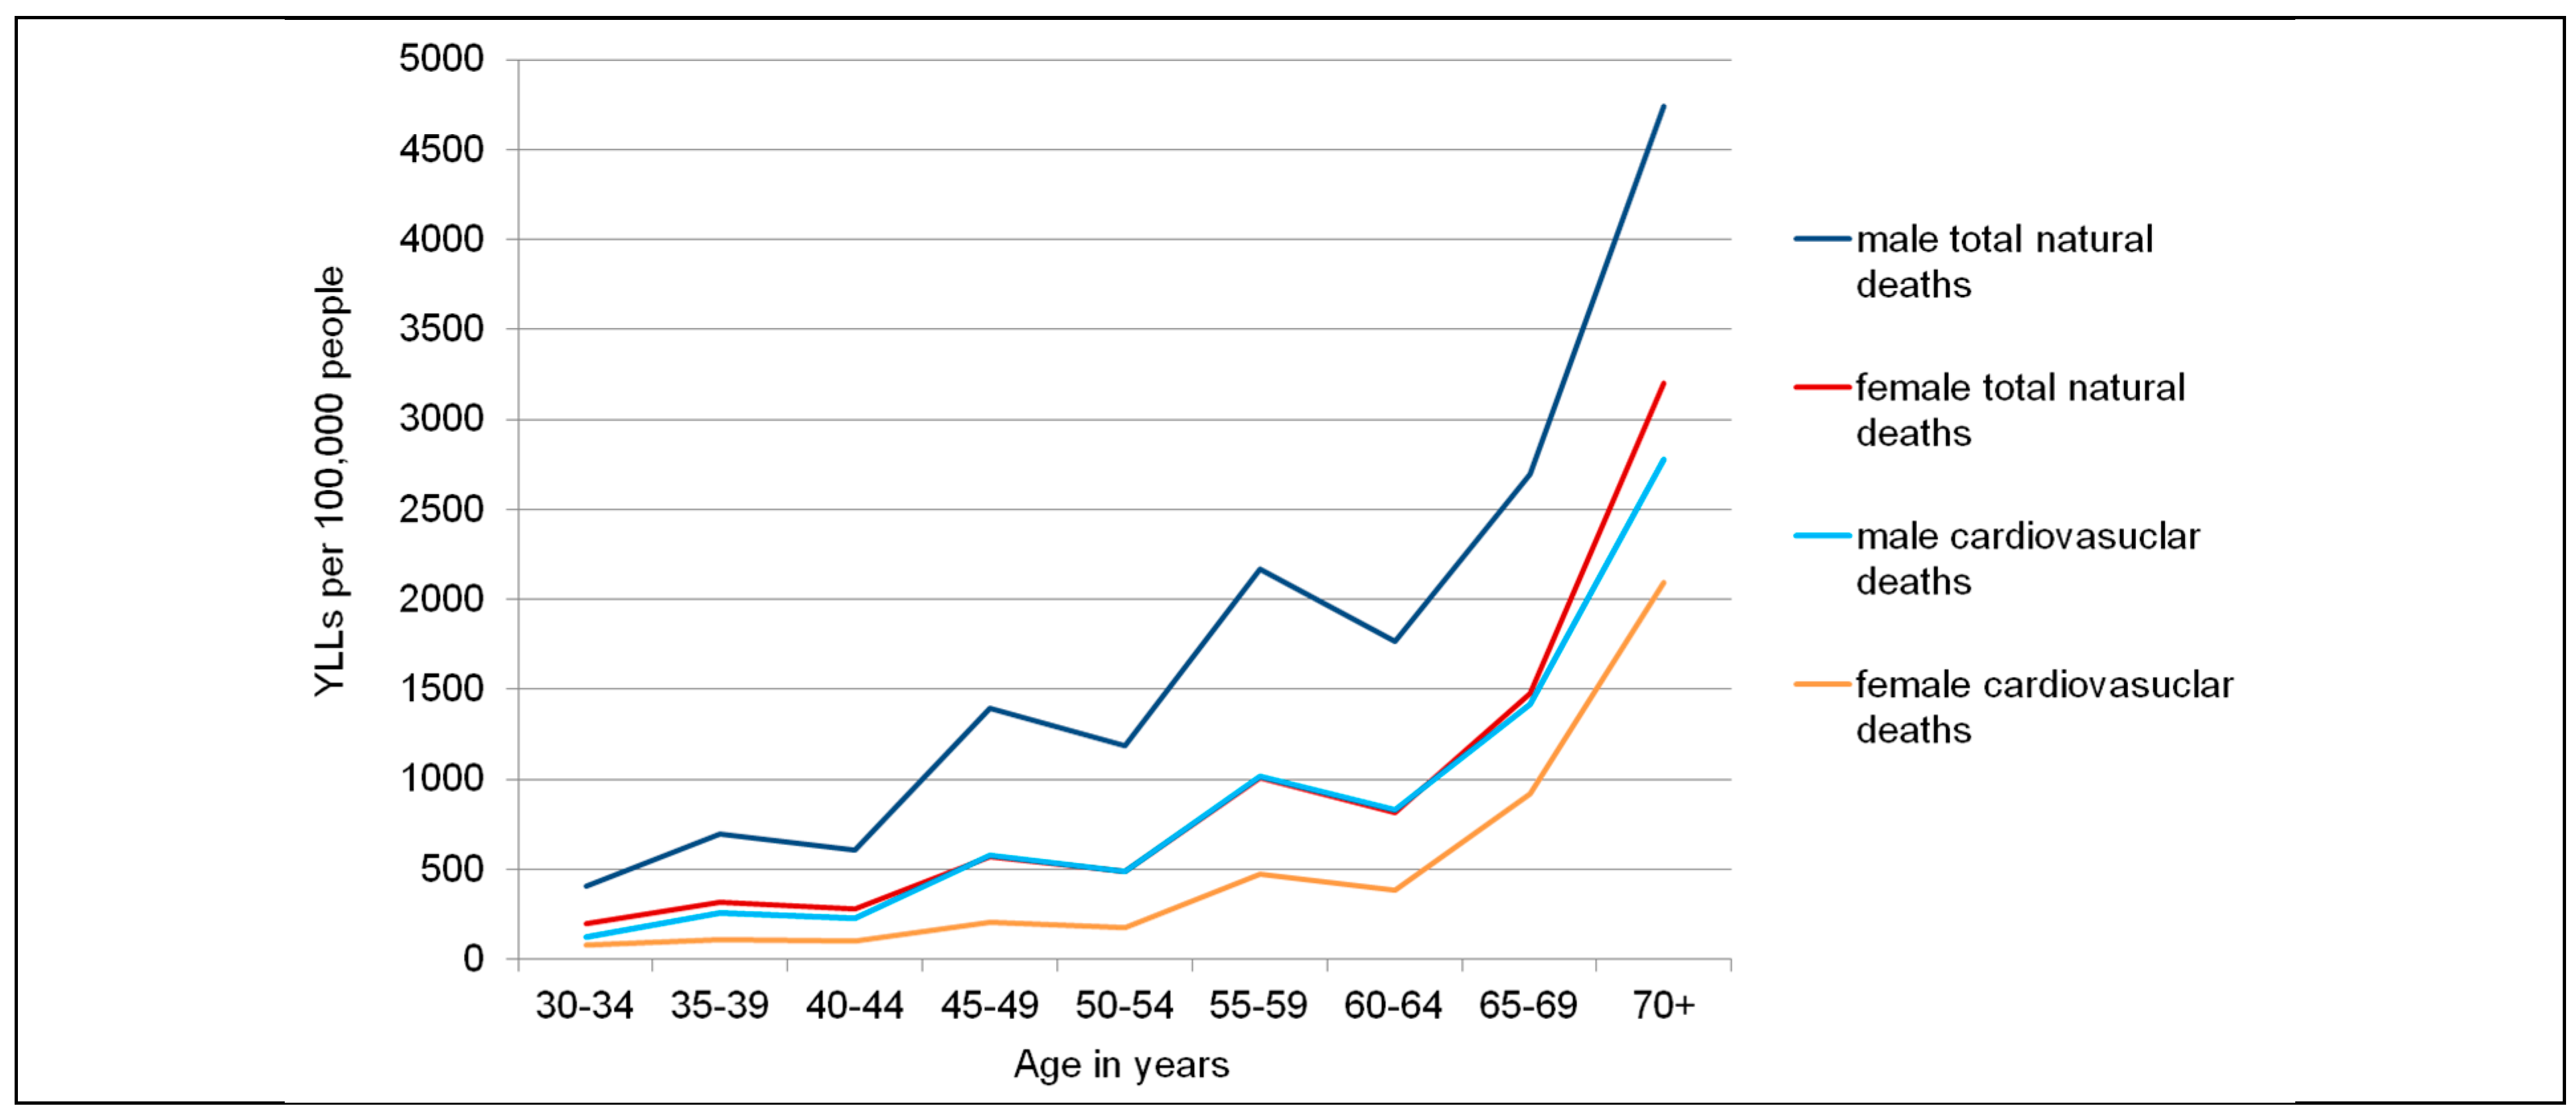
2.2.4. Mortality Data
| Age | Population | Natural Deaths | Natural Deaths per 100,000 People | Cardiovascular Deaths | Cardiovascular Deaths per 100,000 People | |||||
| M | W | M | W | M | W | M | W | M | W | |
| <1 | 116,460 | 113,490 | 1,679 | 1,286 | 1442 | 1133 | 41 | 36 | 35 | 32 |
| 1–4 | 477,265 | 459,537 | 227 | 173 | 48 | 38 | 22 | 10 | 5 | 2 |
| 5–9 | 616,113 | 590,795 | 133 | 105 | 22 | 18 | 14 | 13 | 2 | 2 |
| 10–14 | 676,020 | 647,412 | 146 | 115 | 22 | 18 | 15 | 15 | 2 | 2 |
| 15–19 | 632,095 | 612,644 | 395 | 232 | 62 | 38 | 75 | 29 | 12 | 5 |
| 20–24 | 618,543 | 661,205 | 386 | 250 | 62 | 38 | 73 | 32 | 12 | 05 |
| 25–29 | 564,939 | 670,117 | 680 | 355 | 120 | 53 | 128 | 88 | 23 | 13 |
| 30–34 | 535,243 | 641,998 | 644 | 340 | 120 | 53 | 121 | 84 | 23 | 13 |
| 35–39 | 553,478 | 681,566 | 1,296 | 658 | 234 | 97 | 304 | 145 | 55 | 21 |
| 40–44 | 539,207 | 627,153 | 1,262 | 606 | 234 | 97 | 296 | 134 | 55 | 21 |
| 45–49 | 527,161 | 593,487 | 3,291 | 1,338 | 624 | 225 | 853 | 300 | 162 | 51 |
| 50–54 | 446,274 | 480,709 | 2,786 | 1,084 | 624 | 225 | 722 | 243 | 162 | 51 |
| 55–59 | 414,667 | 424,358 | 5,633 | 2,423 | 1,359 | 571 | 1,666 | 712 | 402 | 168 |
| 60–64 | 333,759 | 355,965 | 4,534 | 2,032 | 1,359 | 571 | 1,341 | 597 | 402 | 168 |
| 65–69 | 218,695 | 258,174 | 5,679 | 3,438 | 2,597 | 1,332 | 1,871 | 1,346 | 856 | 521 |
| 70+ | 340,821 | 488,427 | 19,519 | 18,911 | 5,727 | 3,872 | 7,185 | 7,784 | 2,108 | 1,594 |
| Total | 7,610,740 | 8,307,037 | 48,290 | 33,346 | 635 | 401 | 14,727 | 11,569 | 194 | 139 |
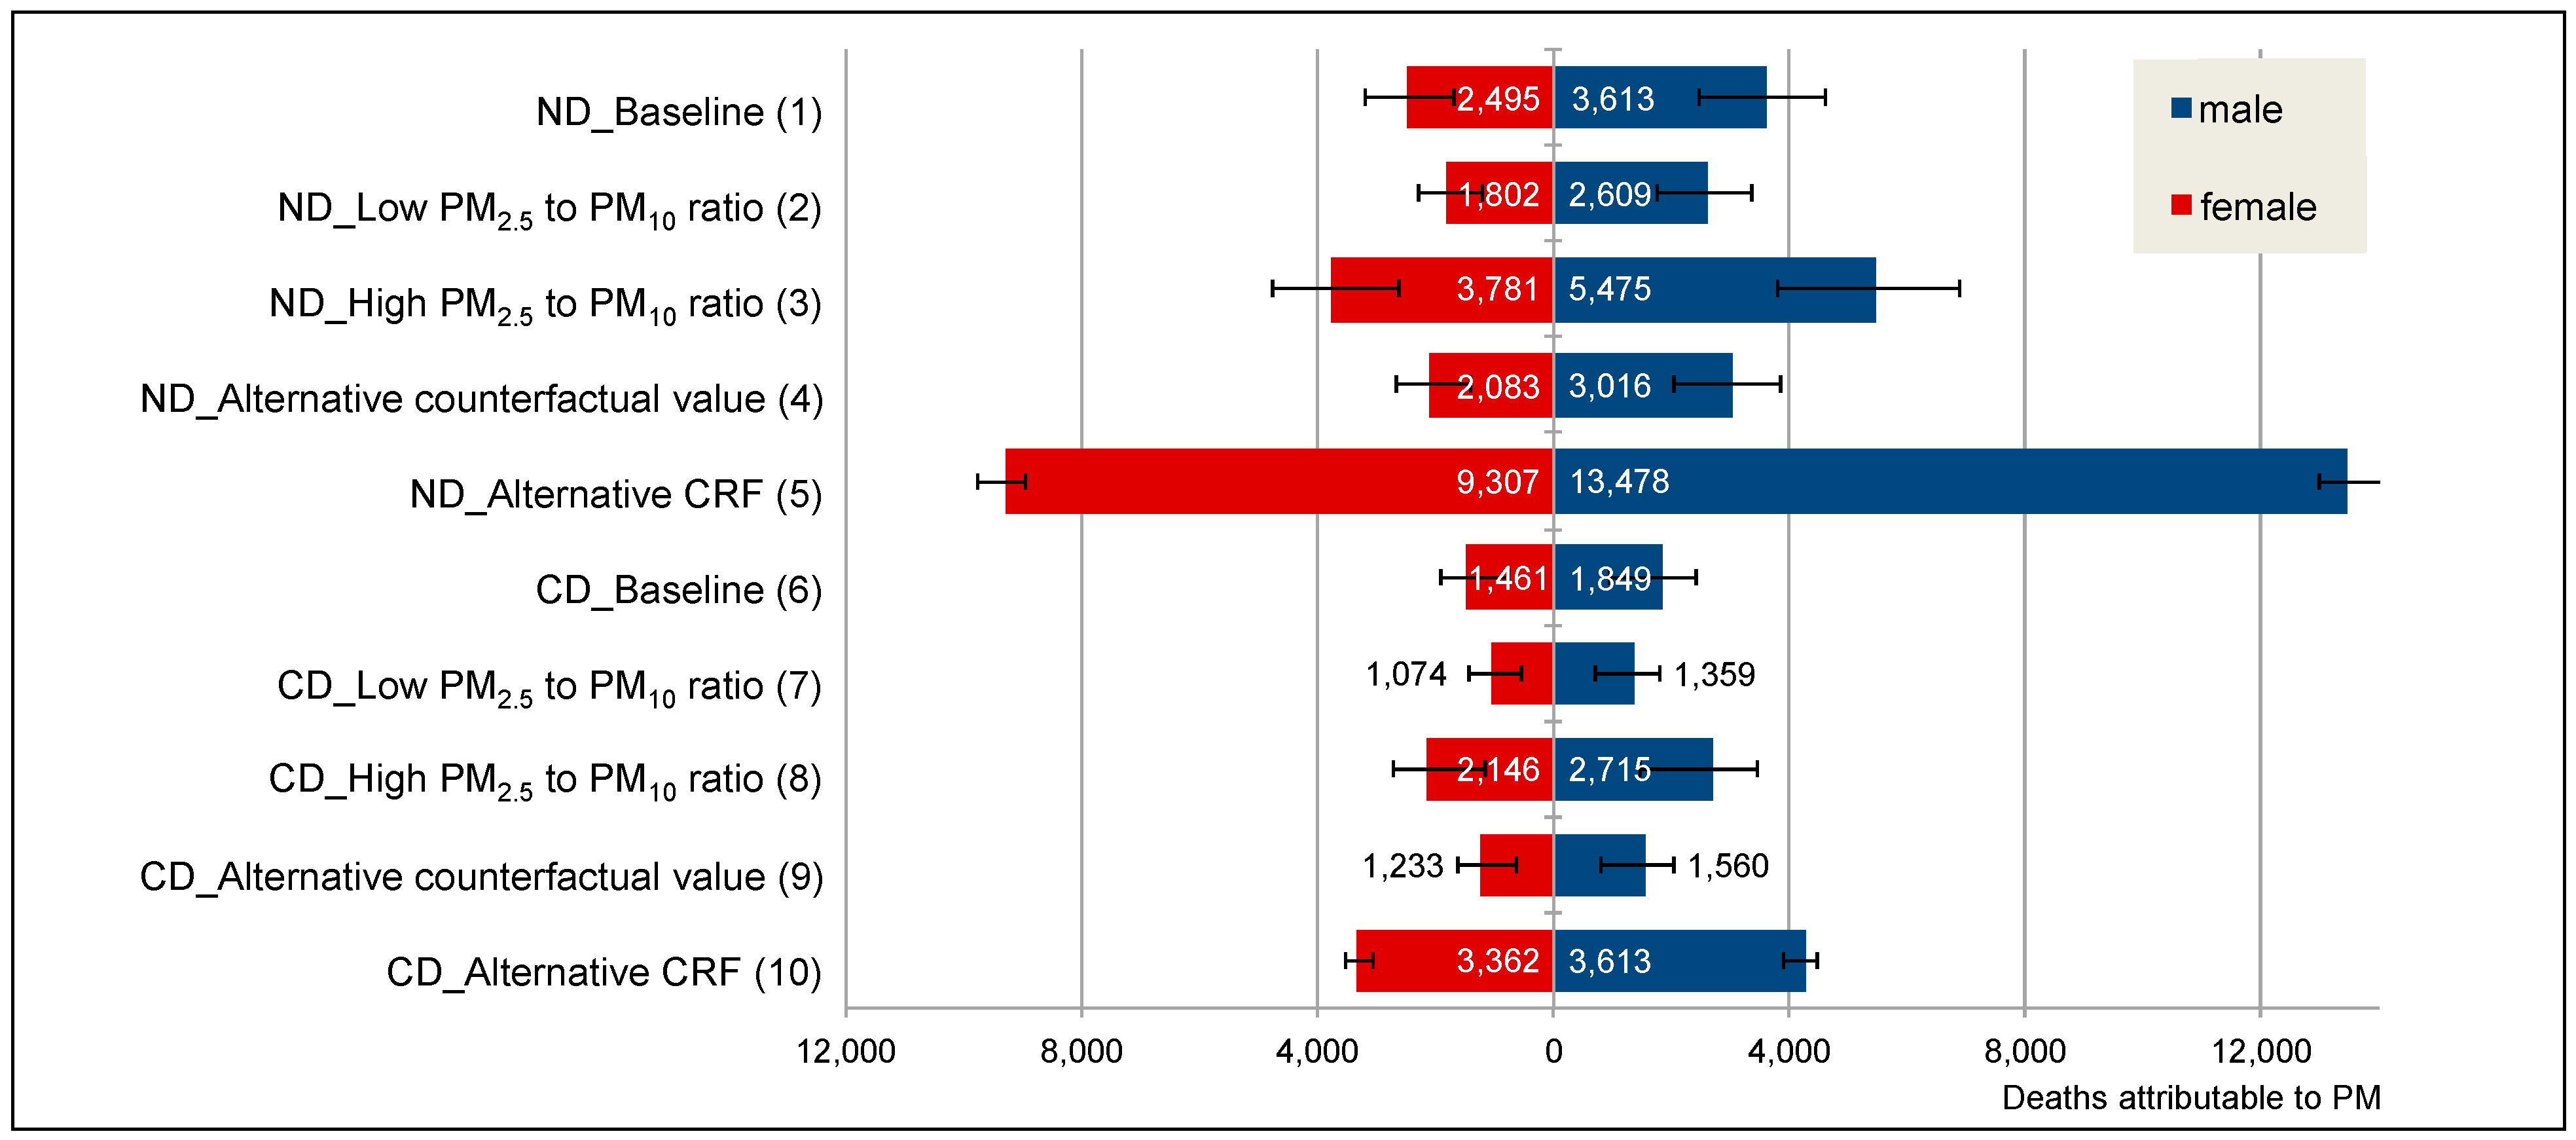
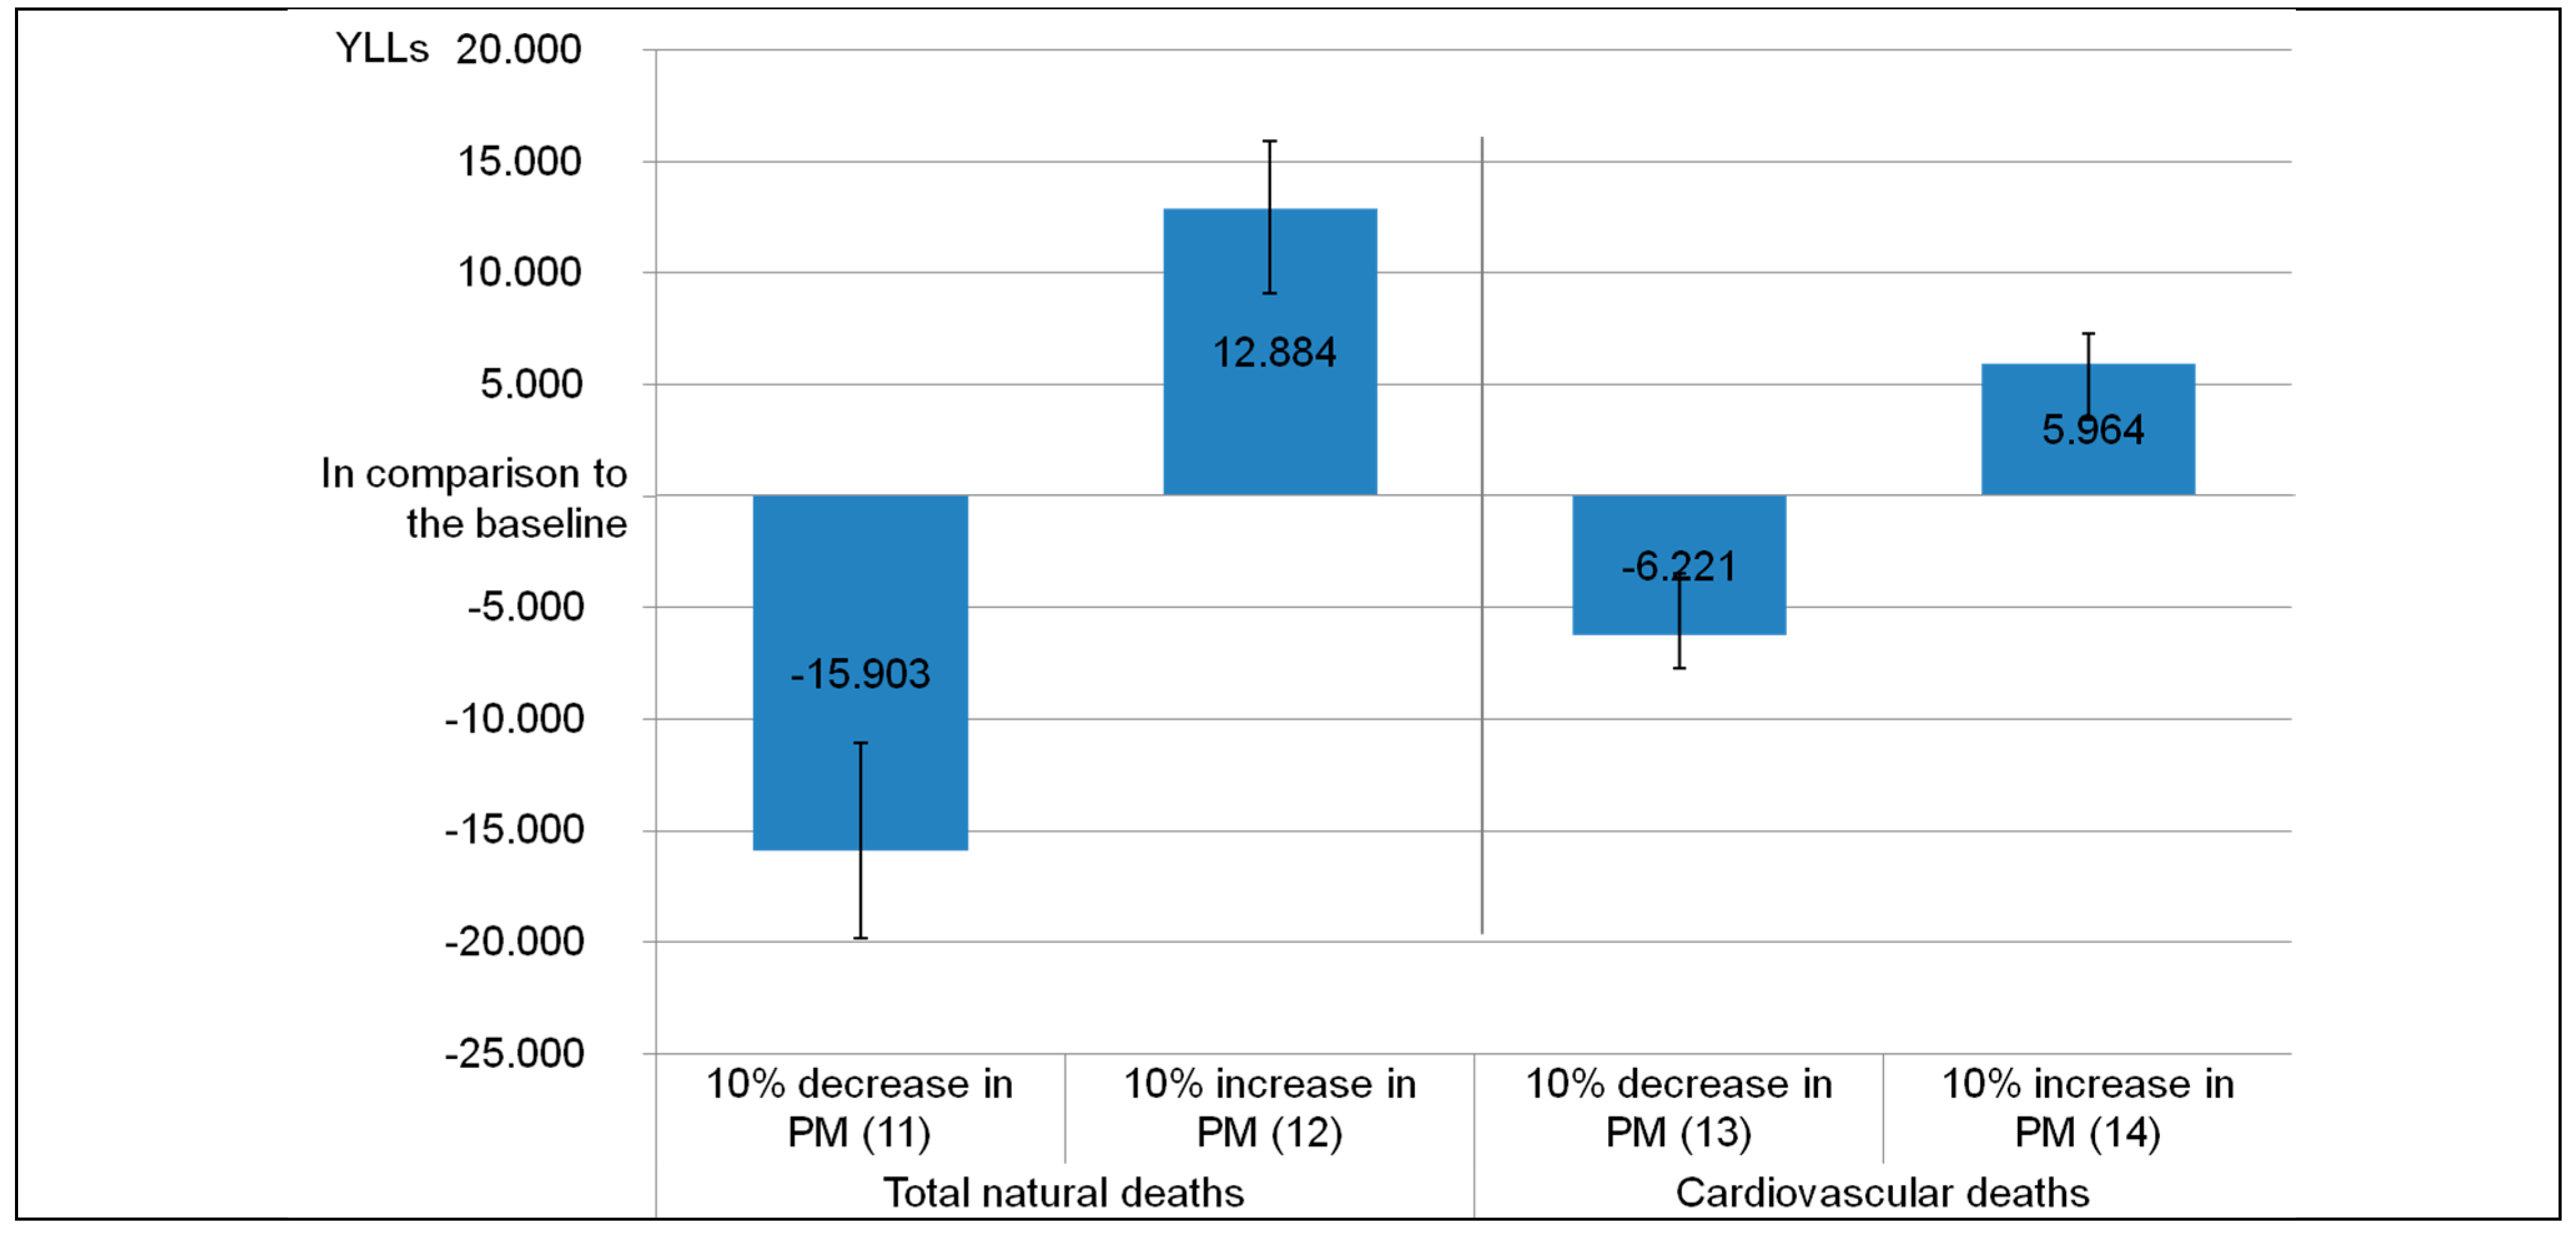
2.2.5. Scenario Analyses
| Scenario | Concentration-Response Function (per 10 μg/m3) | PM2.5 to PM10 Ratio | Counterfactual Value in μg/m3 |
|---|---|---|---|
| Natural deaths excluding accidents (ICD 10: A00–R99) | |||
| ND_Baseline (1) | 1.062 (95% CI: 1.040–1.083) a | 0.5 c | 7.3 e |
| ND_Low PM2.5 to PM10 ratio (2) | 1.062 (95% CI: 1.040–1.083) a | 0.4 d | 7.3 e |
| ND_High PM2.5 to PM10 ratio (3) | 1.062 (95% CI: 1.040–1.083) a | 0.7 d | 7.3 e |
| ND_Alternative counterfactual value (4) | 1.062 (95% CI: 1.040–1.083) a | 0.5 c | 10 c |
| ND_Alternative CRF (5) | 1.24 (95% CI: 1.22–1.27) b | - | 20 c |
| Deaths caused by diseases of the circulatory system (ICD 10: I00–I99) | |||
| CD_Baseline (6) | 1.11 (95% CI: 1.050–1.16) a | 0.5 c | 7.3 e |
| CD_Low PM2.5 to PM10 ratio (7) | 1.11 (95% CI: 1.050–1.16) a | 0.4 d | 7.3 e |
| CD_High PM2.5 to PM10 ratio (8) | 1.11 (95% CI: 1.050–1.16) a | 0.7 d | 7.3 e |
| CD_Alternative counterfactual value (9) | 1.11 (95% CI: 1.050–1.16) a | 0.5 c | 10 c |
| CD_Alternative CRF (10) | 1.23 (95% CI: 1.19–1.26) b | – | 20 c |
| Scenario | Concentration-Response Function (per 10 μg/m3) | PM2.5 to PM10 Ratio | Counterfactual Value in μg/m3 | Assumption (PM2.5 Development) |
|---|---|---|---|---|
| Natural deaths ICD 10: A00-R99 | ||||
| ND_10% increase in PM2.5 (11) | 1.062 (95% CI: 1.040–1.083) a | 0.5c | 7.3 e | 10% less PM2.5 |
| ND_10% decrease in PM2.5 (12) | 1.062 (95% CI: 1.040–1.083) a | 0.5c | 7.3 e | 10% more PM2.5 |
| Deaths caused by diseases of the circulatory system ICD 10 I00-I99 | ||||
| CD_10% increase in PM2.5 (13) | 1.11 (95% CI: 1.050–1.16) a | 0.5 c | 7.3e | 10% less PM2.5 |
| CD_10% decrease in PM2.5 (14) | 1.11 (95% CI: 1.050–1.16) a | 0.5 c | 7.3e | 10% more PM2.5 |
3. Results and Discussion
3.1. Results

| Scenario | YLLs | YLLs per 100,000 | ||||
|---|---|---|---|---|---|---|
| Men | Women | Total | Men | Women | Total | |
| ND_Baseline (1) | 58,868 | 37,490 | 96,358 | 773 | 451 | 605 |
| (40,003–75,094) | (25,476–47,823) | (65,479–122,917) | (526-987) | (307–576) | (411–772) | |
| ND_Low PM2.5 to PM10 ratio (2) | 42,510 | 27,072 | 69,582 | 559 | 326 | 437 |
| (28,636–54,656) | (18,237–34,807) | (46,873–89,463) | (376–718) | (220–419) | (294–562) | |
| ND_High PM2.5 to PM10 ratio (3) | 89,208 | 56,812 | 146,020 | 1172 | 684 | 917 |
| (61,619–112,160) | (39,242–71,429) | (100,861–183,589) | (810–1,474) | (472–860) | (634–1,153) | |
| ND_Alternative counterfactual value (4) | 49,139 | 31,294 | 80,433 | 646 | 377 | 505 |
| (33,219–62,977) | (21,156–40,107) | (54,375-103,084) | (436–827) | (25–483) | (342–648) | |
| ND_Alternative CRF (5) | 219,608 | 139,857 | 359,465 | 2,885 | 1684 | 2258 |
| (211,195–230,440) | (134,500–146,755) | (345,695–377,195) | (2775–3028) | (1619–1767) | (2172–2370) | |
| CD_Baseline (6) | 28,086 | 19,880 | 47,966 | 369 | 239 | 301 |
| (14,637–36,706) | (10,361–25982) | (24,998–62,688) | (192–482) | (125–313) | (157–394) | |
| CD_Low PM2.5 to PM10 ratio (7) | 20,639 | 14,609 | 35,248 | 271 | 176 | 221 |
| (10,520–27,4717) | (7,447–19,407) | (17,367–46,824) | (138–360) | (90–234) | (113–294) | |
| CD_High PM2.5 to PM10 ratio (8) | 41,235 | 29,188 | 70,423 | 542 | 351 | 442 |
| (22,376–52,394) | (15,839–37,087) | (38,215–89,481) | (294–688) | (191–446) | (240–562) | |
| CD_Alternative counterfactual value (9) | 23,688 | 16,768 | 40,456 | 311 | 202 | 254 |
| (12,184–31,257) | (8,624–22,125) | (20,808–53,382) | (160–411) | (104–266) | (131–335) | |
| CD_ Alternative CRF (10) | 64,608 | 45,732 | 110,340 | 849 | 551 | 693 |
| (58,899–68,061) | (41,691–48,176) | (100,590–116,237) | (774–849) | (502–580) | (632–730) | |


3.2. Discussion
3.2.1. Implication for Further Research
- Conduct a cohort study to assess the effects of long-term air pollution exposure on health outcomes (mortality and morbidity) and to derive representative concentration-response functions for Indian settings.
- Expand the number of measurement parameters of air pollution, like PM2.5, to provide more specific and reliable data for health risk assessments. Likewise, the number of measurement sites should be increased to also cover rural areas. This would allow a much more comprehensive risk assessment.
- Assess indoor air pollution as well and include measurements in the YLL estimations at state level.
3.2.2. Practical Implications
4. Conclusions
Acknowledgments
Author Contributions
Conflicts of Interest
References
- Global Burden of Disease Study 2010 (GBD 2010) Results by Risk Factor 1990–2010—Country Level. Available online: http://ghdx.healthdata.org/record/global-burden-disease-study-2010-gbd-2010-results-risk-factor-1990-2010-country-level (accessed on 21 July 2015).
- Ambient Air Pollution Database. Available online: http://www.who.int/phe/health_topics/outdoorair/databases/cities-2011/en/ (accessed on 22 July 2015).
- WHO, (World Health Organisation). Air Quality Guidelines Global Update 2005; WHO Regional Office for Europe: Copenhagen, Denmark, 2006. [Google Scholar]
- Brook, R.D.; Rajagopalan, S.; Pope, C.A., 3rd; Brook, J.R.; Bhatnagar, A.; Diez-Roux, A.V.; Holguin, F.; Hong, Y.; Luepker, R.V.; Mittleman, M.A.; et al. Particulate matter air pollution and cardiovascular disease: An update to the scientific statement from the american heart association. Circulation 2010, 121, 2331–2378. [Google Scholar] [PubMed]
- Samet, J.M.; Brauer, M.; Schlesinger, R. Particulate matter. In Air Quality Guidelines. Global Update 2005: Particulate Matter, Ozone, Nitrogen Dioxide and Sulfur Dioxide; World Health Organization, Ed.; WHO Regional Office for Europe: Copenhagen, Demark, 2006; pp. 217–306. [Google Scholar]
- Anderson, J.O.; Thundiyil, J.G.; Stolbach, A. Clearing the air: A review of the effects of particulate matter air pollution on human health. J. Med. Toxicol. 2012, 8, 166–175. [Google Scholar] [CrossRef] [PubMed]
- WHO. Health Effects of Particulate Matter. Policy implications for countries in Eastern Europe, Caucasus and Central Asia; WHO Regional Office for Europe: Copenhagen, Demark, 2013. [Google Scholar]
- National Ambient Air Quality Status & Trends in India—2010. Available online: http://www.cpcb.nic.in/upload/NewItems/NewItem_192_NAAQSTI.pdf (accessed on 21 July 2015).
- Guttikunda, S.K.; Goel, R.; Pant, P. Nature of air pollution, emission sources, and management in the Indian cities. Atmos. Environ. 2014, 95, 501–510. [Google Scholar] [CrossRef]
- The Gazette of India. Revised National Ambient Air Quality Standards (NAAQS) 2009, Part III—Section 4. Available online: http://www.cpcb.nic.in/upload/Latest/Latest_48_FINAL_AIR_STANDARD.pdf (accessed on 27 August 2015).
- Frequently Asked Questions: Ambient and Household Air Pollution and Health Update 2014. Available online: http://www.who.int/phe/health_topics/outdoorair/databases/faqs_air_pollution.pdf (accessed on 21 July 2015).
- Balakrishnan, K.; Dhaliwal, R.S.; Shah, B. Integrated urban-rural frameworks for air pollution and health-related research in India: The way forward. Environ. Health Perspect. 2011, 119, 12–13. [Google Scholar] [CrossRef] [PubMed]
- Yamamoto, S.S.; Phalkey, R.; Malik, A.A. A systematic review of air pollution as a risk factor for cardiovascular disease in South Asia: Limited evidence from India and Pakistan. Int. J. Hyg. Environ. Health 2014, 217, 133–144. [Google Scholar] [CrossRef] [PubMed]
- Census of India 2011, Primary Census Abstract, Data highlights Kerala, Series 33. Available online: http://www.censusindia.gov.in/2011census/PCA/PCA_Highlights/pca_highlights_file/kerala/Data_highlights.pdf (accessed on 21 July 2015).
- Murray, C.J.L.; Salomon, J.A.; Mathers, C.D. A critical examination of summary measures of population health. In Summary Measures of Population Health; Concepts, Ethics, measurements and Applications; Murray, C.J.L., Salomon, J.A., Mathers, C.D., Lopez, A.D., Eds.; World Health Organization: Geneva, Switzerland, 2002; pp. 13–40. [Google Scholar]
- Knol, A.B.; Petersen, A.C.; van der Sluijs, J.P.; Lebret, E. Dealing with uncertainties in environmental burden of disease assessment. Environ. Health 2009, 8, 1–13. [Google Scholar] [CrossRef] [PubMed]
- Prüss-Üstün, A.; Mathers, C.; Corvalán, C.; Woodward, A. Introduction and Methods: Assessing the Environmental Burden of Disease at National and Local Levels. Available online: http://www.who.int/quantifying_ehimpacts/publications/en/leadebd2.pdf (accessed on 21 July 2015).
- Summary Measures of Population Health: Concepts, Ethics, Measurement and Applications. Available online: http://www.jstor.org/stable/41110882?seq=1#page_scan_tab_contents (accessed on 21 July 2015).
- Martuzzi, M.; Mitis, F.; Iavarone, I.; Serinelli, M. Health Impact of PM10 and Ozone in 13 Italien Cities; WHO Regional Office for Europe: Copenhagen, Demark, 2006; p. 133. [Google Scholar]
- Ezzati, M.; Lopez, Alan D.; Rodgers, A.; Murray, C.J.L. Comparative Quantification of Health Risks: Global and Regional Burden of Disease Attributable to Selected Major Risk Factors. Available online: http://www.who.int/publications/cra/en/ (accessed on 21 July 2015).
- Health Statistics and Information Systems: National Tools. http://www.who.int/healthinfo/global_burden_disease/tools_national/en/ (accessed on 12 August 2015).
- SRS Based Abridged Life Tables 2003–07 to 2006–10. Available online: http://www.censusindia.gov.in/vital_statistics/SRS_Based/Cover_Page.pdf (accessed on 21 July 2015).
- Annual Report 2011–2012. Available online: http://cpcb.nic.in/upload/AnnualReports/AnnualReport_43_AR_2011-12_English.pdf (accessed on 21 July 2015).
- Hoek, G.; Krishnan, R.M.; Beelen, R.; Peters, A.; Ostro, B.; Brunekreef, B.; Kaufman, J.D. Long-term air pollution exposure and cardio-respiratory mortality: A review. Environ. Health 2013, 12, 1–16. [Google Scholar] [CrossRef] [PubMed]
- Zhang, L.W.; Chen, X.; Xue, X.D.; Sun, M.; Han, B.; Li, C.P.; Ma, J.; Yu, H.; Sun, Z.R.; Zhao, L.J.; et al. Long-term exposure to high particulate matter pollution and cardiovascular mortality: A 12-year cohort study in four cities in northern China. Environ. Int. 2014, 62, 41–47. [Google Scholar] [CrossRef] [PubMed]
- Report on Medical Certification of Cause of Death 2010. Available online: http://www.censusindia.gov.in/2011-Documents/mccd_Report1/MCCD-Report-2010.pdf (accessed on 21 July 2015).
- Vital Statistics of India Based On the Civil Registration System 2011. Available online: http://www.censusindia.gov.in/2011-Documents/CRS_Report/CRS%20Report_2011.pdf (accessed on 21 July 2015).
- Satsangi, P.G.; Kulshrestha, A.; Taneja, A.; Rao, P.S.P. Measurements of PM10 and PM2.5 in aerosols in Agra, a semi-arid region of India. IJ RSP 2011, 40, 203–210. [Google Scholar]
- Burnett, R.T.; Pope, C.A., 3rd; Ezzati, M.; Olives, C.; Lim, S.S.; Mehta, S.; Shin, H.H.; Singh, G.; Hubbell, B.; Brauer, M.; et al. An integrated risk function for estimating the global burden of disease attributable to ambient fine particulate matter exposure. Environ. Health Perspect. 2014, 122, 397–403. [Google Scholar] [PubMed]
- Krewski, D.; Jerrett, M.; Burnett, R.T.; Ma, R.; Hughes, E.; Shi, Y.; Turner, M.C.; Pope, C.A., 3rd; Thurston, G.; Calle, E.E.; et al. Extended Follow-Up and Spatial Analysis of the American Cancer Society Study Linking Particulate Air Pollution and Mortality. Available online: http://scientificintegrityinstitute.net/Krewski052108.pdf (accessed on 21 July 2015).
- Lim, S.S.; Vos, T.; Flaxman, A.D.; Danaei, G.; Shibuya, K.; Adair-Rohani, H.; Amann, M.; Anderson, H.R.; Andrews, K.G.; Aryee, M.; et al. A comparative risk assessment of burden of disease and injury attributable to 67 risk factors and risk factor clusters in 21 regions, 1990–2010: A systematic analysis for the global burden of disease study 2010. Lancet 2012, 380, 2224–2260. [Google Scholar] [CrossRef]
- The Registrar General & Census Commissioner. Population enumeration data (final population). Single year age data - c13 table (india/states/uts) Ministry of Home Affairs, Government of India.: New Delhi, 2010–11. Available online: http://www.censusindia.gov.in/2011census/population_enumeration.html (accessed on 27 August 2015).
- WHO, World Health Organisation. Public health and environment (PHE): Ambient air pollution. Exposure to Particulate Matter Less Than 10 µm in Diamter in Urban Areas, 2008–2013. Available online: http://gamapserver.who.int/gho/interactive_charts/phe/oap_exposure/atlas.html (accessed on 22 January 2015).
- Balakrishnan, K.; Cohen, A.; Smith, K.R. Addressing the burden of disease attributable to air pollution in india: The need to integrate across household and ambient air pollution exposures. Environ. Health Perspect. 2014, 122, 6–7. [Google Scholar] [CrossRef] [PubMed]
- Brauer, M.; Amann, M.; Burnett, R.T.; Cohen, A.; Dentener, F.; Ezzati, M.; Henderson, S.B.; Krzyzanowski, M.; Martin, R.V.; Van Dingenen, R.; et al. Exposure assessment for estimation of the global burden of disease attributable to outdoor air pollution. Environ. Sci. Technol. 2012, 46, 652–660. [Google Scholar] [CrossRef] [PubMed]
- WHO, (World Health Organisation). Public Health and Environment: Ambient Air Pollution. Burden of Disease, Deaths. Available online: http://apps.who.int/gho/data/node.main.156?lang=en (accessed on 21 July 2015).
- WHO, (World Health Organisation). Health Effects and Risks of Transport Systems: The Hearts Project; WHO Regional office for Europe: Copenhagen, Denmark, 2006. [Google Scholar]
- Environmental health inequalities in Europe. Assessment Report. Available online: http://www.euro.who.int/en/publications/abstracts/environmental-health-inequalities-in-europe.-assessment-report (accessed on 21 July 2015).
- Nema, P.; Goyal, S.K. Estimation of health impacts due to PM10 in major Indian cities. In Air Pollution: Health and Environmental Impacts; Gurjar, B.R., Molina, L.T., Ojha, C.S.P., Eds.; CRC Press: Boca Raton, FL, USA, 2010; pp. 297–310. [Google Scholar]
- WHO European Centre for Environment and Health. Review of Evidence on Health Aspects of Air Pollution—Revihaap Project Technical Report; WHO Regional office for Europe: Copenhagen, Denmark, 2013; p. 302. [Google Scholar]
- Public Health and Air Pollution in Asia (PAPA). Coordinated Studies of Short-Term Exposure to Air Pollution and Daily Mortality in Two Indian Cities. Available online: http://pubs.healtheffects.org/view.php?id=357 (accessed on 21 July 2015).
- Outdoor Air Pollution and Health in the Developing Countries of Asia: A comprehensive review. Available online: http://pubs.healtheffects.org/getfile.php?u=602 (accessed on 21 July 2015).
- Pope, C.A., 3rd; Cropper, M.; Coggins, J.; Cohen, A. Health benefits of air pollution abatement policy: Role of the shape of the concentration-response function. J. Air Waste Manag. Assoc. 2015, 65, 516–522. [Google Scholar]
- Ray, M.R.; Lahiri, T. Health effects of urban air pollution in india. In Air Pollution: Health and Environmental Impacts; Gurjar, B.R., Molina, L.T., Ojha, C.S.P., Eds.; CRC Press: Boca Raton, FL, USA, 2010; pp. 165–202. [Google Scholar]
- Guttikunda, S.K.; Jawahar, P. Road Transport in India 2010–30: Emissions, Pollution, and Health Impacts. Available online: http://urbanemissions.info/india-road-transport (accessed on 21 July 2015).
© 2015 by the authors; licensee MDPI, Basel, Switzerland. This article is an open access article distributed under the terms and conditions of the Creative Commons Attribution license (http://creativecommons.org/licenses/by/4.0/).
Share and Cite
Tobollik, M.; Razum, O.; Wintermeyer, D.; Plass, D. Burden of Outdoor Air Pollution in Kerala, India—A First Health Risk Assessment at State Level. Int. J. Environ. Res. Public Health 2015, 12, 10602-10619. https://doi.org/10.3390/ijerph120910602
Tobollik M, Razum O, Wintermeyer D, Plass D. Burden of Outdoor Air Pollution in Kerala, India—A First Health Risk Assessment at State Level. International Journal of Environmental Research and Public Health. 2015; 12(9):10602-10619. https://doi.org/10.3390/ijerph120910602
Chicago/Turabian StyleTobollik, Myriam, Oliver Razum, Dirk Wintermeyer, and Dietrich Plass. 2015. "Burden of Outdoor Air Pollution in Kerala, India—A First Health Risk Assessment at State Level" International Journal of Environmental Research and Public Health 12, no. 9: 10602-10619. https://doi.org/10.3390/ijerph120910602
APA StyleTobollik, M., Razum, O., Wintermeyer, D., & Plass, D. (2015). Burden of Outdoor Air Pollution in Kerala, India—A First Health Risk Assessment at State Level. International Journal of Environmental Research and Public Health, 12(9), 10602-10619. https://doi.org/10.3390/ijerph120910602