
Ecological Risk of Heavy Metals and a Metalloid in Agricultural Soils in Tarkwa, Ghana


Abstract
:1. Introduction
2. Materials and Methods
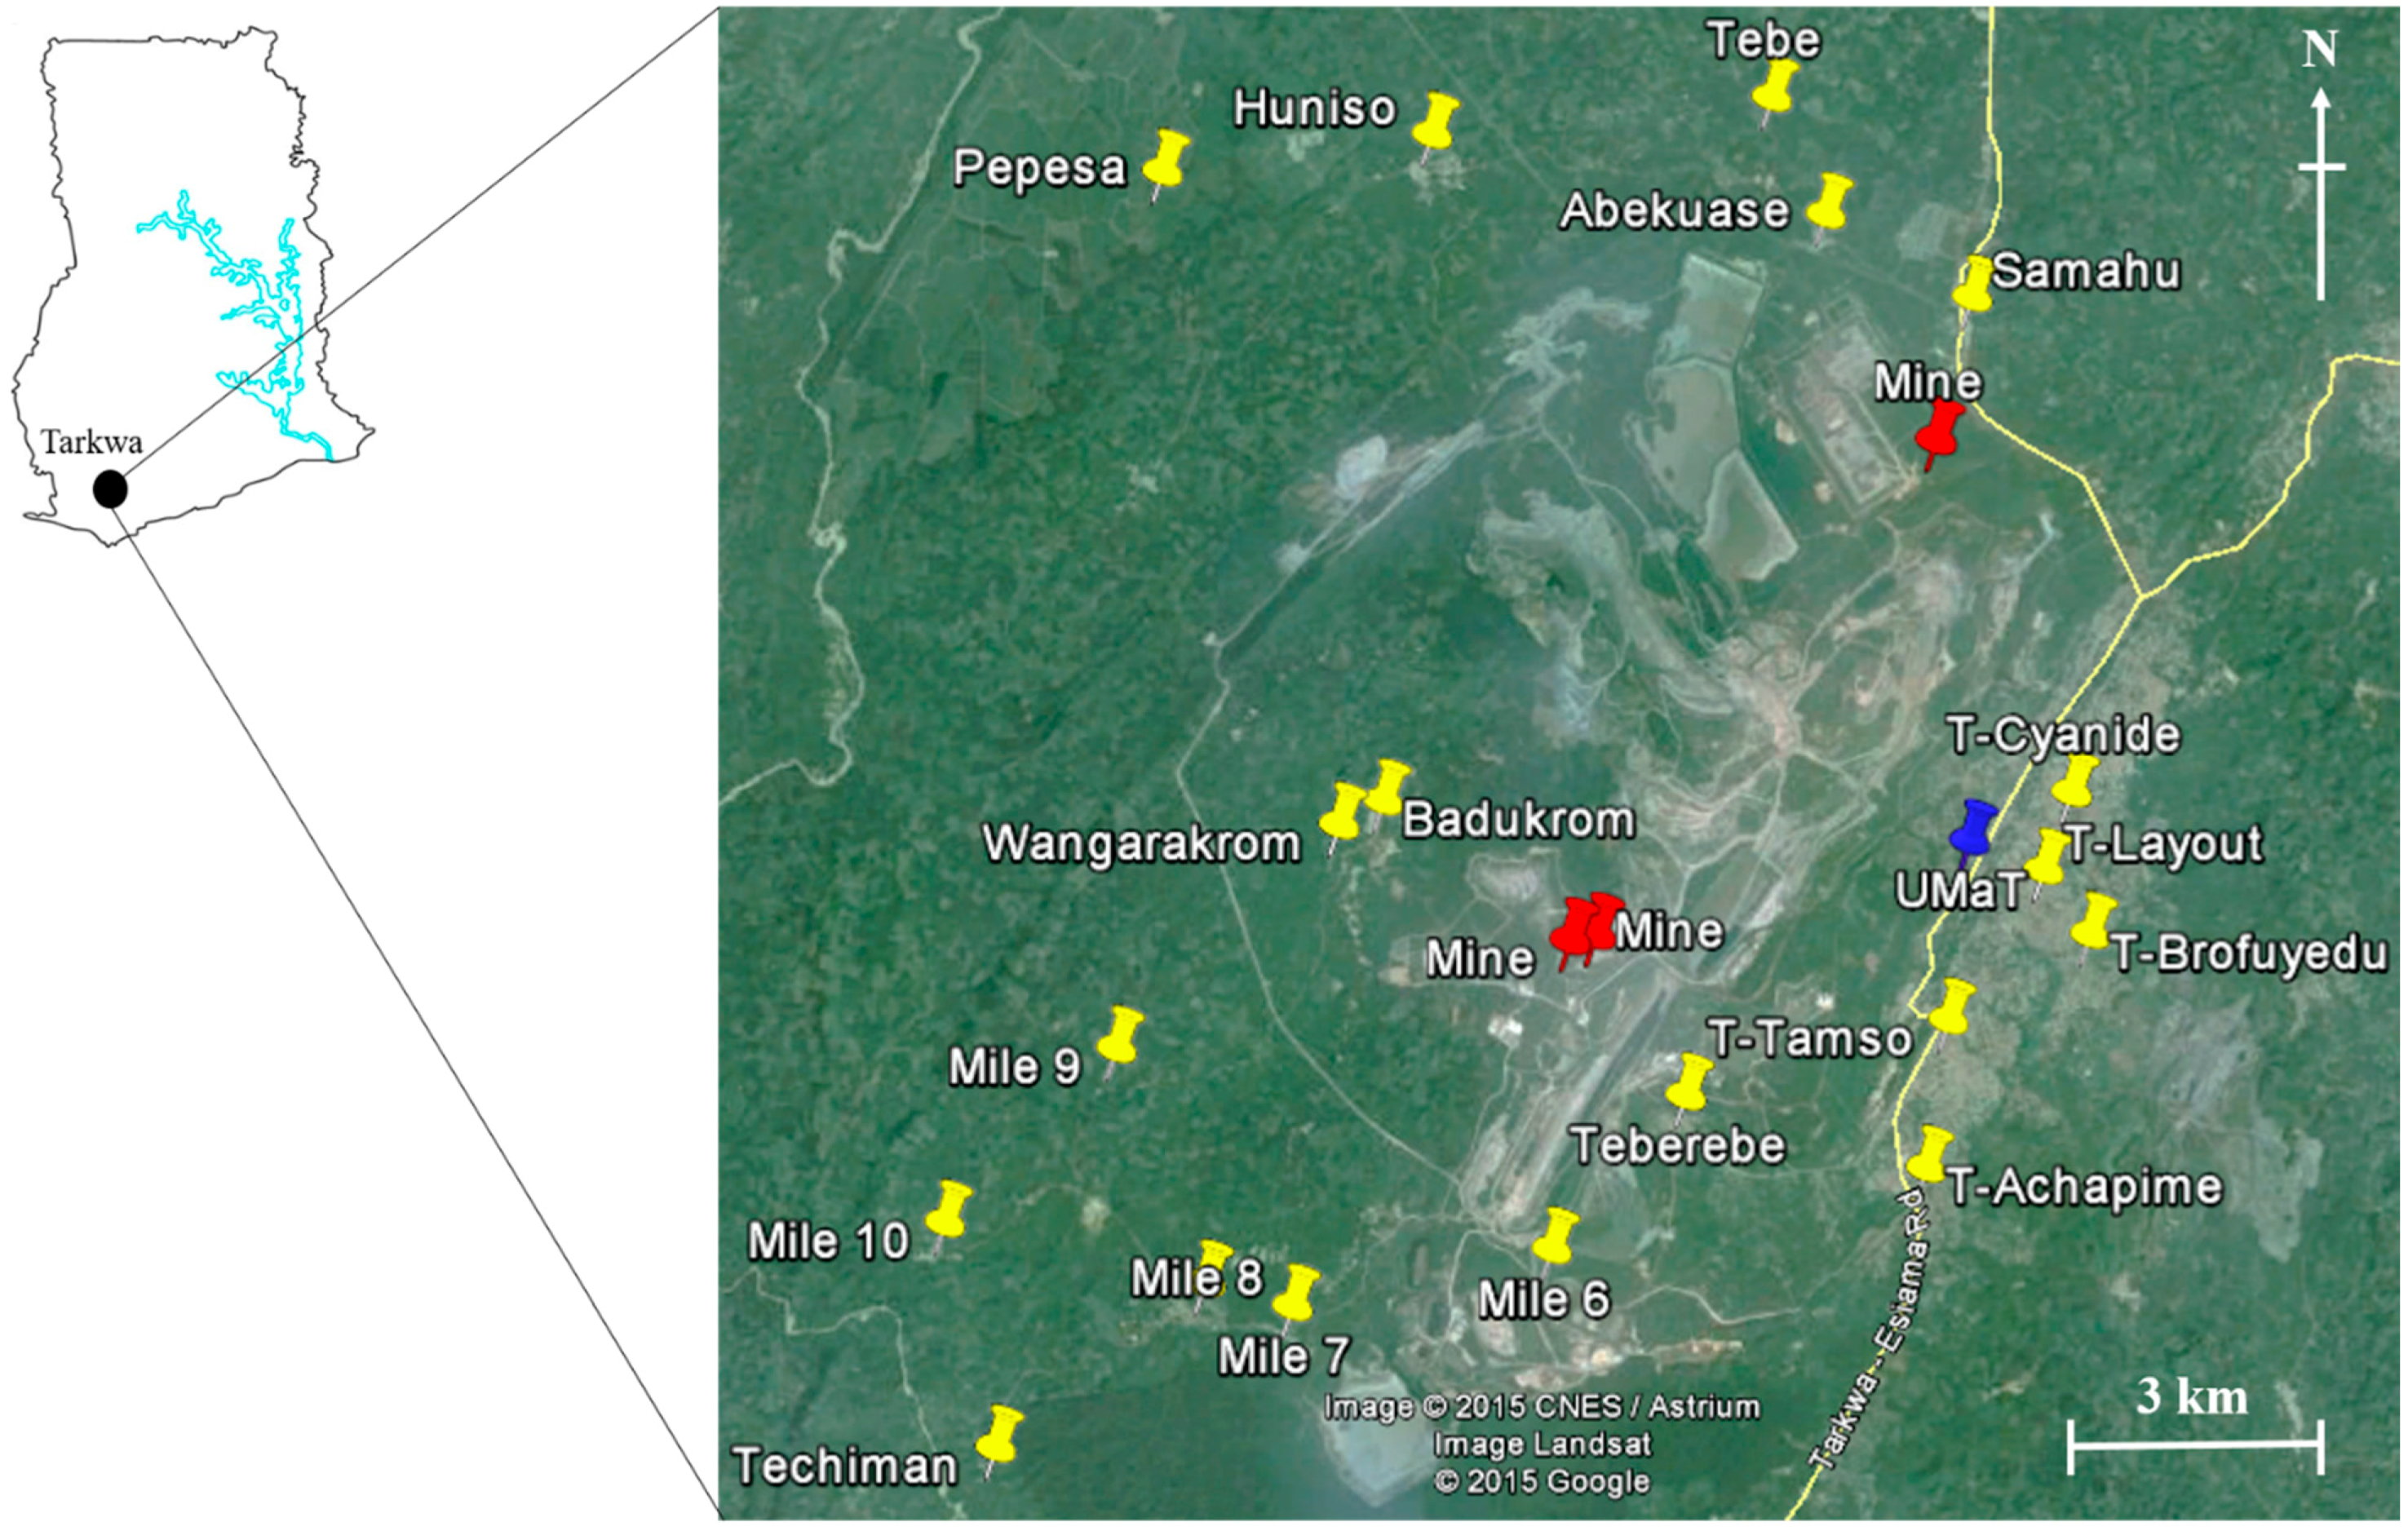
2.1. Study Area
2.2. Sample Collection and Analysis

2.3. Quality Control and Quality Assurance
2.4. Statistical Analysis
3. Results and Discussion
3.1. Concentrations of Heavy Metals and a Metalloid in Soils

| Sample Sites | n | WC | SOM | Soil pH | As | Cd | Co | Cr | Cu | Hg | Ni | Pb | Zn | |
|---|---|---|---|---|---|---|---|---|---|---|---|---|---|---|
| Teberebe | 8 | Mean | 1.1 | 2.5 | 7.6 | 2.6 | 0.038 | 3.0 | 35 | 8.9 | 0.072 | 4.5 | 6.1 | 39 |
| SD | 0.48 | 1.5 | 0.11 | 1.2 | 0.017 | 2.4 | 20 | 6.5 | 0.044 | 2.9 | 1.7 | 17 | ||
| Mile 6 | 7 | Mean | 0.94 | 2.2 | 7.5 | 2.2 | 0.020 | 2.1 | 30 | 9.3 | 0.018 | 2.6 | 3.2 | 12 |
| SD | 0.65 | 1.9 | 1.1 | 1.2 | 0.010 | 1.1 | 16 | 6.8 | 0.018 | 1.2 | 1.7 | 11 | ||
| Mile 7 | 8 | Mean | 0.91 | 1.8 | 7.3 | 1.0 | 0.011 | 0.67 | 13 | 2.8 | 0.030 | 1.1 | 1.5 | 9.7 |
| SD | 0.31 | 1.1 | 1.1 | 0.51 | 0.010 | 0.45 | 17 | 1.4 | 0.011 | 0.64 | 0.81 | 3.3 | ||
| Mile 8 | 7 | Mean | 0.88 | 1.8 | 7.1 | 1.3 | 0.022 | 0.74 | 9.9 | 2.8 | 0.19 | 1.5 | 2.3 | 23 |
| SD | 0.53 | 0.72 | 1.0 | 0.72 | 0.011 | 0.68 | 4.2 | 1.6 | 0.26 | 0.91 | 0.75 | 13 | ||
| Techiman | 8 | Mean | 0.66 | 1.8 | 6.2 | 1.0 | 0.020 | 1.6 | 11 | 5.5 | 0.17 | 3.1 | 2.7 | 32 |
| SD | 0.78 | 1.0 | 1.2 | 0.44 | 0.021 | 1.7 | 5.0 | 4.0 | 0.14 | 3.0 | 1.6 | 45 | ||
| Mile 9 | 8 | Mean | 0.50 | 2.1 | 5.8 | 1.8 | 0.011 | 0.80 | 15 | 2.5 | 0.033 | 1.6 | 2.0 | 11 |
| SD | 0.19 | 2.0 | 0.31 | 1.5 | 0.010 | 0.64 | 15 | 1.9 | 0.025 | 1.1 | 1.0 | 7.8 | ||
| Mile 10 | 8 | Mean | 0.44 | 1.3 | 7.1 | 0.96 | 0.020 | 0.72 | 27 | 2.2 | 0.13 | 1.0 | 2.1 | 29 |
| SD | 0.19 | 0.34 | 0.051 | 0.43 | 0.016 | 0.53 | 34 | 1.0 | 0.090 | 0.21 | 0.23 | 25 | ||
| Wangarakrom | 8 | Mean | 0.66 | 2.8 | 6.9 | 5.4 | 0.021 | 1.4 | 15 | 3.7 | 1.9 | 3.2 | 2.5 | 19 |
| SD | 0.33 | 1.0 | 0.021 | 6.3 | 0.018 | 1.6 | 5.6 | 2.2 | 1.1 | 3.0 | 0.90 | 11 | ||
| Badukrom | 8 | Mean | 2.5 | 2.0 | 6.9 | 12 | 0.013 | 0.37 | 9.6 | 5.9 | 2.4 | 1.3 | 2.4 | 27 |
| SD | 3.7 | 1.2 | 0.030 | 10 | 0.010 | 0.12 | 4.9 | 8.2 | 1.7 | 0.57 | 0.98 | 30 | ||
| Samahu | 7 | Mean | 2.1 | 2.4 | 7.1 | 4.5 | 0.030 | 1.2 | 38 | 5.8 | 0.11 | 2.4 | 8.3 | 36 |
| SD | 2.3 | 1.7 | 0.049 | 4.3 | 0.026 | 0.84 | 39 | 5.0 | 0.12 | 1.8 | 11 | 29 | ||
| Abekuase | 9 | Mean | 2.1 | 2.5 | 7.0 | 3.2 | 0.024 | 1.2 | 9.2 | 3.8 | 0.050 | 1.8 | 3.8 | 38 |
| SD | 1.1 | 1.1 | 0.084 | 1.0 | 0.023 | 1.2 | 4.8 | 4.2 | 0.021 | 1.2 | 2.7 | 47 | ||
| Tebe | 9 | Mean | 1.9 | 2.9 | 6.9 | 2.8 | 0.011 | 1.8 | 12 | 5.6 | 0.051 | 2.1 | 4.1 | 18 |
| SD | 1.2 | 1.7 | 0.074 | 1.4 | 0.010 | 3.2 | 9.3 | 5.5 | 0.035 | 1.9 | 2.0 | 18 | ||
| Huniso | 7 | Mean | 0.99 | 1.5 | 7.2 | 1.5 | 0.052 | 0.76 | 8.0 | 4.1 | 0.13 | 1.3 | 13 | 86 |
| SD | 0.85 | 0.84 | 0.11 | 0.79 | 0.034 | 0.32 | 3.7 | 2.8 | 0.12 | 0.53 | 15 | 69 | ||
| Pepesa | 10 | Mean | 1.9 | 1.9 | 7.3 | 4.9 | 0.042 | 0.89 | 12 | 6.9 | 0.20 | 1.9 | 5.5 | 78 |
| SD | 0.79 | 0.81 | 0.10 | 8.1 | 0.034 | 0.69 | 4.2 | 7.6 | 0.24 | 1.2 | 3.3 | 73 | ||
| T-Cyanide | 7 | Mean | 1.2 | 2.4 | 7.5 | 2.7 | 0.081 | 1.4 | 23 | 8.6 | 0.18 | 3.2 | 16 | 49 |
| SD | 0.75 | 0.24 | 0.087 | 1.2 | 0.014 | 0.81 | 16 | 5.0 | 0.036 | 1.3 | 4.6 | 21 | ||
| T–Layout | 6 | Mean | 1.4 | 1.1 | 7.4 | 2.7 | 0.11 | 1.4 | 16 | 7.1 | 0.11 | 3.0 | 27 | 78 |
| SD | 1.1 | 0.78 | 0.062 | 1.4 | 0.14 | 0.70 | 10 | 7.4 | 0.10 | 1.7 | 37 | 108 | ||
| T–Brofuyedu | 5 | Mean | 0.95 | 1.9 | 7.3 | 8.6 | 0.058 | 1.3 | 18 | 7.7 | 0.061 | 2.9 | 6.0 | 32 |
| SD | 0.03 | 1.8 | 0.021 | 10 | 0.027 | 1.4 | 14 | 7.2 | 0.034 | 2.7 | 2.2 | 11 | ||
| T–Achapime | 6 | Mean | 1.5 | 1.9 | 7.2 | 1.4 | 0.046 | 0.66 | 12 | 4.9 | 0.73 | 1.9 | 6.4 | 45 |
| SD | 0.94 | 0.37 | 0.056 | 0.13 | 0.0012 | 0.04 | 0.01 | 0.63 | 0.59 | 0.17 | 0.68 | 1.8 | ||
| T–Tamso | 6 | Mean | 1.2 | 3.2 | 7.5 | 27 | 0.43 | 9.2 | 77 | 16 | 0.42 | 28 | 14 | 118 |
| SD | 0.42 | 1.3 | 0.23 | 13 | 0.20 | 4.4 | 46 | 9.2 | 0.014 | 14 | 3.8 | 85 | ||
| Minimum | 0.44 | 1.1 | 5.8 | 0.96 | 0.010 | 0.37 | 8.0 | 2.2 | 0.018 | 1.0 | 1.5 | 9.7 | ||
| Maximum | 2.5 | 3.7 | 7.6 | 27 | 0.43 | 9.2 | 77 | 16 | 2.4 | 28 | 27 | 118 | ||
| Median | 1.1 | 2.2 | 7.3 | 2.7 | 0.024 | 1.3 | 15 | 5.8 | 0.11 | 2.5 | 5.5 | 32 | ||
| Average | 1.3 | 2.4 | 7.2 | 4.4 | 0.052 | 1.8 | 21 | 6.2 | 0.32 | 3.7 | 7.2 | 39 | ||
| SD | 0.61 | 0.69 | 0.42 | 5.1 | 0.067 | 1.8 | 15 | 3.1 | 0.36 | 5.5 | 6.2 | 27 | ||
| CV | 47 | 29 | 5.8 | 116 | 111 | 101 | 73 | 50 | 113 | 147 | 85 | 70 | ||
| Tarkwa ( n = 142) | 0.0–11 | 0.0–10 | 4.3–8.8 | 0.3–37 | nd–0.58 | 0.11–14 | 2.0–199 | 0.5–44 | nd–6.7 | 0.3–38 | 0.4–78 | 1.1–232 | ||
| Skewness | 3.4 | 1.3 | –1.6 | 4.1 | 5.6 | 2.4 | 4.00 | 2.3 | 8.0 | 4.1 | 4.3 | 2.6 | ||
| Kurtosis | 16 | 2.4 | 6.8 | 19 | 37 | 6.8 | 19 | 9.3 | 67 | 21 | 21 | 7.8 | ||
| K–S/Shapiro–Wilk p | ˂0.0001 | ˂0.0001 | ˂0.0001 | ˂0.0001 | ˂0.0001 | ˂0.0001 | ˂0.0001 | ˂0.0001 | ˂0.0001 | ˂0.0001 | ˂0.0001 | ˂0.0001 | ||
| Reference values # | 1.2 | 6.8 | 7.3 | 5.8 | 0.39 | 3.6 | 33.18 | 21 | 0.24 | 6.7 | 52 | 72 | ||
| USEPA b | 18–46 | 0.36–140 | 13–230 | – | 49–80 | 0.5-5 * | 38–280 | 56–120 | 79–160 | |||||
| World range c | 1.0–15 | 0.07–1.1 | 0.1–20 | 5–120 | 6.0–60 | 1–200 | 10.0–70 | 17–125 |
3.2. Correlation between Heavy Metals and Soil Properties
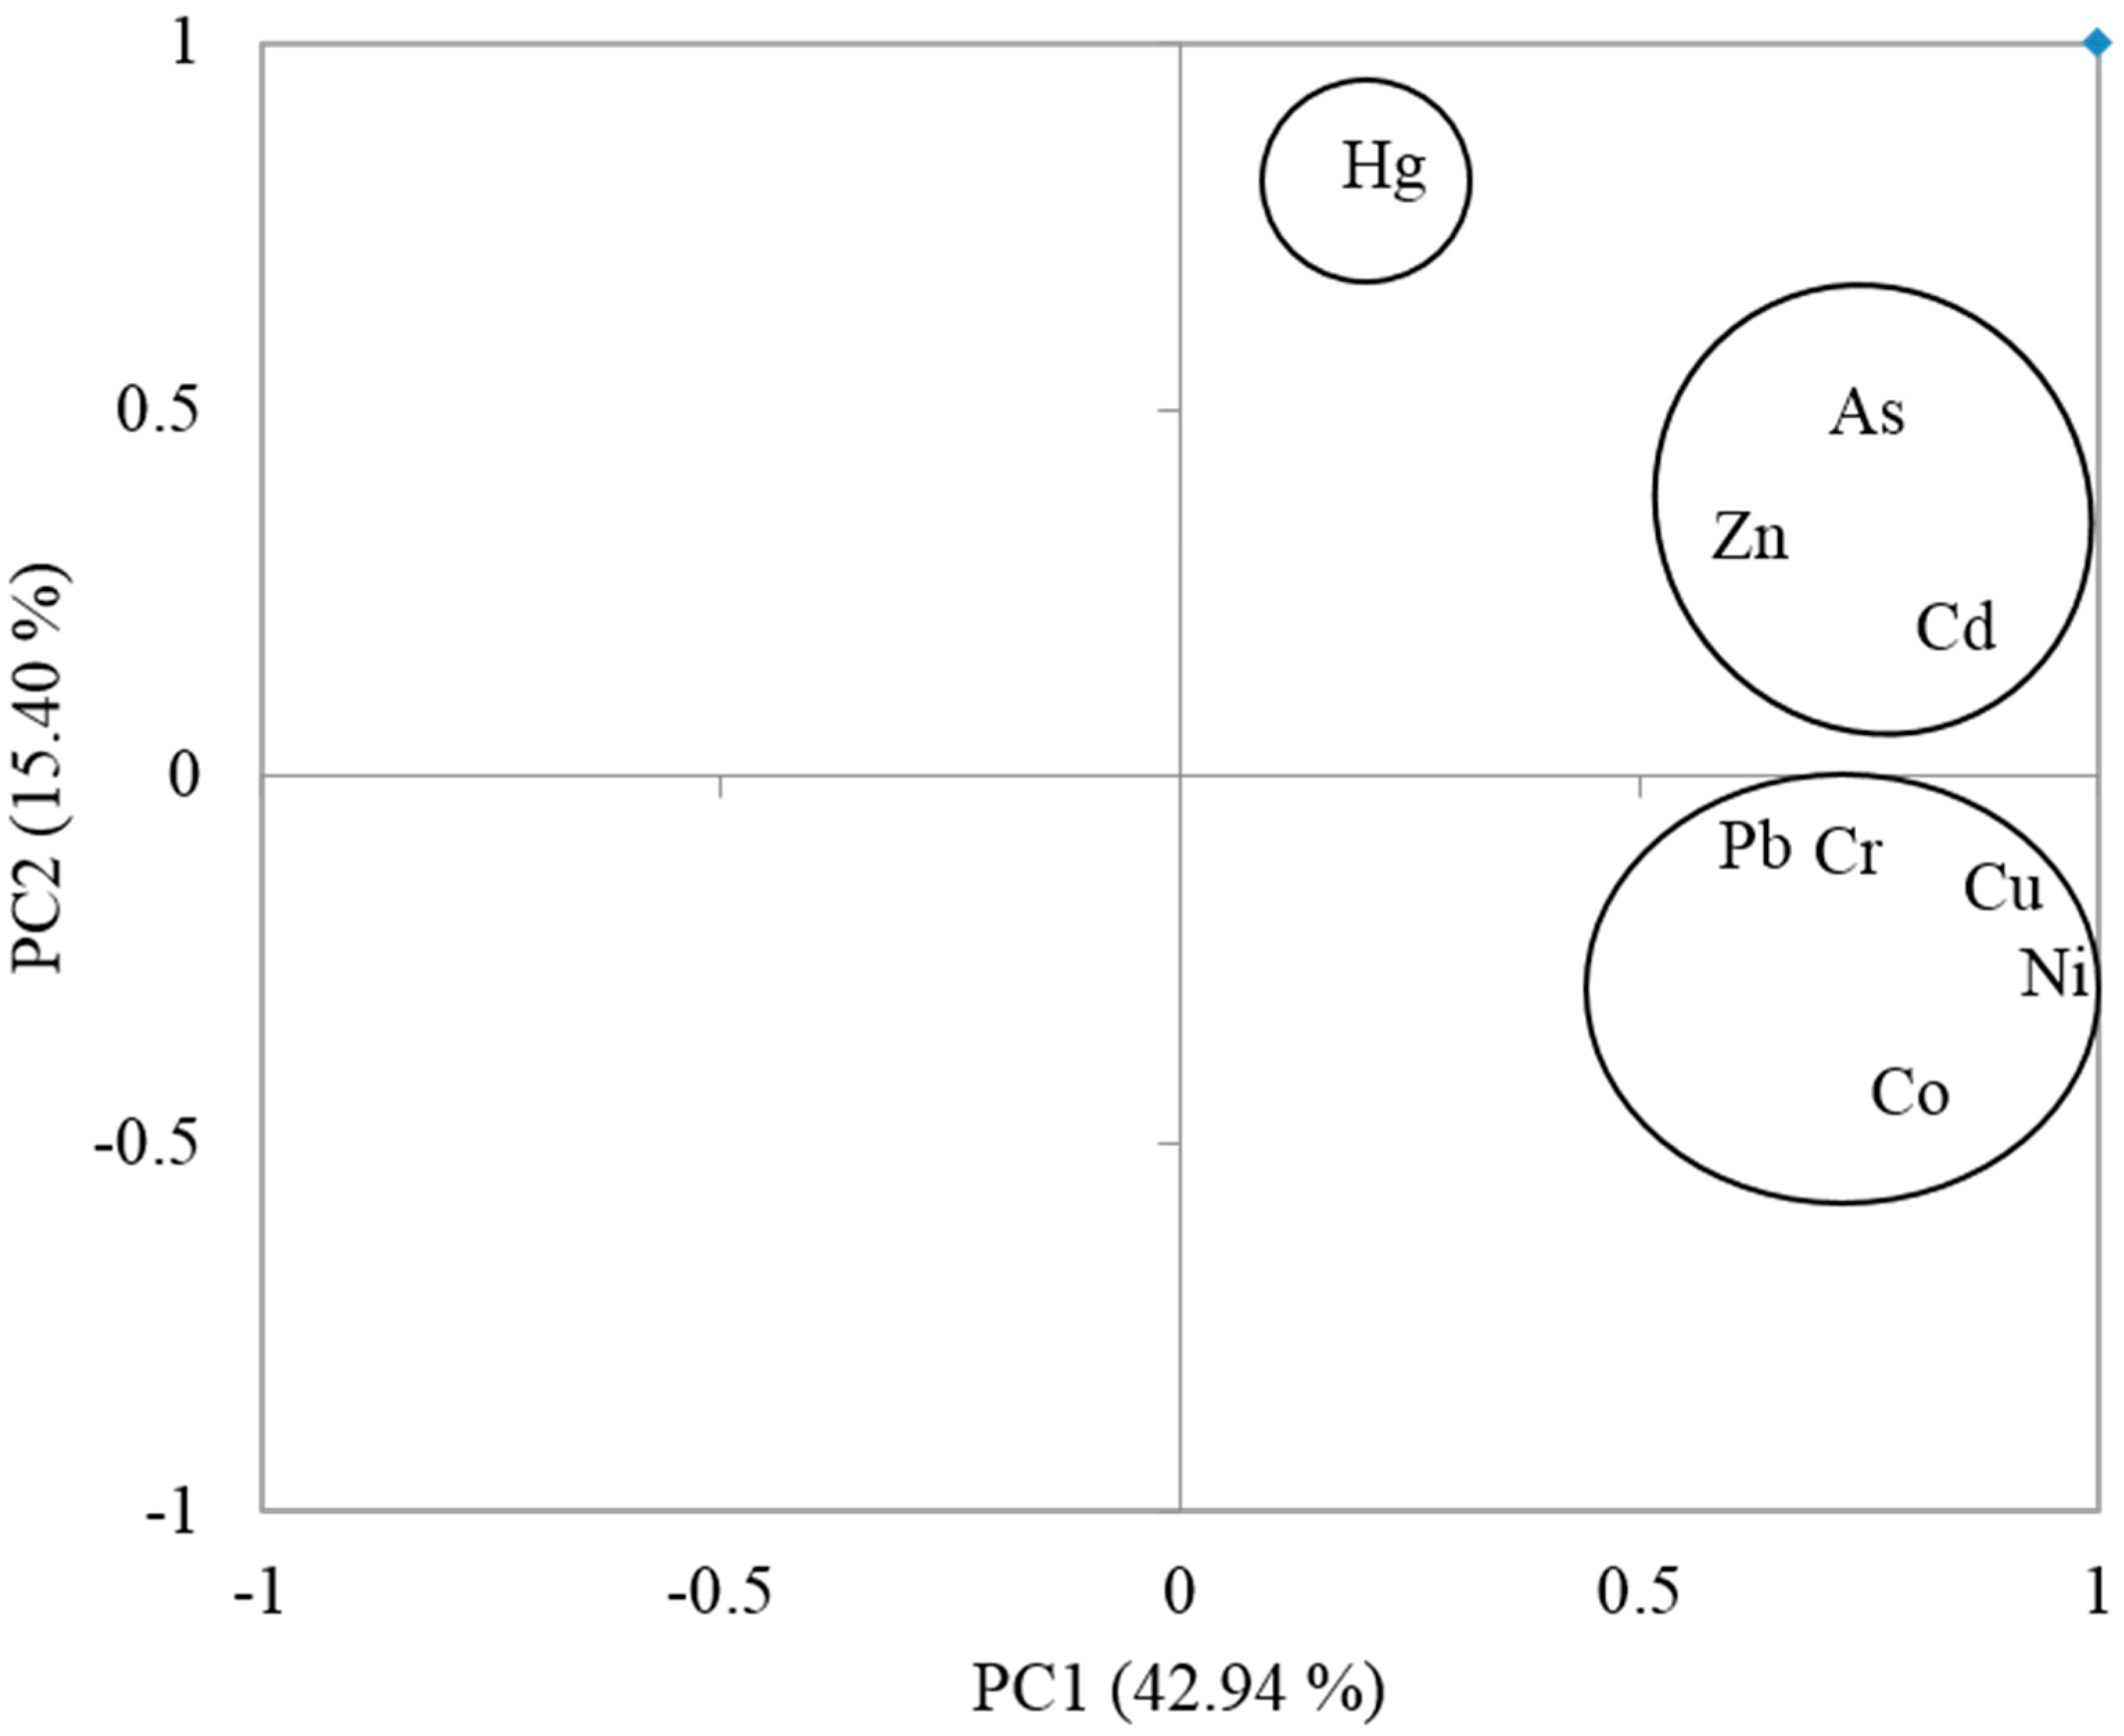
3.3. Sources of Metals in Soil Identified by PCA
| Metals/Soil Properties | WC% | SOM% | Soil pH | As | Cd | Co | Cr | Cu | Hg | Ni | Pb | Zn |
|---|---|---|---|---|---|---|---|---|---|---|---|---|
| WC% | 1 | |||||||||||
| SOM% | 0.33 | 1 | ||||||||||
| soil pH | 0.04 | −0.06 | 1 | |||||||||
| As | 0.03 | 0.27 ** | −0.01 | 1 | ||||||||
| Cd | −0.02 | 0.18 * | 0.09 | 0.48 *** | 1 | |||||||
| Co | 0.06 | 0.40 *** | 0.11 | 0.27 ** | 0.35 *** | 1 | ||||||
| Cr | 0.08 | 0.51 *** | 0.03 | 0.54 *** | 0.27 *** | 0.31 *** | 1 | |||||
| Cu | 0.02 | 0.47 *** | 0.11 | 0.37 *** | 0.41 *** | 0.59 *** | 0.50 *** | 1 | ||||
| Hg | −0.07 | −0.05 | −0.06 | 0.45 *** | 0.06 | −0.09 | −0.03 | 0.08 | 1 | |||
| Ni | 0.01 | 0.49 *** | 0.06 | 0.50 *** | 0.56 *** | 0.76 *** | 0.57 *** | 0.68 *** | −0.03 | 1 | ||
| Pb | 0.04 | 0.34 *** | 0.05 | 0.09 | 0.44 *** | 0.28 ** | 0.16 * | 0.37 *** | −0.02 | 0.36 *** | 1 | |
| Zn | −0.00 | 0.07 | 0.03 | 0.23 * | 0.62 *** | 0.13 | 0.10 | 0.34 *** | 0.12 | 0.25 *** | 0.39 *** | 1 |

3.4. Assessment of Potential Ecological Risk
| Ei r | Ecological Risk Level of Single Factor Pollution | RI Value | General Level of Potential Ecological Risk |
|---|---|---|---|
| Ei r ˂ 40 | Low risk | RI ≤ 50 | Low risk |
| 40 ≤ Ei r ˂ 80 | Moderate risk | 50 ˂ RI ≤100 | Moderate risk |
| 80 ≤ Ei r ˂ 160 | Considerable risk | 100 ˂ RI ≤ 200 | Considerable risk |
| Ei r ˂ 320 | High risk | RI ˃ 200 | High risk |
| Ei r ≥ 320 | Very high risk |
| Sample Sites | As | Cd | Cr | Cu | Hg | Ni | Pb | Zn | Cdeg |
|---|---|---|---|---|---|---|---|---|---|
| Teberebe | 0.46 | 0.10 | 1.0 | 0.42 | 0.30 | 0.67 | 0.12 | 0.54 | 3.6 |
| Mile 6 | 0.39 | 0.044 | 0.91 | 0.44 | 0.08 | 0.40 | 0.063 | 0.18 | 2.5 |
| Mile 7 | 0.18 | 0.030 | 0.42 | 0.13 | 0.11 | 0.16 | 0.030 | 0.13 | 1.2 |
| Mile 8 | 0.22 | 0.060 | 0.30 | 0.13 | 0.78 | 0.23 | 0.044 | 0.33 | 2.0 |
| Techiman | 0.18 | 0.052 | 0.34 | 0.26 | 0.70 | 0.46 | 0.053 | 0.45 | 2.4 |
| Mile 9 | 0.32 | 0.030 | 0.46 | 0.12 | 0.14 | 0.24 | 0.040 | 0.16 | 1.5 |
| Mile 10 | 0.16 | 0.051 | 0.84 | 0.11 | 0.55 | 0.15 | 0.041 | 0.40 | 2.3 |
| Wangarakrom | 0.93 | 0.055 | 0.47 | 0.17 | 8.1 | 0.48 | 0.051 | 0.26 | 11 |
| Badukrom | 2.2 | 0.041 | 0.29 | 0.28 | 10 | 0.20 | 0.050 | 0.38 | 13 |
| Samahu | 0.79 | 0.064 | 1.1 | 0.28 | 0.44 | 0.36 | 0.16 | 0.50 | 3.7 |
| Abekuase | 0.55 | 0.062 | 0.28 | 0.18 | 0.19 | 0.27 | 0.074 | 0.53 | 2.1 |
| Tebe | 0.49 | 0.026 | 0.38 | 0.27 | 0.19 | 0.32 | 0.080 | 0.25 | 2.0 |
| Huniso | 0.26 | 0.13 | 0.24 | 0.20 | 0.56 | 0.20 | 0.26 | 1.2 | 3.0 |
| Pepesa | 0.84 | 0.11 | 0.37 | 0.33 | 0.84 | 0.28 | 0.11 | 1.0 | 3.9 |
| T–Cyanide | 0.47 | 0.21 | 0.72 | 0.41 | 0.73 | 0.47 | 0.31 | 0.69 | 4.0 |
| T–Layout | 0.47 | 0.28 | 0.49 | 0.34 | 0.48 | 0.46 | 0.53 | 1.08 | 4.1 |
| T–Brofuyedu | 1.4 | 0.15 | 0.56 | 0.36 | 0.25 | 0.43 | 0.12 | 0.45 | 3.8 |
| T–Achapime | 0.25 | 0.12 | 0.36 | 0.23 | 3.0 | 0.28 | 0.12 | 0.62 | 5.0 |
| T–Tamso | 4.6 | 1.1 | 2.3 | 0.80 | 1.7 | 4.2 | 0.27 | 1.6 | 17 |
| Minimum | 0.16 | 0.026 | 0.24 | 0.11 | 0.080 | 0.15 | 0.030 | 0.13 | 1.2 |
| Maximum | 4.6 | 1.1 | 2.3 | 0.80 | 10 | 4.2 | 0.53 | 1.6 | 17 |
| Average | 0.79 | 0.14 | 0.63 | 0.29 | 1.4 | 0.53 | 0.14 | 0.57 | 4.5 |
| Sample Sites | As | Cd | Cr | Cu | Hg | Ni | Pb | Zn | RI |
|---|---|---|---|---|---|---|---|---|---|
| Teberebe | 4.5 | 2.9 | 2.1 | 2.1 | 11 | 3.3 | 0.59 | 0.54 | 28 |
| Mile 6 | 3.8 | 1.3 | 1.8 | 2.2 | 3.1 | 1.9 | 0.31 | 0.18 | 14 |
| Mile 7 | 1.8 | 0.90 | 0.84 | 0.67 | 4.5 | 0.81 | 0.15 | 0.13 | 9.9 |
| Mile 8 | 2.2 | 1.6 | 0.60 | 0.67 | 31 | 1.1 | 0.22 | 0.33 | 37 |
| Techiman | 1.7 | 1.5 | 0.68 | 1.3 | 28 | 2.3 | 0.27 | 0.45 | 36 |
| Mile 9 | 3.2 | 0.89 | 0.92 | 0.59 | 5.5 | 1.2 | 0.20 | 0.16 | 12 |
| Mile 10 | 1.6 | 1.5 | 1.6 | 0.53 | 21 | 0.75 | 0.21 | 0.40 | 28 |
| Wangarakrom | 9.3 | 1.6 | 0.94 | 0.87 | 324 | 2.4 | 0.25 | 0.26 | 339 |
| Badukrom | 22 | 1.0 | 0.58 | 1.4 | 400 | 1.0 | 0.24 | 0.38 | 427 |
| Samahu | 7.8 | 1.9 | 2.3 | 1.3 | 17 | 1.8 | 0.80 | 0.50 | 34 |
| Abekuase | 5.4 | 1.8 | 0.56 | 0.92 | 7.5 | 1.3 | 0.37 | 0.53 | 18 |
| Tebe | 4.9 | 0.79 | 0.77 | 1.3 | 7.6 | 1.6 | 0.39 | 0.25 | 17 |
| Huniso | 2.5 | 3.9 | 0.49 | 0.99 | 22 | 0.98 | 1.3 | 1.2 | 33 |
| Pepesa | 8.4 | 3.1 | 0.73 | 1.6 | 33 | 1.4 | 0.53 | 1.0 | 51 |
| T–Cyanide | 4.7 | 6.1 | 1.4 | 2.0 | 29 | 2.3 | 1.5 | 0.69 | 48 |
| T–Layout | 4.7 | 8.3 | 0.98 | 1.7 | 19 | 2.2 | 2.6 | 1.0 | 40 |
| T–Brofuyedu | 14 | 4.4 | 1.1 | 1.8 | 10 | 2.1 | 0.58 | 0.45 | 35 |
| T–Achapime | 2.5 | 3.5 | 0.73 | 1.1 | 120 | 1.4 | 0.62 | 0.62 | 131 |
| T–Tamso | 46 | 33 | 4.7 | 4.0 | 69 | 21 | 1.3 | 1.6 | 182 |
| Minimum | 1.6 | 0.79 | 0.49 | 0.53 | 3.1 | 0.75 | 0.15 | 0.13 | 9.9 |
| Maximum | 46 | 33 | 4.7 | 4.0 | 400 | 21 | 2.6 | 1.6 | 427 |
| Average | 7.8 | 4.2 | 1.2 | 1.4 | 61 | 2.6 | 0.66 | 0.57 | 80 |
| Median | 4.7 | 1.9 | 0.92 | 1.3 | 21 | 1.8 | 0.39 | 0.50 | 35 |
| Metals/Average Distance | Average Distance |
|---|---|
| average distance | 1.0 |
| As | −0.65 ** |
| Cd | −0.38 |
| Co | −0.26 |
| Cr | −0.36 |
| Cu | −0.57 ** |
| Hg | −0.19 |
| Ni | −0.49 * |
| Pb | −0.53 * |
| Zn | −0.28 |
4. Conclusions
Acknowledgements
Author Contributions
Conflicts of Interest
References
- Lim, H.S.; Lee, J.S.; Chon, H.T.; Sager, M. Heavy metal contamination and health risk assessment in the vicinity of the abandoned Songcheon Au-Ag mine in Korea. J. Geochem. Explor. 2008, 96, 223–230. [Google Scholar] [CrossRef]
- Kumar, K.S.; Sajwan, K.S.; Richardson, J.P.; Kannan, K. Contamination profiles of heavy metals, organochlorine pesticides, polycyclic aromatic hydrocarbons and alkylphenols in sediment and oyster collected from Marsh/Estuarine Savannah GA, USA. Mar. Pollut. Bull. 2008, 56, 136–149. [Google Scholar] [CrossRef] [PubMed]
- Wei, B.; Yang, L. A review of heavy metal contaminations in urban soils, urban road dusts and agricultural soils from China. Microchem. J. 2010, 94, 99–107. [Google Scholar] [CrossRef]
- Varol, M. Assessment of heavy metal contamination in sediments of the Tigris River (Turkey) using pollution indices and multivariate statistical techniques. J. Hazard. Mater. 2011, 195, 355–364. [Google Scholar] [CrossRef] [PubMed]
- Yaylali-Abanuz, G. Heavy metal contamination of surface soil around Gebze industrial area, Turkey. Microchem. J. 2011, 99, 82–92. [Google Scholar] [CrossRef]
- Mireles, F.; Davila, J.I.; Pinedo, J.L.; Reyes, E.; Speakman, R.J.; Glascock, M.D. Assessing urban soil pollution in the cities of Zacatecas and Guadalupe, Mexico by instrumental neutron activation analysis. Microchem. J. 2012, 103, 158–164. [Google Scholar] [CrossRef]
- Smedley, P.L.; Kinniburgh, D.G. A review of the source, behavior and distribution of arsenic in natural waters. Appl. Geochem. 2002, 17, 517–568. [Google Scholar] [CrossRef]
- Asante, K.A.; Agusa, T.; Subramanian, A.; Ansa–Asare, O.D.; Biney, C.A.; Tanabe, S. Contamination status of arsenic and other trace elements in drinking water and residents from Tarkwa, a historic mining township in Ghana. Chemosphere 2007, 66, 1513–1522. [Google Scholar] [CrossRef] [PubMed]
- Obiri, S. Determination of heavy metals in water from boreholes in Dumasi in the Wassa west district of the western region of the Republic of Ghana. Environ. Monit. Assess. 2007, 130, 455–463. [Google Scholar] [CrossRef] [PubMed]
- Akoto, O.; Bortey–Sam, N.; Nakayama, S.; Ikenaka, Y.; Baidoo, E.; Yohannes, Y.B.; Mizukawa, H.; Ishizuka, M. Distribution of heavy metals in organs of sheep and goat reared in Obuasi: A gold mining town in Ghana. Int. J. Environ. Sci. Toxic. 2014, 2, 81–89. [Google Scholar]
- Bortey-Sam, N.; Nakayama, S.M.M.; Ikenaka, Y.; Akoto, O.; Yohannes, Y.B.; Baidoo, E.; Mizukawa, H.; Ishizuka, M. Human health risks from metals and metalloid via consumption of food animals near gold mines in Tarkwa, Ghana: Estimation of the daily intakes and target hazard quotients (THQs). Ecotoxicol. Environ. Saf. 2015, 111, 160–167. [Google Scholar] [CrossRef] [PubMed]
- Khan, S.; Cao, Q.; Zheng, Y.; Huang, Y.; Zhu, Y. Health risks of heavy metals in contaminated soils and food crops irrigated with wastewater in Beijing, China. Environ. Pollut. 2008, 152, 686–692. [Google Scholar] [CrossRef] [PubMed]
- Nagajyoti, P.C.; Lee, K.D.; Sreekanth, T.V.M. Heavy metals, occurrence and toxicity for plants: A review. Environ. Chem. Lett. 2010, 8, 199–216. [Google Scholar] [CrossRef]
- Alloway, B.J. Heavy Metals in Soils–Trace Metals and Metalloids in Soils and Their Bioavailability; Springer: Dordrecht, The Netherlands, 2013. [Google Scholar]
- Hayford, E.K.; Amin, A.; Osae, E.K.; Kutu, J. Impact of gold mining on soil and some staple foods collected from selected mining communities in and around Tarkwa Prestea Area. West Afr. J. Appl. Ecol. 2008, 14, 1–12. [Google Scholar] [CrossRef]
- Ghana Statistical Service. Population and Housing Census. 2010. Available online: https://www.google.co.uk/#q=Ghana+Statistical+Service%2C+2010.+Population+and+Housing+census+pp93 (accessed on 12 May 2013).
- Akabzaa, T.; Darimani, A. Impact of mining sector investment in Ghana: A study of the Tarkwa mining region. Health Impacts. 2001. Available online: http://www.saprin.org/ghana/research/gha_mining.pdf (accessed 11 September 2015).
- Bortey-Sam, N.; Ikenaka, Y.; Nakayama, S.M.M.; Akoto, O.; Yohannes, Y.B.; Baidoo, E.; Mizukawa, H.; Ishizuka, M. Occurrence, distribution, sources and toxic potential of polycyclic aromatic hydrocarbons (PAHs) in surface soils from the Kumasi Metropolis, Ghana. Sci. Total Environ. 2014, 496, 471–478. [Google Scholar] [CrossRef] [PubMed]
- United States Environmental Protection Agency (USEPA). Guidance for Developing Ecological Soil Screening Levels. Available online: http://www.epa.gov/ecotox/ecossl/ (accessed on 14 May 2013).
- United States Environmental Protection Agency (USEPA). Framework for Inorganic Metals Risk Assessment; USEPA: Washington, DC, USA, 2004. [Google Scholar]
- Kabata-Pendias, A.; Sadurski, W. Trace elements and compounds in soil. In: Elements and Their Compounds in the Environment, 2 ed.; Wiley-VCH: Weinheim, Germany, 2004. [Google Scholar]
- Manta, D.S.; Angelone, M.; Bellanca, A.; Neri, R.; Sprovieri, M. Heavy metals in urban soils: A case study from the city of Palermo (Sicily), Italy. Sci. Total Environ. 2002, 300, 229–243. [Google Scholar] [CrossRef]
- Hani, A.; Pazira, E. Heavy metals assessment and identification of their sources in agricultural soils of Southern Tehran, Iran. Environ. Monit. Assess. 2011, 176, 677–691. [Google Scholar] [CrossRef] [PubMed]
- Kabata-Pendias, A.; Pendias, H. Trace Elements in Soils and Plants, 2nd ed.; CRC Press: London, UK, 1992; p. 413. [Google Scholar]
- Hernandez, L.; Probst, A.; Probst, J.L.; Ulrich, E. Heavy metal distribution in some French forest soils: evidence for atmospheric contamination. Sci. Total Environ. 2003, 312, 195–219. [Google Scholar] [CrossRef]
- Gjoka, F.; Felix-Henningsen, P.; Wegener, H.R.; Salillari, I.; Beqiraj, A. Heavy metals in soils from Tirana (Albania). Environ. Monit. Assess. 2011, 172, 517–527. [Google Scholar] [CrossRef] [PubMed]
- Lu, A.X.; Wang, J.H.; Qin, X.Y.; Wang, K.Y.; Han, P.; Zhang, S.Z. Multivariate and geostatistical analyses of the spatial distribution and origin of heavy metals in the agricultural soils in Shunyi, Beijing, China. Sci. Total Environ. 2012, 425, 66–74. [Google Scholar] [CrossRef] [PubMed]
- Al–Khashman, O.A.; Shawabkeh, R.A. Metals distribution in soils around the cement factory in southern Jordan. Environ. Pollut. 2006, 140, 387–394. [Google Scholar] [CrossRef] [PubMed]
- Chen, T.; Liu, X.; Zhu, M.; Zhao, K.; Wu, J.; Xu, J.; Huang, P. Identification of trace element sources and associated risk assessment in vegetable soils of the urban–rural transitional area of Hangzhou, China. Environ. Pollut. 2008, 151, 67–78. [Google Scholar] [CrossRef] [PubMed]
- Grant, C.; Sheppard, S. Fertilizer impacts on cadmium availability in agricultural soils and crops. Hum. Ecol. Risk Assess. 2008, 14, 210–228. [Google Scholar] [CrossRef]
- Suresh, G.; Sutharsan, P.; Ramasamy, V.; Venkatachalapathy, R. Assessment of spatial distribution and potential ecological risk of the heavy metals in relation to granulometric contents of Veeranam lake sediments, India. Ecotoxicol. Environ. Saf. 2012, 84, 117–124. [Google Scholar] [CrossRef] [PubMed]
- Amonoo–Neizer, E.H.; Nyamah, D.; Bakiamoh, S.B. Mercury and Arsenic Pollution in soil and biological samples around mining towns if Obuasi, Ghana. Water Air Soil Poll. 1995, 91, 363–373. [Google Scholar] [CrossRef]
- Streets, D.G.; Hao, J.M.; Wu, Y.; Jiang, J.K.; Chan, M.; Tian, H.Z.; Feng, X.B. Anthropogenic mercury emissions in China. Atmos. Environ. 2005, 39, 7789–7806. [Google Scholar] [CrossRef]
- Manno, E.; Varrica, D.; Dongarra, G. Metal distribution in road dust samples collected in an urban area close to a petrochemical plant at Gela, Sicily. Atmos. Environ. 2006, 40, 5929–5941. [Google Scholar] [CrossRef]
- Chen, H.M.; Zheng, C.R.; Tu, C.; Zhu, Y.G. Heavy metal pollution in soils in China: status and countermeasures. Ambio 1999, 28, 130–134. [Google Scholar]
- Nicholson, F.; Smith, S.; Alloway, B.; Carlton–Smith, C.; Chambers, B. An inventory of heavy metals inputs to agricultural soils in England and Wales. Sci. Total Environ. 2003, 311, 205–219. [Google Scholar] [CrossRef]
- Zhang, C.S. Using multivariate analyses and GIS to identify pollutants and their spatial patterns in urban soils in Galway, Ireland. Environ. Pollut. 2006, 142, 501–511. [Google Scholar] [CrossRef] [PubMed]
- Jiao, W.; Chen, W.; Chang, A.C.; Page, A.L. Environmental risks of trace elements associated with long-term phosphate fertilizers applications: a review. Environ. Pollut. 2012, 168, 44–53. [Google Scholar] [CrossRef] [PubMed]
- Luo, L.; Ma, Y.B.; Zhang, S.Z.; Wei, D.P.; Zhu, Y.G. An inventory of trace element inputs to agricultural soils in China. J. Environ. Manag. 2009, 90, 2524–2530. [Google Scholar] [CrossRef]
- Jiang, P.; Jin, S.Y.; Hao, X.Z.; Zhou, D.M.; Li, L.Z.; Lv, J.L. Distribution characteristics of heavy metals in feeds, pig manures, soils and vegetables. J. Agro. Environ. Sci. 2010, 29, 942–947. [Google Scholar]
- Bogoso Gold Limited: Environmental Impact Assessment for Prestea North Project; Knight and Scott, Winston, Inc.: London, UK, 2002.
- BGL, Bogoso Gold Limited. An Overview of Bogoso Gold Limited; BGL: Bogoso, Ghana, 2002. [Google Scholar]
- Hakanson, L. An ecological risk index for aquatic pollution control: A sedimentological approach. Water Res. 1980, 14, 975–1001. [Google Scholar] [CrossRef]
- Zhu, W.; Bian, B.; Li, L. Heavy metal contamination of road deposited sediments in a medium size city of China. Environ. Monit. Assess. 2008, 147, 171–181. [Google Scholar] [CrossRef] [PubMed]
- Chen, T.B.; Zheng, Y.M.; Lei, M.; Huang, Z.C.; Wu, H.T.; Chen, H.; Fan, K.K.; Yu, K.; Wu, X.; Tian, Q.Z. Assessment of heavy metal pollution in surface soils of urban parks in Beijing, China. Chemosphere 2005, 60, 542–551. [Google Scholar] [CrossRef] [PubMed]
- Loska, K.; Wiechula, D. Application of principal component analysis for the estimation of source of heavy metal contamination in surface sediments from the Rybnik Reservoir. Chemosphere 2003, 51, 723–733. [Google Scholar] [CrossRef]
© 2015 by the authors; licensee MDPI, Basel, Switzerland. This article is an open access article distributed under the terms and conditions of the Creative Commons Attribution license (http://creativecommons.org/licenses/by/4.0/).
Share and Cite
Bortey-Sam, N.; Nakayama, S.M.M.; Akoto, O.; Ikenaka, Y.; Baidoo, E.; Mizukawa, H.; Ishizuka, M. Ecological Risk of Heavy Metals and a Metalloid in Agricultural Soils in Tarkwa, Ghana. Int. J. Environ. Res. Public Health 2015, 12, 11448-11465. https://doi.org/10.3390/ijerph120911448
Bortey-Sam N, Nakayama SMM, Akoto O, Ikenaka Y, Baidoo E, Mizukawa H, Ishizuka M. Ecological Risk of Heavy Metals and a Metalloid in Agricultural Soils in Tarkwa, Ghana. International Journal of Environmental Research and Public Health. 2015; 12(9):11448-11465. https://doi.org/10.3390/ijerph120911448
Chicago/Turabian StyleBortey-Sam, Nesta, Shouta M. M. Nakayama, Osei Akoto, Yoshinori Ikenaka, Elvis Baidoo, Hazuki Mizukawa, and Mayumi Ishizuka. 2015. "Ecological Risk of Heavy Metals and a Metalloid in Agricultural Soils in Tarkwa, Ghana" International Journal of Environmental Research and Public Health 12, no. 9: 11448-11465. https://doi.org/10.3390/ijerph120911448
APA StyleBortey-Sam, N., Nakayama, S. M. M., Akoto, O., Ikenaka, Y., Baidoo, E., Mizukawa, H., & Ishizuka, M. (2015). Ecological Risk of Heavy Metals and a Metalloid in Agricultural Soils in Tarkwa, Ghana. International Journal of Environmental Research and Public Health, 12(9), 11448-11465. https://doi.org/10.3390/ijerph120911448