
Characterizing the HIV/AIDS Epidemic in the United States and China

Abstract
:1. Introduction
2. Methods
3. Results and Discussion
3.1. HIV/AIDS Epidemic in the United States and China

| Classification | 2008 | 2009 | 2010 | 2011 | 2012 | 2013 |
|---|---|---|---|---|---|---|
| New HIV infections | 51,477 | 47,897 | 46,021 | 44,883 | 46,154 | 48,145 |
| AIDS | 33,419 | 31,915 | 29,168 | 27,283 | 26,444 | 27,135 |
| Classification | 2005 | 2007 | 2009 | 2011 | 2012 | 2013 | 2014 |
|---|---|---|---|---|---|---|---|
| PLHIV (Estimated) | 650,000 | 700,000 | 740,000 | 780,000 | - * | 810,000 | - |
| PLHIV (Reported) | - | - | 272,000 | 352,000 | 385,817 | 436,817 | 500,679 |
| AIDS | 75,000 | 85,000 | 105,000 | 154,000 | 145,463 | 173.825 | 204,683 |
| New HIV infections | 70,000 | 50,000 | 48,000 | 48,000 | 82,434 | 90,119 | 103,501 |
| HIV prevalence (Estimated) | 0.050% | 0.054% | 0.057% | 0.058% | - | 0.06% | - |
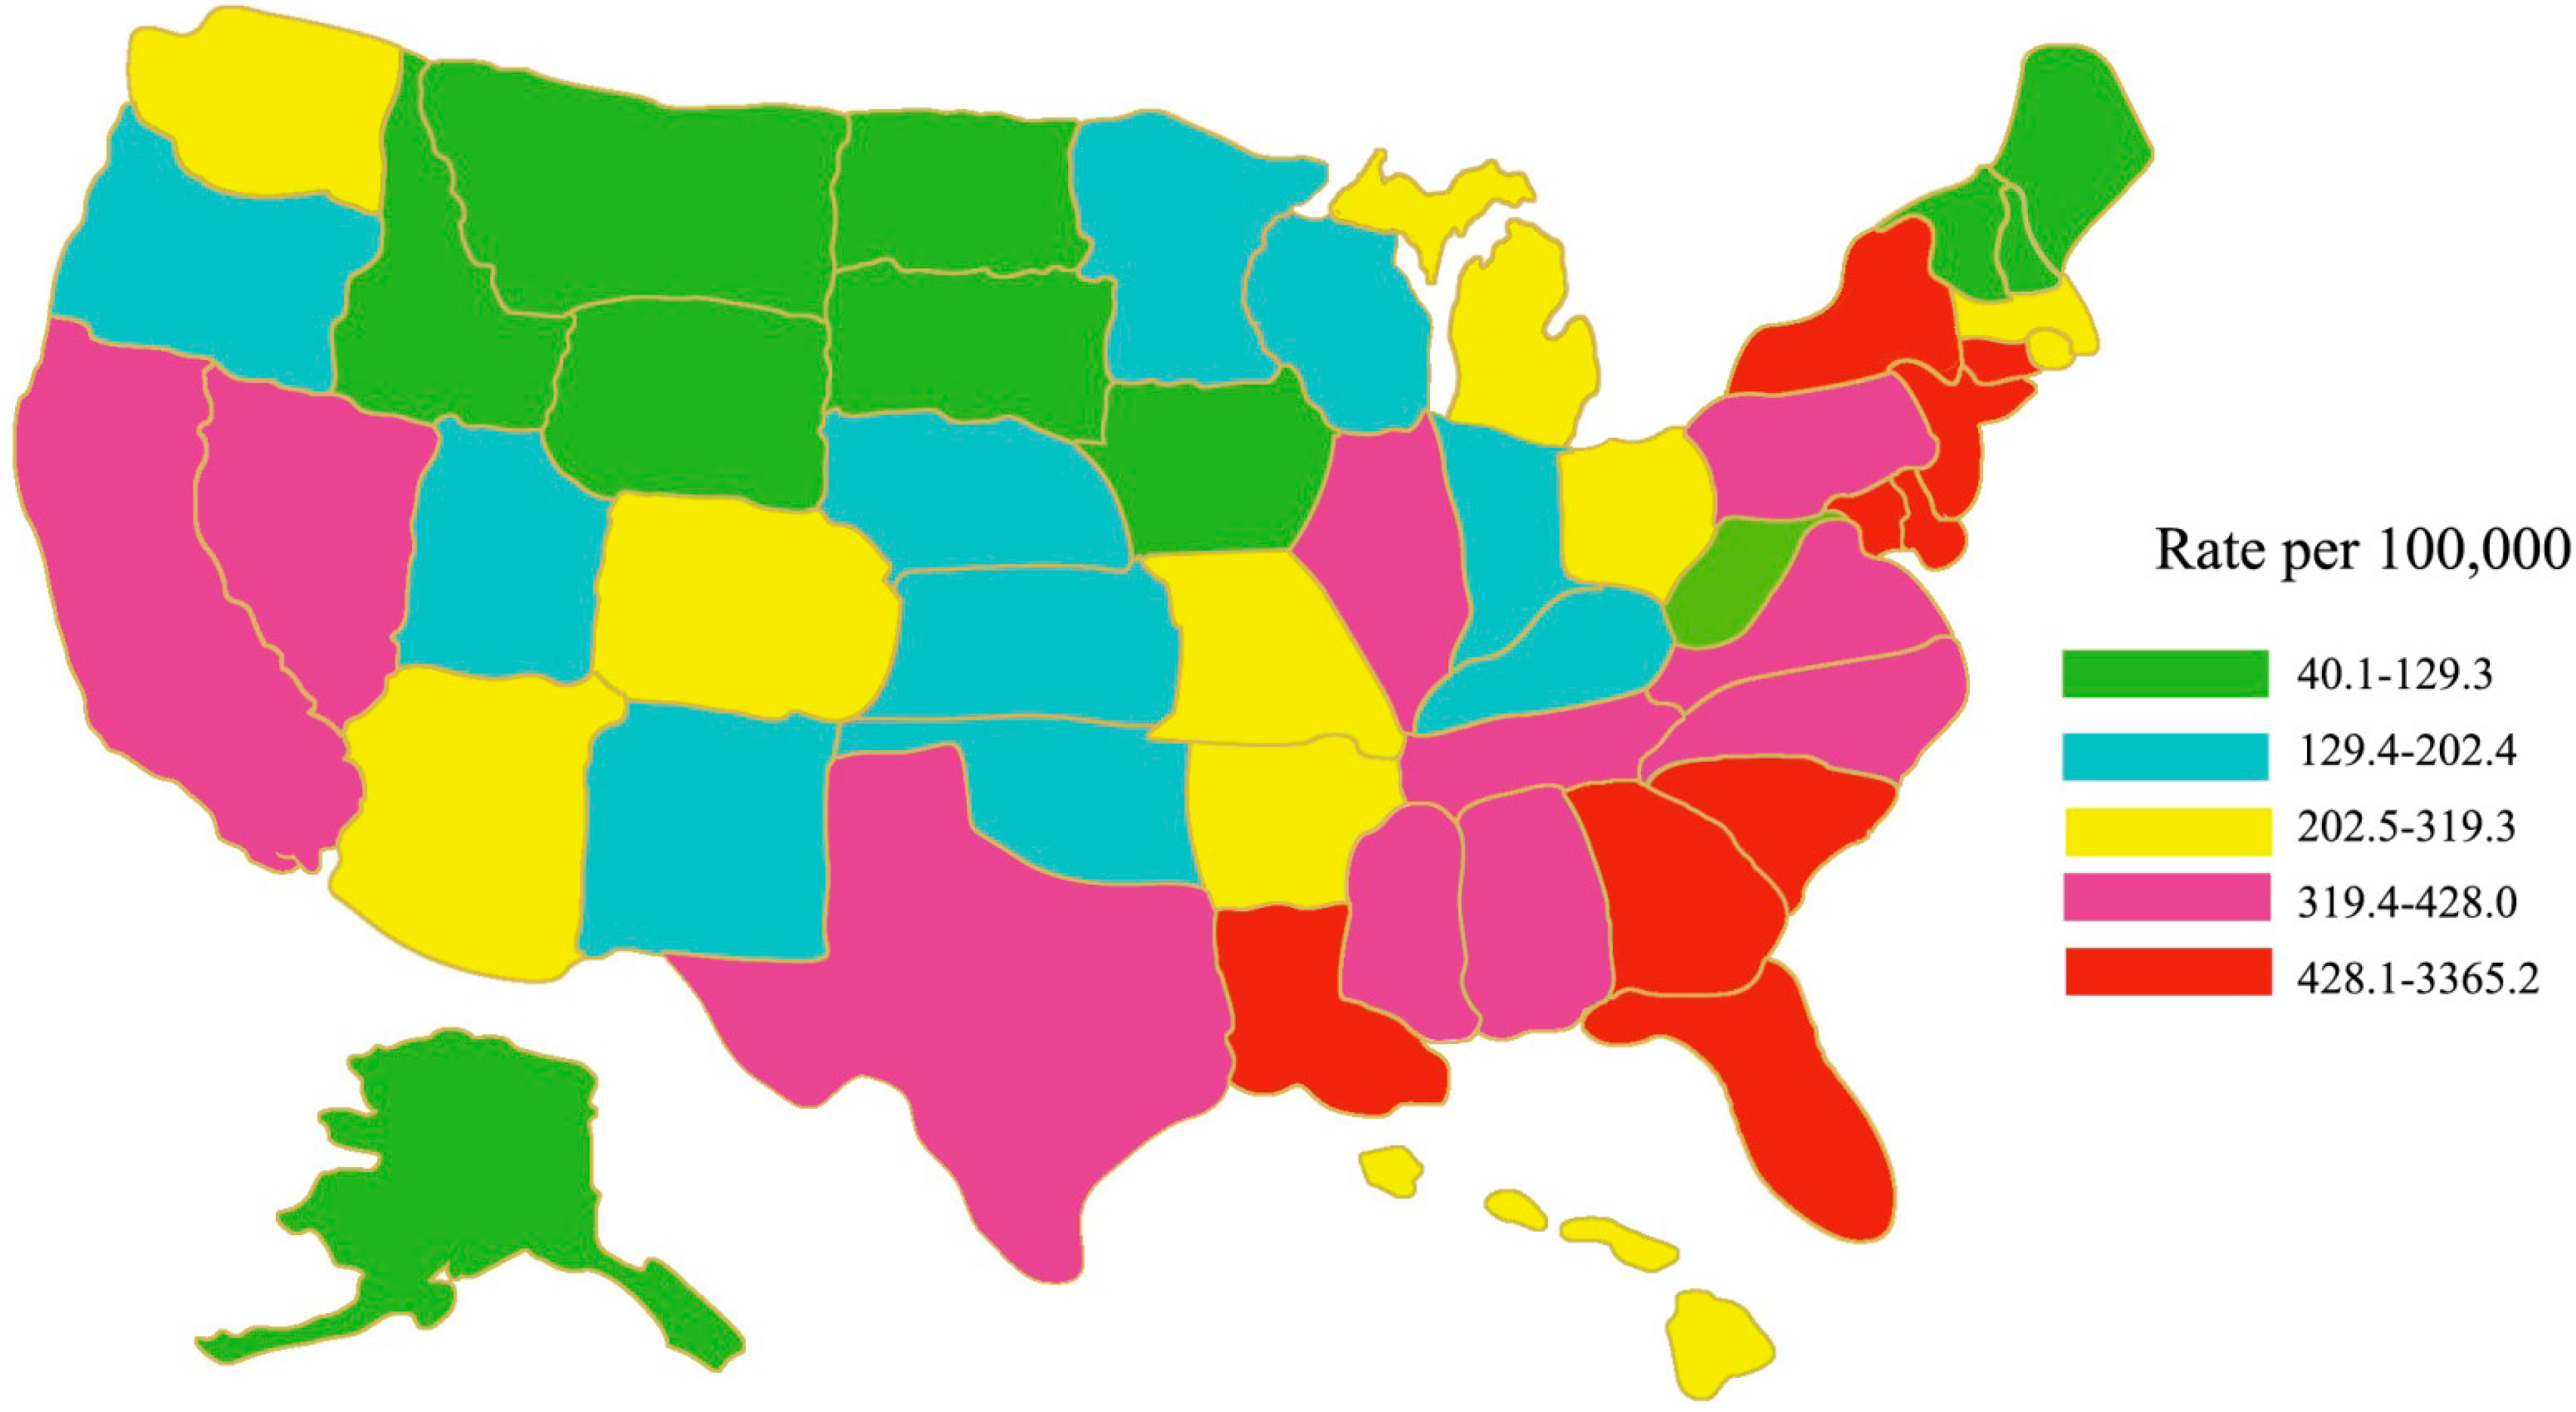
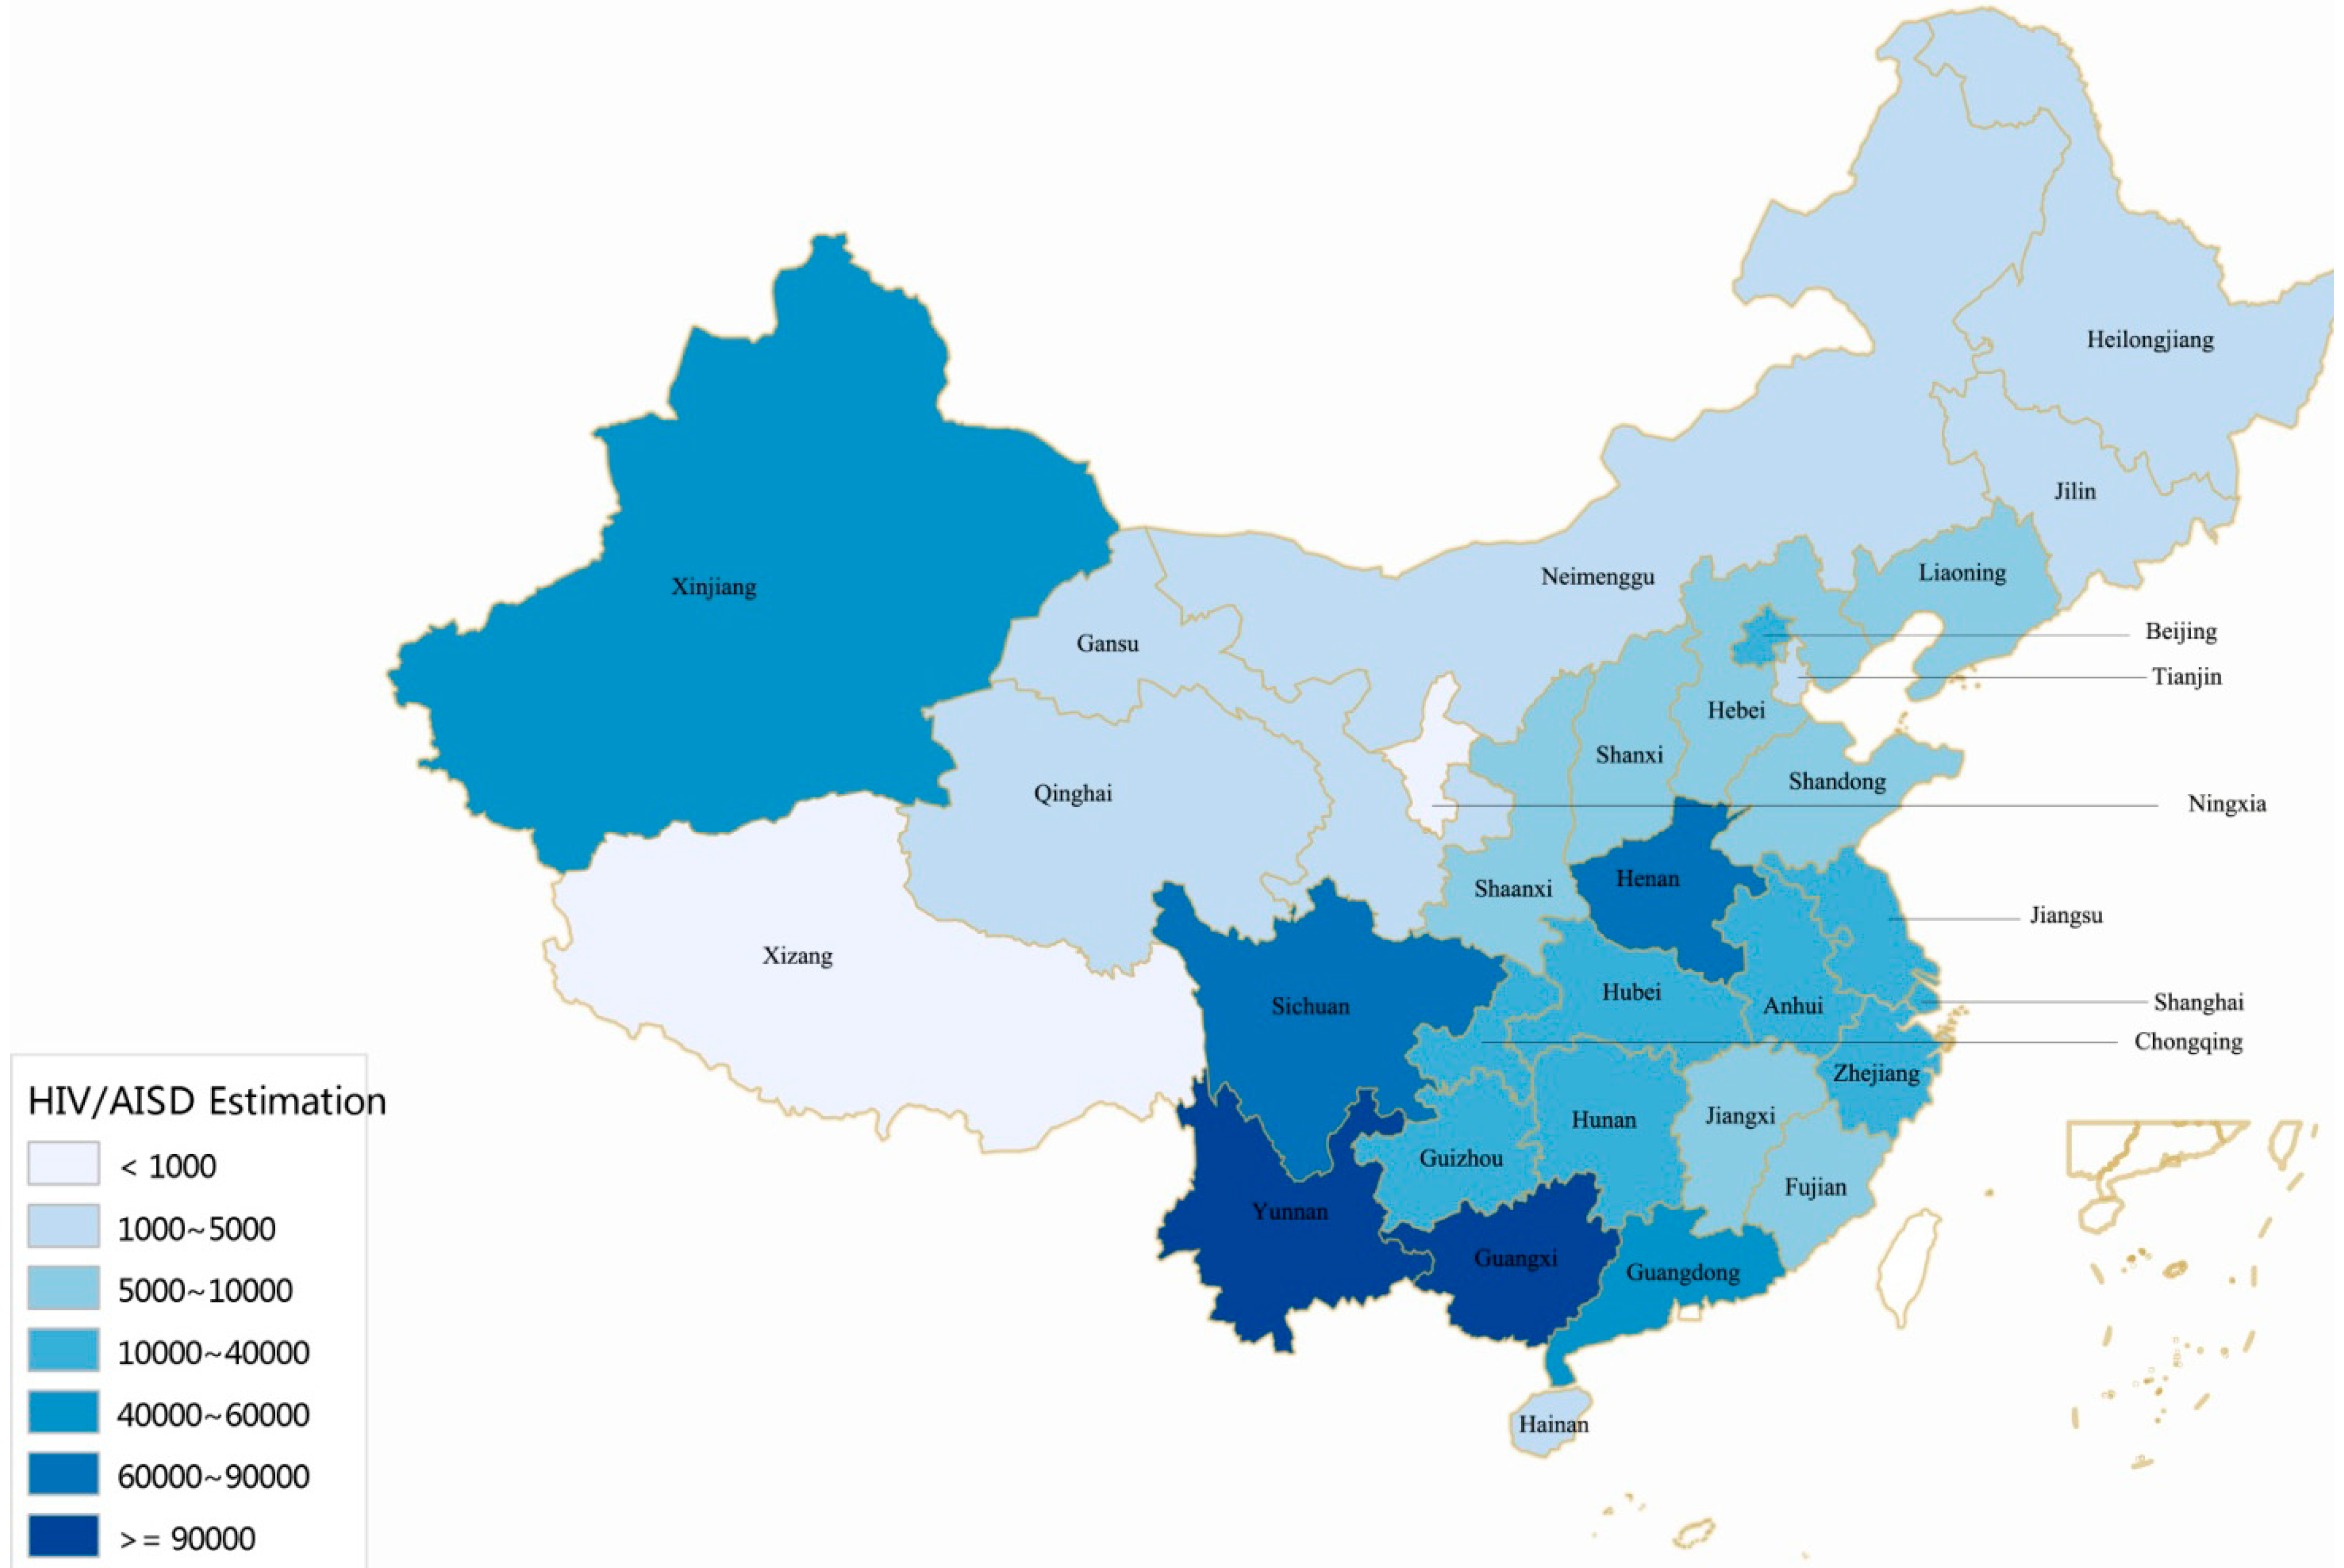
3.2. HIV/AIDS Distribution in the United States and China

3.3. HIV Transmission Patterns

| Year | Annual Transmission Constitute of Reported (%) | ||||||
|---|---|---|---|---|---|---|---|
| Country | Heterosexual | Homosexual | IDU * | Homosexual and IDU ** | MTCT *** | Blood and Others | |
| 1985–2005 | USA | - **** | - | - | - | - | - |
| China | 11.30 | 0.30 | 44.20 | - | 1.10 | 43.10 | |
| 2006 | USA | - | - | - | - | - | - |
| China | 30.60 | 2.50 | 34.10 | - | 1.50 | 31.30 | |
| 2007 | USA | - | - | - | - | - | - |
| China | 38.90 | 3.40 | 29.20 | - | 1.50 | 27.00 | |
| 2008 | USA | - | - | - | - | - | - |
| China | 40.30 | 5.90 | 27.90 | - | 1.30 | 24.60 | |
| 2009 | USA | 28.62 | 58.32 | 8.92 | 3.43 | 0.38 | 0.33 |
| China | 47.10 | 8.60 | 25.80 | - | 1.40 | 17.10 | |
| 2010 | USA | 27.82 | 60.06 | 8.04 | 3.34 | 0.40 | 0.34 |
| China | 54.90 | 10.80 | 22.10 | - | 1.30 | 10.90 | |
| 2011 | USA | 26.94 | 62.12 | 7.19 | 3.06 | 0.32 | 0.37 |
| China | 62.60 | 16.10 | 15.60 | 1.10 | 1.30 | 3.30 | |
| 2012 | USA | 25.59 | 63.96 | 6.68 | 2.91 | 0.36 | 0.50 |
| China | 68.00 | 19.10 | 9.30 | 0.70 | 1.00 | 1.90 | |
| 2013 | USA | 25.17 | 64.81 | 6.54 | 2.68 | 0.23 | 0.57 |
| China | 69.40 | 21.40 | 7.20 | 0.50 | 0.90 | 0.55 | |
| 2014 | USA | - | - | - | - | - | - |
| China | 66.40 | 25.80 | 5.60 | 0.40 | 0.70 | 1.08 | |
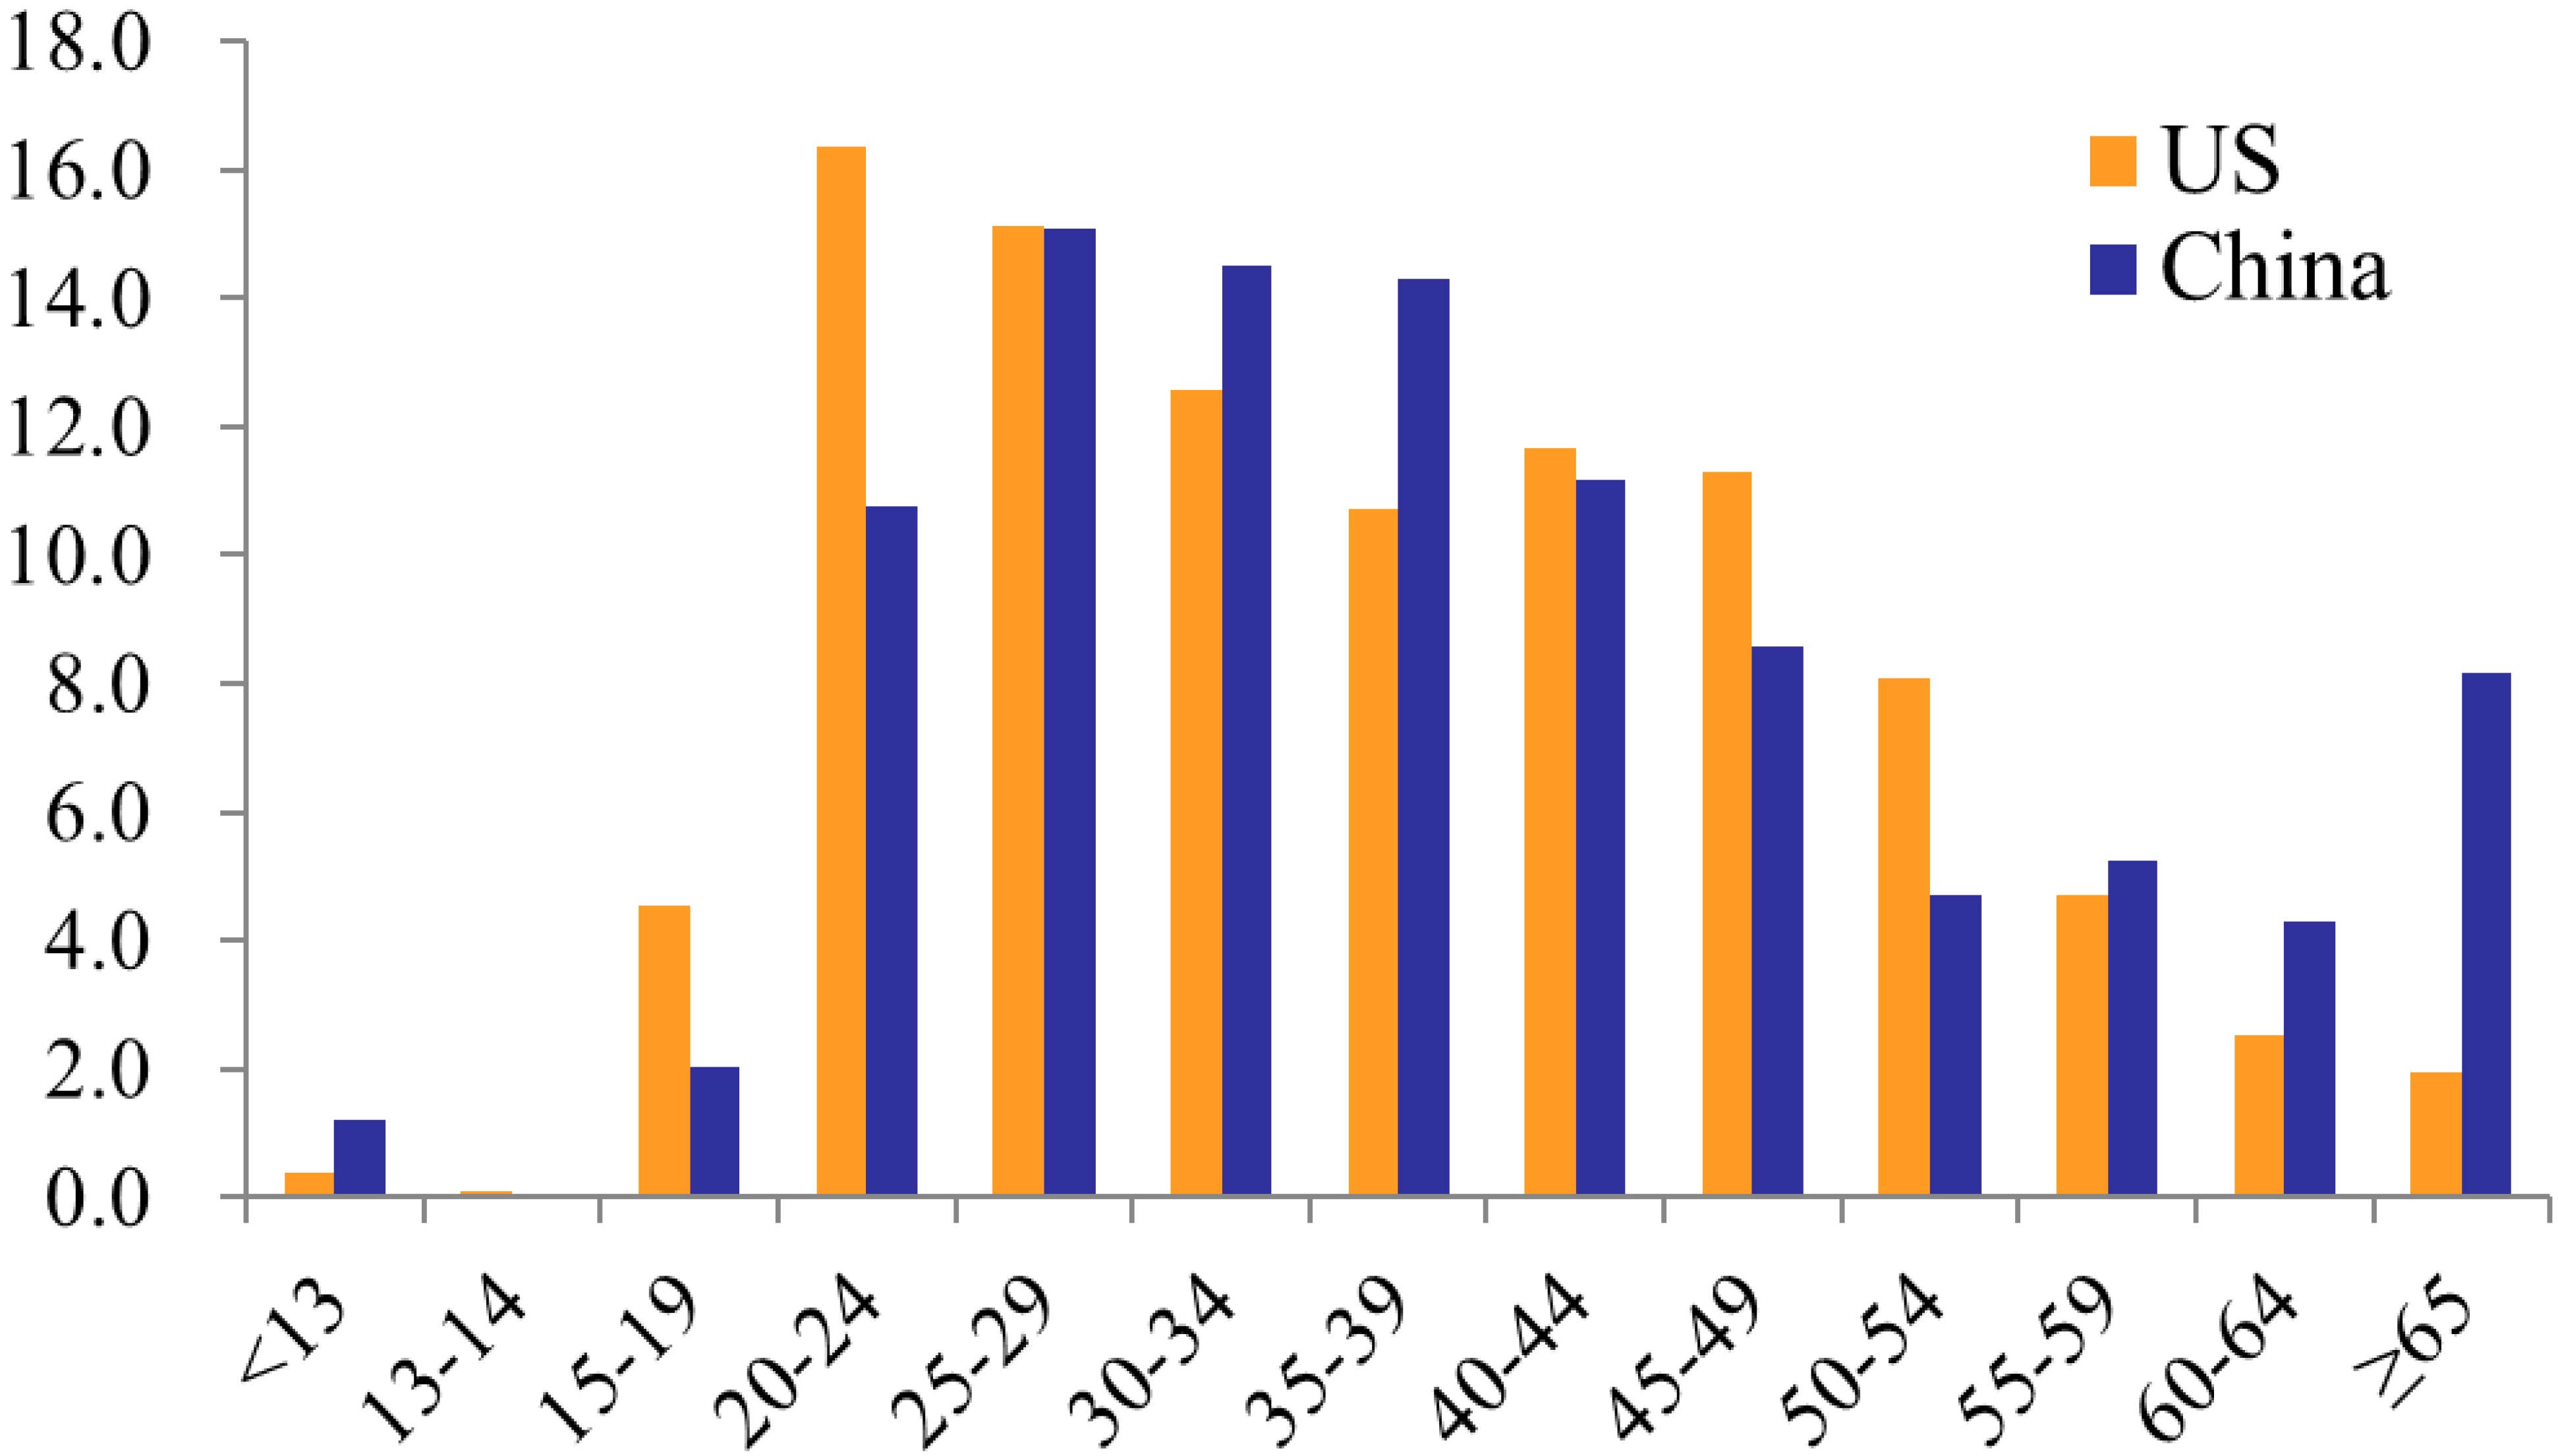
3.4. Risk by Age Group

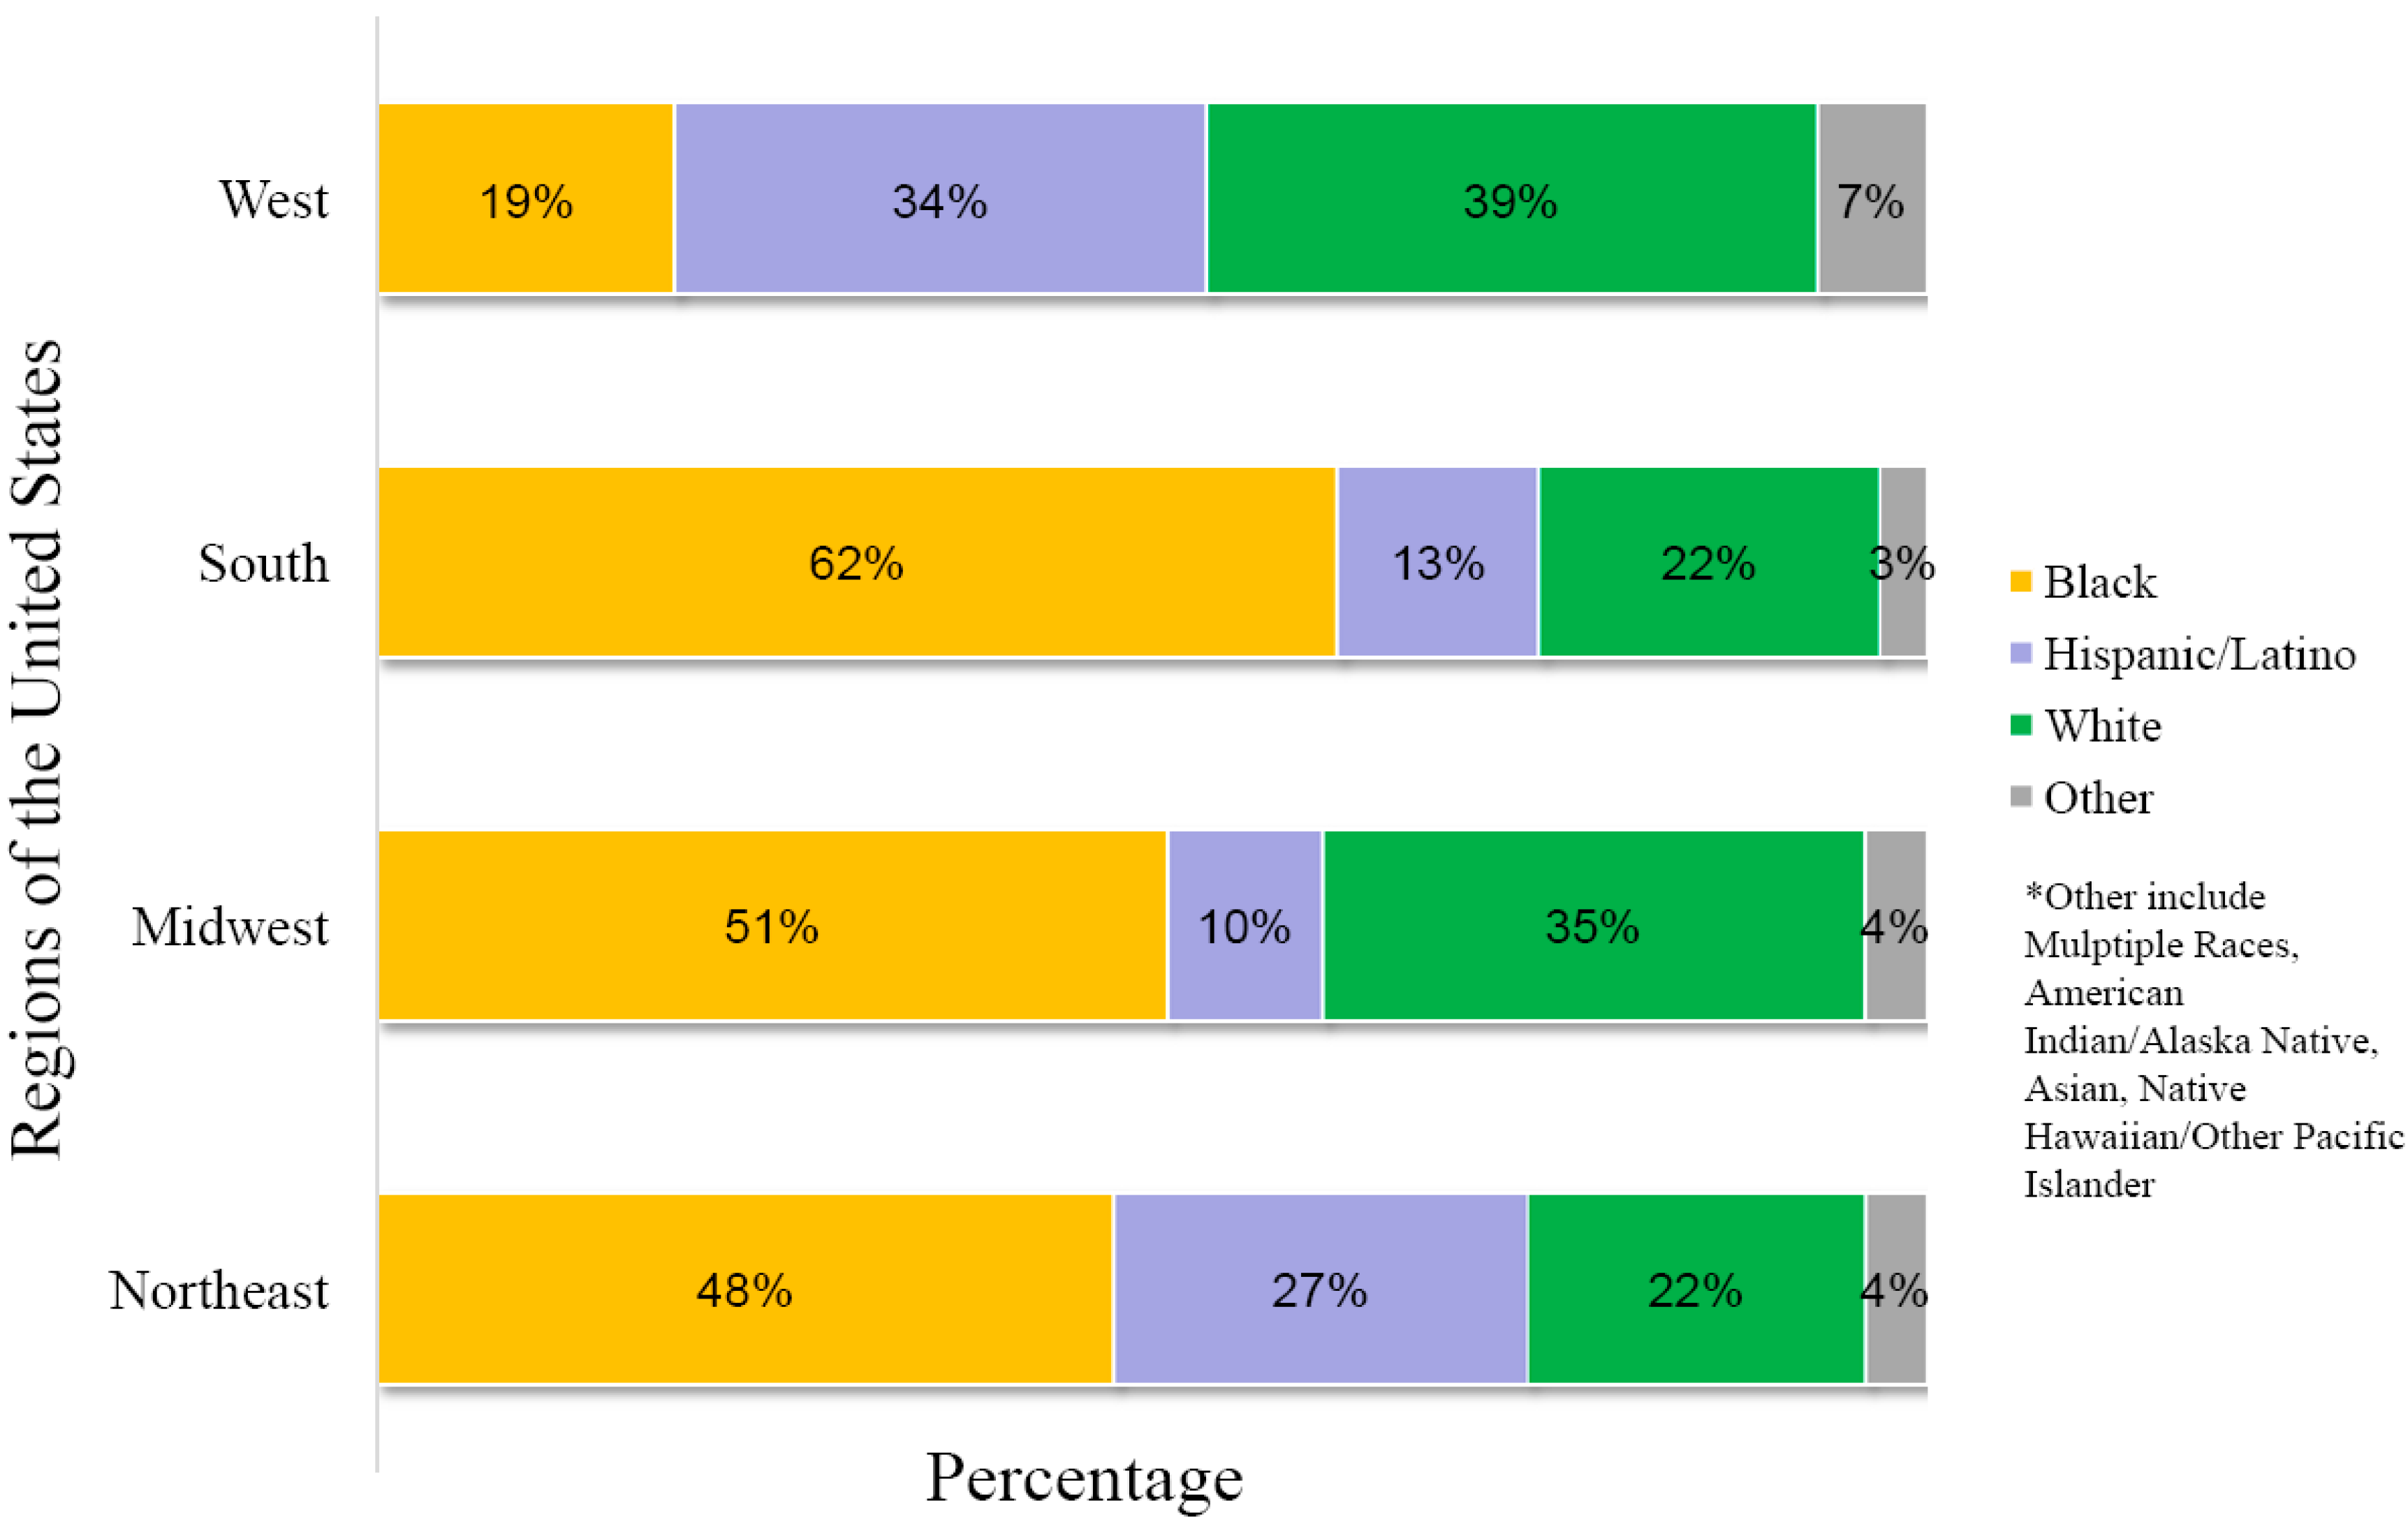
3.5. Race/Ethnicity

4. Conclusions
Acknowledgments
Author Contributions
Conflicts of Interest
References
- UNAIDS. How AIDS Changed Everything. 2015. Available online: http://www.unaids.org/sites/default/files/media_asset/MDG6Report_en.pdf (accessed on 30 September 2015).
- U.S. CDC. HIV Surveillance Report; CDC: Atlanta, GA, USA, 2011. [Google Scholar]
- U.S. CDC. HIV Surveillance Report; CDC: Atlanta, GA, USA, 2013. [Google Scholar]
- U.S. CDC. HIV Surveillance Supplemental Report; CDC: Atlanta, GA, USA, 2013. [Google Scholar]
- Ministry of Health of China; UNAIDS; WHO. Working Report on China’s AIDS Epidemic Estimate in 2011; Ministry of Health of China: Beijing, China, 2012. [Google Scholar]
- Ministry of Health of China. 2012 China AIDS Response Progress Report; Ministry of Health of China: Beijing, China, 2012. [Google Scholar]
- Ministry of Health of China; UNAIDS; WHO. Working Report on China’s AIDS Epidemic Estimate in 2009; Ministry of Health of China: Beijing, China, 2010. [Google Scholar]
- Chinese CDC; National Center for AIDS/STD Control and Prevention. Update on the AIDS/STD epidemic in China and main response in control and prevention in December 2012. Chin. J. AIDS/STD 2013, 19. [Google Scholar] [CrossRef]
- Chinese CDC; National Center for AIDS/STD Control and Prevention. Update on the AIDS/STD epidemic in China and main response in control and prevention in December 2013. Chin. J. AIDS/STD 2014, 20. [Google Scholar] [CrossRef]
- Chinese CDC; National Center for AIDS/STD Control and Prevention. Update on the AIDS/STD epidemic in China and main response in control and prevention in December 2014. Chin. J. AIDS/STD 2015, 21. [Google Scholar] [CrossRef]
- Wangning (Chinese CDC, National Center for AIDS/STD Control and Prevention). The challenge of AIDS epidemiology in China. In Proceedings of the National Conference on HIV/AIDS, Beijing, China, 19–21 October 2014.
- U.S. CDC. HIV and AIDS in the United States by Geographic Distribution. Available online: http://www.cdc.gov/hiv/statistics/overview/geographicdistribution.html (accessed on 8 August 2015).
- U.S. CDC. HIV Basics. Available online: http://www.cdc.gov/hiv/basics/index.html (accessed on 8 August 2015).
© 2015 by the authors; licensee MDPI, Basel, Switzerland. This article is an open access article distributed under the terms and conditions of the Creative Commons by Attribution (CC-BY) license (http://creativecommons.org/licenses/by/4.0/).
Share and Cite
Huang, M.-B.; Ye, L.; Liang, B.-Y.; Ning, C.-Y.; Roth, W.W.; Jiang, J.-J.; Huang, J.-G.; Zhou, B.; Zang, N.; Powell, M.D.; et al. Characterizing the HIV/AIDS Epidemic in the United States and China. Int. J. Environ. Res. Public Health 2016, 13, 30. https://doi.org/10.3390/ijerph13010030
Huang M-B, Ye L, Liang B-Y, Ning C-Y, Roth WW, Jiang J-J, Huang J-G, Zhou B, Zang N, Powell MD, et al. Characterizing the HIV/AIDS Epidemic in the United States and China. International Journal of Environmental Research and Public Health. 2016; 13(1):30. https://doi.org/10.3390/ijerph13010030
Chicago/Turabian StyleHuang, Ming-Bo, Li Ye, Bing-Yu Liang, Chuan-Yi Ning, William W. Roth, Jun-Jun Jiang, Jie-Gang Huang, Bo Zhou, Ning Zang, Michael D. Powell, and et al. 2016. "Characterizing the HIV/AIDS Epidemic in the United States and China" International Journal of Environmental Research and Public Health 13, no. 1: 30. https://doi.org/10.3390/ijerph13010030
APA StyleHuang, M.-B., Ye, L., Liang, B.-Y., Ning, C.-Y., Roth, W. W., Jiang, J.-J., Huang, J.-G., Zhou, B., Zang, N., Powell, M. D., Liang, H., & Bond, V. C. (2016). Characterizing the HIV/AIDS Epidemic in the United States and China. International Journal of Environmental Research and Public Health, 13(1), 30. https://doi.org/10.3390/ijerph13010030