Concentration Levels, Pollution Characteristics and Potential Ecological Risk of Dust Heavy Metals in the Metropolitan Area of Beijing, China


Abstract
:1. Introduction
2. Experimental Section
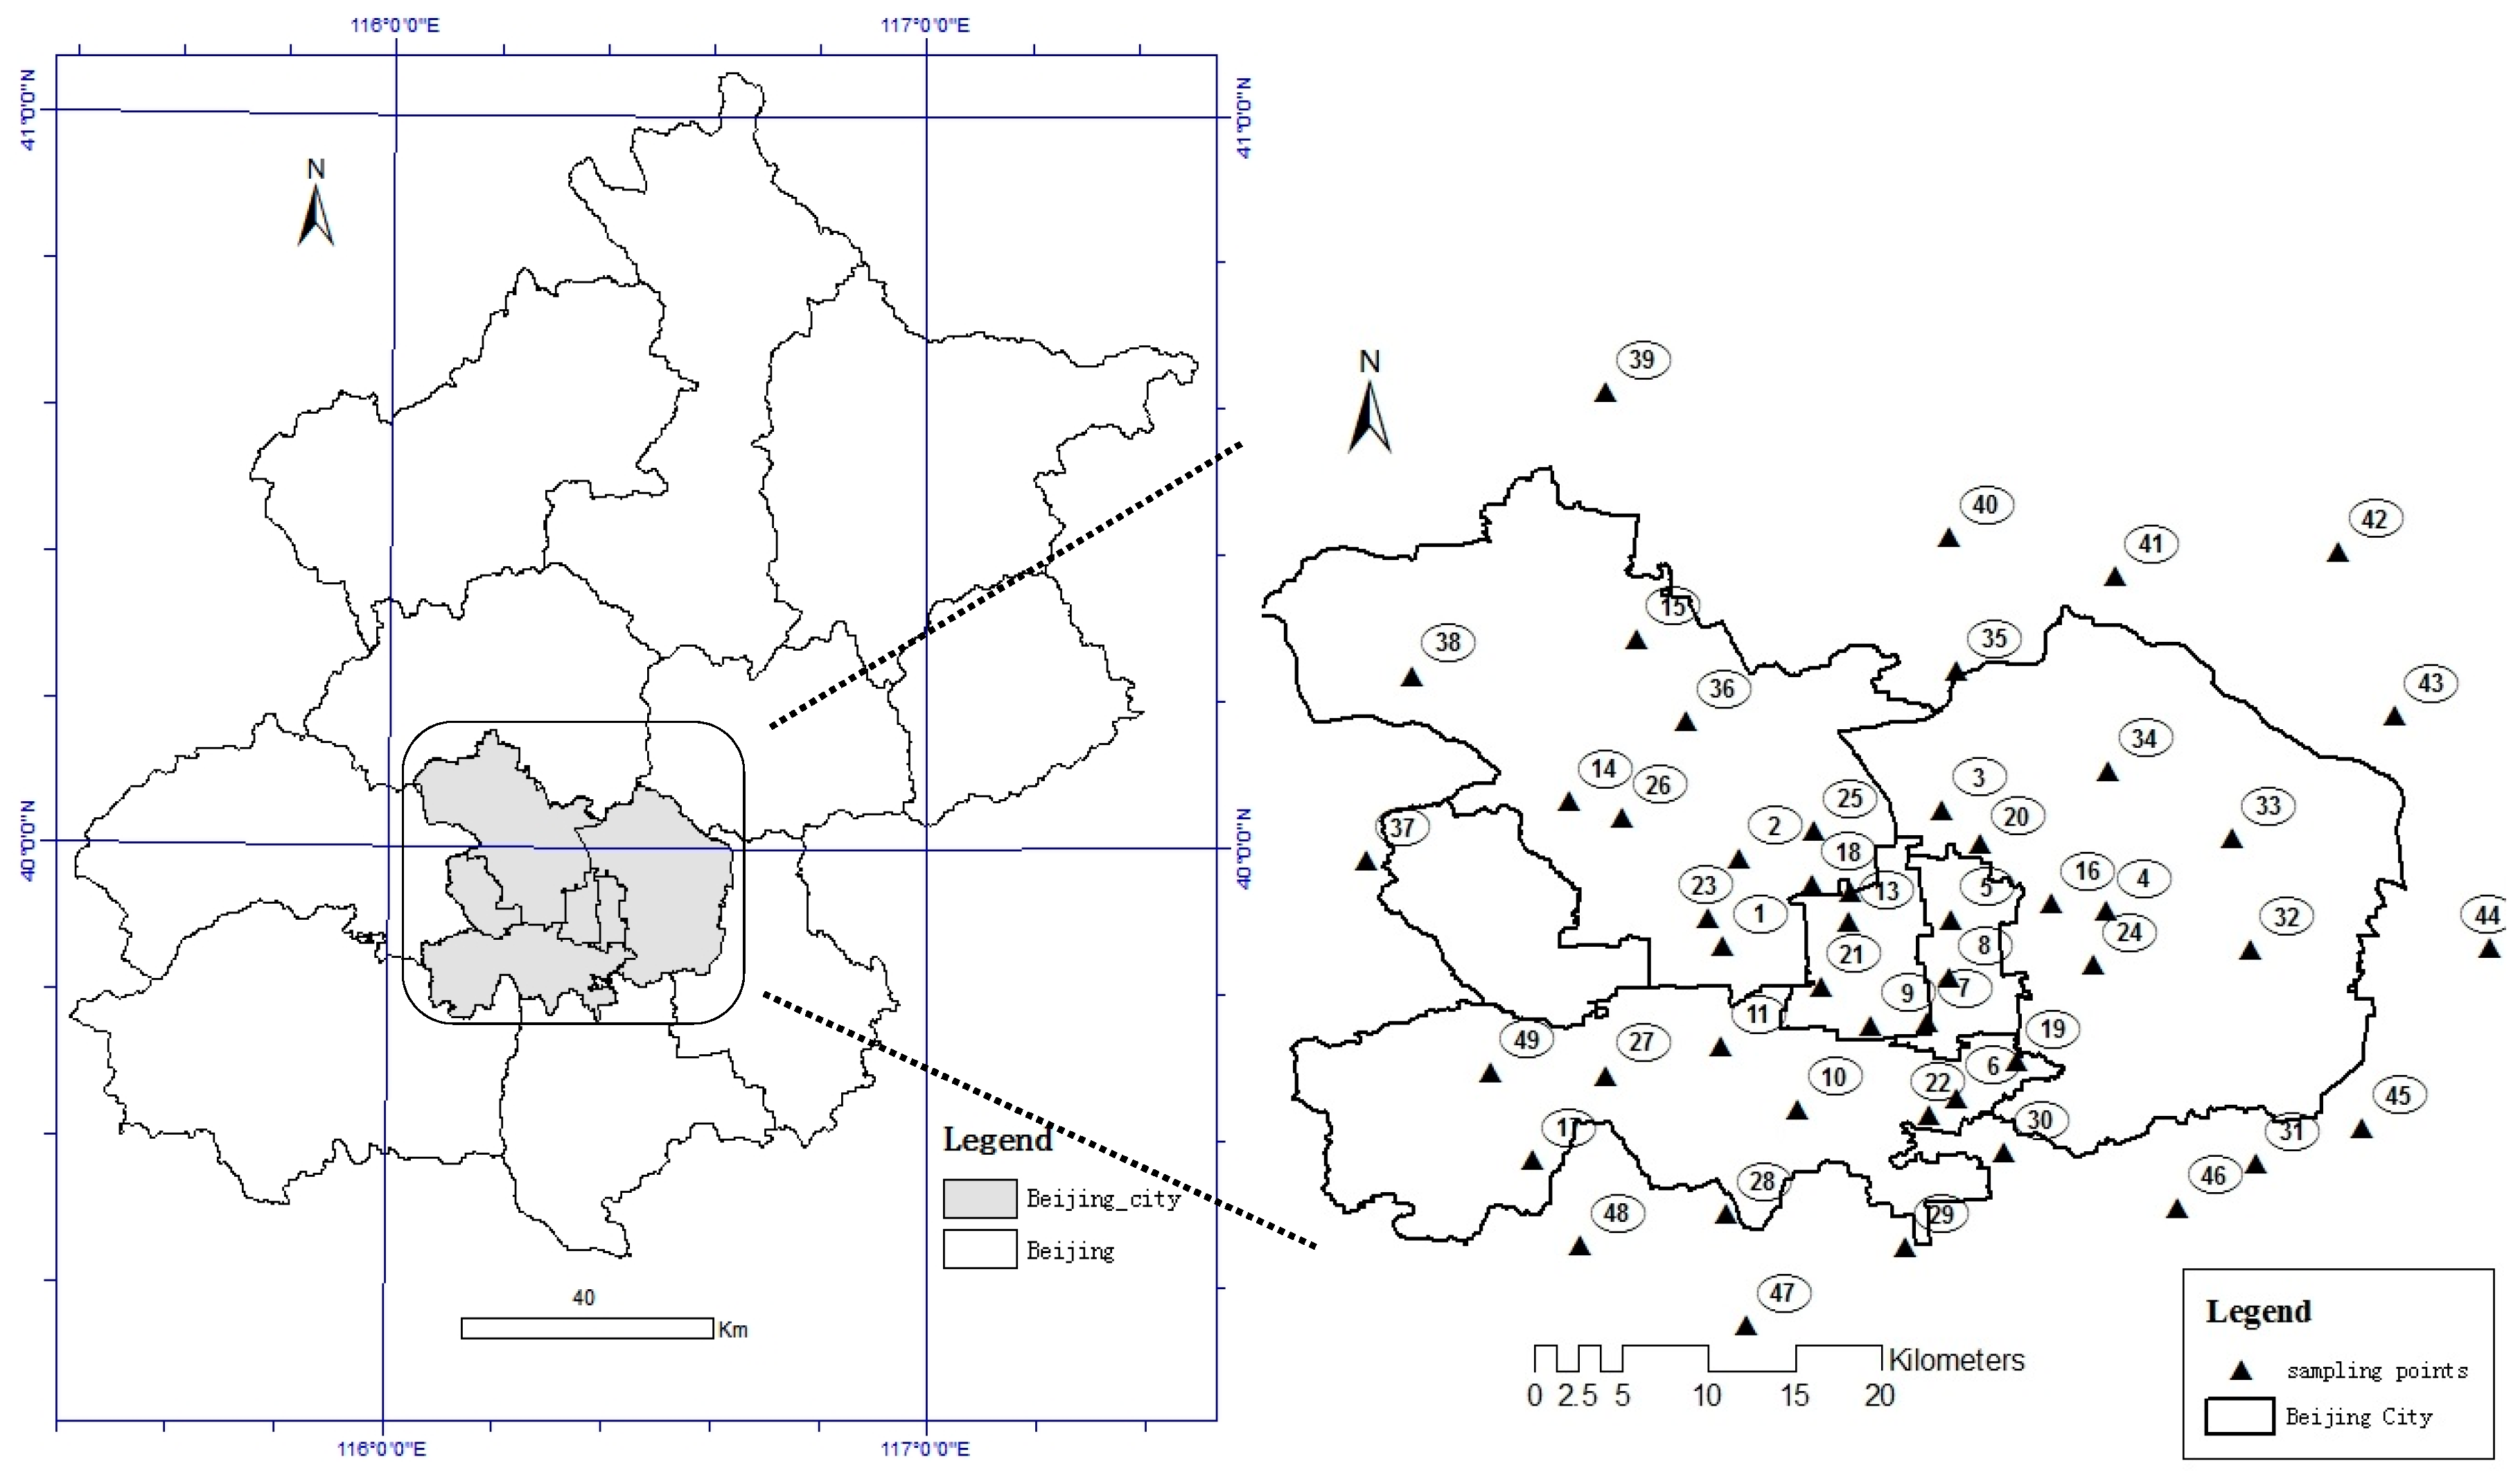
2.1. Dust Samples Collection
2.2. Element Content Test
3. Results and Discussion
3.1. Concentration Levels of Heavy Metals in Atmospheric Dust of Beijing
3.2. Pollution Characteristics of Heavy Metals in Atmospheric Dust of Beijing
3.2.1. Beijing Atmospheric Dust Heavy Metals Enrichment Degree
3.2.2. Beijing Atmospheric Dust Heavy Metals Geo-Accumulation Index
3.3. Potential Ecological Risk Assessment of Dust Heavy Metals in Beijing
4. Conclusions
Acknowledgments
Author Contributions
Conflicts of Interest
References
- Yang, L.; Li, X.X. Analysis of Heavy Metal Pollution in Atmospheric Deposition. J. Xian Jiaotong Univ. 2014, 48, 118–124. (In Chinese) [Google Scholar]
- Vallack, H.W.; Shillito, D.E. Suggested guidelines for deposited ambient dust fall. Atmos. Environ. 1998, 32, 2737–2744. [Google Scholar] [CrossRef]
- Marx, S.K.; Kamber, B.S.; Mcgowan, H.A. Scavenging of atmospheric trace metal pollutants by mineral dust falls: Inter-regional transport of Australian trace metal pollution to New Zealand. Atmos. Environ. 2008, 42, 2460–2478. [Google Scholar] [CrossRef]
- Daintith, J. Oxford Dictionary of Chemistry; Oxford University Press: Oxford, UK, 2008; p. 266. ISBN 978-0-19-92046-32. [Google Scholar]
- Pan, Y.P.; Wang, Y.S. Atmospheric wet and dry deposition of trace elements at 10 sites in Northern China. Atmos. Chem. Phys. 2015, 15, 951–972. [Google Scholar] [CrossRef]
- Lee, P.K.; Choia, B.Y.; Kang, M.J. Assessment of mobility and bio-availability of heavy metals in dry depositions of Asian dust fall and implications for environmental risk. Chemosphere 2015, 119, 1411–1421. [Google Scholar] [CrossRef] [PubMed]
- Kampa, M.; Castanas, E. Human health effects of air pollution. Environ. Pollut. 2008, 151, 362–367. [Google Scholar] [CrossRef] [PubMed]
- Sun, Y.Y.; Hu, X.; Wu, J.C.; Lian, H.Z.; Chen, Y.J. Fractionation and health risks of atmospheric particle-bound As and heavy metals in summer and winter. Sci. Total Environ. 2014, 493, 487–494. [Google Scholar] [PubMed]
- Yu, R.L.; Hu, G.R.; Yuan, X. Development in Research on Pollution Source of Heavy Metals from Atmospheric Dust fall-recognition and Analysis. Earth Environ. 2009, 37, 73–79. (In Chinese) [Google Scholar]
- Arruti, A.; Fernández, O.; Irabien, A. Regional evaluation of particulate matter composition in an Atlantic coastal area (Cantabria region, northern Spain): Spatial variations in different urban and rural environments. Atmos. Res. 2011, 101, 280–293. [Google Scholar] [CrossRef]
- Wong, C.S.C.; Li, X.D.; Zhang, G.; Qi, S.H.; Peng, X.Z. Atmospheric deposition of heavy metals in the Pearl River Delta, China. Atmos. Environ. 2003, 37, 767–776. [Google Scholar] [CrossRef]
- Ayako, O.; Shigenobu, T.; Hajime, O. Atmospheric deposition of trace metals to the western North Pacific Ocean observed at coastal station in Japan. Atmos. Res. 2013, 129–130, 20–32. [Google Scholar]
- Zhang, C.R.; Wu, Z.L.; Tian, H.; Gao, Z.J. Characteristics and sources Analysis of heavy metals in atmospheric dustfall of Qingdao. Environ. Chem. 2014, 33, 1187–1193. (In Chinese) [Google Scholar]
- Liang, J.N.; Liu, J.; Chen, J.; Zhang, J.; Li, W.H.; Gao, M. Characteristics of heavy metals in atmospheric deposition in heating periods of an industrial park in western Shanxi Province, China. Acta Sci. Circumstantiae 2014, 34, 318–324. (In Chinese) [Google Scholar]
- Tang, J.; Han, W.Z.; Li, N.; Li, Z.Y.; Bian, J.M.; Li, H.Y. Multivariate Analysis of Heavy Metal Element Concentrations in Atmospheric Deposition in Harbin City, Northeast China. Spectrosc. Spectr. Anal. 2011, 31, 3087–3091. [Google Scholar]
- Mijic, Z.; Stojic, A.; Perisic, M.; Rajšić, S.; Tasić, M.; Radenković, M.; Joksić, J. Seasonal variability and source apportionment of metals in the atmospheric deposition in Belgrade. Atmos. Environ. 2010, 44, 3630–3637. [Google Scholar] [CrossRef]
- Huang, S.S.; Tu, J.; Liu, H.Y.; Hua, M.; Liao, Q.L.; Feng, J.S.; Weng, Z.H.; Huang, G.M. Multivariate analysis of trace element concentrations in atmospheric deposition in the Yangtze River Delta, East China. Atmos. Environ. 2009, 43, 5781–5790. [Google Scholar] [CrossRef]
- Li, P.; Xue, L.Y.; Wang, S.L.; Nan, Z.R. Pollution Evaluation and Health Risk Assessment of Heavy Metals from Atmospheric Deposition in Lanzhou. Environ. Sci. 2014, 35, 1021–1028. (In Chinese) [Google Scholar]
- Tang, R.L.; Ma, K.M.; Zhang, Y.X.; Mao, Q. Health risk assessment of heavy metals of street dustfall in Beijing. Acta Sci. Circumstantiae 2012, 32, 2006–2015. (In Chinese) [Google Scholar]
- Meza-Montenegro, M.M.; Gandol, A.J.; Santana-Alcántar, M.E.; Klimecki, W.T.; Aguilar-Apodaca, M.G.; Del Río-Salas, R.; De la O-Villanueva, M.; Gómez-Alvarez, A.; Mendivil-Quijada, H.; Valencia, M.; et al. Metals in residential soils and cumulative risk assessment in Yaqui and Mayo agricultural valleys, northern Mexico. Sci. Total Environ. 2012, 433, 472–481. [Google Scholar] [CrossRef] [PubMed]
- Yang, X.Z.; Chen, Y.; Xu, D.D.; He, T.T.; Ma, L.L.; Li, J.; Nie, C.M. Characteristics of heavy metal pollution and health risk assessment in subway dustfall in Beijing. China Environ. Sci. 2011, 31, 944–950. (In Chinese) [Google Scholar]
- Li, X.L.; Zhou, T.F.; Yin, H.Q.; Zhang, X.; Yuan, F.; Fan, Y.; Chen, Y.N.; Chen, X.R.; Chen, F.R.; Jia, S.J. Sources Analysis of Dustfall in Tong ling City Based on Hierarchical Cluster Analysis and Principal Component Analysis Methods. Geol. Rev. 2010, 56, 283–288. (In Chinese) [Google Scholar]
- Wong, C.S.C.; Li, X.; Thornton, I. Urban environmental geochemistry of trace metals. Environ. Pollut. 2006, 142, 1–16. [Google Scholar] [CrossRef] [PubMed]
- Weight Determination Method of Environmental Air Dust. Available online: http://www.zjepb.gov.cn/root14/hbt/kjyhzc/200911/t20091103_14023.html (accessed on 29 September 2017).
- Ministry of Environmental Protection, General Administration of National Quality Supervision, Inspection and Quarantine. National Environmental Soil Quality Standard GB15618-2009; China Environmental Science Press: Beijing, China, 2009. (In Chinese)
- Kuang, C.; Neumann, T.; Norra, S.; Stüben, D. Land use-related chemical composition of street sediments in Beijing. Environ. Sci. Pollut. Res. 2004, 11, 73–83. [Google Scholar] [CrossRef]
- Xiong, Q.L.; Zhao, W.J.; Wang, H.F.; Zhao, J.Y.; Wang, H.H.; Sun, C.Y.; Zhang, Q.Z. Pollution Characteristics and Source Analysis of Metal Elements in PM2.5 during Spring in Beijing. Ecol. Environ. Sci. 2016, 25, 1181–1187. (In Chinese) [Google Scholar]
- Wei, F.S.; Yang, G.Z.; Jiang, D.Z.; Zheng, C.J. Basic statistics and characteristics of China’s Soil background values. China Environ. Monit. 1991, 7, 1–6. (In Chinese) [Google Scholar]
- Xiong, Q.L.; Zhao, W.J.; Guo, X.Y.; Shu, T.T.; Chen, F.T.; Zheng, X.X.; Gong, Z.N. Dustfall Heavy Metal Pollution during Winter in North China. Bull. Environ. Contam. Toxicol. 2015, 95, 548–554. [Google Scholar] [CrossRef] [PubMed]
- Xiong, Q.L.; Zhao, W.J.; Guo, X.Y.; Chen, F.T.; Shu, T.T.; Zheng, X.X.; Zhao, W.H. Distribution Characteristics and Source Analysis of Dustfall Trace Elements during Winter in Beijing. Environ. Sci. 2015, 36, 2735–2742. [Google Scholar]
- Xiong, Q.L.; Zhao, J.Y.; Zhao, W.J.; Wang, H.-F.; Li, W.-W.; Yu, X.; Ou, Y.; Yang, X.-C. Pollution characteristics and potential ecological risks of heavy metals in topsoil of Beijing. China Environ. Sci. 2017, 37, 2211–2221. (In Chinese) [Google Scholar]
- Hakanson, L. An ecological risk index for aquatic pollution control a sedimentological approach. Water Res. 1980, 14, 975–1001. [Google Scholar] [CrossRef]
- United States Environmental Protection Agency (USEPA). Acceleration Simulation Mode Test Procedures. Emission Standards, Quality Control Requirements, and Equipment Specification Technical Guidance; USEPA: Washington, DC, USA, 2000.
- Fang, H.D.; Chen, J.F.; Duan, J.M.; Chen, J.S.; Lin, Q.J.; Chen, S.H. Speciation Characteristics and Bioavailability of Heavy Metal Elements in PM2.5 and PM10 in the Suburbs of Xiamen. Ecol. Environ. Sci. 2015, 24, 1872–1877. [Google Scholar]

| Heavy Metal | Min | Max | Extreme Ratio | Mean | Median | SD | C.V |
|---|---|---|---|---|---|---|---|
| Bi | 0.8 | 9.9 | 13 | 3.4 | 2.8 | 1.9 | 56% |
| Cd | 0.9 | 13.1 | 14.6 | 3 | 2.7 | 2.03 | 67% |
| Co | 10.9 | 41.4 | 3.8 | 15.4 | 14.7 | 4.9 | 32% |
| Cr | 85.9 | 1242.1 | 14.5 | 195.9 | 130.4 | 259.72 | 33% |
| Cu | 75.9 | 523.7 | 6.9 | 239.2 | 218.5 | 108.6 | 45% |
| Mo | 2.9 | 38.6 | 13.4 | 9.9 | 9.5 | 5.98 | 61% |
| Ni | 30.7 | 95.8 | 3.1 | 61.2 | 54.4 | 16.97 | 28% |
| Pb | 40.3 | 500 | 12.4 | 147.1 | 109.6 | 111.26 | 76% |
| V | 53.4 | 124.1 | 2.3 | 80.7 | 80 | 13.58 | 17% |
| Zn | 234.6 | 1000 | 4.3 | 713.2 | 654.3 | 249.18 | 35% |
| Tb | 0.4 | 0.9 | 2.3 | 0.6 | 0.6 | 0.09 | 15% |
| Heavy Metal | Min | Max | Extreme Ratio | Mean | Median | SD | C.V |
|---|---|---|---|---|---|---|---|
| Bi | 0.9 | 4.6 | 5.3 | 1.9 | 1.7 | 0.97 | 50% |
| Cd | 1.1 | 3.4 | 3.1 | 1.9 | 1.8 | 0.64 | 34% |
| Co | 12.7 | 34.4 | 2.7 | 17.7 | 15.1 | 7.27 | 41% |
| Cr | 92.9 | 199 | 2.1 | 125.1 | 109.1 | 35.92 | 29% |
| Cu | 85.9 | 200.5 | 2.3 | 131.9 | 114.8 | 39.68 | 30% |
| Mo | 3.3 | 11.6 | 3.5 | 5.3 | 4.6 | 2.24 | 42% |
| Ni | 34.6 | 80.5 | 2.3 | 48.8 | 44.9 | 11.78 | 24% |
| Pb | 61.8 | 136.1 | 2.2 | 91.6 | 86.6 | 22 | 24% |
| V | 63.6 | 90 | 1.4 | 80.9 | 81.7 | 7.34 | 9% |
| Zn | 262.8 | 1000 | 3.8 | 514.5 | 433.7 | 246.05 | 48% |
| Tb | 0.5 | 0.7 | 1.6 | 0.6 | 0.6 | 0.07 | 11% |
| EF Values | EF ≤ 1 | 1 < EF ≤ 10 | 10 < EF ≤ 100 | 100 < EF ≤ 1000 | EF > 1000 |
|---|---|---|---|---|---|
| Level | Rarely enriched | Mildly enriched | Moderately enriched | Highly enriched | Extremely enriched |
| Rank | 1 | 2 | 3 | 4 | 5 |
| Source | Soil and crust source | Natural and artificial sources | artificial source | artificial source | artificial source |
| Heavy Metal | Reference | Urban Dust | SuburbanDust | ||||
|---|---|---|---|---|---|---|---|
| Mean | EF | Level | Mean | EF | Level | ||
| Bi | 0.4 | 2.2 | 1 | rarely enriched | 3 | 1 | rarely enriched |
| Cd | 0.1 | 5.3 | 2 | mildly enriched | 2.7 | 2 | mildly enriched |
| Co | 12.7 | 10.5 | 12 | moderately enriched | 16 | 6 | mildly enriched |
| Cr | 61 | 91.5 | 10 | mildly enriched | 177.1 | 7 | mildly enriched |
| Cu | 22.6 | 107.1 | 1 | rarely enriched | 210.7 | 1 | rarely enriched |
| Mo | 2 | 5.6 | 3 | mildly enriched | 8.7 | 2 | mildly enriched |
| Ni | 26.9 | 35.8 | 1 | rarely enriched | 57.9 | 1 | rarely enriched |
| Pb | 26 | 177.2 | 1 | rarely enriched | 132.4 | 1 | rarely enriched |
| V | 75.5 | 80.7 | 2 | mildly enriched | 59.2 | 1 | rarely enriched |
| Zn | 74.2 | 822 | 6 | mildly enriched | 660.5 | 3 | mildly enriched |
| Igeo Values | Igeo ≤ 0 | 0 < Igeo ≤ 1 | 1 < Igeo ≤ 2 | 2 < Igeo ≤ 3 | 3 < Igeo ≤ 4 | 4 < Igeo ≤ 5 | Igeo > 5 |
|---|---|---|---|---|---|---|---|
| Rank | 0 | 1 | 2 | 3 | 4 | 5 | 6 |
| Pollution levels | No pollution | Mild pollution | Light pollution | Moderate pollution | High pollution | Heavy pollution | Extreme pollution |
| Heavy Metal | Reference | Urban Dust | Surburban Dust | ||||
|---|---|---|---|---|---|---|---|
| Igeo | Rank | Pollution Level | Igeo | Rank | Pollution Level | ||
| Bi | 0.4 | 2.3 | 3 | Moderate pollution | 1.7 | 2 | Light pollution |
| Cd | 0.1 | 4.2 | 5 | Heavy pollution | 3.6 | 4 | High pollution |
| Co | 12.7 | −0.4 | 0 | No pollution | −0.3 | 0 | No pollution |
| Cr | 61 | 0.6 | 1 | Mild pollution | 0.6 | 1 | Mild pollution |
| Cu | 22.6 | 2.7 | 3 | Moderate pollution | 2 | 3 | Moderate pollution |
| Mo | 2 | 1.6 | 2 | Light pollution | 0.8 | 1 | Mild pollution |
| Ni | 26.9 | 0.5 | 1 | Mild pollution | 0.3 | 1 | Mild pollution |
| Pb | 26 | 1.7 | 2 | Light pollution | 1.2 | 2 | Light pollution |
| V | 75.5 | −0.5 | 0 | No pollution | −0.9 | 0 | No pollution |
| Zn | 74.2 | 2.6 | 3 | Moderate pollution | 2.2 | 3 | Moderate pollution |
| Single Ecological Damage | Total Ecological Risk | ||
|---|---|---|---|
| <10 | No damage | <50 | No risk |
| 10–40 | Mild damage | 50–150 | Mild risk |
| 40–80 | Moderate damage | 150–300 | Moderate risk |
| 80–160 | High damage | 300–600 | High risk |
| 160–320 | Serious damage | 600–1200 >1200 | Serious risk Extreme risk |
| >320 | Extreme damage |
| Heavy Metal | TC | Urban Dust | Suburban Dust | ||||
|---|---|---|---|---|---|---|---|
| PC | ED | PC | ED | ||||
| Cd | 30 | 33 | 988 | Extreme damage | 20 | 599 | Extreme damage |
| Co | 5 | 1 | 5 | No damage | 1 | 5 | No damage |
| Cr | 2 | 3 | 5 | No damage | 3 | 5 | No damage |
| Cu | 5 | 11 | 56 | Moderate damage | 6 | 29 | Mild damage |
| Ni | 5 | 2 | 11 | Mild damage | 2 | 9 | No damage |
| Pb | 5 | 6 | 30 | Mild damage | 4 | 22 | Mild damage |
| V | 2 | 1 | 2 | No damage | 1 | 2 | No damage |
| Zn | 1 | 7 | 7 | No damage | 6 | 6 | No damage |
| RI | - | - | 1104 | Serious risk | - | 678 | Serious risk |
© 2017 by the authors. Licensee MDPI, Basel, Switzerland. This article is an open access article distributed under the terms and conditions of the Creative Commons Attribution (CC BY) license (http://creativecommons.org/licenses/by/4.0/).
Share and Cite
Xiong, Q.; Zhao, W.; Zhao, J.; Zhao, W.; Jiang, L. Concentration Levels, Pollution Characteristics and Potential Ecological Risk of Dust Heavy Metals in the Metropolitan Area of Beijing, China. Int. J. Environ. Res. Public Health 2017, 14, 1159. https://doi.org/10.3390/ijerph14101159
Xiong Q, Zhao W, Zhao J, Zhao W, Jiang L. Concentration Levels, Pollution Characteristics and Potential Ecological Risk of Dust Heavy Metals in the Metropolitan Area of Beijing, China. International Journal of Environmental Research and Public Health. 2017; 14(10):1159. https://doi.org/10.3390/ijerph14101159
Chicago/Turabian StyleXiong, Qiulin, Wenji Zhao, Jiayin Zhao, Wenhui Zhao, and Lei Jiang. 2017. "Concentration Levels, Pollution Characteristics and Potential Ecological Risk of Dust Heavy Metals in the Metropolitan Area of Beijing, China" International Journal of Environmental Research and Public Health 14, no. 10: 1159. https://doi.org/10.3390/ijerph14101159
APA StyleXiong, Q., Zhao, W., Zhao, J., Zhao, W., & Jiang, L. (2017). Concentration Levels, Pollution Characteristics and Potential Ecological Risk of Dust Heavy Metals in the Metropolitan Area of Beijing, China. International Journal of Environmental Research and Public Health, 14(10), 1159. https://doi.org/10.3390/ijerph14101159