
Effect of Age on Glasgow Coma Scale in Patients with Moderate and Severe Traumatic Brain Injury: An Approach with Propensity Score-Matched Population


 ,
, 
Abstract
:1. Background
2. Methods
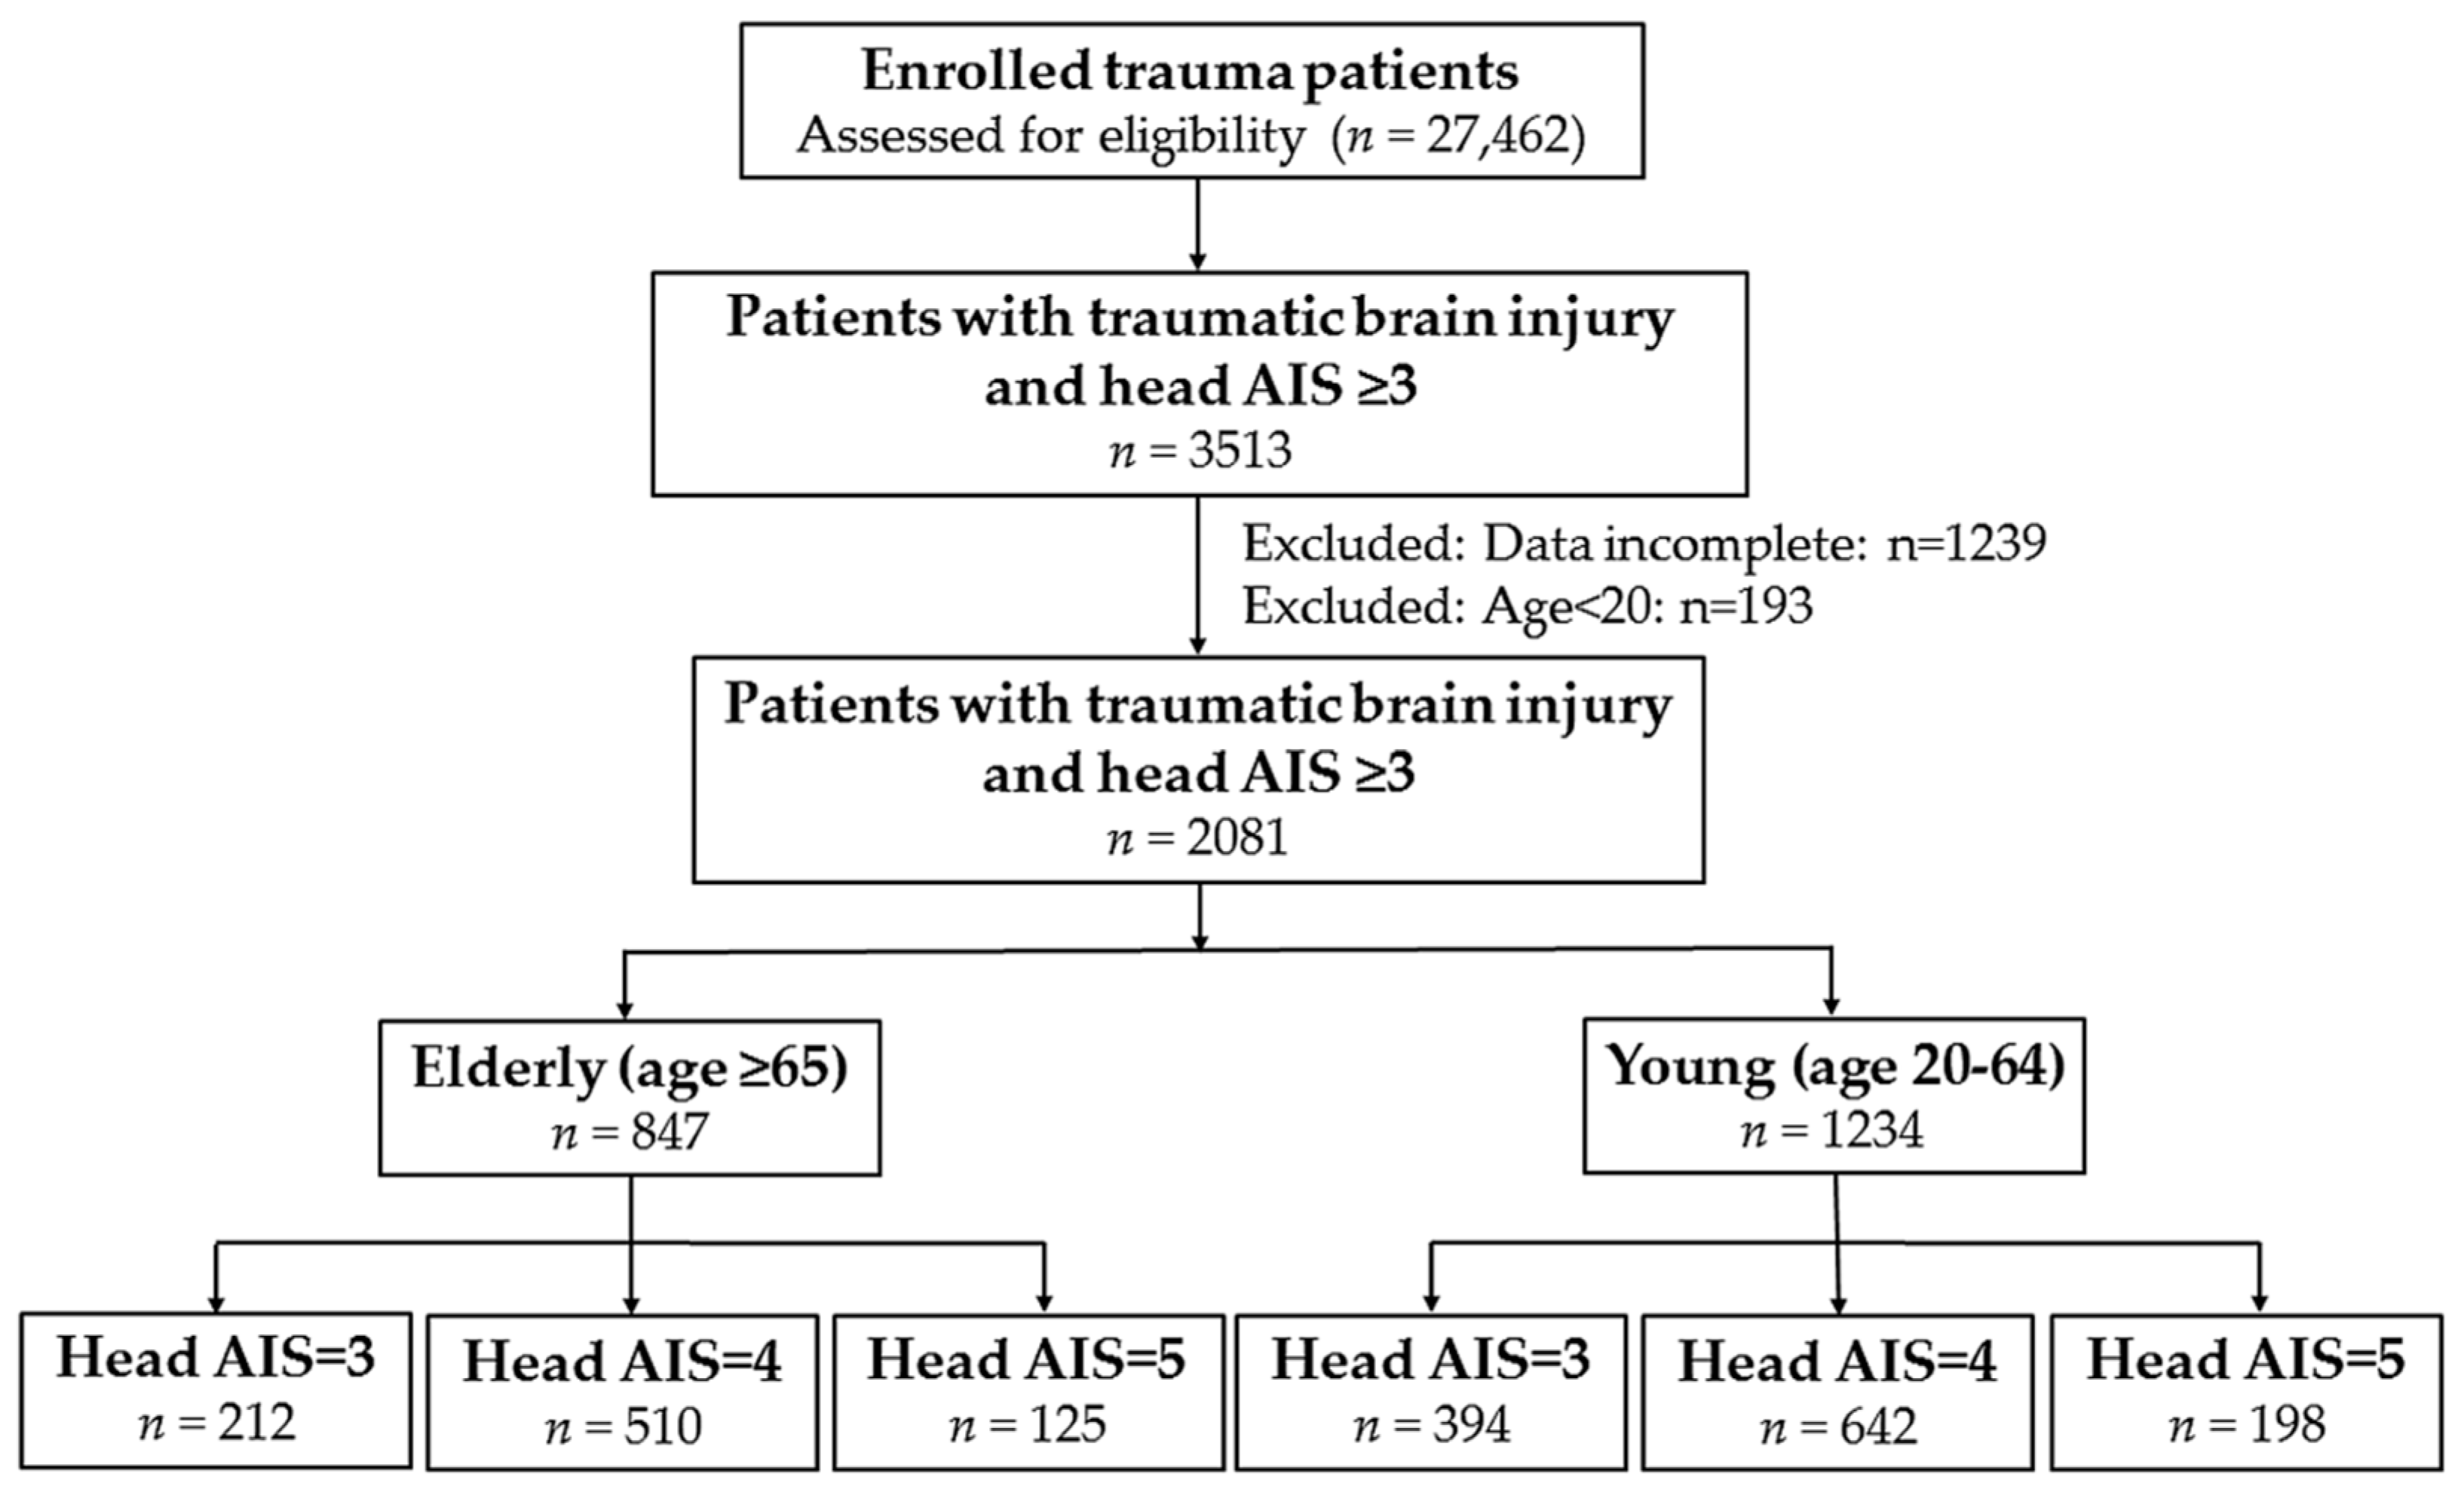
2.1. Study Population
2.2. Statistical Analysis
3. Results
3.1. Characteristics and Outcomes of TBI Patients with Head AIS of 3
3.2. Characteristics and Outcomes of TBI Patients with Head AIS of 4
3.3. Characteristics and Outcomes of TBI Patients with Head AIS of 5
3.4. Comparison of Propensity-Score Matched Patients with Different Head AIS
4. Discussion
5. Conclusions
Acknowledgments
Author Contributions
Conflicts of Interest
References
- Fu, T.S.; Jing, R.; McFaull, S.R.; Cusimano, M.D. Recent trends in hospitalization and in-hospital mortality associated with traumatic brain injury in Canada: A nationwide, population-based study. J. Trauma Acute Care Surg. 2015, 79, 449–454. [Google Scholar] [CrossRef] [PubMed]
- Teasdale, G.; Jennett, B. Assessment of coma and impaired consciousness. A practical scale. Lancet 1974, 2, 81–84. [Google Scholar] [CrossRef]
- Singh, B.; Murad, M.H.; Prokop, L.J.; Erwin, P.J.; Wang, Z.; Mommer, S.K.; Mascarenhas, S.S.; Parsaik, A.K. Meta-analysis of Glasgow coma scale and simplified motor score in predicting traumatic brain injury outcomes. Brain Inj. 2013, 27, 293–300. [Google Scholar] [CrossRef] [PubMed]
- Salottolo, K.; Levy, A.S.; Slone, D.S.; Mains, C.W.; Bar-Or, D. The effect of age on Glasgow Coma Scale score in patients with traumatic brain injury. JAMA Surg. 2014, 149, 727–734. [Google Scholar] [CrossRef] [PubMed]
- Moore, L.; Lavoie, A.; Camden, S.; Le Sage, N.; Sampalis, J.S.; Bergeron, E.; Abdous, B. Statistical validation of the Glasgow Coma Score. J. Trauma 2006, 60, 1238–1243. [Google Scholar] [CrossRef] [PubMed]
- McNett, M. A review of the predictive ability of Glasgow Coma Scale scores in head-injured patients. J. Neurosci. Nurs. 2007, 39, 68–75. [Google Scholar] [CrossRef] [PubMed]
- Teasdale, G.; Murray, G.; Parker, L.; Jennett, B. Adding up the Glasgow Coma Score. Acta Neurochir. Suppl. 1979, 28, 13–16. [Google Scholar] [PubMed]
- Mamelak, A.N.; Pitts, L.H.; Damron, S. Predicting survival from head trauma 24 hours after injury: A practical method with therapeutic implications. J. Trauma 1996, 41, 91–99. [Google Scholar] [CrossRef] [PubMed]
- Ross, S.E.; Leipold, C.; Terregino, C.; O’Malley, K.F. Efficacy of the motor component of the Glasgow Coma Scale in trauma triage. J. Trauma 1998, 45, 42–44. [Google Scholar] [CrossRef] [PubMed]
- Healey, C.; Osler, T.M.; Rogers, F.B.; Healey, M.A.; Glance, L.G.; Kilgo, P.D.; Shackford, S.R.; Meredith, J.W. Improving the Glasgow Coma Scale score: Motor score alone is a better predictor. J. Trauma 2003, 54, 671–678. [Google Scholar] [CrossRef] [PubMed]
- Sasser, S.M.; Hunt, R.C.; Faul, M.; Sugerman, D.; Pearson, W.S.; Dulski, T.; Wald, M.M.; Jurkovich, G.J.; Newgard, C.D.; Lerner, E.B. Guidelines for field triage of injured patients: Recommendations of the National Expert Panel on Field Triage, 2011. MMWR Recomm. Rep. 2012, 61, 1–20. [Google Scholar] [PubMed]
- Bledsoe, B.E.; Casey, M.J.; Feldman, J.; Johnson, L.; Diel, S.; Forred, W.; Gorman, C. Glasgow Coma Scale Scoring is Often Inaccurate. Prehosp. Disaster Med. 2015, 30, 46–53. [Google Scholar] [CrossRef] [PubMed]
- Feldman, A.; Hart, K.W.; Lindsell, C.J.; McMullan, J.T. Randomized controlled trial of a scoring aid to improve Glasgow Coma Scale scoring by emergency medical services providers. Ann. Emerg. Med. 2015, 65, 325–329. [Google Scholar] [CrossRef] [PubMed]
- Kehoe, A.; Rennie, S.; Smith, J.E. Glasgow Coma Scale is unreliable for the prediction of severe head injury in elderly trauma patients. Emerg. Med. J. 2015, 32, 613–615. [Google Scholar] [CrossRef] [PubMed]
- Kehoe, A.; Smith, J.E.; Bouamra, O.; Edwards, A.; Yates, D.; Lecky, F. Older patients with traumatic brain injury present with a higher GCS score than younger patients for a given severity of injury. Emerg. Med. J. 2016, 33, 381–385. [Google Scholar] [CrossRef] [PubMed]
- Potter, D.; Kehoe, A.; Smith, J.E. The sensitivity of pre-hospital and in-hospital tools for the identification of major trauma patients presenting to a major trauma centre. J. R. Nav. Med. Serv. 2013, 99, 16–19. [Google Scholar] [PubMed]
- Caterino, J.M.; Raubenolt, A.; Cudnik, M.T. Modification of Glasgow Coma Scale criteria for injured elders. Acad. Emerg. Med. 2011, 18, 1014–1021. [Google Scholar] [CrossRef] [PubMed]
- Yee, K.F.; Walker, A.M. The Effect of Hemoglobin Levels on Mortality in Pediatric Patients with Severe Traumatic Brain Injury. Can. Respir. J. 2016, 2016, 6803860. [Google Scholar] [CrossRef] [PubMed]
- Sekhon, M.S.; McLean, N.; Henderson, W.R.; Chittock, D.R.; Griesdale, D.E. Association of hemoglobin concentration and mortality in critically ill patients with severe traumatic brain injury. Crit. Care 2012, 16, R128. [Google Scholar] [CrossRef] [PubMed]
- Wu, X.; Lu, X.; Lu, X.; Yu, J.; Sun, Y.; Du, Z.; Wu, X.; Mao, Y.; Zhou, L.; Wu, S.; et al. Prevalence of severe hypokalaemia in patients with traumatic brain injury. Injury 2015, 46, 35–41. [Google Scholar] [CrossRef] [PubMed]
- Meng, X.; Shi, B. Traumatic Brain Injury Patients with a Glasgow Coma Scale Score of </=8, Cerebral Edema, and/or a Basal Skull Fracture are More Susceptible to Developing Hyponatremia. J. Neurosurg. Anesthesiol. 2016, 28, 21–26. [Google Scholar] [CrossRef] [PubMed]
- Lohani, S.; Devkota, U.P. Hyponatremia in patients with traumatic brain injury: Etiology, incidence, and severity correlation. World Neurosurg. 2011, 76, 355–360. [Google Scholar] [CrossRef] [PubMed]
- Kotera, A.; Iwashita, S.; Irie, H.; Taniguchi, J.; Kasaoka, S.; Kinoshita, Y. An analysis of the relationship between Glasgow Coma Scale score and plasma glucose level according to the severity of hypoglycemia. J. Intensiv. Care 2014, 2, 1. [Google Scholar] [CrossRef] [PubMed]
- Brady, W.J.; Butler, K.; Fines, R.; Young, J. Hypoglycemia in multiple trauma victims. Am. J. Emerg. Med. 1999, 17, 4–5. [Google Scholar] [CrossRef]
- Osler, T.; Cook, A.; Glance, L.G.; Lecky, F.; Bouamra, O.; Garrett, M.; Buzas, J.S.; Hosmer, D.W. The differential mortality of Glasgow Coma Score in patients with and without head injury. Injury 2016, 47, 1879–1885. [Google Scholar] [CrossRef] [PubMed]
- Ronning, P.; Gunstad, P.O.; Skaga, N.O.; Langmoen, I.A.; Stavem, K.; Helseth, E. The impact of blood ethanol concentration on the classification of head injury severity in traumatic brain injury. Brain Inj. 2015, 29, 1648–1653. [Google Scholar] [CrossRef] [PubMed]
- Hsieh, C.H.; Hsu, S.Y.; Hsieh, H.Y.; Chen, Y.C. Differences between the sexes in motorcycle-related injuries and fatalities at a Taiwanese level I trauma center. Biomed. J. 2017, 40, 113–120. [Google Scholar] [CrossRef] [PubMed]
- Hsieh, C.H.; Liu, H.T.; Hsu, S.Y.; Hsieh, H.Y.; Chen, Y.C. Motorcycle-related hospitalizations of the elderly. Biomed. J. 2017, 40, 121–128. [Google Scholar] [CrossRef] [PubMed]
- CoMAoA, Safety. Rating the severity of tissue damage. I. The abbreviated scale. JAMA 1971, 215, 277–280. [Google Scholar]
- Savitsky, B.; Givon, A.; Rozenfeld, M.; Radomislensky, I.; Peleg, K. Traumatic brain injury: It is all about definition. Brain Inj. 2016, 30, 1194–1200. [Google Scholar] [CrossRef] [PubMed]
- Mosenthal, A.C.; Lavery, R.F.; Addis, M.; Kaul, S.; Ross, S.; Marburger, R.; Deitch, E.A.; Livingston, D.H. Isolated traumatic brain injury: Age is an independent predictor of mortality and early outcome. J. Trauma 2002, 52, 907–911. [Google Scholar] [CrossRef] [PubMed]
- Mosenthal, A.C.; Livingston, D.H.; Lavery, R.F.; Knudson, M.M.; Lee, S.; Morabito, D.; Manley, G.T.; Nathens, A.; Jurkovich, G.; Hoyt, D.B.; et al. The effect of age on functional outcome in mild traumatic brain injury: 6-month report of a prospective multicenter trial. J. Trauma 2004, 56, 1042–1048. [Google Scholar] [CrossRef] [PubMed]
- Susman, M.; DiRusso, S.M.; Sullivan, T.; Risucci, D.; Nealon, P.; Cuff, S.; Haider, A.; Benzil, D. Traumatic brain injury in the elderly: Increased mortality and worse functional outcome at discharge despite lower injury severity. J. Trauma 2002, 53, 219–223. [Google Scholar] [CrossRef] [PubMed]
- Dhandapani, S.; Manju, D.; Sharma, B.; Mahapatra, A. Prognostic significance of age in traumatic brain injury. J. Neurosci. Rural Pract. 2012, 3, 131–135. [Google Scholar] [CrossRef] [PubMed]
- Karnath, B. Subdural hematoma. Presentation and management in older adults. Geriatrics 2004, 59, 18–23. [Google Scholar] [PubMed]
- Sheridan, P.L.; Hausdorff, J.M. The role of higher-level cognitive function in gait: Executive dysfunction contributes to fall risk in Alzheimer’s disease. Dement. Geriatr. Cogn. Disord. 2007, 24, 125–137. [Google Scholar] [CrossRef] [PubMed]
- Moore, M.M.; Pasquale, M.D.; Badellino, M. Impact of age and anticoagulation: Need for neurosurgical intervention in trauma patients with mild traumatic brain injury. J. Trauma Acute Care Surg. 2012, 73, 126–130. [Google Scholar] [CrossRef] [PubMed]
- Stiell, I.G.; Wells, G.A.; Vandemheen, K.; Clement, C.; Lesiuk, H.; Laupacis, A.; McKnight, R.D.; Verbeek, R.; Brison, R.; Cass, D.; et al. The Canadian CT Head Rule for patients with minor head injury. Lancet 2001, 357, 1391–1396. [Google Scholar] [CrossRef]
- Ciccone, M.M.; Aquilino, A.; Cortese, F.; Scicchitano, P.; Sassara, M.; Mola, E.; Rollo, R.; Caldarola, P.; Giorgino, F.; Pomo, V.; et al. Feasibility and effectiveness of a disease and care management model in the primary health care system for patients with heart failure and diabetes (Project Leonardo). Vasc. Health Risk Manag. 2010, 6, 297–305. [Google Scholar] [CrossRef] [PubMed]
- Lai, W.H.; Rau, C.S.; Hsu, S.Y.; Wu, S.C.; Kuo, P.J.; Hsieh, H.Y.; Chen, Y.C.; Hsieh, C.H. Using the Reverse Shock Index at the Injury Scene and in the Emergency Department to Identify High-Risk Patients: A Cross-Sectional Retrospective Study. Int. J. Environ. Res. Public Health 2016, 13, 357. [Google Scholar] [CrossRef] [PubMed]
- Huang, C.Y.; Rau, C.S.; Chuang, J.F.; Kuo, P.J.; Hsu, S.Y.; Chen, Y.C.; Hsieh, H.Y.; Hsieh, C.H. Characteristics and Outcomes of Patients Injured in Road Traffic Crashes and Transported by Emergency Medical Services. Int. J. Environ. Res. Public Health 2016, 13, 236. [Google Scholar] [CrossRef] [PubMed]
- Wells, A.R.; Hamar, B.; Bradley, C.; Gandy, W.M.; Harrison, P.L.; Sidney, J.A.; Coberley, C.R.; Rula, E.Y.; Pope, J.E. Exploring robust methods for evaluating treatment and comparison groups in chronic care management programs. Popul. Health Manag. 2013, 16, 35–45. [Google Scholar] [CrossRef] [PubMed]


| Variables | Elderly n = 212 | Young n = 394 | Odds Ratio (95% CI) | p | |||
|---|---|---|---|---|---|---|---|
| Gender, n (%) | 0.548 | ||||||
| Male | 116 | (54.7) | 227 | (57.6) | 0.9 | (0.64–1.24) | |
| Female | 96 | (45.3) | 167 | (42.4) | 1.1 | (0.84–1.58) | |
| Co-morbidities, n (%) | |||||||
| DM | 58 | (27.4) | 35 | (8.9) | 3.9 | (2.44–6.12) | <0.001 |
| HTN | 107 | (50.5) | 70 | (17.8) | 4.8 | (3.25–6.85) | <0.001 |
| CAD | 18 | (8.5) | 4 | (1.0) | 9.0 | (3.02–27.10) | <0.001 |
| CHF | 6 | (2.8) | 1 | (0.3) | 11.4 | (1.37–95.72) | 0.009 |
| CVA | 24 | (11.3) | 6 | (1.5) | 8.3 | (3.32–20.54) | <0.001 |
| ESRD | 4 | (1.9) | 3 | (0.8) | 2.5 | (0.56–11.31) | 0.247 |
| COPD | 5 | (2.4) | 1 | (0.3) | 9.5 | (1.10–81.79) | 0.022 |
| Mechanisms, n (%) | |||||||
| Driver of MV | 3 | (1.4) | 4 | (1.0) | 1.4 | (0.31–6.31) | 0.700 |
| Passenger of MV | 0 | (0.0) | 6 | (1.5) | – | 0.096 | |
| Driver of Motorcycle | 75 | (35.4) | 283 | (71.8) | 0.2 | (0.15–0.31) | <0.001 |
| Passenger of Motorcycle | 4 | (1.9) | 12 | (3.0) | 0.6 | (0.20–1.92) | 0.443 |
| Bicycle | 18 | (8.5) | 11 | (2.8) | 3.2 | (1.50–6.98) | 0.003 |
| Pedestrian | 16 | (7.5) | 11 | (2.8) | 2.8 | (1.29–6.24) | 0.008 |
| Fall | 94 | (44.3) | 53 | (13.5) | 5.1 | (3.45–7.62) | <0.001 |
| Strike by/against | 2 | (0.9) | 14 | (3.6) | 0.3 | (0.06–1.15) | 0.064 |
| SBP (mmHg) | 165.1 | ±34.8 | 143.7 | ±30.5 | – | <0.001 | |
| Hb (mg/dL) | 12.6 | ±1.9 | 13.6 | ±2.4 | – | <0.001 | |
| Na (mg/dL) | 137.9 | ±4.1 | 138.8 | ±2.8 | – | 0.001 | |
| Glucose (mg/dL) | 156.4 | ±67.9 | 147.4 | ±52.9 | – | 0.073 | |
| Alcohol > 50, n (%) | 4 | (1.9) | 79 | (20.1) | 0.1 | (0.03–0.21) | <0.001 |
| Alcohol level | 158.5 | ±51.0 | 187.2 | ±80.9 | – | 0.487 | |
| GCS | 14.1 | ±2.0 | 12.9 | ±3.4 | – | <0.001 | |
| ≤8, n (%) | 9 | (4.2) | 65 | (16.5) | 0.3 | (0.10–0.43) | <0.001 |
| 9–12, n (%) | 14 | (6.6) | 45 | (11.4) | 0.5 | (0.25–0.88) | 0.010 |
| ≥13, n (%) | 189 | (89.2) | 284 | (72.1) | – | – | |
| Motor response of GCS | 5.7 | ±0.7 | 5.4 | ±1.1 | – | <0.001 | |
| ISS (median, IQR) | 9 | (9–13) | 13 | (9–14) | – | 0.021 | |
| Mortality, n (%) | 7 | (3.3) | 8 | (2.0) | 1.6 | (0.59–4.61) | 0.412 |
| Variables | Elderly n = 510 | Young n = 642 | Odds Ratio (95% CI) | p | |||
|---|---|---|---|---|---|---|---|
| Gender, n (%) | <0.001 | ||||||
| Male | 270 | (52.9) | 442 | (68.8) | 0.5 | (0.40–0.65) | |
| Female | 240 | (47.1) | 200 | (31.2) | 2.0 | (1.54–2.50) | |
| Co-morbidities, n (%) | |||||||
| DM | 152 | (29.8) | 75 | (11.7) | 3.2 | (2.36–4.36) | <0.001 |
| HTN | 263 | (51.6) | 129 | (20.1) | 4.2 | (3.27–5.49) | <0.001 |
| CAD | 62 | (12.2) | 11 | (1.7) | 7.9 | (4.13–15.25) | <0.001 |
| CHF | 6 | (1.2) | 2 | (0.3) | 3.8 | (0.77–18.96) | 0.149 |
| CVA | 61 | (12.0) | 12 | (1.9) | 7.1 | (3.80–13.40) | <0.001 |
| ESRD | 27 | (5.3) | 11 | (1.7) | 3.2 | (1.58–6.53) | 0.001 |
| COPD | 12 | (2.4) | 1 | (0.2) | 15.4 | (2.02–119.19) | <0.001 |
| Mechanisms, n (%) | |||||||
| Driver of MV | 1 | (0.2) | 7 | (1.1) | 0.2 | (0.02–1.45) | 0.084 |
| Passenger of MV | 0 | (0.0) | 7 | (1.1) | – | 0.020 | |
| Driver of Motorcycle | 155 | (30.4) | 379 | (59.0) | 0.3 | (0.24–0.39) | <0.001 |
| Passenger of Motorcycle | 9 | (1.8) | 13 | (2.0) | 0.9 | (0.37–2.05) | 0.831 |
| Bicycle | 35 | (6.9) | 22 | (3.4) | 2.1 | (1.20–3.59) | 0.009 |
| Pedestrian | 21 | (4.1) | 25 | (3.9) | 1.1 | (0.59–1.92) | 0.880 |
| Fall | 283 | (55.5) | 156 | (24.3) | 3.9 | (3.02–4.99) | <0.001 |
| Strike by/against | 6 | (1.2) | 33 | (5.1) | 0.2 | (0.09–0.53) | <0.001 |
| SBP (mmHg) | 166.7 | ±34.6 | 148.7 | ±34.5 | – | <0.001 | |
| Hb (mg/dL) | 12.2 | ±2.0 | 13.5 | ±1.9 | – | <0.001 | |
| Na (mg/dL) | 137.8 | ±4.1 | 138.6 | ±3.7 | – | 0.001 | |
| Glucose (mg/dL) | 165.3 | ±63.9 | 161.6 | ±67.9 | – | 0.345 | |
| Alcohol > 50, n (%) | 3 | (0.6) | 140 | (21.8) | 0.02 | (0.01–0.07) | <0.001 |
| Alcohol level | 237.0 | ±128.2 | 194.3 | ±81.2 | – | 0.374 | |
| GCS | 13.1 | ±3.2 | 11.8 | ±3.9 | – | <0.001 | |
| ≤8, n (%) | 61 | (12.0) | 165 | (25.7) | 0.4 | (0.27–0.52) | <0.001 |
| 9–12, n (%) | 65 | (12.7) | 89 | (13.9) | 0.7 | (0.52–1.05) | 0.094 |
| ≥13, n (%) | 384 | (75.3) | 388 | (60.4) | – | – | |
| Motor response of GCS | 5.4 | ±1.2 | 5.1 | ±1.3 | – | <0.001 | |
| ISS (median, IQR) | 16 | (16–20) | 18 | (16–21) | – | <0.001 | |
| Mortality, n (%) | 38 | (7.5) | 29 | (4.5) | 1.7 | (1.03–2.80) | 0.042 |
| Variables | Elderly n = 125 | Young n = 198 | Odds Ratio (95% CI) | p | |||
|---|---|---|---|---|---|---|---|
| Gender, n (%) | <0.001 | ||||||
| Male | 64 | (51.2) | 144 | (72.7) | 0.4 | (0.25–0.63) | |
| Female | 61 | (48.8) | 54 | (27.3) | 2.5 | (1.59–4.07) | |
| Co-morbidities, n (%) | |||||||
| DM | 33 | (26.4) | 17 | (8.6) | 3.8 | (2.02–7.22) | <0.001 |
| HTN | 58 | (46.4) | 36 | (18.2) | 3.9 | (2.35–6.45) | <0.001 |
| CAD | 18 | (14.4) | 3 | (1.5) | 10.9 | (3.15–37.97) | <0.001 |
| CHF | 1 | (0.8) | 0 | (0.0) | – | 0.149 | |
| CVA | 12 | (9.6) | 2 | (1.0) | 10.4 | (2.29–47.33) | <0.001 |
| ESRD | 7 | (5.6) | 5 | (2.5) | 2.3 | (0.71–7.38) | 0.226 |
| COPD | 3 | (2.4) | 0 | (0.0) | – | 0.057 | |
| Mechanisms, n (%) | |||||||
| Driver of MV | 1 | (0.8) | 4 | (2.0) | 0.4 | (0.04–3.54) | 0.652 |
| Passenger of MV | 0 | (0.0) | 3 | (1.5) | – | 0.286 | |
| Driver of Motorcycle | 35 | (28.0) | 111 | (56.1) | 0.3 | (0.19–0.49) | <0.001 |
| Passenger of Motorcycle | 2 | (1.6) | 6 | (3.0) | 0.5 | (0.10–2.62) | 0.492 |
| Bicycle | 13 | (10.4) | 13 | (6.6) | 1.7 | (0.74–3.69) | 0.293 |
| Pedestrian | 5 | (4.0) | 11 | (5.6) | 0.7 | (0.24–2.09) | 0.608 |
| Fall | 67 | (53.6) | 44 | (22.2) | 4.0 | (2.49–6.57) | <0.001 |
| Strike by/against | 2 | (1.6) | 6 | (3.0) | 0.5 | (0.10–2.62) | 0.492 |
| SBP (mmHg) | 176.3 | ±49.8 | 149.2 | ±47.5 | – | <0.001 | |
| Hb (mg/dL) | 11.9 | ±2.1 | 13.0 | ±2.2 | – | <0.001 | |
| Na (mg/dL) | 137.2 | ±5.0 | 138.9 | ±4.4 | – | 0.002 | |
| Glucose (mg/dL) | 205.8 | ±97.8 | 200.0 | ±97.9 | – | 0.604 | |
| Alcohol > 50, n (%) | 4 | (3.2) | 46 | (23.2) | 0.1 | (0.04–0.31) | <0.001 |
| Alcohol level | 154.8 | ±63.9 | 200.2 | ±64.9 | – | 0.185 | |
| GCS | 7.1 | ±4.3 | 6.4 | ±3.8 | – | 0.158 | |
| ≤8, n (%) | 85 | (68.0) | 154 | (77.8) | 0.7 | (0.36–1.26) | 0.256 |
| 9–12, n (%) | 18 | (14.4) | 17 | (8.6) | 1.3 | (0.55–3.10) | 0.659 |
| ≥13, n (%) | 22 | (17.6) | 27 | (13.6) | – | – | |
| Motor response of GCS | 3.2 | ±1.9 | 3.0 | ±1.8 | – | 0.435 | |
| ISS (median, IQR) | 25 | (25–29) | 25 | (25–33) | – | <0.001 | |
| Mortality, n (%) | 74 | (59.2) | 88 | (44.4) | 1.8 | (1.15–2.86) | 0.012 |
| Elderly n = 162 | Young n = 162 | Odds Ratio (95% CI) | p | Standardized Difference | ||||
|---|---|---|---|---|---|---|---|---|
| Gender, n (%) | 1.0 | (0.65–1.54) | 1.000 | 0.00% | ||||
| Male | 85 | (52.5) | 85 | (52.5) | – | – | – | |
| Female | 77 | (47.5) | 77 | (47.5) | – | – | – | |
| COPD | ||||||||
| Yes | 0 | (0.0) | 0 | (0.0) | – | – | – | |
| No | 162 | (100) | 162 | (100) | – | – | – | |
| SBP (mmHg) | 157.4 | ±31.9 | 156.7 | ±31.5 | – | 0.838 | 2.28% | |
| Hb (mg/dL) | 12.8 | ±1.8 | 12.9 | ±1.9 | – | 0.802 | –2.79% | |
| Na (mg/dL) | 138.4 | ±3.8 | 138.4 | ±3.2 | – | 0.899 | 1.41% | |
| Glucose (mg/dL) | 158.5 | ±72.4 | 155.9 | ±62.0 | – | 0.727 | 3.88% | |
| Alcohol > 50, n (%) | 4 | (2.5) | 4 | (2.5) | 1.0 | (0.25–4.07) | 1.000 | 0.00% |
| GCS | 14.1 | ±2.2 | 13.1 | ±3.3 | – | 0.002 | – | |
| ≤8, n (%) | 8 | (4.9) | 25 | (15.4) | 0.3 | (0.12–0.63) | 0.002 | – |
| 9–12, n (%) | 10 | (6.2) | 13 | (8.0) | 0.7 | (0.28–1.56) | 0.389 | – |
| ≥13, n (%) | 144 | (88.9) | 124 | (76.5) | – | – | – | |
| Motor response | 5.7 | ±0.8 | 5.5 | ±1.0 | – | 0.029 | – | |
| Elderly n = 362 | Young n = 362 | Odds Ratio (95% CI) | p | Standardized Difference | ||||
|---|---|---|---|---|---|---|---|---|
| Gender, n (%) | 1.0 | (0.75–1.34) | 1.000 | 0.00% | ||||
| Male | 202 | (55.8) | 202 | (55.8) | – | – | – | |
| Female | 160 | (44.2) | 160 | (44.2) | – | – | – | |
| COPD | ||||||||
| Yes | 0 | (0.0) | 0 | (0.0) | – | – | – | |
| No | 362 | (100) | 362 | (100) | – | – | – | |
| SBP (mmHg) | 160.1 | ±31.5 | 158.8 | ±32.2 | – | 0.589 | 4.01% | |
| Hb (mg/dL) | 12.7 | ±1.8 | 12.8 | ±1.9 | – | 0.755 | –2.32% | |
| Na (mg/dL) | 138.0 | ±3.7 | 138.0 | ±4.0 | – | 1.000 | 0.00% | |
| Glucose (mg/dL) | 170.2 | ±66.3 | 168.8 | ±65.0 | – | 0.766 | 2.22% | |
| Alcohol > 50, n (%) | 2 | (0.6) | 2 | (0.6) | 1.0 | (0.14–7.14) | 1.000 | 0.00% |
| GCS | 13.1 | ±3.3 | 12.2 | ±3.8 | – | 0.002 | – | |
| ≤8, n (%) | 46 | (12.7) | 79 | (21.8) | 0.5 | (0.34–0.77) | 0.001 | – |
| 9–12, n (%) | 47 | (13.0) | 47 | (13.0) | 0.9 | (0.57–1.36) | 0.575 | – |
| ≥13, n (%) | 269 | (74.3) | 236 | (65.2) | – | – | – | |
| Motor response | 5.4 | ±1.2 | 5.2 | ±1.3 | – | 0.053 | – | |
| Elderly n = 89 | Young n = 89 | Odds Ratio (95% CI) | p | Standardized Difference | ||||
|---|---|---|---|---|---|---|---|---|
| Gender, n (%) | 1.0 | (0.55–1.82) | 1.000 | 0.00% | ||||
| Male | 52 | (58.4) | 52 | (58.4) | – | – | – | |
| Female | 37 | (41.6) | 37 | (41.6) | – | – | – | |
| COPD | – | – | – | |||||
| Yes | 0 | (0.0) | 0 | (0.0) | – | – | – | |
| No | 89 | (100) | 89 | (100) | – | – | – | |
| SBP (mmHg) | 167.3 | ±52.4 | 167.5 | ±45.0 | – | 0.985 | –0.28% | |
| Hb (mg/dL) | 12.1 | ±2.2 | 12.1 | ±2.2 | – | 0.970 | –0.57% | |
| Na (mg/dL) | 138.2 | ±3.9 | 138.1 | ±4.5 | – | 0.789 | 4.02% | |
| Glucose (mg/dL) | 210.0 | ±108.2 | 199.1 | ±89.9 | – | 0.470 | 10.86% | |
| Alcohol > 50, n (%) | 4 | (4.5) | 4 | (4.5) | 1.0 | (0.24–4.13) | 1.000 | 0.00% |
| GCS | 7.0 | ±4.2 | 6.6 | ±4.0 | – | 0.525 | – | |
| ≤8, n (%) | 61 | (68.5) | 67 | (75.3) | 0.9 | (0.38–1.90) | 0.837 | – |
| 9–12, n (%) | 13 | (14.6) | 8 | (9.0) | 1.5 | (0.48–4.76) | 0.569 | – |
| ≥13, n (%) | 15 | (16.9) | 14 | (15.7) | – | – | – | |
| Motor response | 3.2 | ±1.9 | 3.1 | ±1.8 | – | 0.873 | – | |
© 2017 by the authors. Licensee MDPI, Basel, Switzerland. This article is an open access article distributed under the terms and conditions of the Creative Commons Attribution (CC BY) license (http://creativecommons.org/licenses/by/4.0/).
Share and Cite
Rau, C.-S.; Wu, S.-C.; Chen, Y.-C.; Chien, P.-C.; Hsieh, H.-Y.; Kuo, P.-J.; Hsieh, C.-H. Effect of Age on Glasgow Coma Scale in Patients with Moderate and Severe Traumatic Brain Injury: An Approach with Propensity Score-Matched Population. Int. J. Environ. Res. Public Health 2017, 14, 1378. https://doi.org/10.3390/ijerph14111378
Rau C-S, Wu S-C, Chen Y-C, Chien P-C, Hsieh H-Y, Kuo P-J, Hsieh C-H. Effect of Age on Glasgow Coma Scale in Patients with Moderate and Severe Traumatic Brain Injury: An Approach with Propensity Score-Matched Population. International Journal of Environmental Research and Public Health. 2017; 14(11):1378. https://doi.org/10.3390/ijerph14111378
Chicago/Turabian StyleRau, Cheng-Shyuan, Shao-Chun Wu, Yi-Chun Chen, Peng-Chen Chien, Hsiao-Yun Hsieh, Pao-Jen Kuo, and Ching-Hua Hsieh. 2017. "Effect of Age on Glasgow Coma Scale in Patients with Moderate and Severe Traumatic Brain Injury: An Approach with Propensity Score-Matched Population" International Journal of Environmental Research and Public Health 14, no. 11: 1378. https://doi.org/10.3390/ijerph14111378
APA StyleRau, C.-S., Wu, S.-C., Chen, Y.-C., Chien, P.-C., Hsieh, H.-Y., Kuo, P.-J., & Hsieh, C.-H. (2017). Effect of Age on Glasgow Coma Scale in Patients with Moderate and Severe Traumatic Brain Injury: An Approach with Propensity Score-Matched Population. International Journal of Environmental Research and Public Health, 14(11), 1378. https://doi.org/10.3390/ijerph14111378