Cumulative IT Use Is Associated with Psychosocial Stress Factors and Musculoskeletal Symptoms


Abstract
:1. Introduction
2. Materials and Methods
2.1. Study Design and Participants
2.2. Questionnaire Design
2.3. Data Analysis
3. Results
3.1. Cumulative Exposure to IT Devices
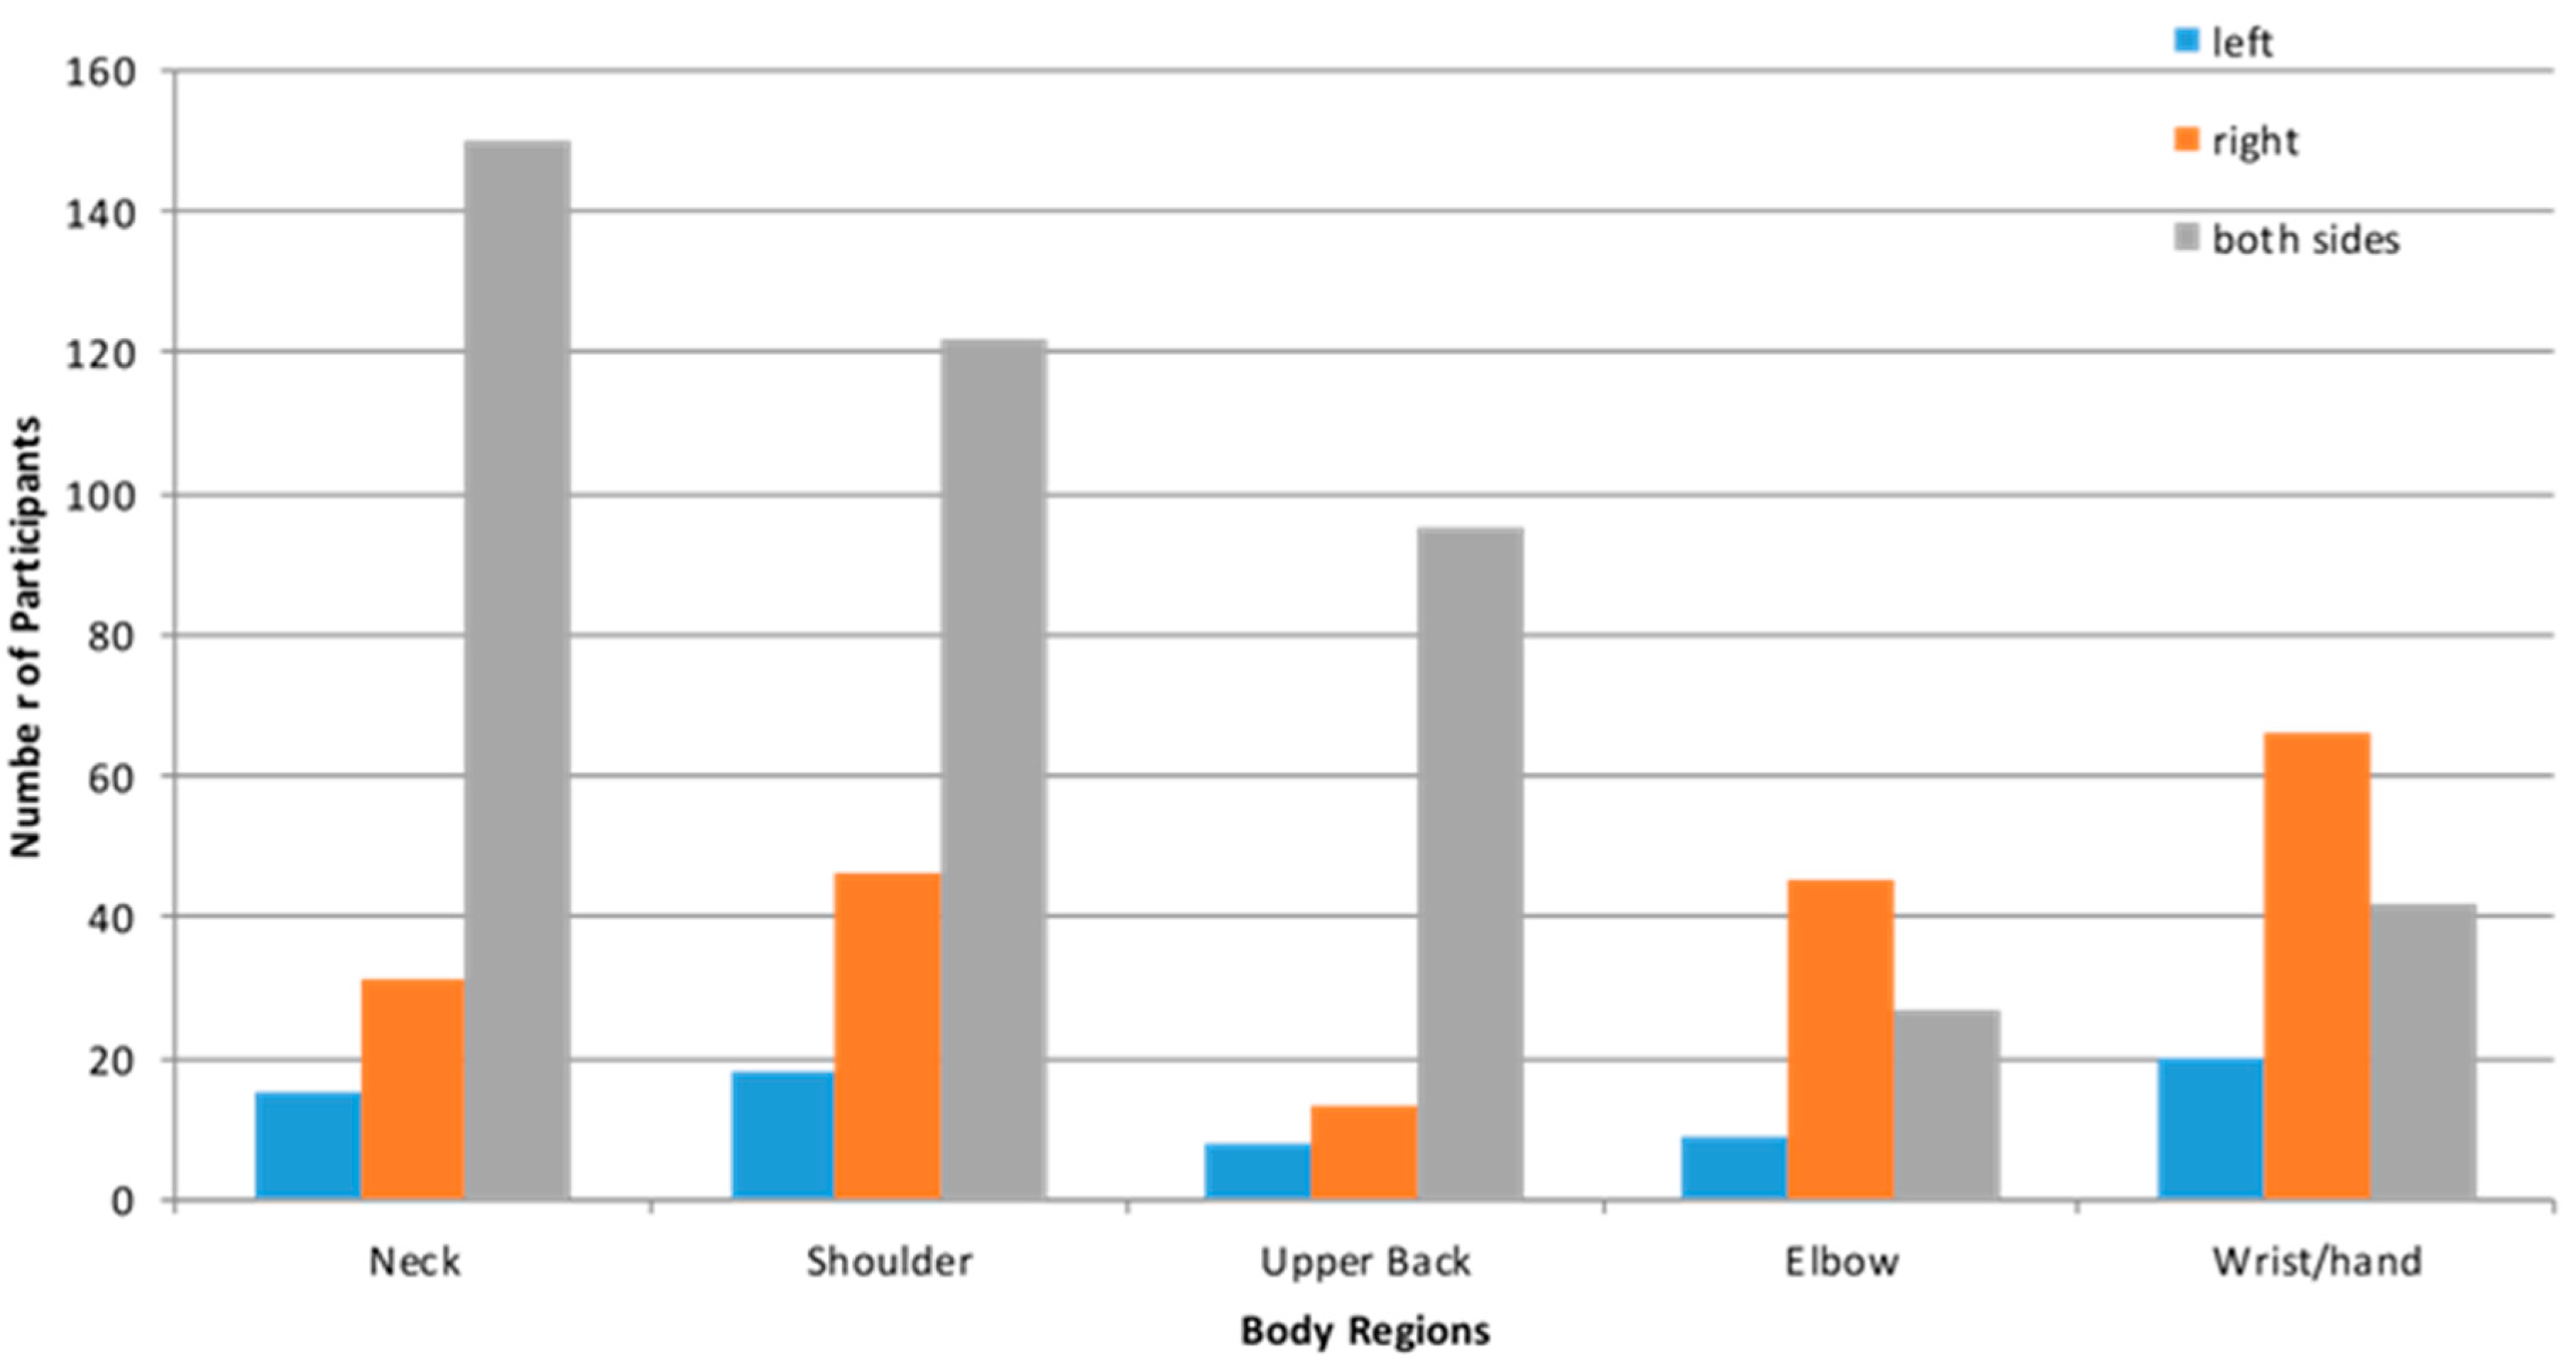
3.2. Musculoskeletal Discomfort
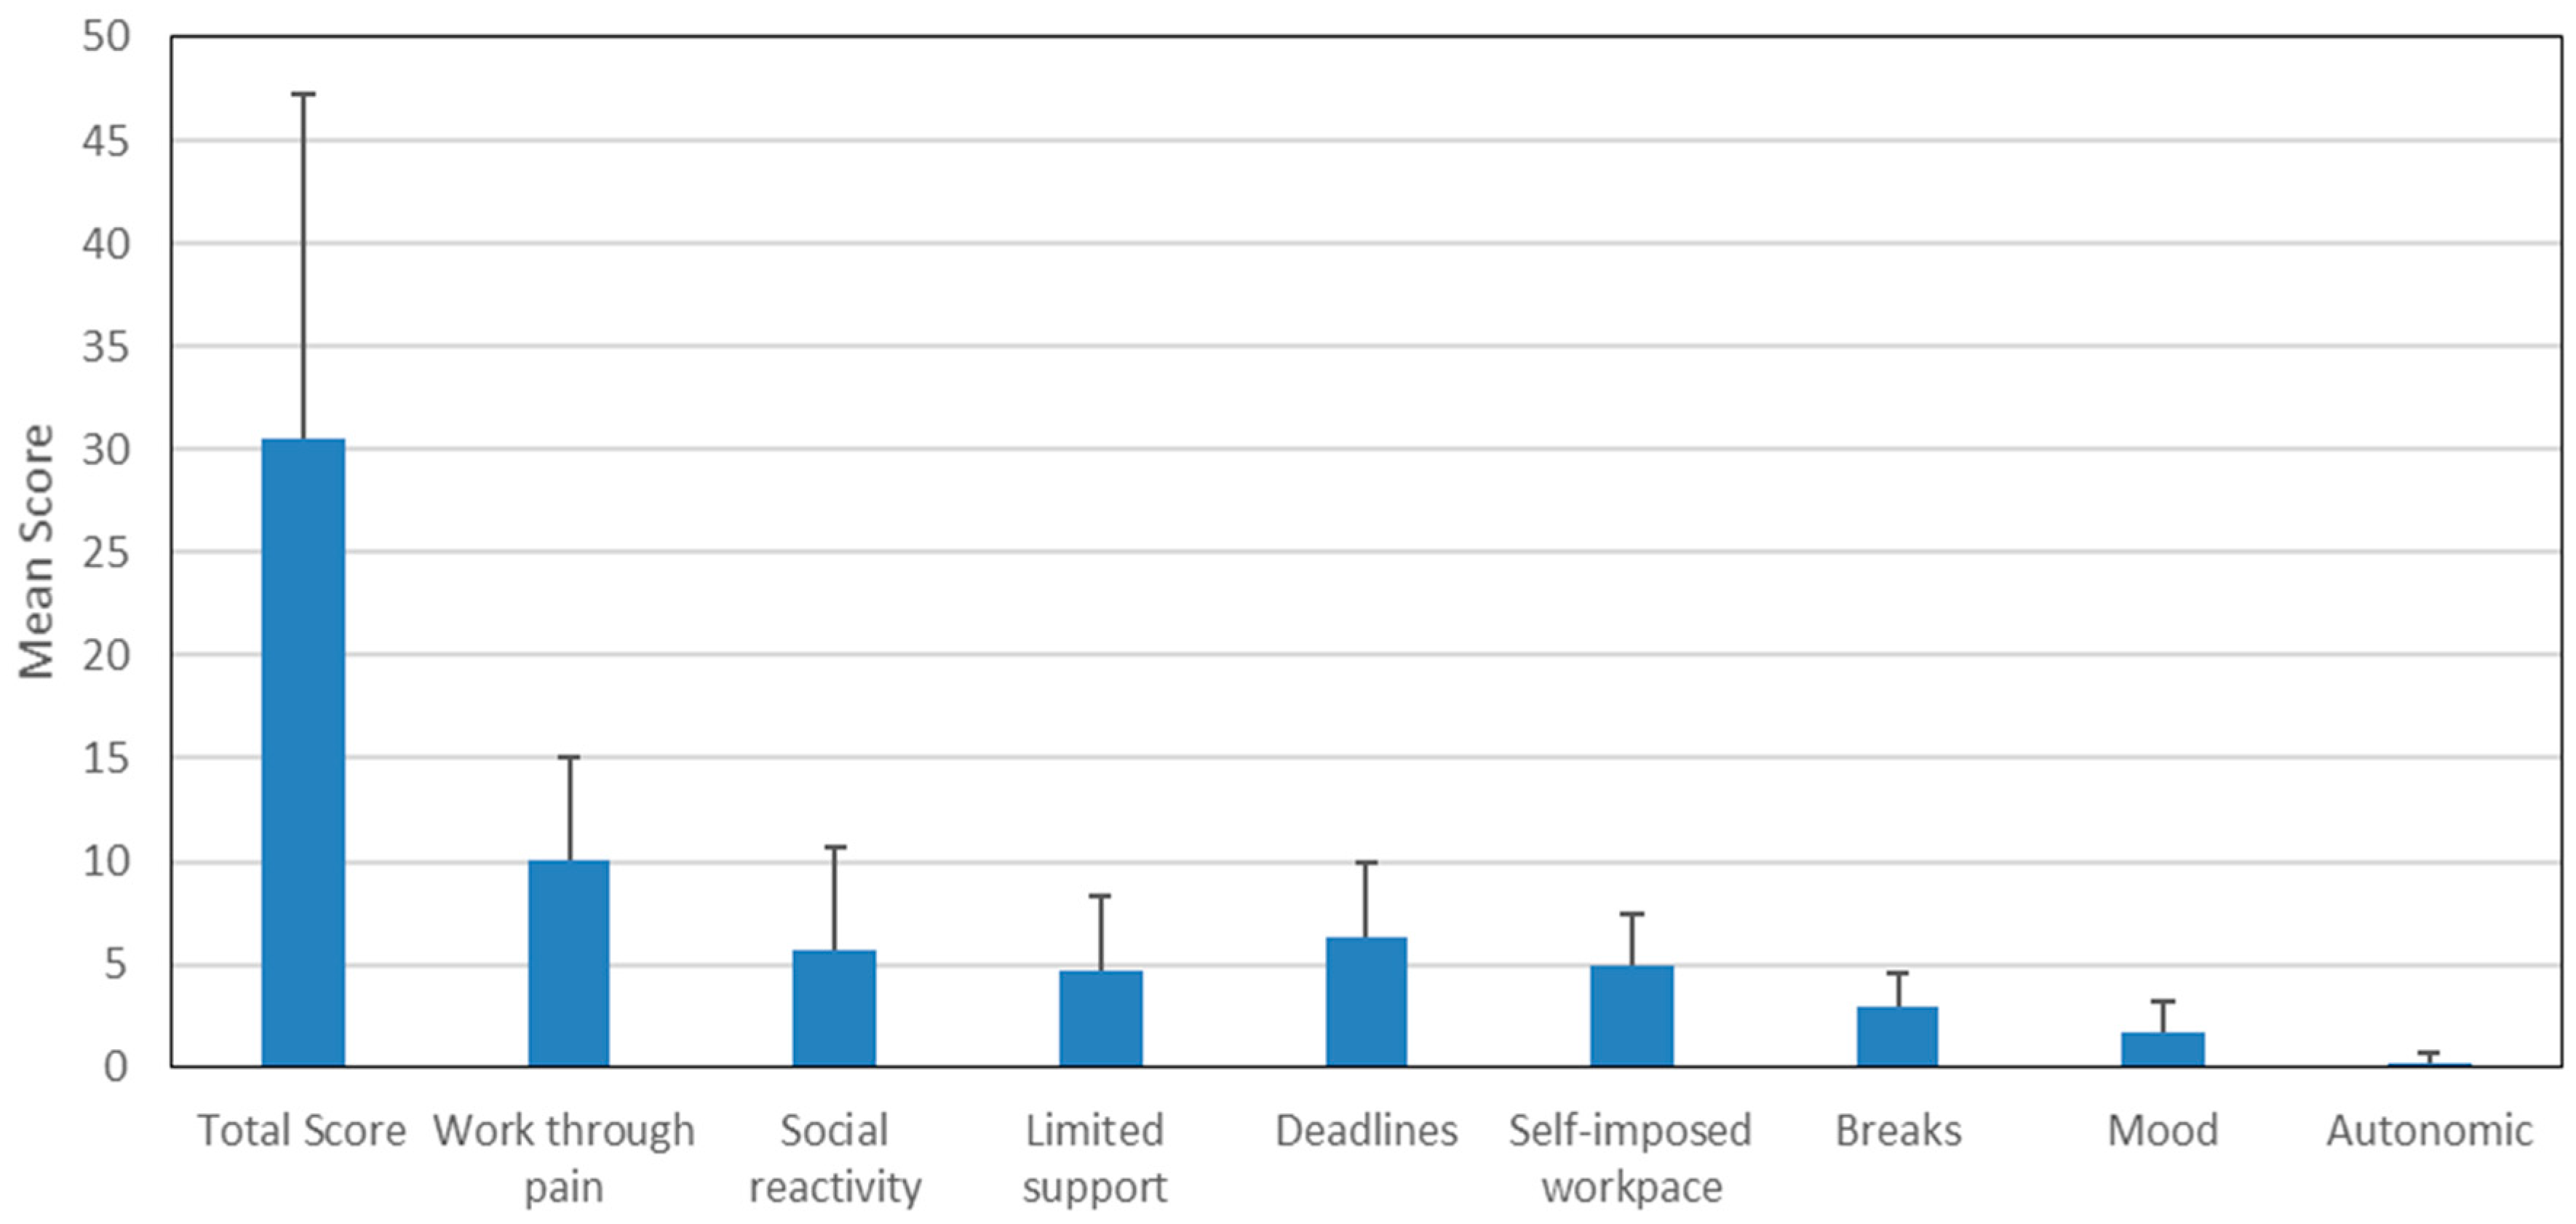
3.3. Psychosocial Stress Factors
3.4. Association of IT Use, Musculoskeletal Discomfort and Psychosocial Stress Factors
4. Discussion
4.1. Cumulative Exposure to IT
4.2. Relationship of IT Use, Workstyle and Musculoskeletal Discomforts
4.3. Use of Touchscreen Devices
4.4. Limitations of Study and Suggestions for Future Research
5. Conclusions
Acknowledgments
Author Contributions
Conflicts of Interest
References
- Blatter, B.M.; Bongers, P.M. Duration of computer use and mouse use in relation to musculoskeletal disorders of neck or upper limb. Int. J. Ind. Ergon. 2002, 30, 295–306. [Google Scholar] [CrossRef]
- Gerr, F.; Marcus, M.; Monteilh, C. Epidemiology of musculoskeletal disorders among computer users: lesson learned from the role of posture and keyboard use. J. Electromyogr. Kinesiol. 2004, 12, 25–31. [Google Scholar] [CrossRef] [PubMed]
- Global Mobile Statistics 2014. Available online: http://mobithinking.com/mobile-marketing-tools/latest-mobile-stats/a#subscribers (accessed on 4 June 2017).
- Chen, X. Hong Kong Smartphone Penetration Rate. Available online: http://mobile.yesky.com/298/11350298.shtml (accessed on 12 September 2013).
- Waersted, M.; Hanvold, T.N.; Veiersted, K.B. Computer work and musculoskeletal disorders of the neck and upper extremity: A systematic review. BMC Musculoskelet. Disord. 2010, 11, 79–94. [Google Scholar] [CrossRef] [PubMed]
- Gold, J.E.; Driban, J.B.; Thomas, N.; Chakravarty, T.; Channell, V.; Komaroff, E. Postures, typing strategies, and gender differences in mobile device usage: An observational study. Appl. Ergon. 2012, 43, 408–412. [Google Scholar] [CrossRef] [PubMed]
- Gustafsson, E.; Johnson, P.W.; Hagberg, M. Thumb postures and physical loads during mobile phone use—A comparison of young adults with and without musculoskeletal symptoms. J. Electromyogr. Kinesiol. 2010, 20, 127–135. [Google Scholar] [CrossRef] [PubMed] [Green Version]
- Kietrys, D.M.; Gerg, M.J.; Dropkin, J.; Gold, J.E. Mobile input device type, texting style and screen size influence upper extremity and trapezius muscle activity and cervical posture while texting. Appl. Ergon. 2015, 50, 98–104. [Google Scholar] [CrossRef] [PubMed]
- Kim, Y.; Kang, M.; Kim, J.; Jang, J.; Oh, J. Influence of the duration of smartphone usage on flexion angles of the cervical and lumbar spine and on reposition error in the cervical spine. Phys. Ther. Korea 2013, 20, 10–17. [Google Scholar] [CrossRef]
- Kim, M.S. Influence of neck pain on cervical movement in the sagittal plane during smartphone use. J. Phys. Ther. Sci. 2015, 27, 15–17. [Google Scholar] [CrossRef] [PubMed]
- Xie, Y.; Szeto, G.P.; Dai, J.; Madeleine, P. A comparison of muscle activity in using touchscreen smartphone among young people with and without chronic neck–shoulder pain. Ergonomics 2016, 59, 61–72. [Google Scholar] [CrossRef] [PubMed]
- Xie, Y.; Szeto, G.P.Y.; Dai, J. Prevalence and risk factors associated with musculoskeletal complaints among users of mobile handheld devices: A systematic review. Appl. Ergon. 2017, 59, 132–142. [Google Scholar] [CrossRef] [PubMed]
- Feuerstein, M.; Shaw, W.S.; Nicholas, R.A.; Huang, G.D. From confounders to suspected risk factors: Psychosocial factors and work-related upper extremity disorders. J. Electromyogr. Kinesiol. 2004, 14, 171–178. [Google Scholar] [CrossRef] [PubMed]
- Buckle, P.W.; Devereux, J.J. The nature of work-related neck and upper limb musculoskeletal disorders. Appl. Ergon. 2002, 33, 207–217. [Google Scholar] [CrossRef]
- Punnett, L.; Wegman, D.H. Work-related musculoskeletal disorders: The epidemiological evidence and the debate. J. Electromyogr. Kinesiol. 2004, 14, 13–23. [Google Scholar] [CrossRef] [PubMed]
- Szeto, G.P.Y.; Straker, L.M.; O’Sullivan, P.B. A comparison of symptomatic and asymptomatic office workers performing monotonous keyboard work-1: Neck and shoulder muscle recruitment patterns. Man. Ther. 2005, 10, 270–280. [Google Scholar] [CrossRef] [PubMed]
- Bongers, P.M.; Kremer, A.M.; ter Laak, J. Are psychosocial factors, risk factors for symptoms and signs of the shoulder, elbow, or hand/wrist? A review of the epidemiological literature. Am. J. Ind. Med. 2002, 41, 315–342. [Google Scholar] [CrossRef] [PubMed]
- Huang, G.D.; Feuerstein, M.; Sauter, S.L. Occupational stress and work-related upper extremity disorders: Concepts and models. Am. J. Ind. Med. 2002, 41, 298–314. [Google Scholar] [CrossRef] [PubMed]
- Sharan, D.; Parijat, P.; Sasidharan, A.P.; Ranganathan, R.; Mohandoss, M.; Jose, J. Workstyle risk factors for work-related musculoskeletal symptoms among computer professionals in India. J. Occup. Rehabil. 2011, 21, 520–525. [Google Scholar] [CrossRef] [PubMed]
- Feuerstein, M.; Nicholas, R.A.; Huang, G.D.; Haufler, A.J.; Pransky, G.; Robertson, M. Workstyle: Development of a measure of response to work in those with upper extremity pain. J. Occup. Rehabil. 2005, 15, 87–104. [Google Scholar] [CrossRef] [PubMed]
- Feuerstein, M.; Nicholas, R.A. Development of a short form of the Workstyle measure. Occup. Med. 2006, 56, 94–99. [Google Scholar] [CrossRef] [PubMed]
- Cheng, A.S.K.; Szeto, G.P.Y.; Feuerstein, M. Cross-cultural validation of workstyle short form for work-related musculoskeletal upper extremity pain in Chinese cooks. J. Occup. Rehabil. 2014, 24, 605–616. [Google Scholar] [CrossRef] [PubMed]
- Mejier, E.M.; Sluiter, J.K.; Frings-Dresen, M.H.W. Is Workstyle a mediating factor in the upper extremity over time? J. Occup. Rehabil. 2008, 18, 262–266. [Google Scholar] [CrossRef] [PubMed]
- Harrington, C.B.; Siddiqui, A.; Feuerstein, M. Workstyle as a predictor of pain and restricted work associated with upper extremity disorders: A prospective study. J. Hand Surg. 2009, 34, 724–731. [Google Scholar] [CrossRef] [PubMed]
- Szumilas, M. Explaining odd ratios. J. Can. Acad. Child Adolesc. Psychiatry 2010, 19, 227–230. [Google Scholar] [PubMed]
- Berolo, S.; Wells, R.P.; Amick, B.C., III. Musculoskeletal symptoms among mobile hand-held device users and their relationship to device use: A preliminary study in a Canadian university. Appl. Ergon. 2011, 42, 371–378. [Google Scholar] [CrossRef] [PubMed]
- Ming, Z.; Pietikainen, S.; Hanninen, O. Excessive texting in pathophysiology of first carpometacarpal joint arthritis. Pathophysiology 2006, 13, 269–270. [Google Scholar] [CrossRef] [PubMed]
- Lozano, C.; Jindrich, D.; Kahol, K. The impact on musculoskeletal system during multitouch tablet interactions. In Proceedings of the SIGCHI Conference on Human Factors in Computing Systems (CHI ’11), Vancouver, BC, Canada, 7–12 May 2011; pp. 825–828. [Google Scholar]
- Storr, E.F.; de Vere Beavis, F.O.; Stringer, M.D. Texting tenosynovitis. N. Z. Med. J. 2007, 120, 107–108. [Google Scholar]
- Ciccarelli, M.; Straker, L.; Mathiassen, S.E.; Pollock, C. Diversity of tasks and information technologies used by office workers at and away from work. Ergonomics 2011, 54, 1017–1028. [Google Scholar] [CrossRef] [PubMed]
- Gerr, F.; Marcus, M.; Ensor, C.; Kleinbaum, D.; Cohen, S.; Edwards, A.; Gentry, E.; Ortiz, D.J.; Monteilh, C. A prospective study of computer users: I. Study design and incidence of musculoskeletal symptoms and disorders. Am. J. Ind. Med. 2002, 41, 221–235. [Google Scholar] [CrossRef] [PubMed]


| Demographic Factors | Whole Group | Males (n = 140) | Females (n = 145) |
|---|---|---|---|
| Age | |||
| 18–25 | 77 | 27 | 50 |
| 26–30 | 54 | 28 | 26 |
| 31–35 | 48 | 26 | 22 |
| 36–40 | 36 | 20 | 16 |
| 41–45 | 20 | 12 | 8 |
| 46–50 | 30 | 18 | 12 |
| >50 | 15 | 8 | 7 |
| missing | 4 | 1 | 3 |
| Body build | |||
| Height (cm) | 166.7 ± 8.9 | 173.2 ± 6.4 a | 160.4 ± 6.2 a |
| Weight (kg) | 61.4 ± 13.6 | 69.6 ± 12.4 b | 53.2 ± 9.3 b |
| Work status (n = 278) | |||
| Working full-time | 221 | 117 | 104 |
| Studying full-time | 57 | 21 | 36 |
| Others/Missing | 7 | 2 | 5 |
| Employment sector (n = 279) | |||
| Banking | 13 | 5 | 8 |
| Food | 9 | 6 | 3 |
| Construction | 11 | 9 | 2 |
| Manufacturing | 7 | 2 | 5 |
| Education | 18 | 11 | 7 |
| Healthcare | 71 | 27 | 44 |
| Sales | 14 | 8 | 6 |
| Others | 88 | 51 | 37 |
| Missing | 6 | 2 | 4 |
| Handedness (n = 279) | |||
| Left | 20 | 13 | 7 |
| Right | 259 | 123 | 136 |
| Missing | 6 | 4 | 2 |
| Sit in office all day | |||
| Yes | 151 | 70 | 81 |
| Exercise regularly (n = 285) | |||
| Never | 14 | 4 | 10 |
| Occasionally | 154 | 55 | 99 |
| 1–2×/week | 82 | 60 | 22 |
| ≥3×/week | 31 | 19 | 12 |
| Missing | 4 | 2 | 2 |
| Total Number of Respondents (n, %) | <1 h | 1–2 h | 2–4 h | 4–6 h | 6–8 h | >8 h | |
|---|---|---|---|---|---|---|---|
| Desktop Computer | 225 (78.9%) | 34 (11.9%) | 38 (13.3%) | 40 (14.0%) | 36 (12.6%) | 43 (15.1%) | 34 (11.9) |
| Laptop Computer | 146 (51.2%) | 52 (18.2%) | 44 (15.4%) | 27 (9.5%) | 15 (5.3%) | 6 (2.1%) | 2 (0.7%) |
| Mobile Phone (Keypad) | 69 (24.2%) | 42 (14.7%) | 15 (5.3%) | 5 (1.8%) | 1 (0.4%) | 4 (1.4%) | 2 (0.7%) |
| Mobile Phone (Smartphones) | 256 (89.8%) | 50 (17.5%) | 87 (30.5%) | 54 (18.9%) | 32 (11.2%) | 13 (4.6%) | 20 (7.0%) |
| Tablet Computers | 89 (31.2%) | 35 (12.3%) | 32 (11.2%) | 12 (4.2%) | 6 (2.1%) | 1 (0.4%) | 3 (1.1%) |
| Handheld Electronic Game Devices | 50 (17.5) | 37 (13.0%) | 9 (3.2%) | 2 (0.7%) | 0 (0%) | 0 (0%) | 2 (0.7%) |
| Smartphones (n = 287) | Tablet Computers (n = 72) | |
|---|---|---|
| How Long Since Used | ||
| 0–6 months | 50 (17.4%) * | 21 (29.2%) * |
| 6–12 months | 65 (22.6%) | 24 (33.3%) |
| 1–2 years | 104 (36.2%) | 22 (30.6%) |
| 2–3 years | 39 (13.6%) | 5 (6.9%) |
| >3 years | 29 (10.1%) | 0 (0.0%) |
| Hours Used per Day | ||
| 0–1 h | 52 (18.1%) | 20 (27.8%) |
| 1–2 h | 102 (35.5%) | 30 (41.7%) |
| 2–4 h | 96 (33.4%) | 20 (27.8%) |
| >4 h | 36 (12.5%) | 2 (2.8%) |
| Where Used | ||
| At work | 108 (37.6%) | 14 (19.4%) |
| At home | 163 (56.8%) | 54 (75.0%) |
| Public transport/car | 217 (75.6%) | 20 (27.8%) |
| Others (e.g. restaurant) | 120 (41.8%) | 17 (23.6%) |
| Tasks Performed | ||
| Type/text | 156 (54.4%) | 18 (25.0%) |
| Check email | 134(46.7%) | 30 (41.7%) |
| Surf www | 202 (70.4%) | 54 (75.0%) |
| Graphic work | 3 (1.0%) | 1 (1.4%) |
| Play game | 153 (53.3%) | 40 (55.6%) |
| Photo | 136 (47.4%) | 4 (5.8%) |
| Movie/TV | 89 (31.0%) | 39 (54.2%) |
| Read book | 125 (43.6%) | 31 (43.1%) |
| Listen to music | 130 (45.3%) | 15 (20.8%) |
| Others | 18 (6.3%) | 2 (2.8%) |
| Viewing Angle | ||
| At eye level | 49 (17.1%) | 21 (29.2%) |
| Below eye level | 234 (81.5%) | 49 (68.1%) |
| Above eye level | 1 (0.0%) | 2 (2.8%) |
| Forearm Position | ||
| Rest on table | 48 (16.7%) | 20 (27.8%) |
| Rest on laps | 36 (12.5%) | 24 (33.3%) |
| Arms in mid-air | 196 (68.3%) | 22 (30.6%) |
| others | 5 (1.7%) | 6 (8.3%) |
| Input Style | ||
| Right thumb | 56 (19.5%) | 6 (8.3%) |
| Right index finger | 168 (58.5%) | 49 (68.1%) |
| Left thumb | 8 (2.7%) | 0 (0.0%) |
| Left index finger | 3 (1.0%) | 3 (4.2%) |
| Both thumbs and index fingers | 26 (9.1%) | 6 (8.3%) |
| All fingers evenly | 16 (5.6%) | 8 (11.1%) |
| Question | Neck | Shoulder | Upper Back | Elbow | Wrist/Hand |
|---|---|---|---|---|---|
| (n = 206) | (n = 186) | (n = 123) | (n = 90) | (n = 132) | |
| Discomfort Rating (0–10) (mean(sd)) | 3.09 ± 2.68 | 2.90 ± 2.77 | 1.76 ± 2.55 | 1.13 ± 2.15 | 1.65 ± 2.32 |
| Duration of Discomfort in Last 12 Months | |||||
| 1–7 Days | 19 | 15 | 3 | 2 | 7 |
| 8–30 Days | 14 | 3 | 6 | 0 | 2 |
| >30 Days | 16 | 12 | 6 | 2 | 4 |
| 1–3 Months | 8 | 1 | 2 | 2 | 4 |
| 3–6 Months | 4 | 3 | 0 | 0 | 3 |
| >6 Months | 15 | 13 | 8 | 7 | 3 |
| Body Region with Symptoms (Yes/No) | Factor | Significance (p Value) | Odds Ratio (OR) | 95% CI (Lower to Upper Bound) |
|---|---|---|---|---|
| Neck | Laptop Time | 0.009 * | 0.819 | 0.705–0.951 |
| Phone (keypad) Time | 0.027 * | 0.742 | 0.569–0.967 | |
| Phone (touchscreen) Time | 0.078 | 0.915 | 0.830–1.010 | |
| WS Subscale: Work Through Pain | 0.001 * | 1.108 | 1.045–1.174 | |
| Constant | 0.579 | 1.200 | ||
| Shoulder | Desktop Time | 0.037 * | 1.094 | 1.005–1.191 |
| Phone (Keypad) Time | 0.042 * | 0.770 | 0.598–0.991 | |
| Phone (Touchscreen) Time | 0.018 * | 0.880 | 0.805–0.980 | |
| WS Subscale: Work Through Pain | 0.001 ** | 1.111 | 1.046–1.180 | |
| WS Subscale: Mood | 0.093 | 1.186 | 0.972–1.448 | |
| Constant | 0.033 * | 0.464 | ||
| Upper Back | Phone (Keypad) Time | 0.041 * | 0.463 | 0.221–0.968 |
| WS Subscale: Work Through Pain | 0.029 * | 1.069 | 1.007–1.135 | |
| WS Subscale: Self-Imposed Workpace | 0.016 * | 1.160 | 1.028–1.309 | |
| constant | 0.000 ** | 0.169 | ||
| Elbow | WS subscale: Work through pain | 0.007 ** | 1.078 | 1.021–1.138 |
| Constant | 0.000 ** | |||
| Wrist/hand | Desktop Time | 0.015 * | 1.103 | 1.019–1.193 |
| Laptop Time | 0.015 * | 0.808 | 0.681–0.960 | |
| Phone (keypad) Time | 0.059 | 0.735 | 0.534–1.012 | |
| WS subscale: Work Through Pain | 0.001 ** | 1.093 | 1.035–1.154 | |
| Constant | 0.000 ** | 0.290 |
© 2017 by the authors. Licensee MDPI, Basel, Switzerland. This article is an open access article distributed under the terms and conditions of the Creative Commons Attribution (CC BY) license (http://creativecommons.org/licenses/by/4.0/).
Share and Cite
So, B.C.L.; Cheng, A.S.K.; Szeto, G.P.Y. Cumulative IT Use Is Associated with Psychosocial Stress Factors and Musculoskeletal Symptoms. Int. J. Environ. Res. Public Health 2017, 14, 1541. https://doi.org/10.3390/ijerph14121541
So BCL, Cheng ASK, Szeto GPY. Cumulative IT Use Is Associated with Psychosocial Stress Factors and Musculoskeletal Symptoms. International Journal of Environmental Research and Public Health. 2017; 14(12):1541. https://doi.org/10.3390/ijerph14121541
Chicago/Turabian StyleSo, Billy C. L., Andy S. K. Cheng, and Grace P. Y. Szeto. 2017. "Cumulative IT Use Is Associated with Psychosocial Stress Factors and Musculoskeletal Symptoms" International Journal of Environmental Research and Public Health 14, no. 12: 1541. https://doi.org/10.3390/ijerph14121541