2. Materials and Methods
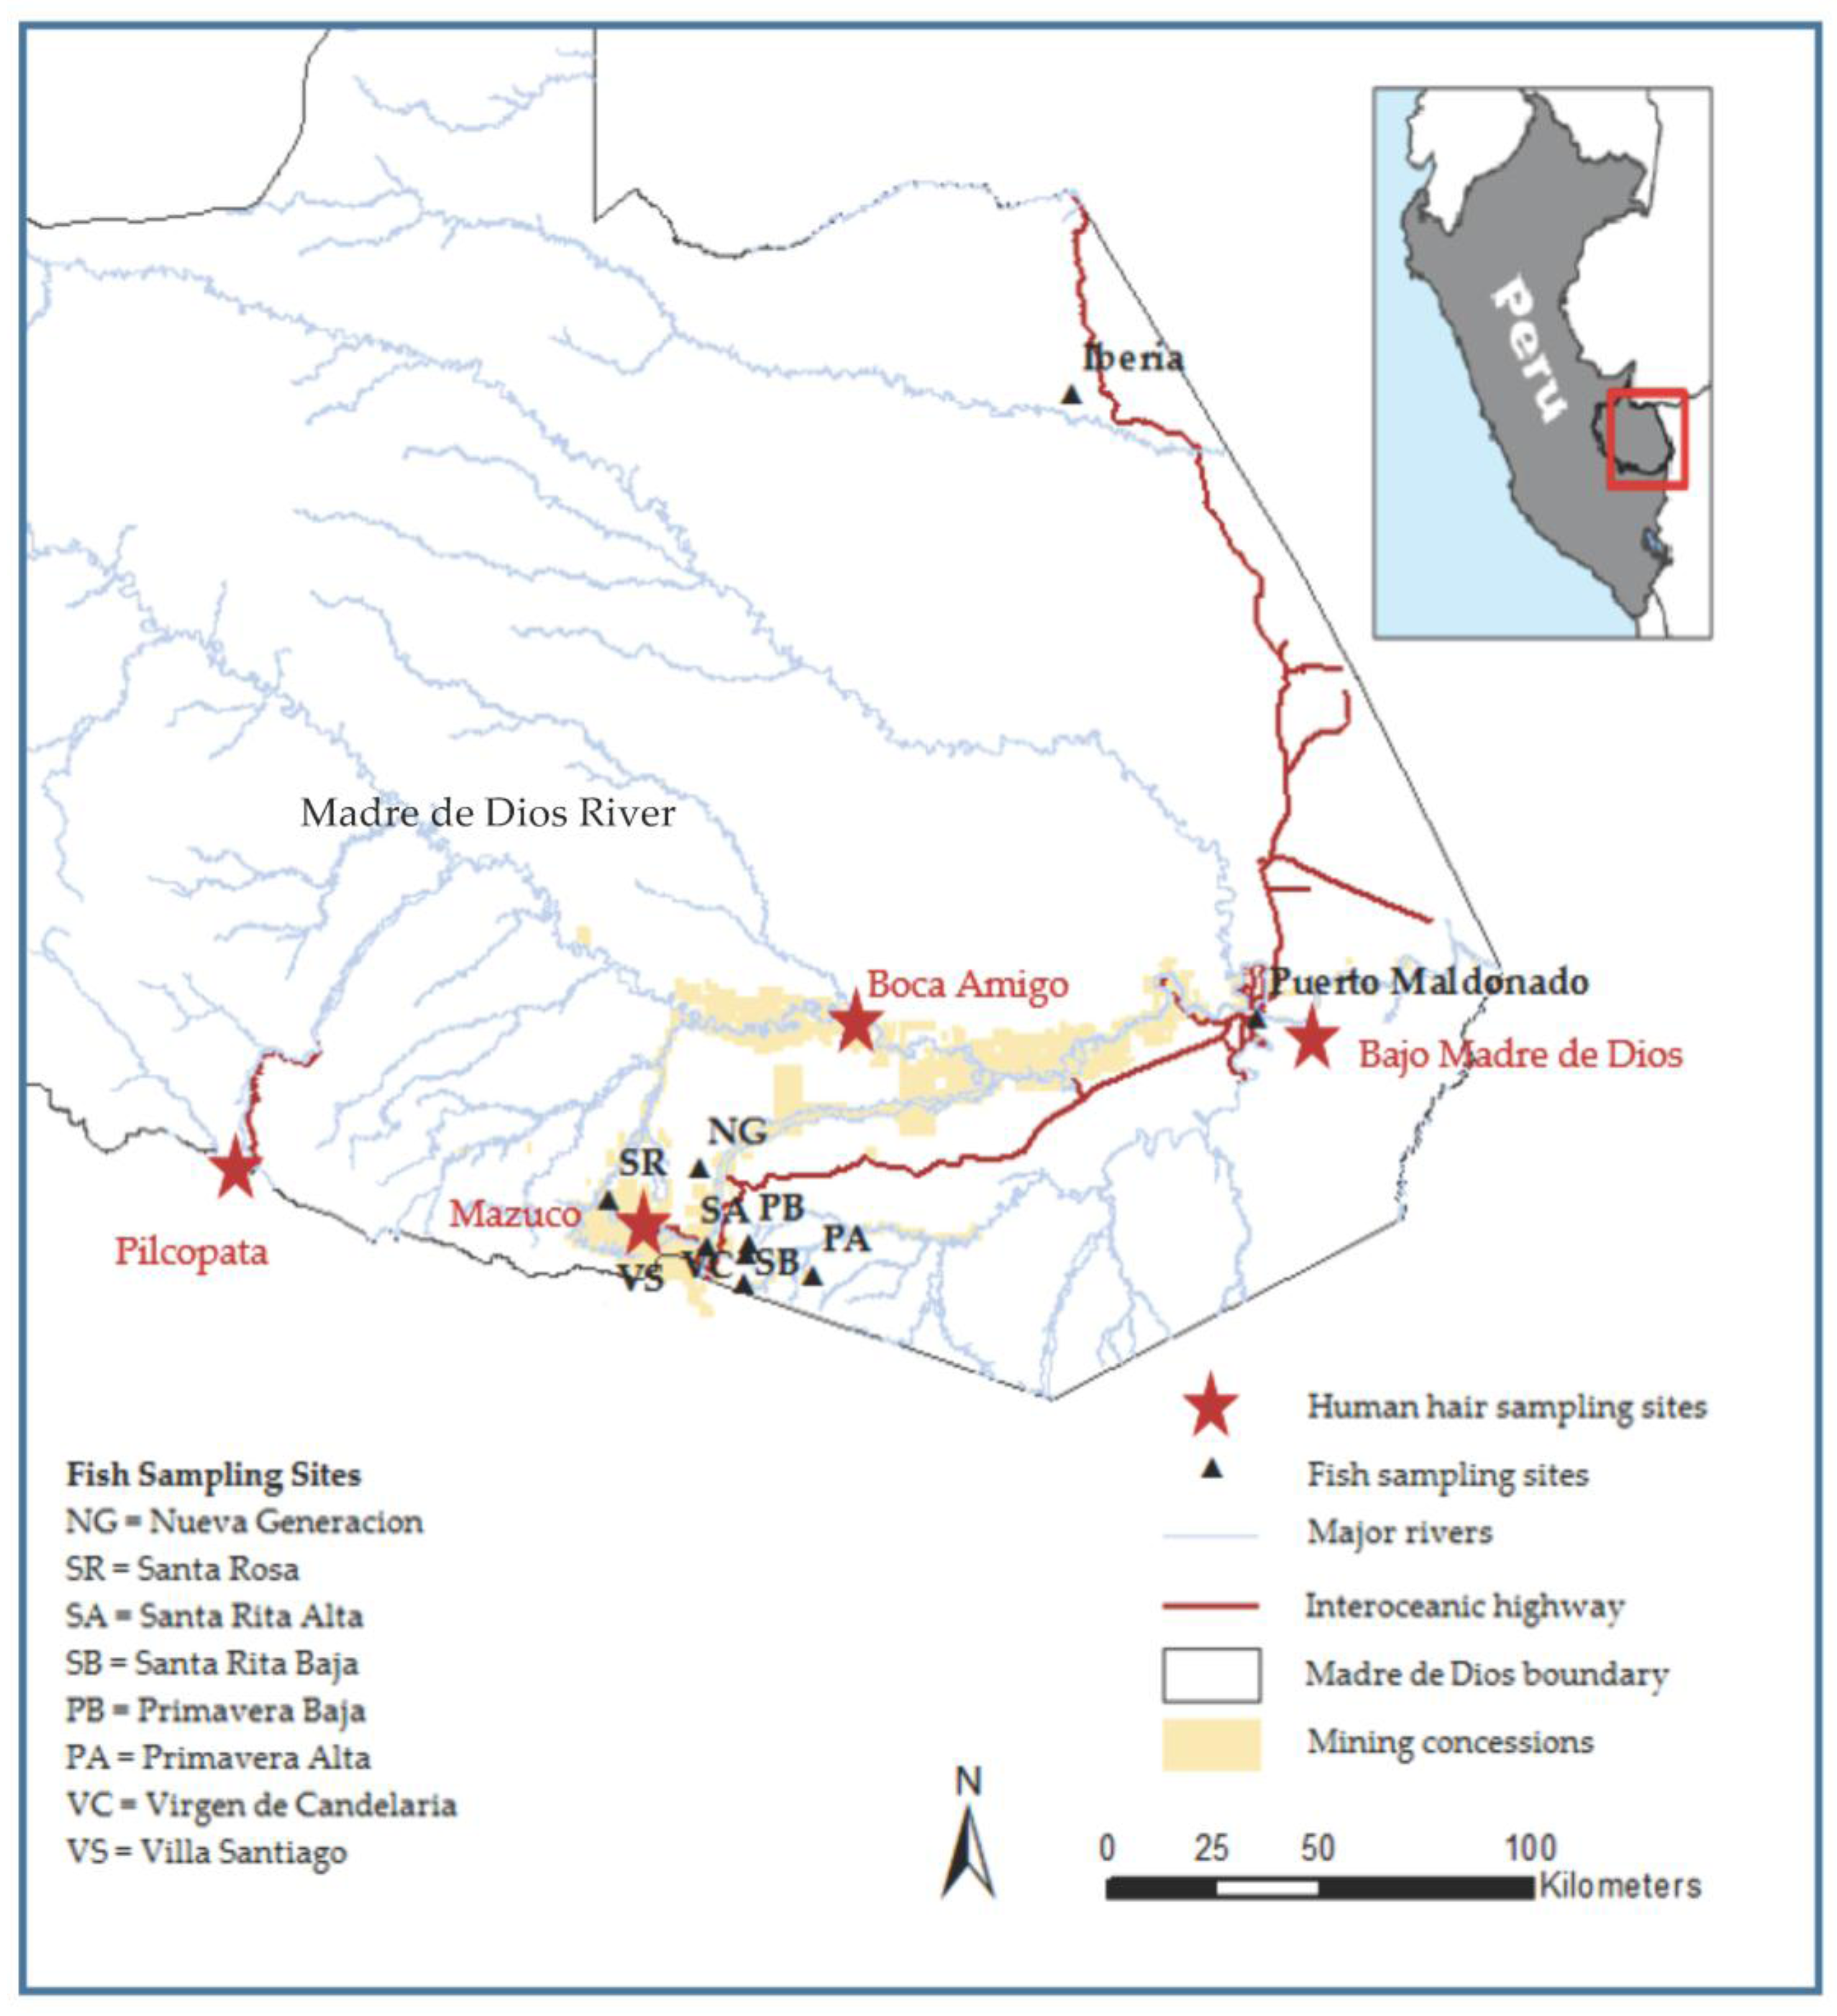
Data were collected from May to July 2014 in four Peruvian communities along the 1060 km long Madre de Dios River, which originates in Peru [
57] and empties into the Beni River in Bolivia (
Figure 1). All research protocols involving human subjects were approved by the University of Michigan IRB (HUM00086592). All subjects gave their informed consent for inclusion before participating in the study.
2.1. Site Selection and Participant Recruitment
Field sites for human subjects were chosen to represent a range of distances from the headwaters of the Madre de Dios River (
Table 1). The four sites were Bajo Madre de Dios, Boca Amigo, Mazuco, and Pilcopata. Pilcopata, the community closest to the headwaters, was chosen as a control site, due to the lack of nearby ASGM activities; as determined through an evaluation of satellite images from 2005 to 2014. Landsat data are distributed by the Land Processes Distributed Active Archive Center (LP DAAC), located at USGS/EROS, Sioux Falls, SD, USA. The presence of illegal mining in the other three communities was determined through an evaluation of satellite images and through conversations with community members. Formal demographic and population data were not available for all of the communities at the time of the study. The communities were generally similar, with the exception of proximities to mining and the degree of urbanization; Boca Amigo and Bajo Madre de Dios were not urban. Mazuco was the largest community sampled.
In the small communities of Pilcopata, Bajo Madre de Dios, and Boca Amigo, households near the main town center were visited for recruitment via convenience sampling. In the larger town of Mazuco, a section of the community was selected based on convenient access for researchers and all houses in that section were approached for recruitment. At all four sites, one (and, in rare cases, two) adult participated in each sampled household, with a range of 12 to 19 households visited per site. Our a priori sampling goal was 20 subjects from 20 households, in each of the four communities.
2.2. Human Subjects Survey
The survey completed by all subjects addressed demographic factors (age, sex, study site, education, duration of residence, household size, pregnancy, etc.); the frequency (number of meals per week including fish) and source of different types of fish consumed; the number of servings of fish consumed in the three days prior to the survey; and the frequency and source of other types of protein consumed. Note that, due to the often-illegal nature of mining in the area, we chose not to ask participants about their mining activities. The study inclusion criteria were an age of at least 18 years and residence in the study site for at least six months.
2.3. Human Hair Sample Collection and Analysis
After completing the survey, a collection of roughly 200 strands of hair (the approximate number needed to obtain the necessary mass of hair for subsequent analysis) were cut from the occipital region of the skull of each participant. Samples were taken with stainless steel scissors as close to the scalp as was safely possible. The hair was stored between sheets of adhesive paper, and the sample end closest to the scalp was marked. The samples were labeled, stored individually in double plastic Ziploc bags, and frozen after transport to the University of Michigan and prior to analysis.
Human hair samples were analyzed at the University of Michigan using a Milestone Direct Mercury Analyzer (DMA-80, Milestone Inc., Shelton, CT, USA), using EPA method 7473 [
59]. Samples were trimmed so that the 4 cm length of hair closest to the scalp would be analyzed. Hair grows at an average rate of one cm per month [
60], so our analysis was intended to estimate the total mercury exposure for the four-month period preceding analysis. A 50–55 mg hair sample was measured and placed in the DMA for analysis. Three different readings were taken for each sample, and the three runs were averaged to estimate the total mercury concentration per sample. Quality control (QC) measures included the random testing of reference materials (IAEA-086), blank measurements every 10th reading, and random checks of previously measured samples. Recovery rates of 95%–100% were considered acceptable for reference material tests. The Limit of Detection (LOD) was 0.003 ng Hg.
2.4. Fish Sample Site Selection and Sample Collection
Fish samples were collected from aquaculture farms throughout the Madre de Dios region (
Table 2). Farms were selected based on convenience and awareness of their existence by local governmental and non-governmental agencies. We purchased recently-caught and killed fish that were to be consumed by the farm owner, directly from fish farmers. Fish from farms were targeted because heavy rainfall during the study period prevented fisherman from obtaining fish from the rivers. The selection of fish farm locations was not consistent with the sites where the human participants were sampled, due to constraints in access to refrigeration. The Iberia site, farthest from the Madre de Dios River and near the Brazilian border, served as a reference site, because it was believed to be similar to other study sites, but not subject to ASGM mercury. At the time of the study, no large-scale ASGM activities were believed to occur in Iberia. This study only focused on the fish species “paco”, as it is easy to find in fish farms throughout the region, allowing for a spatial comparison within one fish species.
Five paco specimens were purchased from pisciculture farmers on the same day as the fish had been caught and killed for their own consumption. All five samples were collected from a single pond from each fish farm, using standard fishing practices. Fish are purchased from NGOs and governmental agencies as fingerlings by the farmer. All fish are added to ponds at the same time, and are harvested in nets one year later. Therefore, farmers were able to tell us exactly how long fish had been in their respective ponds. The information gathered for each fish sample included the number of months in the pond, length (cm), approximate weight (kg), and GPS coordinates of the pond. A tissue sample weighing approximately 50 g was taken from the side of the deceased fish, over the lateral line just anterior to the tail. The sample was placed in a Ziploc bag and labeled; the remainder of the fish was either purchased or returned to the pond owners. All of the fish samples were frozen locally and then shipped to the University of Michigan on dry ice.
2.5. Fish Sample Laboratory Analysis
At the University of Michigan, fish samples were measured on a balance (to ±0.0001 g) while still frozen, then placed into individual Whirl Pak bags, labeled, and dehydrated for at least 48 h using a vacuum freeze dryer dehydrator. The final dry weights (to ±0.0001 g) were recorded after dehydration; these weights were, on average, 22%–25% of the wet weight. The dried samples were then pulverized to a fine powder and sampled using a disposable spatula. Samples were analyzed using the DMA-80 and EPA method 7473 [
59]. As with the human hair samples, three different readings were taken and averaged for each fish sample. QC was similar to that used for human hair; for reference materials (IAEA-407, IAEA-436), recoveries between 90% and 110% were considered acceptable. The LOD was again 0.003 ng Hg.
The mercury concentration in fish tissue was converted from the dry weight concentration (i.e., the DMA output) to the wet weight concentration using Equation (1).
The conversion of dry weight [Hg] to wet weight [Hg] was as follows:
where Δweight is the change in weight for each sample between dry and wet weight measurements.
2.6. Statistical Analysis
Statistical analysis was performed using RStudio (RStudio, Boston, MA, USA) and Stata 14.1 (StataCorp LLC, College Station, TX, USA). Descriptive statistics were computed for all variables, and univariate and bivariate relationships were examined visually, through the use of histograms, scatterplots, and quantile plots, in combination with correlation coefficients. Non-normally-distributed variables were log-transformed prior to parametric statistical analyses; for these variables, the geometric mean and geometric standard deviation (GSD) are reported, in addition to the arithmetic mean and standard deviation. For inferential statistical tests, results were considered significant when p < 0.05.
To analyze the measured total mercury in human hair, ANOVA tests were used to test differences in mercury levels by categorical variables, using both the original response scales (two to four possible response categories, depending on the survey item) and the results after collapsing them into binary categories. ANOVA tests were also run on categorical variables and mercury levels after log-transforming the mercury levels. Chi-squared tests were used to test differences in the fraction of hair mercury measurements exceeding the 2.2 μg/g PTWI total hair mercury equivalent level by site and sex. Linear regression analyses were used to evaluate the bivariate association between the measured human hair total log-transformed mercury levels and each of the independent variables (i.e., demographic factors, community site, fish consumption, etc.), and logistic regression analyses were used to evaluate the odds ratio (OR) for total hair mercury levels >2.2 µg/g associated with each of the individual independent variables. A forward stepwise regression approach was used to develop multivariate linear and logistic regression models; variables were retained where p-values of 0.10 or less were observed. To account for the few cases where multiple adults were sampled in a single household, regression models accounted for the intragroup correlation of data by household (Stata “cluster” option).
For the fish samples, the total mercury (Hg mg/kg dry weight) was plotted against the fish specimen weight mercury, and the R-squared value and slope of the relationship were assessed. Descriptive statistics were computed for the mean wet weight mercury concentration (mg/kg), both overall and by study site. The fraction of samples exceeding the EPA tissue residue criterion of 0.3 µg MeHg/g fish tissue was computed, both overall and by sampling site.
3. Results
3.1. Human Survey Results
Study participation rates were not formally assessed. The most common reason given for non-participation was a lack of interest in providing a hair sample, either due to aesthetic considerations or cultural beliefs. It is possible that some individuals may have declined to participate because they were engaging in mining themselves; however, this was never stated as a reason to the researchers.
Table 3 shows information about the 81 participants, both overall and by site. Of the 81 adult participants, 12 (14.8%) were sampled from six households; all other participants were the only adults sampled in their households. Just under half of the participants (39%, or 48.2%) were male. Participants were roughly equally distributed across the four sites. The mean age, mean residence time, and total household size differed among the four sites, but were not statistically significant. The number of children per household significantly differed among sites, with Pilcopata having the highest value, and Boca Amigo the lowest value. Education levels differed by site: Pilcopata had by far the largest fraction of participants that had completed more than secondary school (data not shown). Mazuco and Pilcopata had the largest fraction of participants that had completed secondary school, and Bajo Madre de Dios had by far the largest fraction of participants that had not completed primary school.
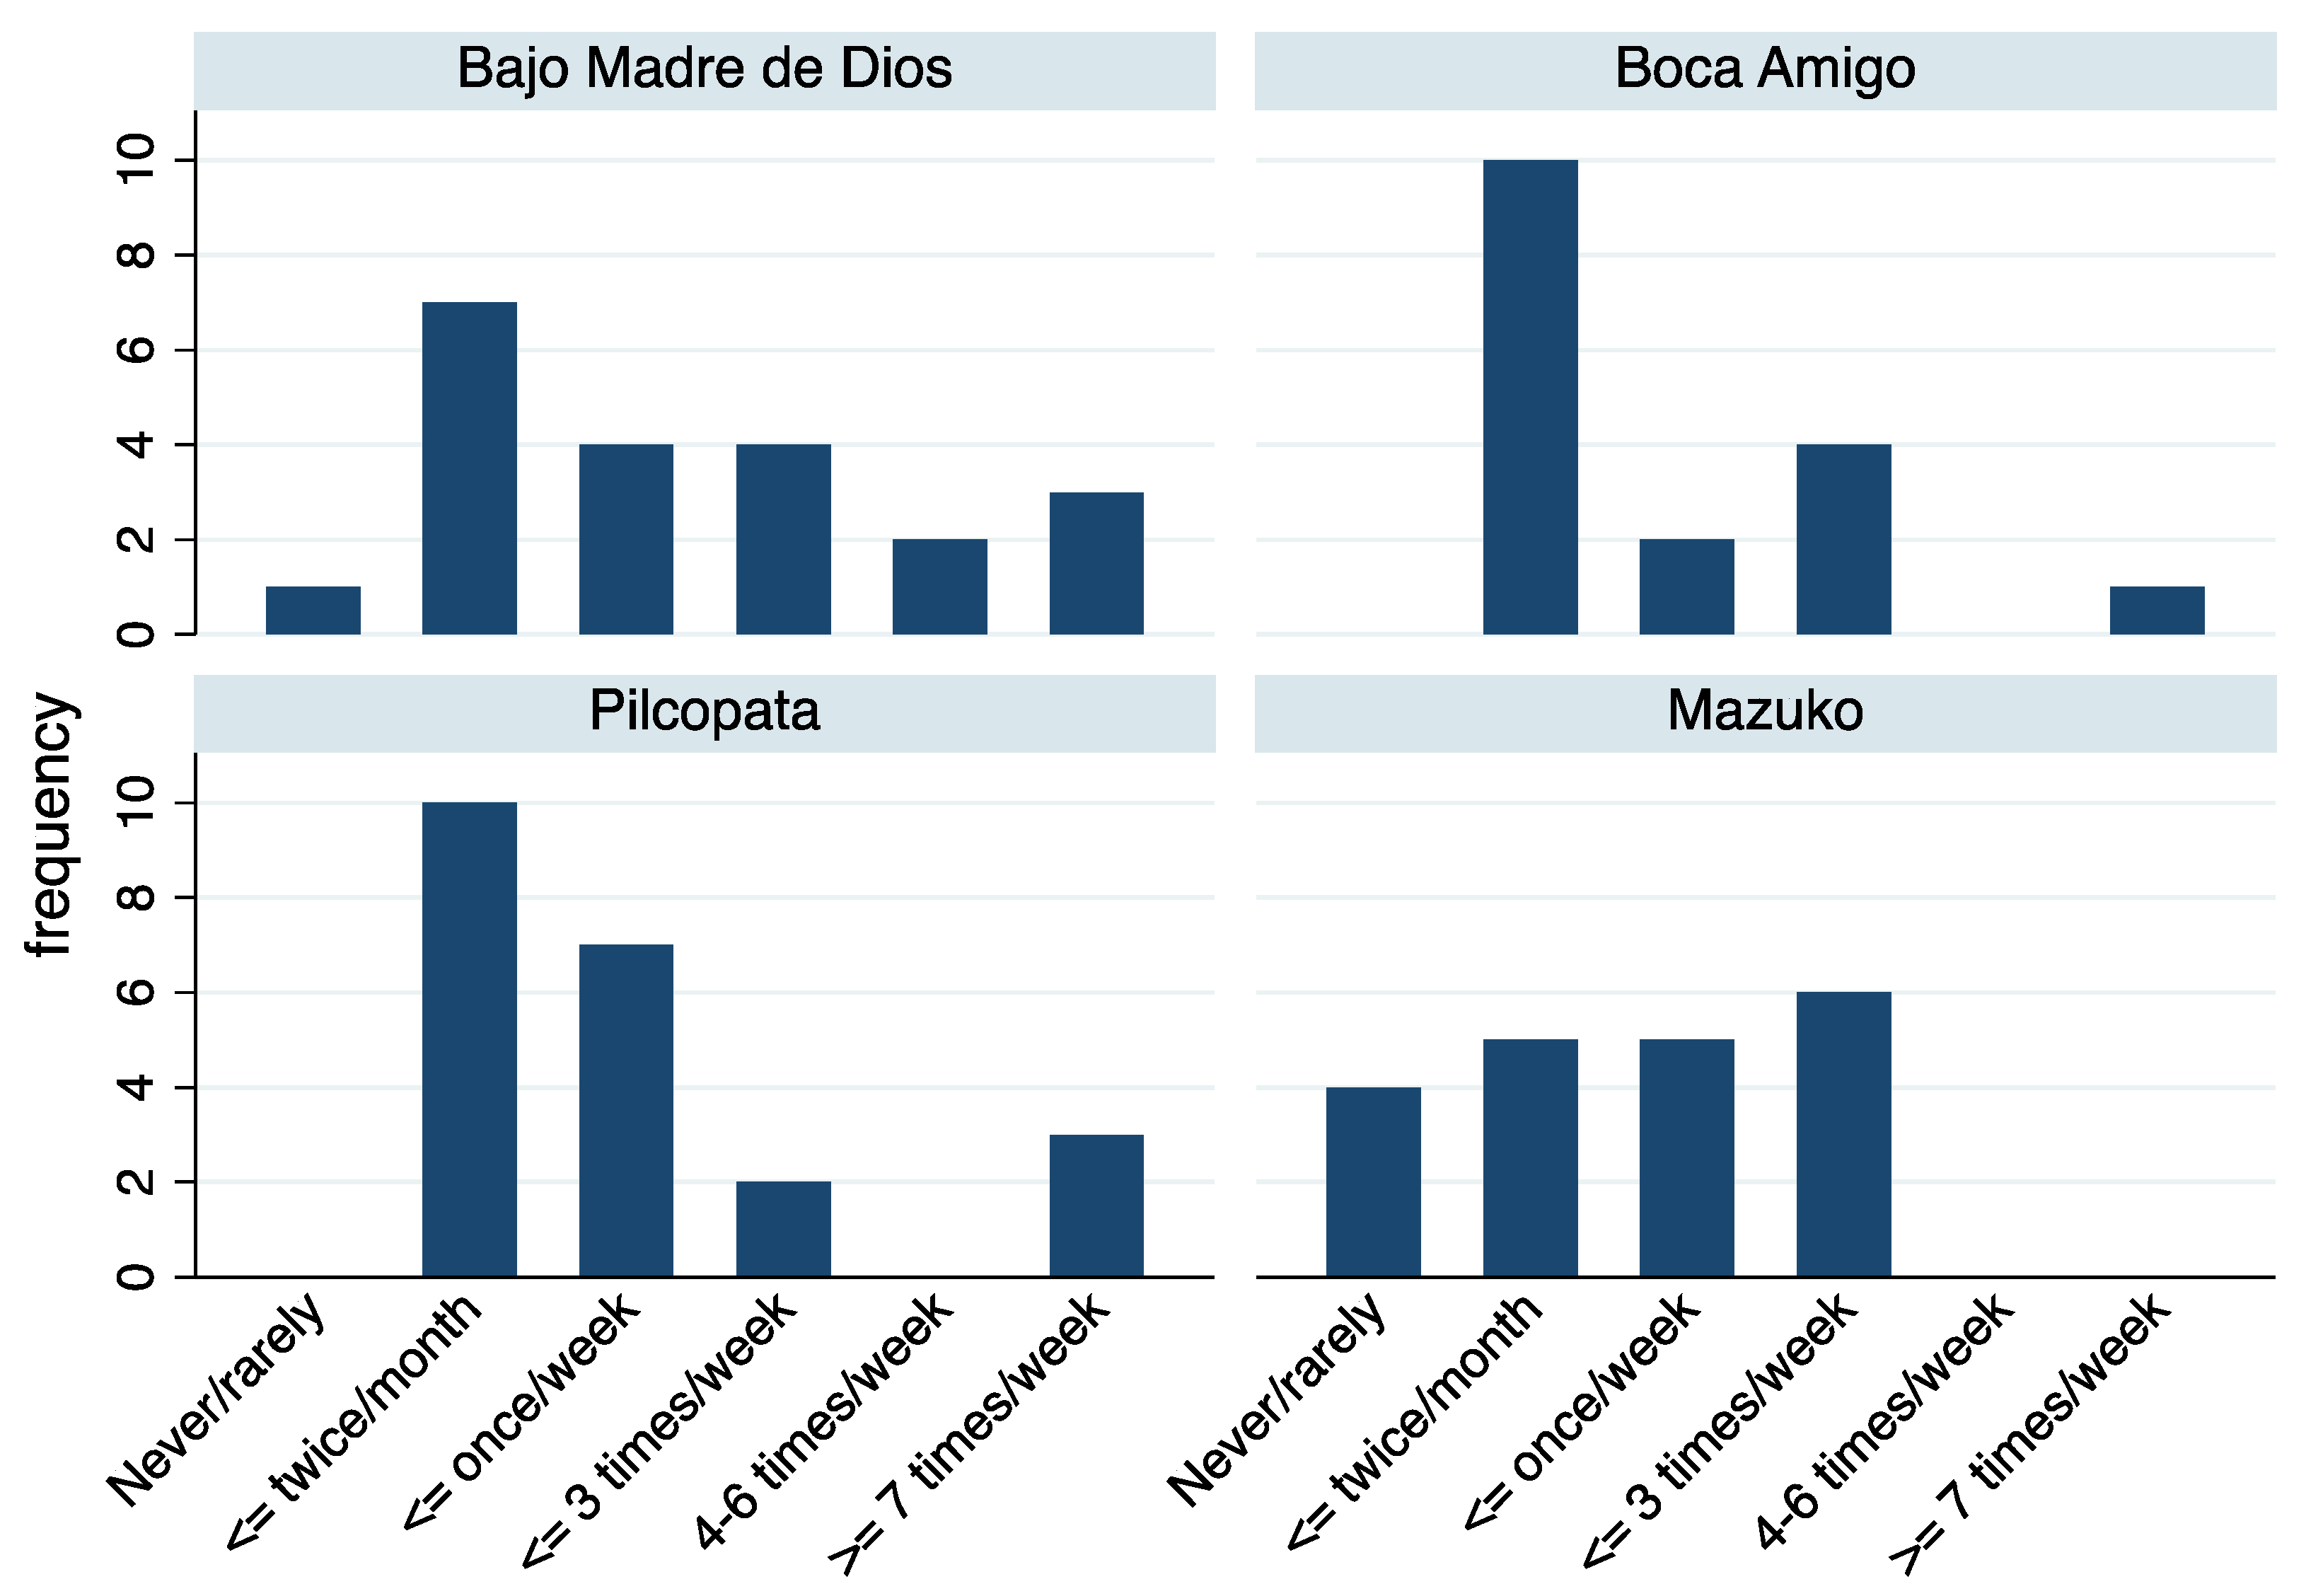
The frequency of fish consumption was correlated with the number of servings of fish in the three days prior to the survey (Spearman correlation coefficient, 0.41, p = 0.002), suggesting that the number of meals containing fish in the prior three days was a useful surrogate measure of fish consumption. Fish and chicken consumption were not correlated (spearman correlation coefficient, −0.12, p = 0.89). Mean servings of fish in the past three days did significantly differ among sites, with Boca Amigo having the highest mean value and Pilcopata the lowest. Finally, the consumption of different fish species (reported in free-text responses to the questionnaire) indicated that the fish species paco and bagre did not differ significantly among sites, but that the consumption of boca chico, sabalo, doncella, and zungaro did. Participants in Pilcopata were the least likely to consume any of these four types of fish; participants in Mazuco were the most likely to consume boca chico and sabalo, while participants in Boca Amigo were the most likely to consume doncella and zungaro.
Figure 2 shows the distribution of the reported frequency of fish consumption by study site. Boca Amigo and Pilcopata had the greatest fraction of participants reporting an infrequent (i.e., two times per month or less) consumption of fish, while Bajo Madre de Dios and Pilcopata had the greatest fraction of participants reporting very frequent consumption (i.e., greater than or equal to seven times per week).
3.2. Human Hair Mercury Results
Table 4 shows the descriptive statistics for the total mercury levels in human hair. All of the collected hair samples had a sufficient mass for laboratory analysis. The control site, Pilcopata, had the lowest arithmetic and geometric mean and standard deviation, and there was only a single individual at Pilcopata that had mercury readings above the PTWI total hair mercury equivalent level of 2.2 µg/g. The highest arithmetic and geometric mean total mercury levels were found at the downriver mining sites Boca Amigo and Bajo Madre de Dios; these two sites also had the highest measured values of any of the four sites. At both Boca Amigo and Bajo Madre de Dios, two-thirds or more of the hair samples exceeded the reference level. ANOVA results indicated that the arithmetic and geometric mean levels of total hair mercury differed among the four sites. No significant differences in arithmetic or geometric mean levels of total hair mercury were noted when considering sex, either overall or within any of the four sites. The fraction of samples exceeding the reference level significantly differed among sites. No significant differences in the fraction of samples exceeding the EPA limit for total hair mercury were noted between sexes, either overall or within a site.
Unadjusted linear regression models using a single dependent variable regressed on the log-transformed total hair mercury level, yielded p-values > 0.05 for nearly all variables. However, the coefficients for three of the four sites (reference site: Pilcopata) yielded p-values < 0.0001. Each of these site indicator variables showed positive coefficients for log-transformed total hair mercury levels, when compared to the reference site. These variables were selected for inclusion in an adjusted linear regression model.
A similar approach was used for logistic regression, with the dependent variable being the total mercury hair level in excess of the 2.2 µg/g PTWI total hair mercury equivalent level. The majority of independent variables assessed did not reach statistical significance. However, as with the linear regression models, the coefficients for three of the four sites (reference site: Pilcopata) reached statistical significance. These variables were selected for inclusion in an adjusted logistic regression model.
Table 5 shows the results of the multivariable adjusted linear and logistic regression models. Linear regression model one included the only variable (site) that reached statistical significance. The two farthest downriver ASGM communities (Bajo Madre de Dios and Boca Amigo) both had substantially larger coefficients than the upriver community (Mazuco), and all three of these communities had elevated levels of mercury compared to the reference community (Pilcopata). Adjustment for other factors, including age, sex, education level, frequency and type of fish consumption, and frequency and type of other protein consumption, only resulted in marginal improvements to the model. Model two is adjusted for age and sex, and had an essentially identical model fit (0.51 R
2).
Logistic regression model three shows the only variable (site) that reached significance in the logistic regression analysis. Consistent with the results of linear regression models one and two, logistic regression model three showed that the two farthest downriver ASGM communities (Bajo Madre de Dios and Boca Amigo) both had substantially larger ORs than the upriver community (Mazuco), and all three of these communities had elevated levels of mercury compared to the reference community (Pilcopata). Participants in Boca Amigo were 5.9 times more likely to have mercury levels in excess of the 2.2 µg/g reference level than those in Pilcopata. As with the linear regression models, adjustment for other factors (e.g., age, sex, education level, frequency and type of fish consumption, and frequency and type of other protein consumption) resulted in negligible improvements to the model. Logistic regression model four, which adjusted for age and sex, achieved a virtually identical pseudo-R2 (0.40).
3.3. Fish Sample Results
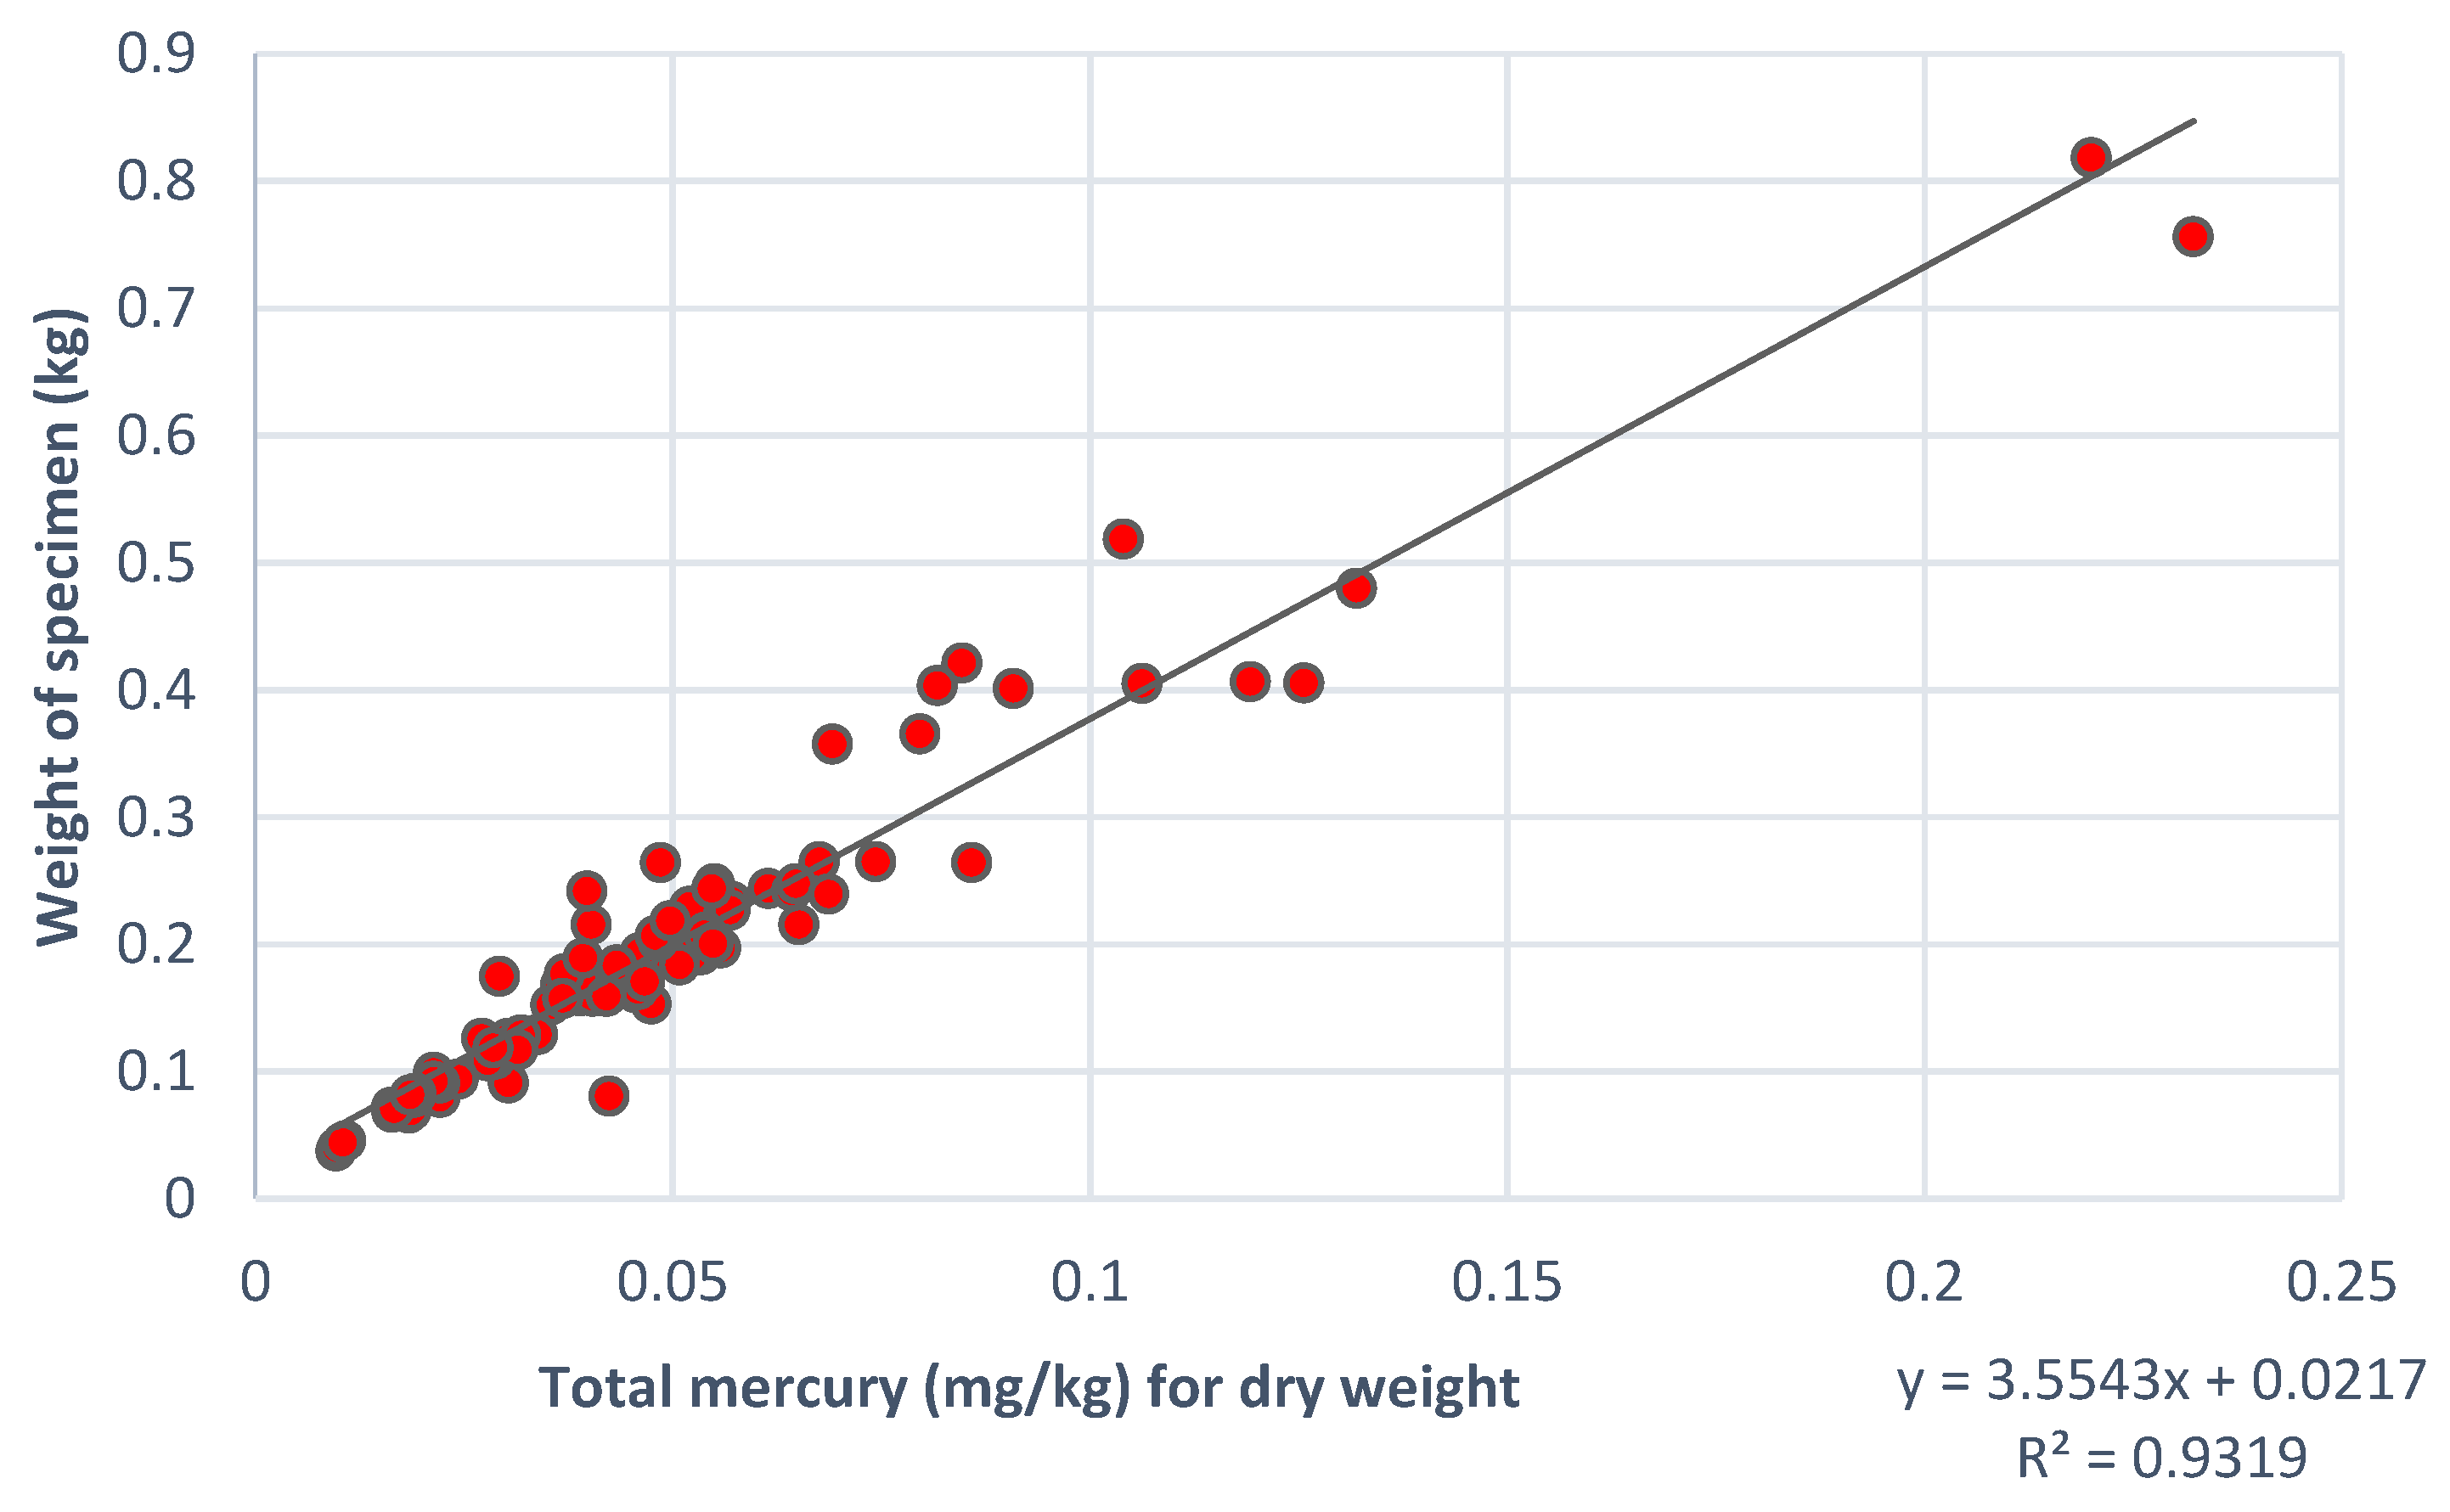
The weight of the fish specimen was positively correlated with mercury (mg Hg/kg dry fish tissue) (
Figure 3). The R
2 value of the relationship between fish specimen weight in kg and total mercury concentration in dry fish tissue, was 0.932. The fish sampled were between approximately four and eight months old at the time of sacrifice (i.e., fingerling transplant to aquaculture pond plus four to eight months of growth).
The arithmetic and geometric mean total mercury concentration for all 111 samples across the four study sites are shown in
Table 6. All samples were below the EPA Tissue Residue Criterion of 0.3 mg/kg. Of all the samples, only two fish from Virgen de la Candelaria had mercury concentrations near this value (0.23 and 0.22 mg Hg/kg wet weight fish tissue). As shown in
Table 6, Mazuco had the lowest mean mercury concentration for both wet weight and dry weight (0.028 mg/kg and 0.106 mg/kg, respectively). The site with the highest mercury concentration was Virgen de la Candelaria (Ww = 0.12 mg/kg Hg and Dw = 0.40 mg/kg Hg). The control site of Ibería had a mean wet weight of 0.04, making it the third lowest concentration.
Figure S1 in the supplementary materials provides a visual representation of these data.
Finally, when mercury levels were modeled by approximate age of fish, the average mercury levels were seen to increase by approximately 0.01 mg/kg per year (data not shown). Fish of approximately four months of age had mean levels of 0.04 mg/kg wet weight, increasing to 0.06 mg/kg at six months of age, and 0.08 mg/kg at eight months of age. Thus, it appears that, as the fish increased in size and had increasing residence time in aquaculture ponds, their mercury levels increased in a roughly linear manner. If this linear trend were to continue through one year of age (the typical age at harvest), the total mercury content would be approximately 0.12 mg/kg, which is still well below the EPA tissue residue criterion of 0.3 mg/kg.
4. Discussion
The results of this study suggest that people living in communities in the Madre de Dios region of Peru where ASGM activities occur are subjected to higher mercury exposure than those living in a non-mining community. Residence in a ASGM community was associated with highly increased odds of total hair mercury levels exceeding the reference level of 2.2 µg Hg/g hair (ORs of 5.8, 3.8, and 2.2 for participants in Bajo Madre de Dios, Boca Amigo, and Mazuco, respectively). These ORs suggest a dose-response relationship, with the communities furthest from the headwaters of the Madre de Dios River (Bajo Madre de Dios and Boca Amigo) having the highest odds of exceeding the 2.2 µg/g PTWI total hair mercury equivalent level. Measurements of paco purchased from aquaculture farms in the region did not identify any samples with levels of mercury that exceeded the EPA tissue residue criterion of 0.3 μg Hg/kg wet weight. The site used as a control, Iberia, did not have the lowest levels of mercury in sampled fish, but levels from this site were among the lowest of all sites evaluated. Collectively, these results suggest that ASGM activities are associated with higher human mercury exposure, and that farmed fish contribute little to mercury exposure.
Our human hair analysis results are generally consistent with several prior studies that have evaluated human exposure to mercury in Peru. Among 226 adults from the capital city of Madre de Dios, Puerto Maldonado, the average hair mercury concentration was two to three times higher than the reference level of 2.2 µg Hg/g hair. [
45]. A 2012 study on the mercury levels in human hair among 104 participants in the town of Puerto Maldonado in Madre de Dios and 100 participants in an ASGM mining zone in the region, found that residence location and sex were correlated with higher mercury levels, and that the total levels of mercury in hair were significantly higher in the mining zones [
46]. A study of 103 ASGM miners in Madre de Dios in 2010 found that all participants had detectable levels of mercury in urine, and 91% had detectable levels of blood methylmercury [
47]. As with the study by Ashe (2012) [
46], Yard et al. (2012) [
47] found that higher fish consumption was associated with increased hair mercury levels; Yard et al. further found that exposure to heated gold-mercury amalgam was correlated with higher hair mercury levels.
Our results do not match those of similar studies in concluding that the amount of fish consumed correlates with increased mercury levels. It is possible that, due to the timing of this study, fish was not currently in season and had not been for several months. Therefore, the level of total mercury may be higher in the study populations during the dry season, when fishing is more lucrative and diets depend more heavily upon river fish as a staple food. Additionally, the metric for fish consumption used in this study relied on self-reported dietary behaviors, and may be susceptible to recall or other reporting biases. Other studies have also shown a correlation between sex and total hair mercury levels [
45,
46]; we did not identify such a relationship here.
The fish sample results were consistent with two of four previous studies of mercury concentrations in fish in the Madre de Dios region. A 1997 study measured the level of mercury and methylmercury in samples from seven fish families in the Manu River in Madre de Dios. The total mercury levels in two samples of paco were 0.053 and 0.067 µg Hg/gram wet weight [
49]—i.e., below the EPA tissue residue criterion, and similar to those found here. The total mercury concentrations in paco purchased from markets in the capital of Madre de Dios, Puerto Maldonado, were below the EPA criteria for methylmercury (mean 0.24 mg/kg) [
45], though it is important to note that fish sold at this market may not have been locally caught or raised. Two other studies of species of fish which are common in the Madre de Dios river found average total and methylmercury concentrations above the EPA tissue residue criterion [
45,
51]. Future research needs to include an investigation on different fish species, as well as different fish sources (farmed versus river caught, etc.). In addition, future research should consider the characteristics of individual ponds, such as pond age, source of water used, distance of pond from mining activities, fish fry source, etc., to eliminate possible confounding.
Our study has several important limitations. First, the illegal and informal nature of mining and political circumstances may have influenced participation rates among households in the four research sites. If so, this would have negatively biased the total hair mercury results presented here, as households actively engaged in mining may have been less likely to participate. Our methods of recruitment meant that we were not able to compute quantitative participation rates. Second, our study utilized convenience sampling instead of random sampling. This limits the generalizability of our findings. Third, the fish samples analyzed were well below the one-year age at which aquaculture fish are typically harvested for market sale, which may have negatively biased their measured mercury levels. Fourth, there was a potential temporal mismatch between our survey items related to fish and other protein consumption, which were intended to assess consumption in a typical week, and the measurements of hair mercury, which reflected mercury exposure over the several months prior to sample collection. Finally, our regression model development approach used a conventional statistical approach (i.e., binary cutoff
p-values for stepwise model building). This approach may have resulted in some potentially important risk factors being discarded during our model building efforts [
61,
62], but was considered appropriate given our small sample size and the exploratory nature of our analyses. Nevertheless, our finding that the total hair mercury levels were statistically significantly higher in communities where ASGM activities occur, supports the idea that anthropogenic activities increase the risk of exposure to mercury and suggests that further study incorporating a consideration of occupational, residential, and changing nutritional exposures is needed.
5. Conclusions
Low levels of total hair mercury in the control study population near the headwaters, where ASGM mining was not occurring during the study period, suggest that higher total hair mercury levels observed in communities were associated with the presence of ASGM mining. We did not observe the levels of total hair mercury to be related to levels of mercury in the local fish. Our inability to assess the ASGM status among individual subjects limits our ability to evaluate the impact of ASGM activities on individual doses of total hair mercury, and may have resulted in an underestimation of mercury exposure in the subjects of the three ASGM communities assessed. The frequency of the consumption of fish and the number of fish consumed did not prove to be predictive of observed levels of total mercury in hair. More studies are needed to determine what species of fish, and what sources of fish, are lowest in mercury concentration for human consumption.
In all 111 observations of farmed fish in the region of Madre de Dios, there were no levels of mercury above the EPA Tissue Residue Criterion, though it is important to note that the fish sampled were only, on average, about one-half the age of harvest in the region of Madre de Dios, and so our estimates of mercury levels in fish at the time of harvest for sale or consumption are likely to be low. Also, the fish ponds sampled as part of our study were relatively new (a few years old on average), and it is likely that, as the ponds age, methylmercury will continue to accumulate through transformation after atmospheric deposition in the stagnated pond water. Finally, paco are omnivorous fish, and so it is expected that they would have a lower mercury concentration under natural conditions than other carnivorous fish.
Our study has shown that there may be an increased risk of mercury exposure in some populations in the region of Madre de Dios; this risk appears to be dependent upon location. Further research on historical mercury levels in sediments throughout the river basin, localized biotic and abiotic factors affecting environmental chemical processes, and the analysis of similar populations along the main channel of the Madre de Dios River, as well as its tributaries, would help to definitively quantify the impact that anthropogenic releases of mercury from ASGM has on the human population and ecosystem.


