1. Introduction
In recent years, the air pollution problem generated by unprecedented urbanization and economic growth in China has become one of the greatest urban issues, particularly fine particulate matter (PM
2.5) pollution [
1]. PM
2.5, consisting of particles with aerodynamic diameters smaller than 2.5 μm, can absorb more hazardous substances than coarse particles and enter the human body by respiration, resulting in various respiratory and cardiovascular diseases [
2]. Some epidemiological studies have confirmed that a long exposure to PM
2.5 will greatly increase rates of cardiopulmonary morbidity and mortality [
3,
4]. Therefore, gaining a better and clearer understanding of PM
2.5 pollution is of vital significance in preventing pollution and protecting public health.
Numerous studies have been conducted on PM
2.5, mainly focused on the spatial and temporal distribution [
5,
6,
7,
8,
9,
10], source apportionment [
11,
12,
13,
14], health effects [
15,
16,
17,
18], and estimation [
19,
20,
21,
22]. Studies have shown that at the macro-scale, PM
2.5 pollution is significantly influenced by meteorological conditions [
23,
24,
25,
26]; at the micro-scale, PM
2.5 pollution is strongly related to the land use pattern [
27,
28,
29,
30]. Some researchers have suggested that optimizing the land use pattern may mitigate PM
2.5 pollution at a city or community level [
31,
32,
33]. However, there are only a few researches analyzing the effect of land use on PM
2.5 pollution and the consensus about the exact nature of their relationship has not yet been reached [
28,
34]. Thus, exploring the effect of land use on PM
2.5 pollution seems to be urgent and significant.
To conduct research on the impact of land use on PM
2.5 pollution, available PM
2.5 data are critical. However, gaining access to enough PM
2.5 data creates a big challenge. Several approaches have been developed over the last decade to solve this challenge, including spatial interpolation (e.g., kriging and inverse distance weighing), air dispersion models, and land use regression (LUR) models. The interpolation of pollutant concentrations is based on dense monitoring sites, while the routine monitoring sites are often too sparse. Dispersion models simulating the fate of pollution and transport can be useful, but are often infeasible at a high spatial resolution and are extremely dependent on accurate and spatially resolved input data [
35,
36]. In recent years, LUR models have been proved to be a valid and cost-effective alternative to these conventional approaches [
37]. LUR models are statistical regression models based on a Geographical Information System (GIS) platform. They can be used to predict the concentration of atmospheric pollutants at a given site by establishing a statistical relationship between pollutant measurements and potential predictor variables, e.g., land use, traffic, and physical characteristics, etc. [
37]. This approach was initially applied to air pollution in the SAVIAH (Small Area Variations In Air quality and Health) study [
38]. Since then, it has gained an increasing amount of attention all over the world.
This paper therefore aims to employ LUR models and statistical analysis to explore the effect of land use on PM2.5 pollution in urban areas. Nanchang, the capital city of the Jiangxi province, was selected as a case study. It is a representative city of central China, but has been facing a serious PM2.5 pollution problem due to ongoing construction and heavy traffic. We applied LUR models to simulate the spatial variations of PM2.5 concentrations in the Nanchang urban area, analysis of variance and multiple comparisons to study the PM2.5 concentration variances among different types of urban functional zones, and multiple linear regression to investigate PM2.5 concentration variances among the same type of urban functional zones. The research results could help correctly understand the PM2.5 pollution pattern in urban areas. More importantly, they could provide a theoretical basis for urban PM2.5 pollution control.
2. Materials and Methods
2.1. Study Area
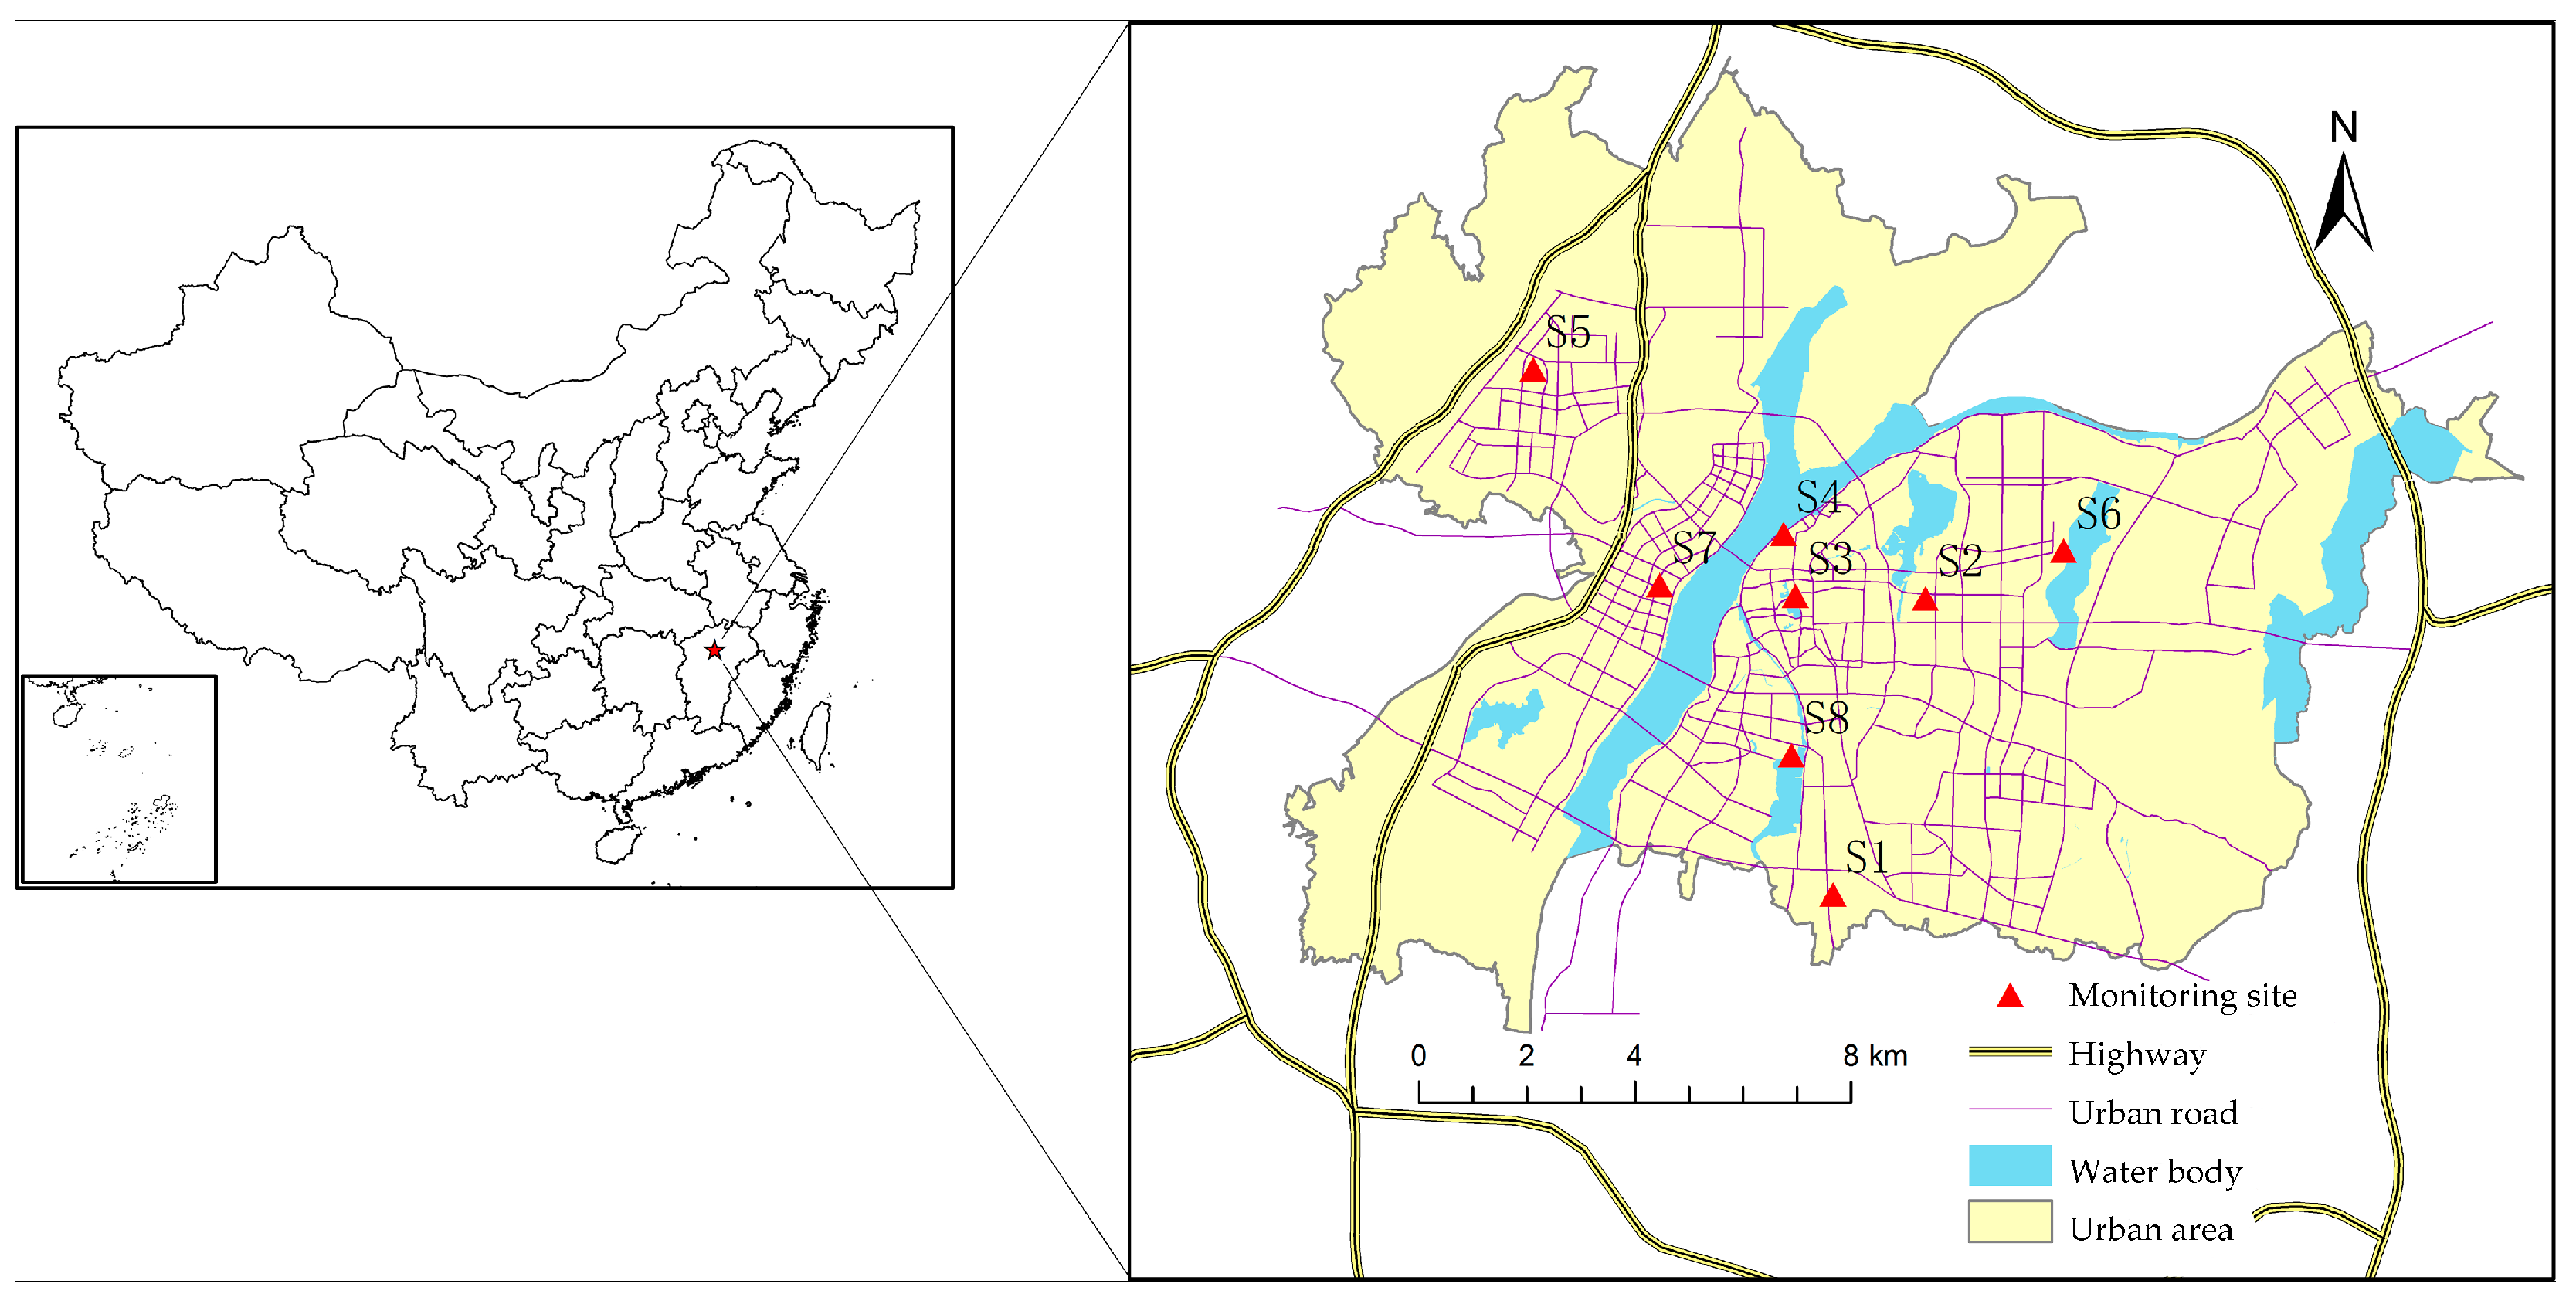
Nanchang City (28°09′ N–29°11′ N, 115°27′ E–116°35′ E), the capital of the Jiangxi Province, China, is located in the southwest of Poyang Lake and the middle-and-lower reaches of the Yangtze River. It belongs to a subtropical monsoon climate zone, with an average annual temperature ranging from 17 to 17.7 °C and an annual precipitation value of 1600–1700 mm. Nanchang is an important transportation and shipping center in central China. Many highways and railways traverse this region. The city has experienced a rapid population growth and increase in vehicles in the past decade. By the end of year 2014, the residential population of Nanchang city was 5.24 million and the number of vehicles reached 618,100. All of these factors contribute to the tremendous flow of vehicles per day and the significant amount of pollutants such as PM
2.5. The study was conducted in the Nanchang urban area that has been defined by the Land Use Planning, which covers an area of 562.46 km
2. There are nine nation-standard PM
2.5 monitoring sites defined by the China Environmental Monitoring Center (CEMC) reporting monitor data in the city on an hourly basis, and eight of them are located within the study area (
Figure 1). The eight monitoring sites are located in different urban functional zones. S1 and S3 are located in the residential zones, S2 and S7 are in the educational zone, S4 and S6 are in the industrial zones, S8 is in the commercial zone, and S5 is in the control functional zone.
2.2. LUR Model Setting
The equation of the LUR models is expressed as follows:
where the dependent variable
y is the pollutant concentrations, independent variables
X1...Xn are the potential variables,
β1...βn are the associated coefficients, and
ε is the constant intercept.
2.2.1. Dependent Variable and Independent Variables
The monthly mean values of PM
2.5 for the eight monitoring sites in 2014 were collected from the Nanchang Environmental Monitor Center (
Table 1), and the specified monitoring site locations were also provided by the Monitor Center.
The independent variables could be categorized into four classes: meteorological factors, traffic-related factors, land use factors, and population density. Circular buffers were created for 0.3, 0.6, 0.9, 1.2, 2.4, and 4.8 km radii using ArcGIS 10.2 (ESRI, Redlands, CA, USA). In total, 42 variables were used to build the LUR models. Each independent variable was explained as follows. A description of the independent variables is reported in
Table 2.
Five meteorological variables were employed to characterize the weather conditions. They were relative humidity, air pressure, water vapor pressure, temperature, and wind speed. The monthly average values of the meteorological variables in 2014 were obtained from the Chinese Meteorological Data Share Service System (
http://data.cma.cn/).
The traffic-related variables included three subclasses: the intensity of main roads, intensity of secondary roads, and intensity of all roads. The road intensity was used to reflect the traffic conditions due to the unavailability of accurate traffic intensity data. Road intensity was computed by dividing the buffer area by the sum of road segments within the buffer. The data were collected from the transportation map of Nanchang urban master planning from 2011.
Three subclasses of variables including the ecological land proportion (green spaces, rivers, and lakes), industrial land proportion, and distance to large ecological space were used to describe the land use situation. The ecological land or industrial land in every buffer zone was calculated to obtain the values of the ecological land proportion or industrial land proportion. The straight-line distance of the monitoring site to the nearest large ecological space (Gan River, Qinshan Lake, Huangjia Lake, Yao Lake, Xiang Lake, Qian Lake, Aixi Lake, Diezi Lake, and Meiling Forest) was measured to describe the distance to a large ecological space. The data were derived from the Nanchang land use map of 2014 and satellite images from 2014.
The residential land proportion was used to describe the population density as the population density was only available at a district level in Nanchang. The data were derived from the Nanchang land use map of 2014.
2.2.2. Model Development and Evaluation
In our study, twelve months were divided into: spring (March to May), summer (June to August), autumn (September to November), and winter (December to February). The LUR models of four seasons were developed, respectively, with SPSS Statistics 19.0 (IBM Corp., Armonk, NY, USA). The 24 samples of every season were randomly divided into two groups: a training data set and a test data set. A total of 75% of samples were used to develop the model and the remaining 25% were used for the model evaluation. The backward model-building algorithm proposed by Henderson et al. (2007) was introduced [
35]. The steps were as follows: (1) correlation between PM
2.5 and each independent variable was calculated through an individual univariate regression model; (2) variables that had a counter-intuitive correlation with PM
2.5 were eliminated (e.g., traffic-related variables had negative coefficients and the ecological land proportion had a positive coefficient); (3) the highest-ranking variable in each subclass was identified and other subclass variables with a correlation of more than 0.6 with the highest-ranking variable were eliminated; (4) all remaining variables were entered into a stepwise linear regression; (5) the variables that had insignificant t-statistics (0.1) were removed (the t-statistics were lowered from 0.05 to 0.1 to control the meteorological variables); and (6) steps 4 and 5 were repeated until convergence was attained and variables that contributed less than 1% to the
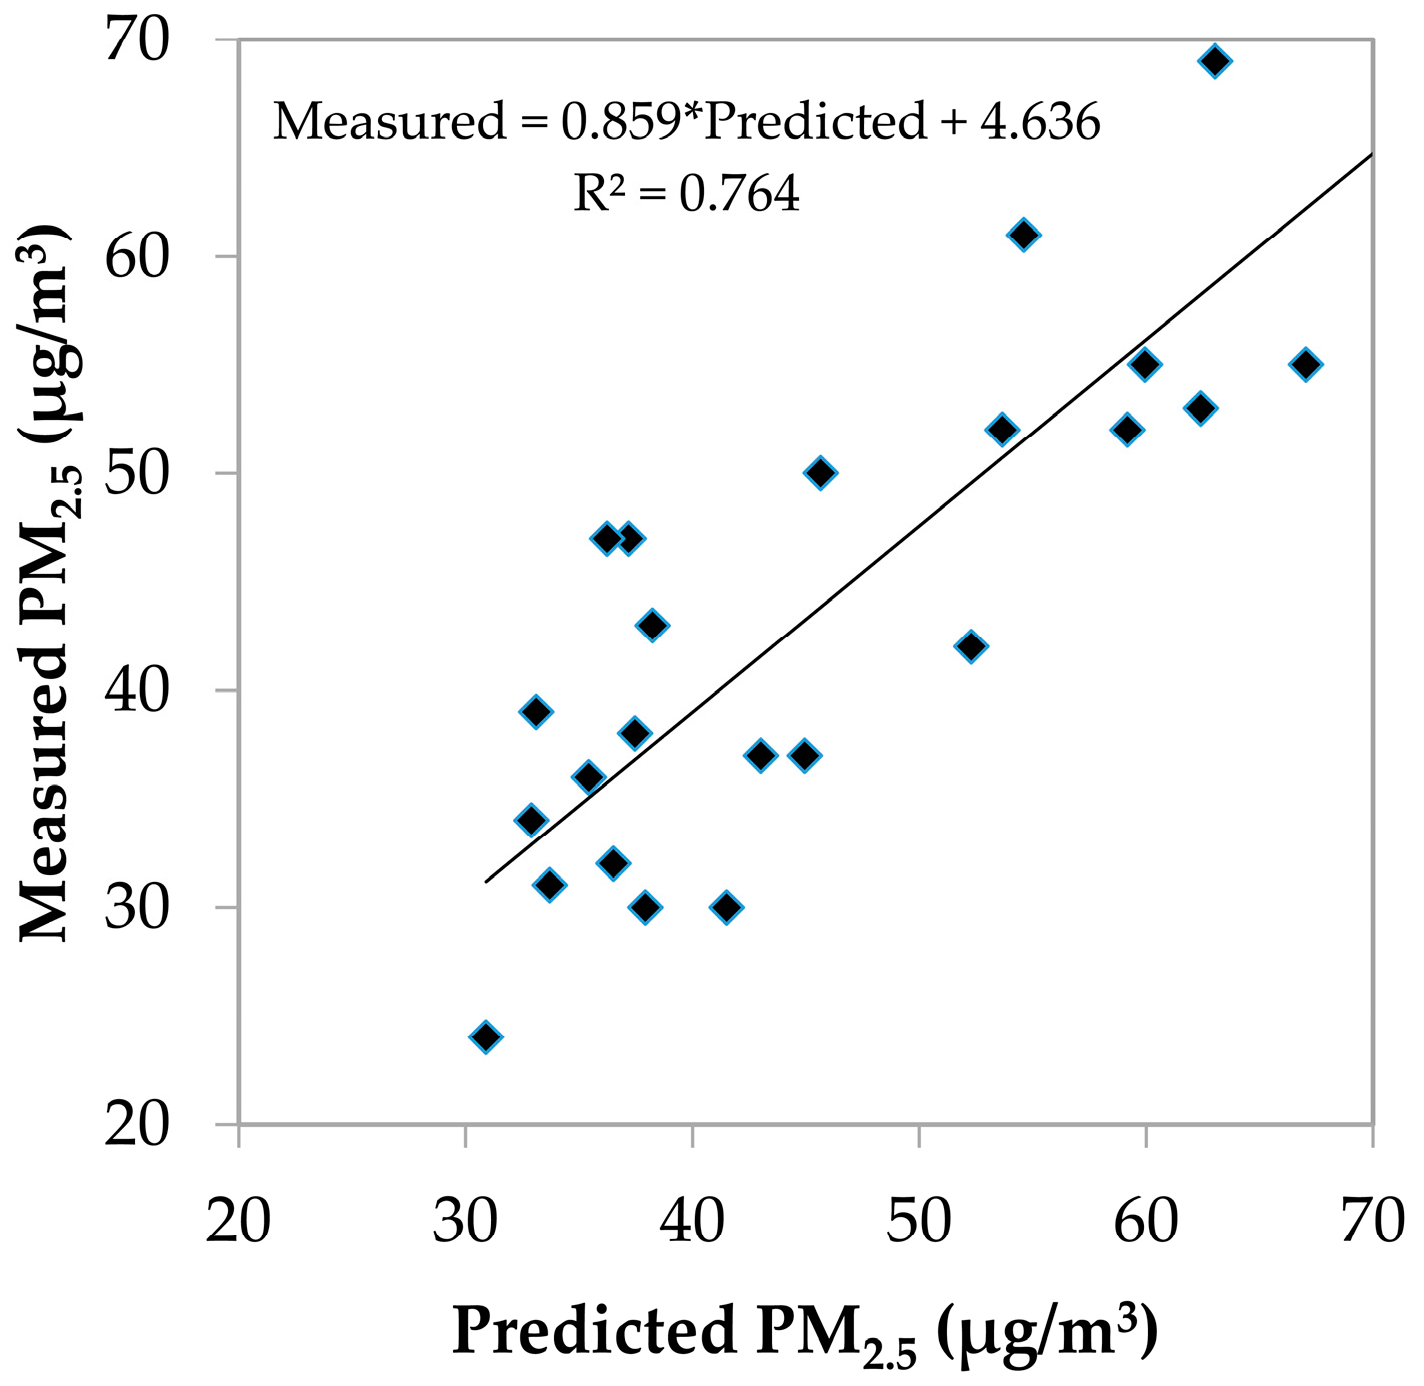
R2 value of the final model were removed. The entire procedure was repeated three times for every season, and thus, three LUR models were developed for every season and the best fitting one was used as the final LUR model. In this way, the a priori division of samples could be avoided. The final LUR models were evaluated by comparing predicted PM
2.5 concentrations with measured PM
2.5 concentrations from the test data set.
2.3. Selection of Urban Functional Zones
Five types of urban functional zones, including commercial, industrial, residential, educational, and control functional zones, were selected in the study area based on the Nanchang urban cadastral survey map and the Nanchang urban master planning map. When choosing urban functional zones, two rules were followed: (1) maintaining integral land parcels; (2) maintaining the evident land use.
In particular, the residential land accounted for more than 50% of the total residential functional zone area; the commercial land accounted for more than 60% of the total commercial functional zone area; and the industrial land (land for high-tech industry and storage included) accounted for more than 40% of the total industrial functional zone area. The land used for universities was chosen as an educational functional zone and one university was usually contained in an educational functional zone. Control functional zones included land use types, e.g., forest, water body, and farmland, and the area of these land use types accounted for more than 80% of the total control functional zone area.
2.4. Statistical Analysis
Once the PM
2.5 concentrations in the urban functional zones had been estimated, the analysis of variance and multiple comparisons test were carried out under the assumption of equal variances (homoscedasticity) and normal distribution. The statistical analysis was accomplished using SPSS Statistics 19.0. The analysis of variance can be used to test the null hypothesis
H0, in which the PM
2.5 concentrations in all functional zones have the same mean values, against the alternative hypothesis
H1, where the mean values
μi of
k groups are not the same. This can be written formally as follows [
39].
The F-ratio and probability value (p-value) were obtained through a one-factor analysis of variance command. If F > F (α, k − 1, N − k), then H1 can be accepted. Additionally, a multiple comparison test is necessary to determine which group pairs’ mean values are significantly different. The least significant difference (LSD) test at a 0.05 level of probability was used to perform multiple comparisons. Using this method, the pairs of functional zones for which the PM2.5 concentrations are significantly different from each other can be identified.
5. Conclusions
This paper attempted to use LUR models to simulate the variances of the PM
2.5 level in the Nanchang urban area and statistical analysis to explore the impact of land use on PM
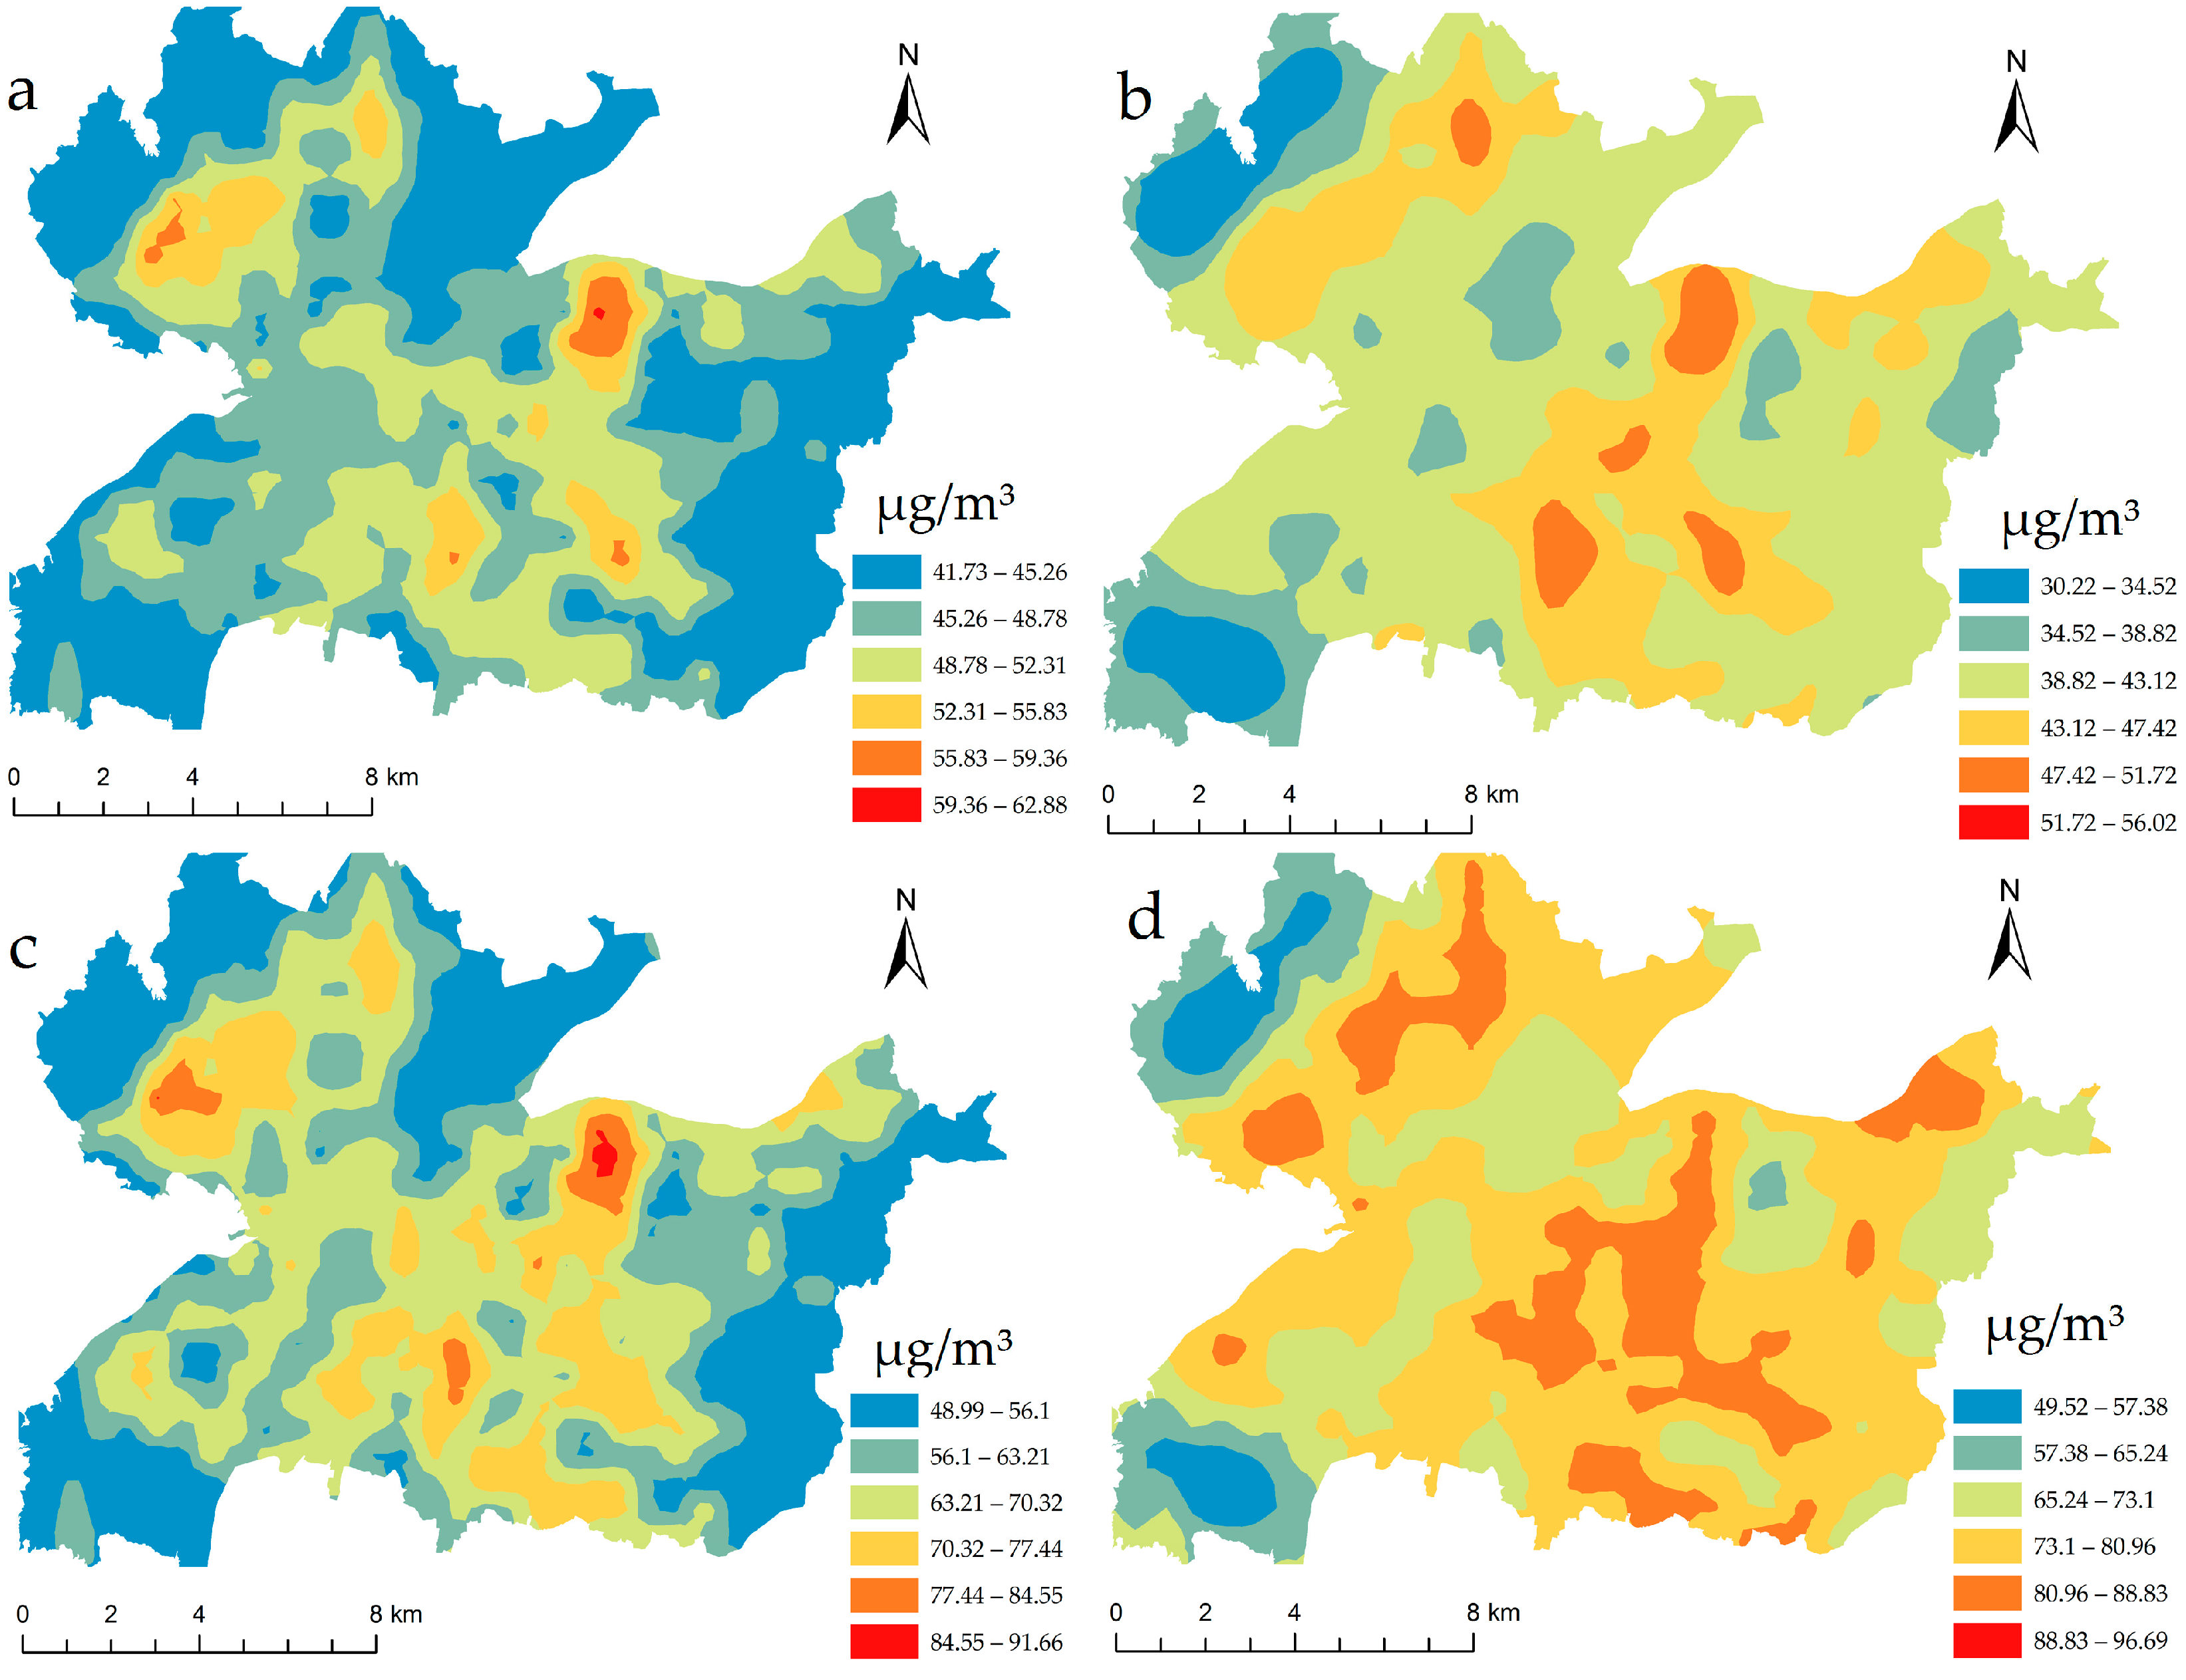
2.5 pollution. The seasonal LUR models showed a good fit and could explain the spatial variability in PM
2.5 concentrations well. PM
2.5 exhibits a large variation in different seasons, with the highest pollution values in winter and the lowest in summer, due to the complicated influence of the meteorological factors of temperature and relative humidity [
53,
54]. Similar to many other studies, the dominant PM
2.5 impacting variable was the traffic conditions that were characterized by the road intensity in this paper [
37,
42,
55,
56,
57]. The analysis of variance and multiple comparison test shows statistically significant variances in PM
2.5 concentrations among different types of urban functional zones throughout the year, demonstrating that the land use types generated a great impact on PM
2.5 concentrations and the impact did not change as the seasons changed. The multiple linear regression results illustrate that the land use intensity indexes including the building volume rate, building density, and green coverage rate exhibited an insignificant or counter-intuitive impact on PM
2.5 concentrations. The study also concludes that the urban functional zone was a proper spatial scale to investigate the impact of land use type on PM
2.5 pollution in urban areas, but might not be a proper spatial scale to explore the impact of land use intensity on PM
2.5 pollution. A reasonable methodology and optimized spatial scale are still yet to be explored to further investigate how land use intensity affects PM
2.5 pollution.


