Green Streets: Urban Green and Birth Outcomes

Abstract
:1. Introduction
2. Materials and Methods
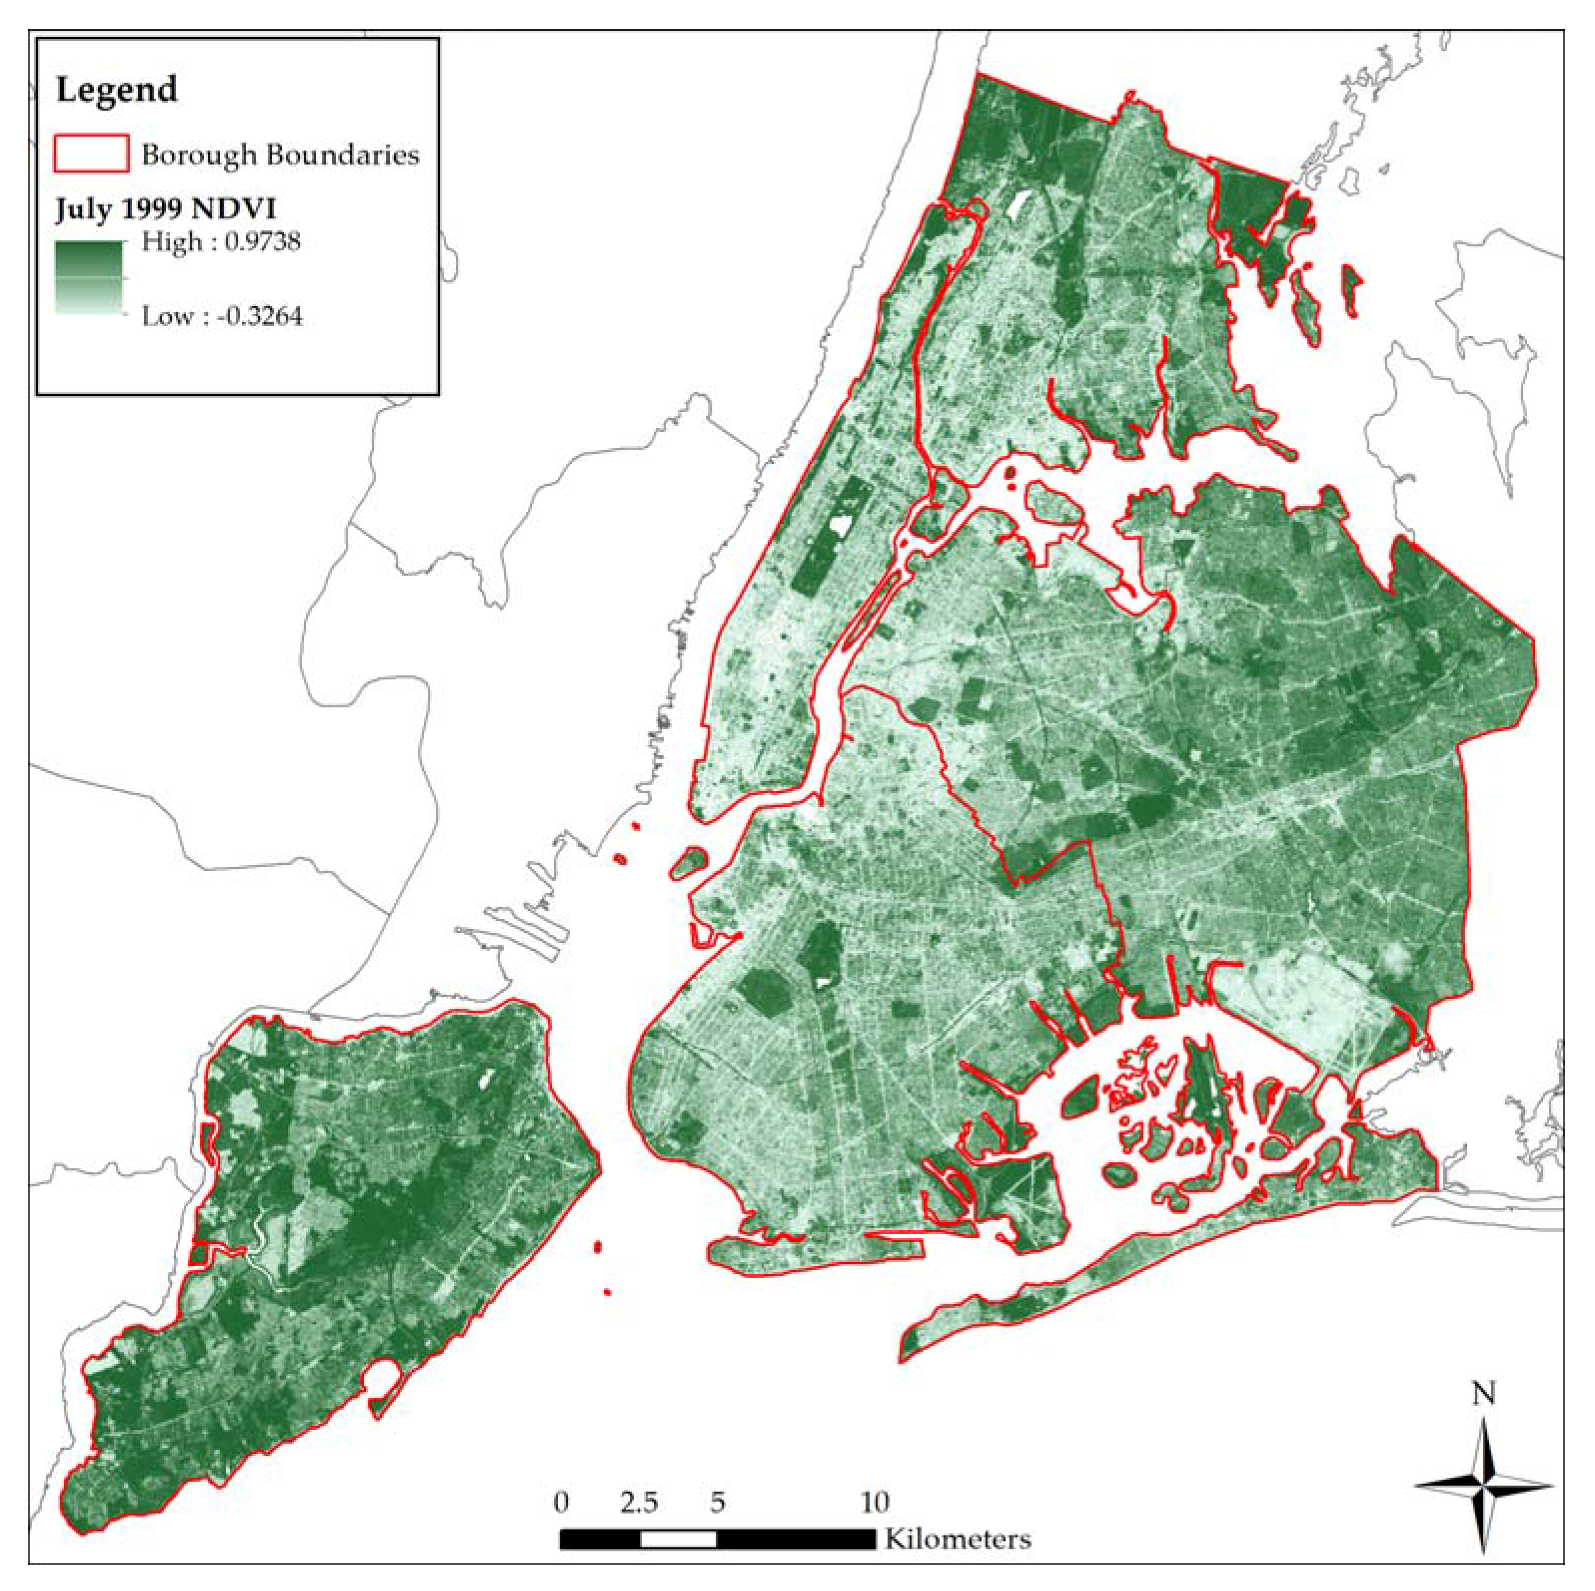
2.1. Study Area
2.2. Birth Outcomes and Individual Covariates
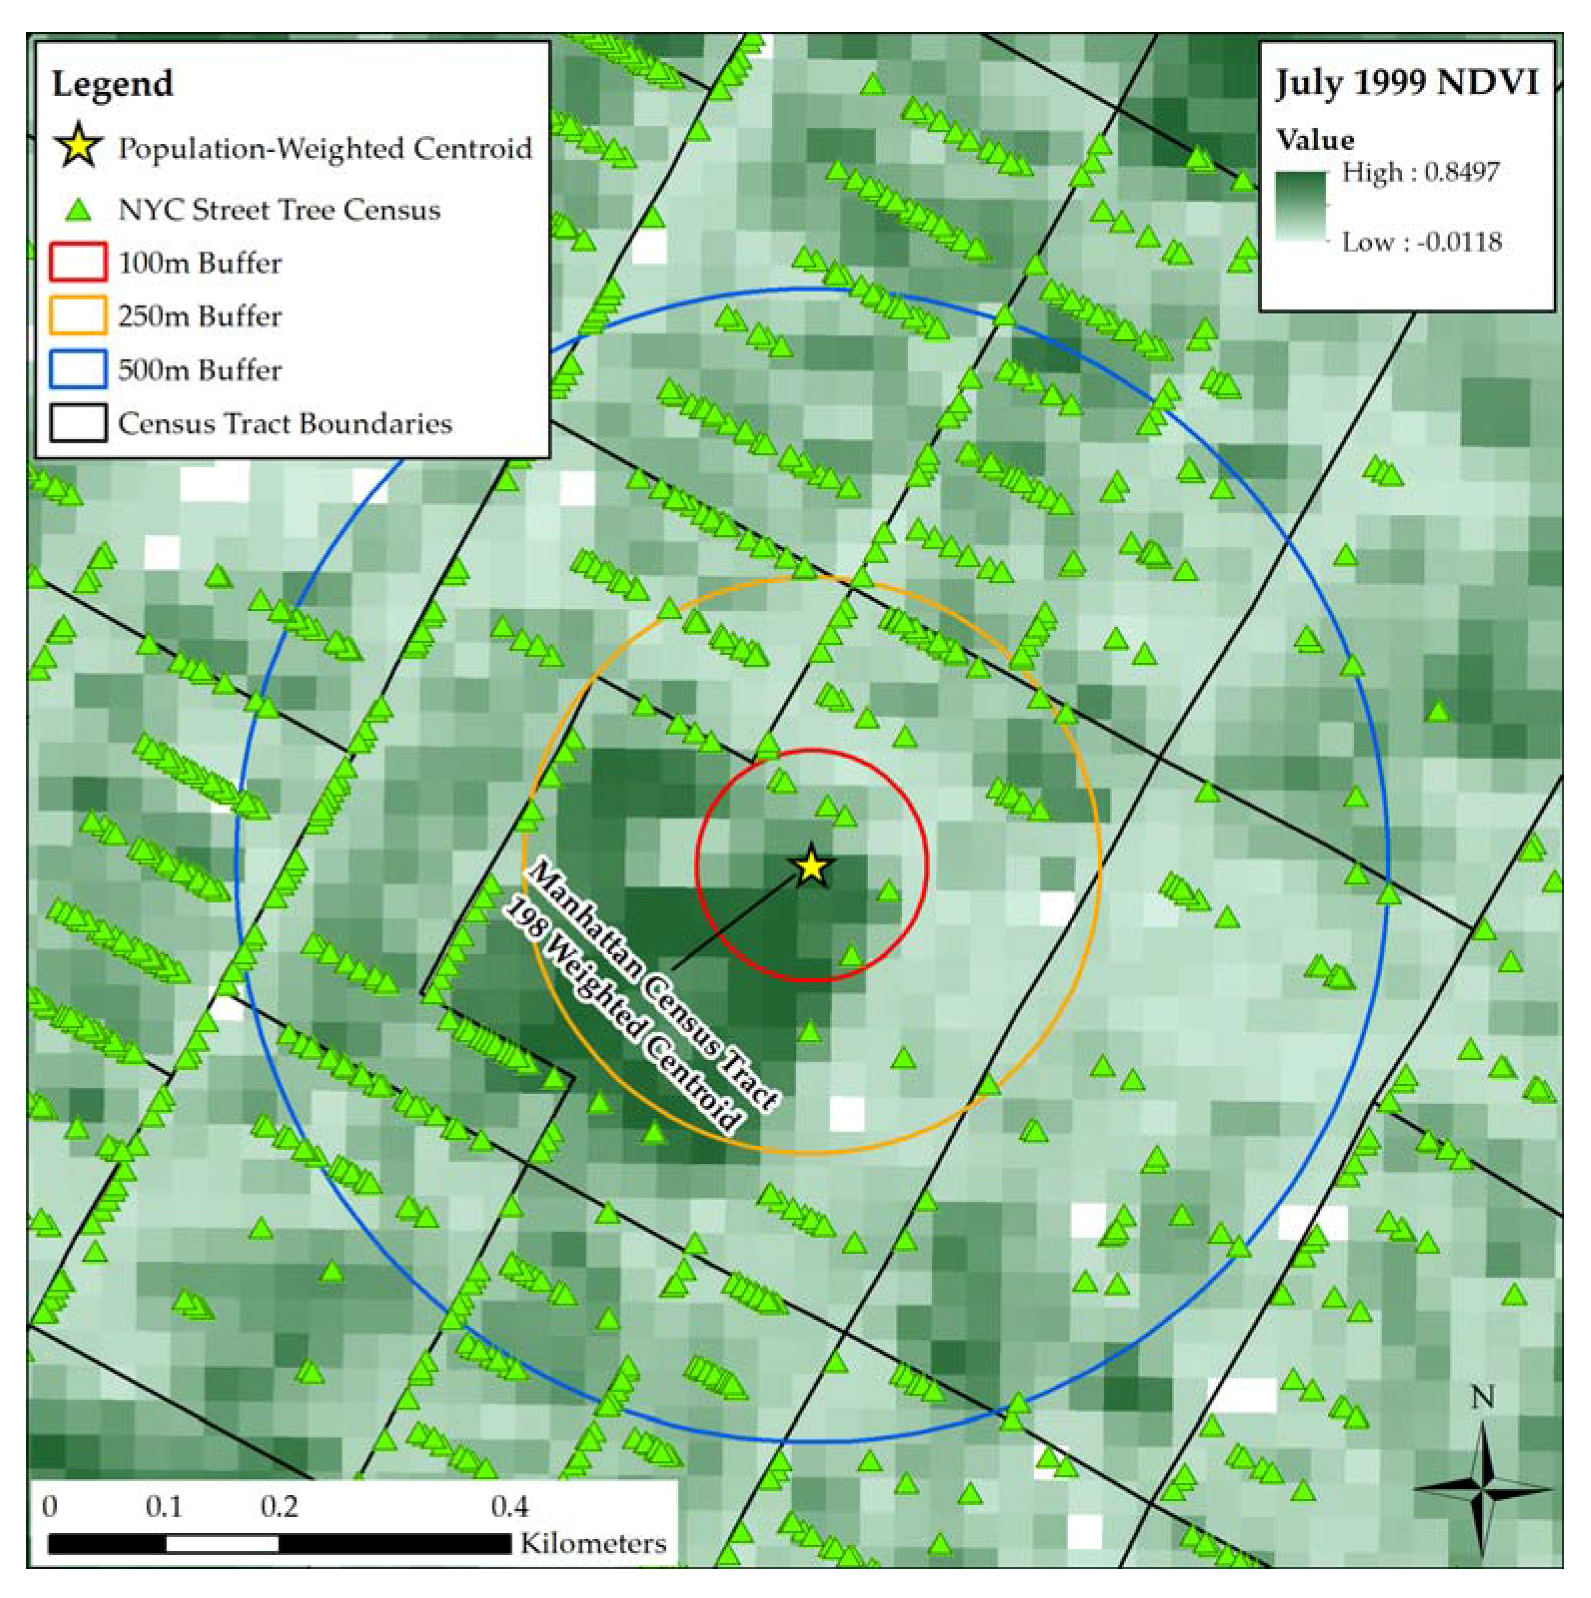
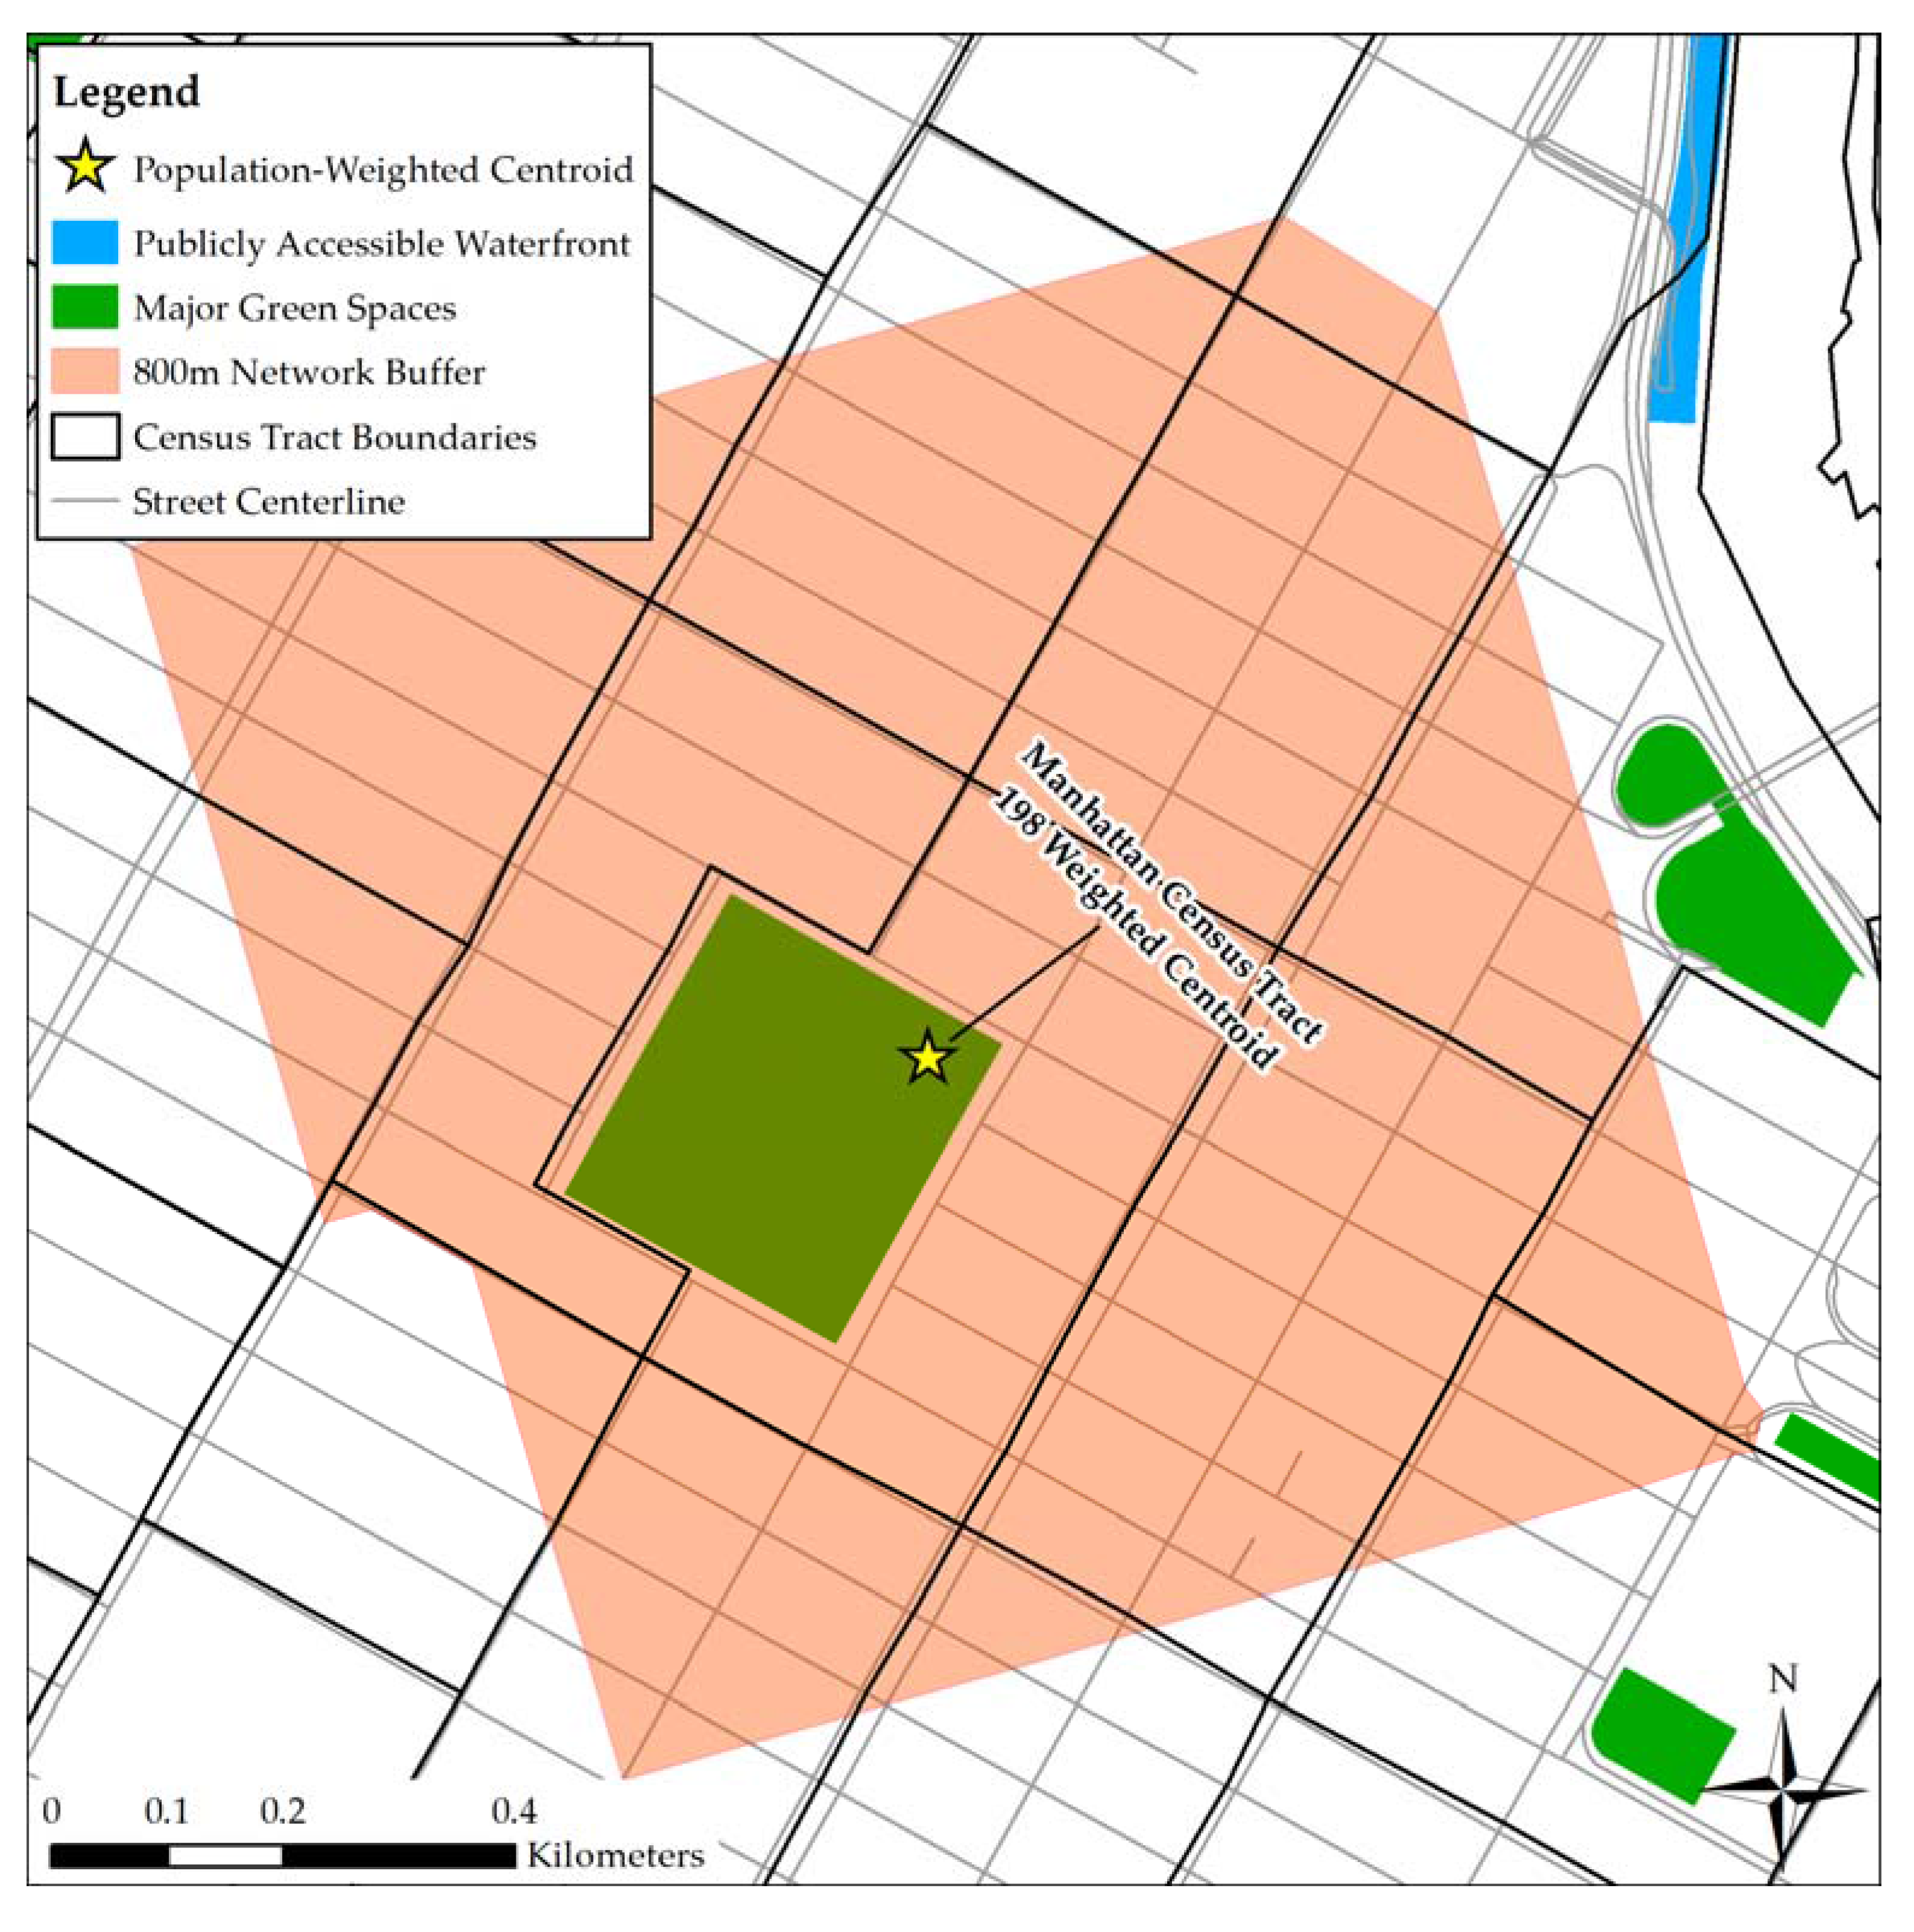
2.3. Measures of Green and Blue Space
2.4. Neighborhood Covariates
2.5. Statistical Methods
3. Results
3.1. Descriptive Statistics
3.2. Mixed-Effects Linear Regression: Term Birthweight
3.3. Mixed-Effects Logistic Regression: Odds of Term Low Birthweight
3.4. Mixed-Effects Logistic Regression: Odds of Preterm Birth
3.5. Mixed-Effects Logistic Regression: Odds of Small for Gestational Age
4. Discussion
4.1. Environmental Factors and Birth Outcomes
4.2. Implications
4.3. Limitations and Recommendations for Future Research
5. Conclusions
Supplementary Materials
Acknowledgments
Author Contributions
Conflicts of Interest
References
- Gascon, M.; Triguero-Mas, M.; Martínez, D.; Dadvand, P.; Forns, J.; Plasència, A.; Nieuwenhuijsen, M.J. Mental health benefits of long-term exposure to residential green and blue spaces: A systematic review. Int. J. Environ. Res. Public Health 2015, 12, 4354–4379. [Google Scholar] [CrossRef] [PubMed]
- Lee, A.C.; Maheswaran, R. The health benefits of urban green spaces: A review of the evidence. J. Public Health 2011, 33, 212–222. [Google Scholar] [CrossRef] [PubMed]
- Dzhambov, A.M.; Dimitrova, D.D.; Dimitrakova, E.D. Association between residential greenness and birth weight: Systematic review and meta-analysis. Urban For. Urban Green. 2014, 13, 621–629. [Google Scholar] [CrossRef]
- Agay-Shay, K.; Peled, A.; Crespo, A.V.; Peretz, C.; Amitai, Y.; Linn, S.; Friger, M.; Nieuwenhuijsen, M.J. Green spaces and adverse pregnancy outcomes. Occup. Environ. Med. 2014, 71, 562–569. [Google Scholar] [CrossRef] [PubMed]
- Casey, J.A.; James, P.; Rudolph, K.E.; Wu, C.D.; Schwartz, B.S. Greenness and birth outcomes in a range of Pennsylvania communities. Int. J. Environ. Res. Public Health 2016, 13, 311. [Google Scholar] [CrossRef] [PubMed]
- Cusack, L.; Larkin, A.; Carozza, S.; Hystad, P. Associations between residential greenness and birth outcomes across Texas. Environ. Res. 2017, 152, 88–95. [Google Scholar] [CrossRef] [PubMed]
- Dadvand, P.; de Nazelle, A.; Figueras, F.; Basagaña, X.; Su, J.; Amoly, E.; Jerrett, M.; Vrijheid, M.; Sunyer, J.; Nieuwenhuijsen, M.J. Green space, health inequality and pregnancy. Environ. Int. 2012, 40, 110–115. [Google Scholar] [CrossRef] [PubMed]
- Dadvand, P.; Sunyer, S.; Basagana, X.; Ballester, F.; Lertxundi, A.; Fernandez-Somoano, A.; Estarlich, M.; García-Esteban, R.; Mendez, M.A.; Nieuwenhuijsen, M.J. Surrounding greenness and pregnancy outcomes in four Spanish birth cohorts. Environ. Health Perspect. 2012, 120, 1481–1487. [Google Scholar] [CrossRef] [PubMed]
- Dadvand, P.; Wright, J.; Martinez, D.; Basagaña, X.; McEachan, R.R.C.; Cirach, M.; Gidlow, C.J.; de Hoogh, K.; Gražulevičienė, R.; Nieuwenhuijsen, M.J. Inequality, green spaces, and pregnant women: Roles of ethnicity and individual and neighbourhood socioeconomic status. Environ. Int. 2014, 71, 101–108. [Google Scholar] [CrossRef] [PubMed]
- Donovan, G.H.; Michael, Y.L.; Butry, D.T.; Sullivan, A.D.; Chase, J.M. Urban trees and the risk of poor birth outcomes. Health Place 2011, 17, 390–393. [Google Scholar] [CrossRef] [PubMed]
- Ebisu, K.; Holford, T.R.; Bell, M.L. Association between greenness, urbanicity, and birth weight. Sci. Total Environ. 2016, 542, 750–756. [Google Scholar] [CrossRef] [PubMed]
- Grazuleviciene, R.; Danileviciute, A.; Dedele, A.; Vencloviene, J.; Andrusaityte, S.; Uždanaviciute, I.; Nieuwenhuijsen, M.J. Surrounding greenness, proximity to city parks and pregnancy outcomes in Kaunas cohort study. Int. J. Hyg. Environ. Health 2015, 218, 358–365. [Google Scholar] [CrossRef] [PubMed]
- Hystad, P.; Davies, H.W.; Frank, L.; Van Loon, J.; Gehring, U.; Tamburic, L.; Brauer, M. Residential greenness and birth outcomes: Evaluating the influence of spatially correlated built-environment factors. Environ. Health Perspect. 2014, 122, 1095. [Google Scholar] [CrossRef] [PubMed]
- Laurent, O.; Wu, J.; Li, L.; Milesi, C. Green spaces and pregnancy outcomes in Southern California. Health Place 2013, 24, 190–195. [Google Scholar] [CrossRef] [PubMed]
- Markevych, I.; Fuertes, E.; Tiesler, C.M.T.; Birk, M.; Bauer, C.; Koletzko, S.; von Berg, A.; Berdel, D.; Heinrich, J. Surrounding greenness and birth weight: Results from the GINIplus and LISAplus birth cohorts in Munich. Health Place 2014, 26, 39–46. [Google Scholar] [CrossRef] [PubMed]
- Hack, M.; Klein, N.K.; Taylor, H.G. Long-term developmental outcomes of low birth weight infants. Future Child. 1995, 5, 176–196. [Google Scholar] [CrossRef] [PubMed]
- Preterm Birth-Maternal and Infant Health—Reproductive Health. Available online: https://www.cdc.gov/reproductivehealth/maternalinfanthealth/pretermbirth.htm (accessed on 27 May 2017).
- Kihal-Talantikite, W.; Padilla, C.M.; Lalloué, B.; Gelormini, M.; Zmirou-Navier, D.; Deguen, S. Green space, social inequalities and neonatal mortality in France. BMC Pregnancy Childbirth 2013, 13, 191. [Google Scholar] [CrossRef] [PubMed]
- Loomans, E.M.; Van Dijk, A.E.; Vrijkotte, T.G.; Van Eijsden, M.; Stronks, K.; Gemke, R.J.; Van den Bergh, B.R. Psychosocial stress during pregnancy is related to adverse birth outcomes: Results from a large multi-ethnic community-based birth cohort. Eur. J. Public Health 2013, 23, 485–491. [Google Scholar] [CrossRef] [PubMed]
- Salam, M.T.; Millstein, J.; Li, Y.; Lurmann, F.W.; Margolis, H.G.; Gilliland, F.D. Birth outcomes and prenatal exposure to ozone, carbon monoxide, and particulate matter: Results from the children’s health study. Environ. Health Perspect. 2005, 113, 1638–1644. [Google Scholar] [CrossRef] [PubMed]
- Leiferman, J.A.; Evenson, K.R. The effect of regular leisure physical activity on birth outcomes. Matern. Child Health J. 2003, 7, 59–64. [Google Scholar] [CrossRef] [PubMed]
- Buka, S.L.; Brennan, R.T.; Rich-Edwards, J.W.; Raudenbush, S.W.; Felton, E. Neighborhood support and the birth weight of urban infants. Am. J. Epidemiol. 2003, 157, 1–8. [Google Scholar] [CrossRef] [PubMed]
- Beyer, K.M.M.; Kaltenbach, A.; Szabo, A.; Bogar, S.; Nieto, F.J.; Malecki, K.M. Exposure to neighborhood green space and mental health: Evidence from the survey of the health of Wisconsin. Int. J. Environ. Res. Public Health 2014, 11, 3453–3472. [Google Scholar] [CrossRef] [PubMed]
- Coutts, C.; Chapin, T.; Horner, M.; Taylor, C. County-level effects of green space access on physical activity. J. Phys. Act. Health 2013, 10, 232–240. [Google Scholar] [CrossRef] [PubMed]
- Holtan, M.T.; Dieterlen, S.L.; Sullivan, W.C. Social life under cover: Tree canopy and social capital in Baltimore, Maryland. Environ. Behav. 2014, 47, 502–525. [Google Scholar] [CrossRef]
- Nowak, D.J.; Crane, D.E.; Stevens, J.C. Air pollution removal by urban trees and shrubs in the United States. Urban For. Urban Green. 2006, 4, 115–123. [Google Scholar] [CrossRef]
- Wheeler, B.W.; White, M.; Stahl-Timmins, W.; Depledge, M.H. Does living by the coast improve health and wellbeing? Health Place 2012, 18, 1198–1201. [Google Scholar] [CrossRef] [PubMed]
- Nutsford, D.; Pearson, A.L.; Kingham, S.; Reitsma, F. Residential exposure to visible blue space (but not green space) associated with lower psychological distress in a capital city. Health Place 2016, 39, 70–78. [Google Scholar] [CrossRef] [PubMed]
- Garrett, N.; Smith, M.; Schluter, P.J.; Bollard-Breen, B. Coastal accessibility and availability for physical activity: A cross-sectional assessment in New Zealand adults. Open J. Prev. Med. 2016, 6, 273–286. [Google Scholar] [CrossRef]
- Lovasi, G.S.; Quinn, J.W.; Neckerman, K.M.; Perzanowski, M.S.; Rundle, A. Children living in areas with more street trees have lower prevalence of asthma. J. Epidemiol. Community Health 2008, 62, 647–649. [Google Scholar] [CrossRef] [PubMed]
- Donovan, G.H.; Prestemon, J.P. The effect of trees on crime in Portland, Oregon. Environ. Behav. 2012, 44, 3–30. [Google Scholar] [CrossRef]
- Table 2: Population, Land Area, and Population Density by County, New York State—2006. Available online: https://www.health.ny.gov/statistics/vital_statistics/2006/table02.htm (accessed on 29 May 2017).
- McLafferty, S.; Widener, M.; Chakrabarti, R.; Grady, S. Ethnic density and maternal and infant health inequalities: Bangladeshi immigrant women in New York City in the 1990s. Ann. Am. Assoc. Geogr. 2012, 102, 893–903. [Google Scholar] [CrossRef]
- 2010 Geographic Terms and Concepts—Census Tract. Available online: https://www.census.gov/geo/reference/gtc/gtc_ct.html (accessed on 29 May 2017).
- Measuring Vegetation (NDVI & EVI): Feature Articles. Available online: https://earthobservatory.nasa.gov/Features/MeasuringVegetation/measuring_vegetation_2.php (accessed on 29 May 2017).
- Trees Count! Street Tree Census: NYC Parks. Available online: https://www.nycgovparks.org/trees/tree-census/2005-2006 (accessed on 29 May 2017).
- PLUTO and MapPLUTO. Available online: https://www1.nyc.gov/site/planning/data-maps/open-data/dwn-pluto-mappluto.page (accessed on 29 May 2017).
- Ludlow, D.; Mitchell, C.; Webster, M. European Common Indicators: Towards a Local Sustainability Profile; Technical Report; Ambiente, Italia: Milano, Italy, 2003. [Google Scholar]
- Harnik, P.; Simms, J. Parks: How far is too far? Planning 2004, 70, 8–11. [Google Scholar]
- NYC Publicly Accessible Waterfront. Available online: https://www1.nyc.gov/site/planning/data-maps/open-data/dwn-waterfront.page (accessed on 29 May 2017).
- Ross, Z.; Jerrett, M.; Ito, K.; Tempalski, B.; Thurston, G.D. A land use regression for predicting fine particulate matter concentrations in the New York City region. Atmos. Environ. 2007, 41, 2255–2269. [Google Scholar] [CrossRef]
- Messer, L.C.; Laraia, B.A.; Kaufman, J.S.; Eyster, J.; Holzman, C.; Culhane, J.; Elo, I.; Burke, J.G.; O’campo, P. The development of a standardized neighborhood deprivation index. J. Urban Health 2006, 83, 1041–1062. [Google Scholar] [CrossRef] [PubMed]
- Peterson, B.S.; Vohr, B.; Staib, L.H.; Cannistraci, C.J.; Dolberg, A.; Schneider, K.C.; Katz, K.H.; Westerveld, M.; Sparrow, S.; Anderson, A.W.; et al. Regional brain volume abnormalities and long-term cognitive outcome in pre-term infants. JAMA 2000, 284, 1939–1947. [Google Scholar] [CrossRef] [PubMed]
- Landry, S.M.; Chakraborty, J. Street trees and equity: Evaluating the spatial distribution of an urban amenity. Environ. Plan. 2009, 41, 2651–2670. [Google Scholar] [CrossRef]
- Francis, J.; Wood, L.J.; Knuiman, M.; Giles-Corti, B. Quality or quantity? Exploring the relationship between public open space attributes and mental health in Perth, Western Australia. Soc. Sci. Med. 2012, 74, 1570–1577. [Google Scholar] [CrossRef] [PubMed]
- Zhang, Y.; Van den Berg, A.E.; Van Dijk, T.; Weitkamp, G. Quality over quantity: Contribution of urban green space to neighborhood satisfaction. Int. J. Environ. Res. Public Health 2017, 14, 535. [Google Scholar] [CrossRef] [PubMed]
- Miyake, K.K.; Maroko, A.R.; Grady, K.L.; Maantay, J.A.; Arno, P.S. Not just a walk in the park: Methodological improvements for determining environmental justice implications of park access in New York City for the promotion of physical activity. Cities Environ. 2010, 3, 1–17. [Google Scholar] [CrossRef] [PubMed]
- Weiss, C.C.; Purciel, C.; Bader, M.; Quinn, J.W.; Lovasi, G.; Neckerman, K.M.; Rundle, A.G. Reconsidering access: Park facilities and neighborhood disamenities in New York City. J. Urban Health 2011, 88, 297–310. [Google Scholar] [CrossRef] [PubMed]


| Birth Outcome | Study Population (n = 103,484) | Deprived Tracts (n = 51,787) | Non-Deprived Tracts (n = 51,697) |
|---|---|---|---|
| Gestational age in weeks (mean, std. dev.) | 38.78, 2.46 | 38.71, 2.62 | 38.84, 2.28 |
| Term birthweight in grams (mean, std. dev.) | 3379.51, 477.01 | 3363.46, 482.72 | 3395.11, 470.88 |
| Term low birthweight (%) | |||
| Yes | 2.91 | 3.21 | 2.62 |
| No | 97.09 | 96.79 | 97.38 |
| Preterm birth (%) | |||
| Yes | 11.13 | 12.49 | 9.78 |
| No | 88.87 | 87.51 | 90.22 |
| Small for gestational age (%) | |||
| Yes | 10.15 | 10.91 | 9.38 |
| No | 89.85 | 89.09 | 90.62 |
| Sex (%) | |||
| Male | 51.35 | 51.34 | 51.36 |
| Female | 48.65 | 48.66 | 48.64 |
| Season of birth (%) | |||
| Spring | 24.24 | 23.57 | 24.92 |
| Summer | 26.42 | 26.62 | 26.22 |
| Fall | 25.55 | 25.69 | 25.42 |
| Winter | 23.78 | 24.12 | 23.44 |
| Covariate | Study Population (n = 103,484) | Deprived Tracts (n = 51,787) | Non-Deprived Tracts (n = 51,697) |
|---|---|---|---|
| Age (mean, std. dev.) | 28.04, 6.34 | 26.58, 6.30 | 29.49, 6.05 |
| Finished high school (%) | |||
| Yes | 74.46 | 63.42 | 85.51 |
| No | 25.54 | 36.58 | 14.49 |
| Married (%) | |||
| Yes | 52.85 | 35.84 | 69.88 |
| No | 47.15 | 64.16 | 30.12 |
| Medicaid recipient (%) | |||
| Yes | 55.06 | 72.8 | 37.28 |
| No | 44.94 | 27.2 | 62.72 |
| Tobacco use while pregnant (%) | |||
| Yes | 3.44 | 4.23 | 2.65 |
| No | 96.56 | 95.77 | 97.35 |
| Alcohol use while pregnant (%) | |||
| Yes | 0.22 | 0.29 | 0.14 |
| No | 99.78 | 99.71 | 99.86 |
| Race (%) | |||
| White | 54.29 | 47.05 | 61.54 |
| Black | 32.98 | 44.46 | 21.48 |
| East Asian | 6.37 | 5.1 | 7.64 |
| South Asian | 4.33 | 2.15 | 6.51 |
| Other Asian/Pacific Islander | 1.54 | 0.87 | 2.21 |
| Other/Unknown | 0.49 | 0.36 | 0.62 |
| Birth region (%) | |||
| U.S. and Canada | 45.06 | 43.14 | 46.98 |
| Caribbean | 18.7 | 26 | 11.38 |
| Mexico and Central America | 8.19 | 11.05 | 5.32 |
| South America | 6.77 | 6.16 | 7.37 |
| Western Europe | 1.77 | 0.5 | 3.05 |
| Eastern Europe | 3 | 0.93 | 5.08 |
| Sub-Saharan Africa | 2.55 | 3.6 | 1.49 |
| Middle East and North Africa | 2.38 | 0.88 | 3.88 |
| Central Asia | 0.52 | 0.14 | 0.9 |
| South Asia | 3.82 | 1.93 | 5.72 |
| East Asia | 5.77 | 4.78 | 6.75 |
| Southeast Asia | 1.34 | 0.83 | 1.86 |
| Other/Unknown | 0.14 | 0.06 | 0.22 |
| Neighborhood-Level Variable | Study Population (n = 103,484) | Deprived Tracts (n = 51,787) | Non-Deprived Tracts (n = 51,697) |
|---|---|---|---|
| Average NDVI (mean, std. dev.) | |||
| 100 m buffer | 0.28, 0.11 | 0.25, 0.10 | 0.31, 0.12 |
| 250 m buffer | 0.28, 0.10 | 0.26, 0.07 | 0.31, 0.11 |
| 500 m buffer | 0.29, 0.09 | 0.27, 0.06 | 0.32, 0.10 |
| Street tree count (mean, std. dev.) | |||
| 100 m buffer | 32.77, 22.58 | 26.87, 18.84 | 38.68, 24.40 |
| 250 m buffer | 201.92, 104.55 | 163.97, 79.97 | 239.94, 112.18 |
| 500 m buffer | 740.24, 329.08 | 608.98, 254.82 | 871.73, 342.32 |
| Distance to industrial land use in meters (mean, std. dev.) | 343.66, 311.74 | 253.27, 182.19 | 434.21, 380.66 |
| Distance to nearest major road in meters (mean, std. dev.) | 985.13, 820.39 | 900.36, 728.84 | 1070.05, 894.84 |
| Neighborhood deprivation index (mean, std. dev.) | 0.69, 2.44 | 2.74, 1.36 | −1.35, 1.33 |
| Population density per sq. kilometer (mean, std. dev.) | 26,011.19, 16,600.86 | 31,761.42, 15,727.65 | 20,250.95, 15,413.25 |
| 800 m from major green space (%) | |||
| Yes | 84.97 | 88.42 | 81.52 |
| No | 15.03 | 11.58 | 18.48 |
| 800 m from publicly accessible waterfront (%) | |||
| Yes | 25.44 | 27.76 | 23.11 |
| No | 74.56 | 72.24 | 76.89 |
| Term Births in Study Population (n = 91,963) | Term Births in Deprived Tracts (n = 45,321) | ||||
|---|---|---|---|---|---|
| Model | Coef. | 95% CI | Model | Coef. | 95% CI |
| Mean NDVI (100 m buffer) | |||||
| Adjusted | 5.9547 | −27.4096–39.3189 | Adjusted | −22.0388 | −72.9623–28.8846 |
| Unadjusted | 6.5678 | −25.3591–38.4946 | Unadjusted | −97.2777 * | −151.1224–−43.4330 |
| Mean NDVI (250 m buffer) | |||||
| Adjusted | 9.0173 | −32.3941–50.4288 | Adjusted | −65.6636 | −133.2686–1.9413 |
| Unadjusted | 3.9892 | −33.0152–40.9937 | Unadjusted | −159.8797 * | −228.5841–−91.1753 |
| Mean NDVI (500 m buffer) | |||||
| Adjusted | 31.3106 | −14.1890–76.8102 | Adjusted | −47.0084 | −126.0089–31.9921 |
| Unadjusted | 17.6882 | −22.5183–57.8947 | Unadjusted | −141.7667 * | −222.1642–−61.3692 |
| Street tree count (100 m buffer) | |||||
| Adjusted | −0.0112 | −0.1608–0.1385 | Adjusted | 0.0086 | −0.2288–0.2460 |
| Unadjusted | 0.5221 * | 0.3616–0.6826 | Unadjusted | 0.3419 * | 0.0671–0.6167 |
| Street tree count (250 m buffer) | |||||
| Adjusted | 0.0109 | −0.0255–0.0473 | Adjusted | 0.0031 | −0.0566–0.0628 |
| Unadjusted | 0.1597 * | 0.1253–0.1941 | Unadjusted | 0.1178 * | 0.0540–0.1816 |
| Street tree count (500 m buffer) | |||||
| Adjusted | 0.0078 | −0.0043–0.0198 | Adjusted | 0.0087 | −0.0115–0.0289 |
| Unadjusted | 0.0523 * | 0.0413–0.0632 | Unadjusted | 0.0453 * | 0.0254–0.0653 |
| Term Births in Study Population (n = 91,963) | Term Births in Deprived Tracts (n = 45,321) | ||||
|---|---|---|---|---|---|
| Model | OR | 95% CI | Model | OR | 95% CI |
| Mean NDVI (100 m buffer) | |||||
| Adjusted | 0.8971 | 0.5866–1.3719 | Adjusted | 1.0009 | 0.9978–1.0039 |
| Unadjusted | 1.1054 | 0.7761–1.5744 | Unadjusted | 2.2958 * | 1.2878–4.093 |
| Mean NDVI (250 m buffer) | |||||
| Adjusted | 1.0751 | 0.6331–1.8258 | Adjusted | 1.5767 | 0.6823–3.6437 |
| Unadjusted | 1.2547 | 0.8306–1.8956 | Unadjusted | 3.4033 * | 1.6151–7.1712 |
| Mean NDVI (500 m buffer) | |||||
| Adjusted | 1.0847 | 0.6030–1.9512 | Adjusted | 1.4897 | 0.5607–3.9583 |
| Unadjusted | 1.2335 | 0.7842–1.9401 | Unadjusted | 3.2889 * | 1.3832–7.8205 |
| Street tree count (100 m buffer) | |||||
| Adjusted | 1.0002 | 0.9982–1.0021 | Adjusted | 1.0009 | 0.9978–1.0039 |
| Unadjusted | 0.9965 * | 0.9946–0.9983 | Unadjusted | 0.9988 | 0.9957–1.0018 |
| Street tree count (250 m buffer) | |||||
| Adjusted | 1.0000 | 0.9995–1.0005 | Adjusted | 1.0002 | 0.9995–1.0010 |
| Unadjusted | 0.9989 * | 0.9985–0.9993 | Unadjusted | 0.9995 | 0.9988–1.0002 |
| Street tree count (500 m buffer) | |||||
| Adjusted | 0.9999 | 0.9998–1.0001 | Adjusted | 0.9999 | 0.9997–1.0002 |
| Unadjusted | 0.9996 * | 0.9995–0.9998 | Unadjusted | 0.9997 * | 0.9995–0.9999 |
| Study Population (n = 103,484) | Deprived Tracts (n = 51,787) | ||||
|---|---|---|---|---|---|
| Model | OR | 95% CI | Model | OR | 95% CI |
| Mean NDVI (100 m Buffer) | |||||
| Adjusted | 0.8192 | 0.6571–1.0213 | Adjusted | 0.74646 | 0.5327–1.0460 |
| Unadjusted | 0.9256 | 0.7494–1.1432 | Unadjusted | 1.3161 | 0.9281–1.8663 |
| Mean NDVI (250 m buffer) | |||||
| Adjusted | 0.8406 | 0.6378–1.1078 | Adjusted | 0.7187 | 0.4580–1.1277 |
| Unadjusted | 0.934 | 0.7311–1.1932 | Unadjusted | 1.5019 | 0.9565–2.3584 |
| Mean NDVI (500 m buffer) | |||||
| Adjusted | 0.9109 | 0.6705–1.2373 | Adjusted | 0.83 | 0.4887–1.4097 |
| Unadjusted | 0.9219 | 0.7060–1.2039 | Unadjusted | 1.6211 | 0.9569–2.7465 |
| Street tree count (100 m buffer) | |||||
| Adjusted | 0.9989 * | 0.9978–0.9999 | Adjusted | 0.9984 | 0.9968–1.0001 |
| Unadjusted | 0.9954 * | 0.9944–0.9965 | Unadjusted | 0.9970 * | 0.9951–0.9988 |
| Street tree count (250 m buffer) | |||||
| Adjusted | 0.9998 * | 0.9995–1 | Adjusted | 0.9996 * | 0.9992–0.9999 |
| Unadjusted | 0.9987 * | 0.9985–0.9990 | Unadjusted | 0.9992 * | 0.9987–0.9996 |
| Street tree count (500 m buffer) | |||||
| Adjusted | 0.9999 * | 0.9998–0.9999 | Adjusted | 0.9998 * | 0.9997–0.9999 |
| Unadjusted | 0.9996 * | 0.9995–0.9996 | Unadjusted | 0.9997 * | 0.9996–0.9999 |
| Study Population (n = 103,484) | Deprived Tracts (n = 51,787) | ||||
|---|---|---|---|---|---|
| Model | OR | 95% CI | Model | OR | 95% CI |
| Mean NDVI (100 m buffer) | |||||
| Adjusted | 1.0034 | 0.8043–1.2519 | Adjusted | 1.2182 | 0.8794–1.6877 |
| Unadjusted | 1.0294 | 0.8474–1.2504 | Unadjusted | 1.7742 * | 1.3031–2.4156 |
| Mean NDVI (250 m buffer) | |||||
| Adjusted | 1.1668 | 0.8854–1.5377 | Adjusted | 1.7084 * | 1.1062–2.6384 |
| Unadjusted | 1.119 | 0.8923–1.4031 | Unadjusted | 2.5941 * | 1.7452–3.8559 |
| Mean NDVI (500 m buffer) | |||||
| Adjusted | 1.2881 | 0.9482–1.7498 | Adjusted | 2.0172 * | 1.2149–3.3493 |
| Unadjusted | 1.1186 | 0.8734–1.4326 | Unadjusted | 2.9151 * | 1.8449–4.6059 |
| Street tree count (100 m buffer) | |||||
| Adjusted | 1.0004 | 0.9994–1.0014 | Adjusted | 1.0004 | 0.9988–1.0019 |
| Unadjusted | 0.9977 * | 0.9967–0.9987 | Unadjusted | 0.9993 | 0.9977–1.0009 |
| Street tree count (250 m buffer) | |||||
| Adjusted | 1.0001 | 0.9998–1.0003 | Adjusted | 1.0001 | 0.9997–1.0005 |
| Unadjusted | 0.9993 * | 0.9990–0.9995 | Unadjusted | 0.9997 | 0.9994–1.0001 |
| Street tree count (500 m buffer) | |||||
| Adjusted | 1 | 0.9999–1.0001 | Adjusted | 1 | 0.9998–1.0001 |
| Unadjusted | 0.9997 * | 0.9997–0.9998 | Unadjusted | 0.9998 * | 0.9997–0.9999 |
© 2017 by the authors. Licensee MDPI, Basel, Switzerland. This article is an open access article distributed under the terms and conditions of the Creative Commons Attribution (CC BY) license (http://creativecommons.org/licenses/by/4.0/).
Share and Cite
Abelt, K.; McLafferty, S. Green Streets: Urban Green and Birth Outcomes. Int. J. Environ. Res. Public Health 2017, 14, 771. https://doi.org/10.3390/ijerph14070771
Abelt K, McLafferty S. Green Streets: Urban Green and Birth Outcomes. International Journal of Environmental Research and Public Health. 2017; 14(7):771. https://doi.org/10.3390/ijerph14070771
Chicago/Turabian StyleAbelt, Kathryn, and Sara McLafferty. 2017. "Green Streets: Urban Green and Birth Outcomes" International Journal of Environmental Research and Public Health 14, no. 7: 771. https://doi.org/10.3390/ijerph14070771
APA StyleAbelt, K., & McLafferty, S. (2017). Green Streets: Urban Green and Birth Outcomes. International Journal of Environmental Research and Public Health, 14(7), 771. https://doi.org/10.3390/ijerph14070771