Assessment of Urban Ecosystem Health Based on Matter Element Analysis: A Case Study of 13 Cities in Jiangsu Province, China


Abstract
:1. Introduction
2. Materials and Methods
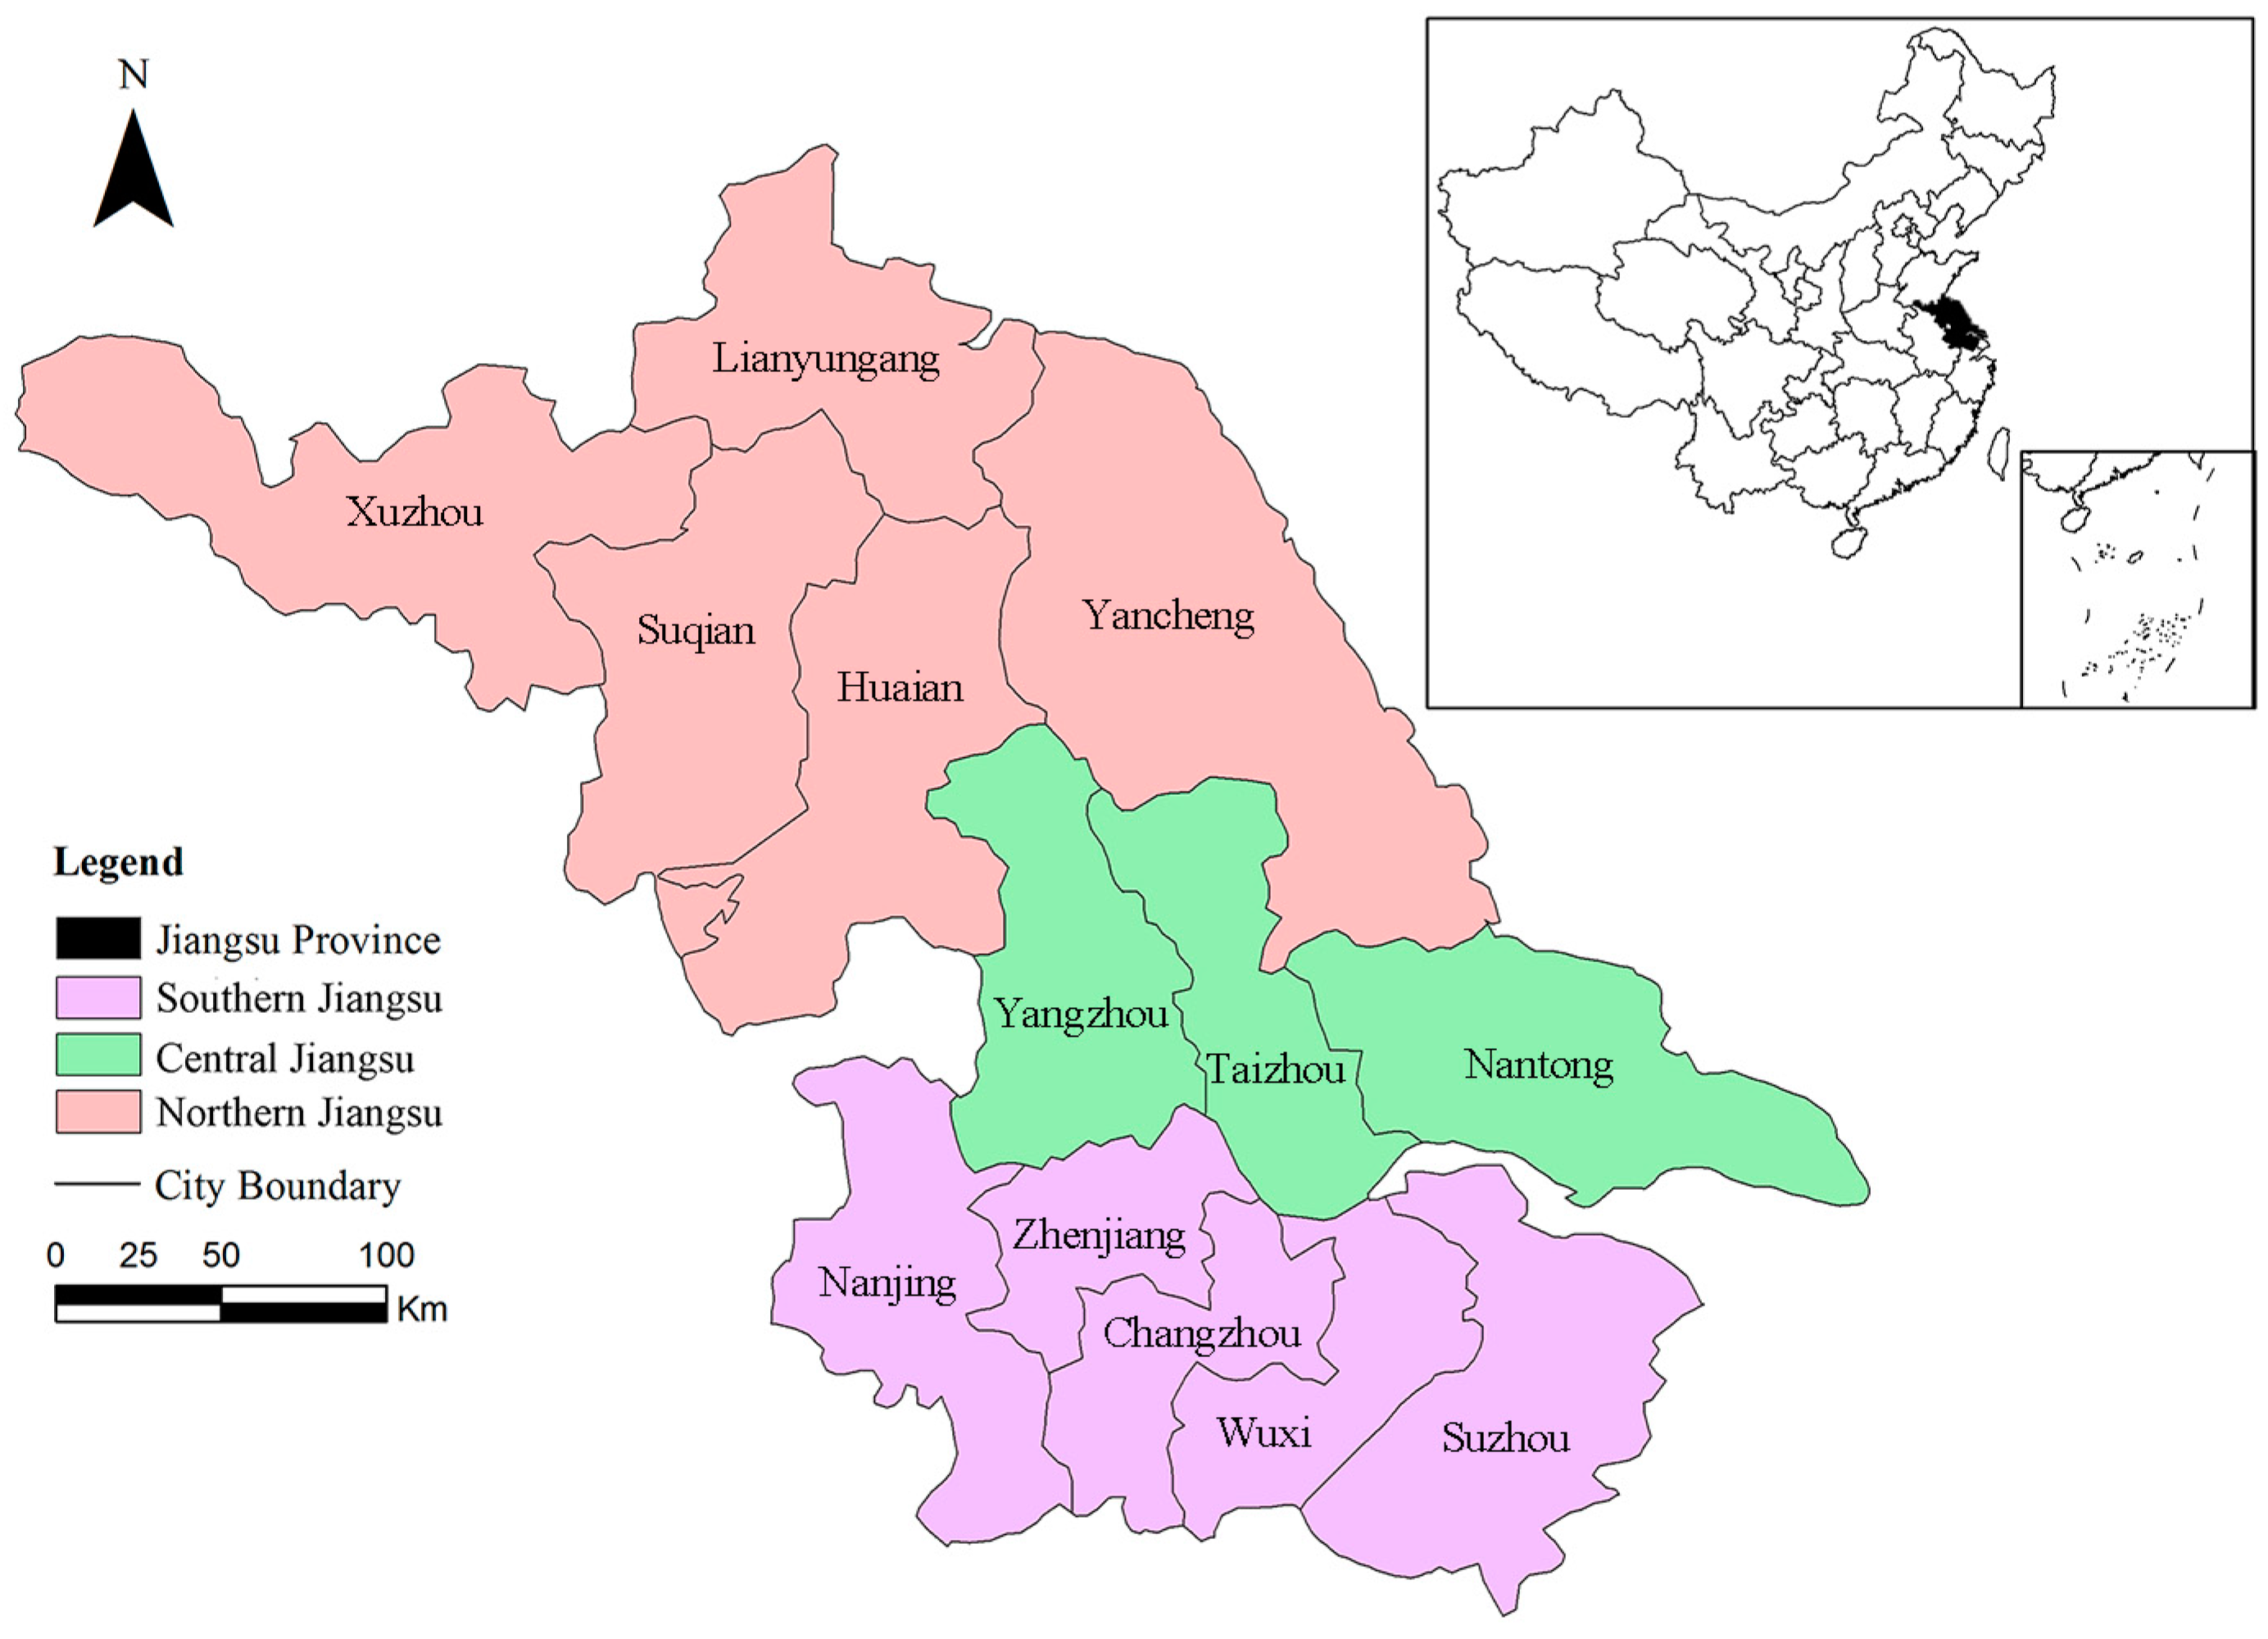
2.1. Study Site
2.2. Design of Indicator System
2.3. Matter Element Analysis
2.4. Diagnosis of UEH Limiting Factors
2.5. Data Sources and Processing
3. Results and Analysis
3.1. Results and Analysis of Urban Ecosystem Health
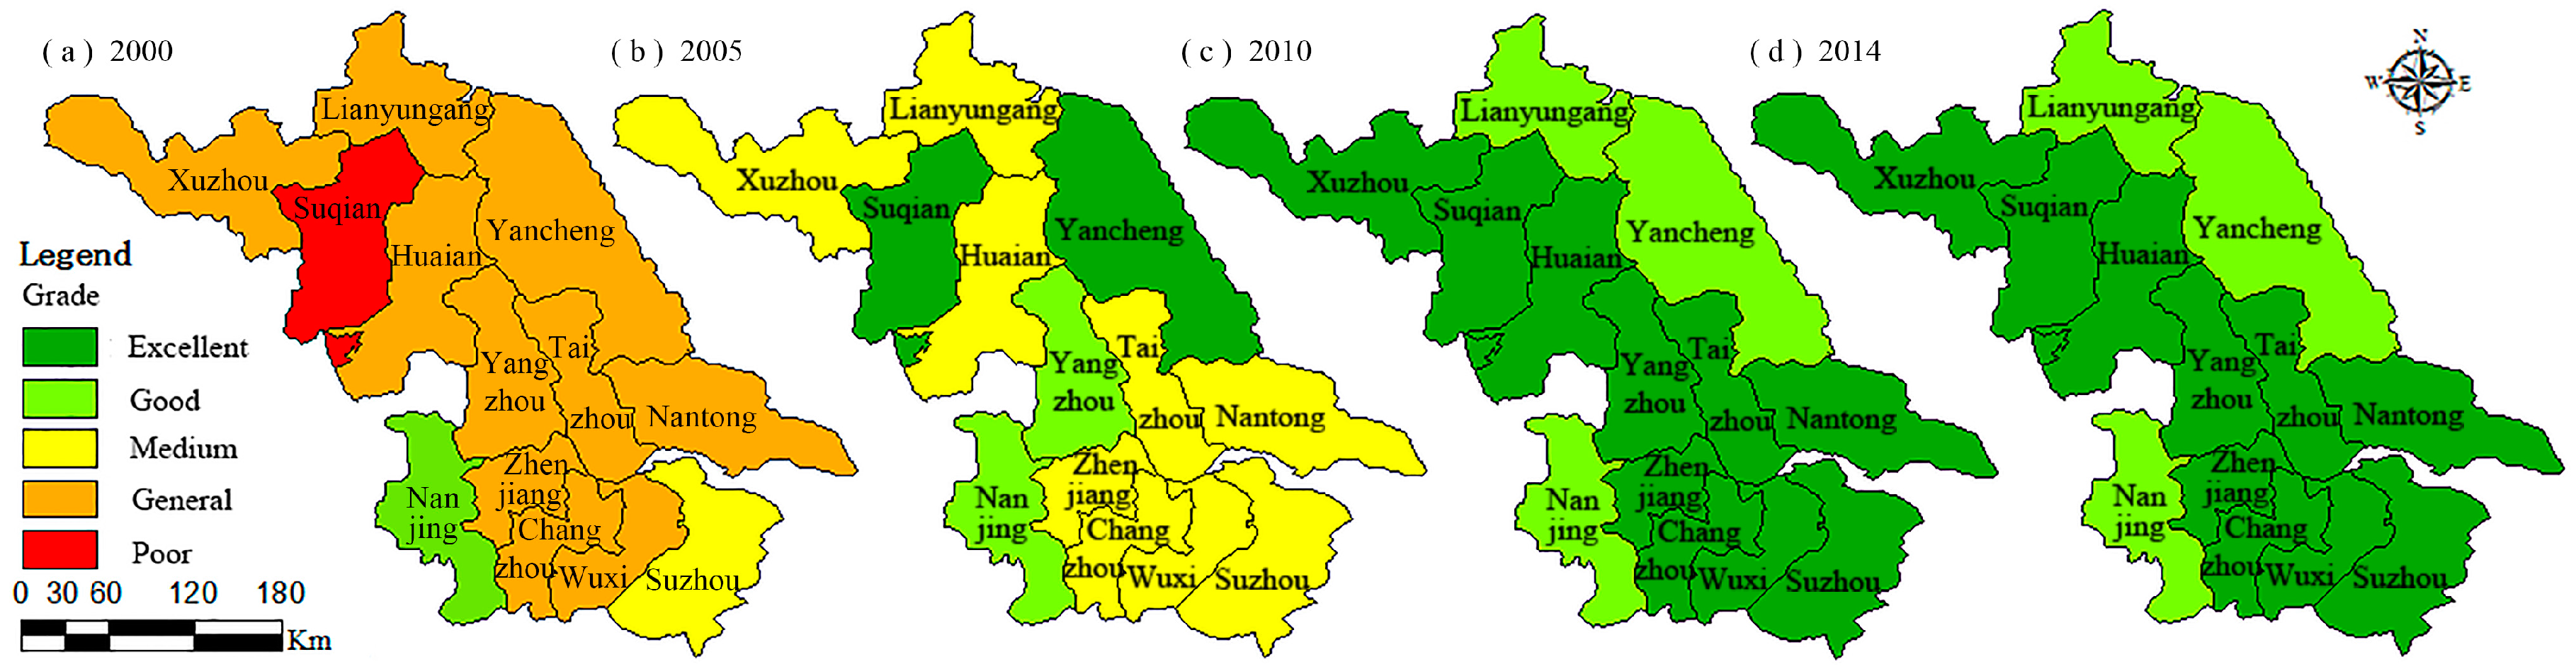
3.2. Temporal and Spatial Distribution of Urban Ecosystem Health
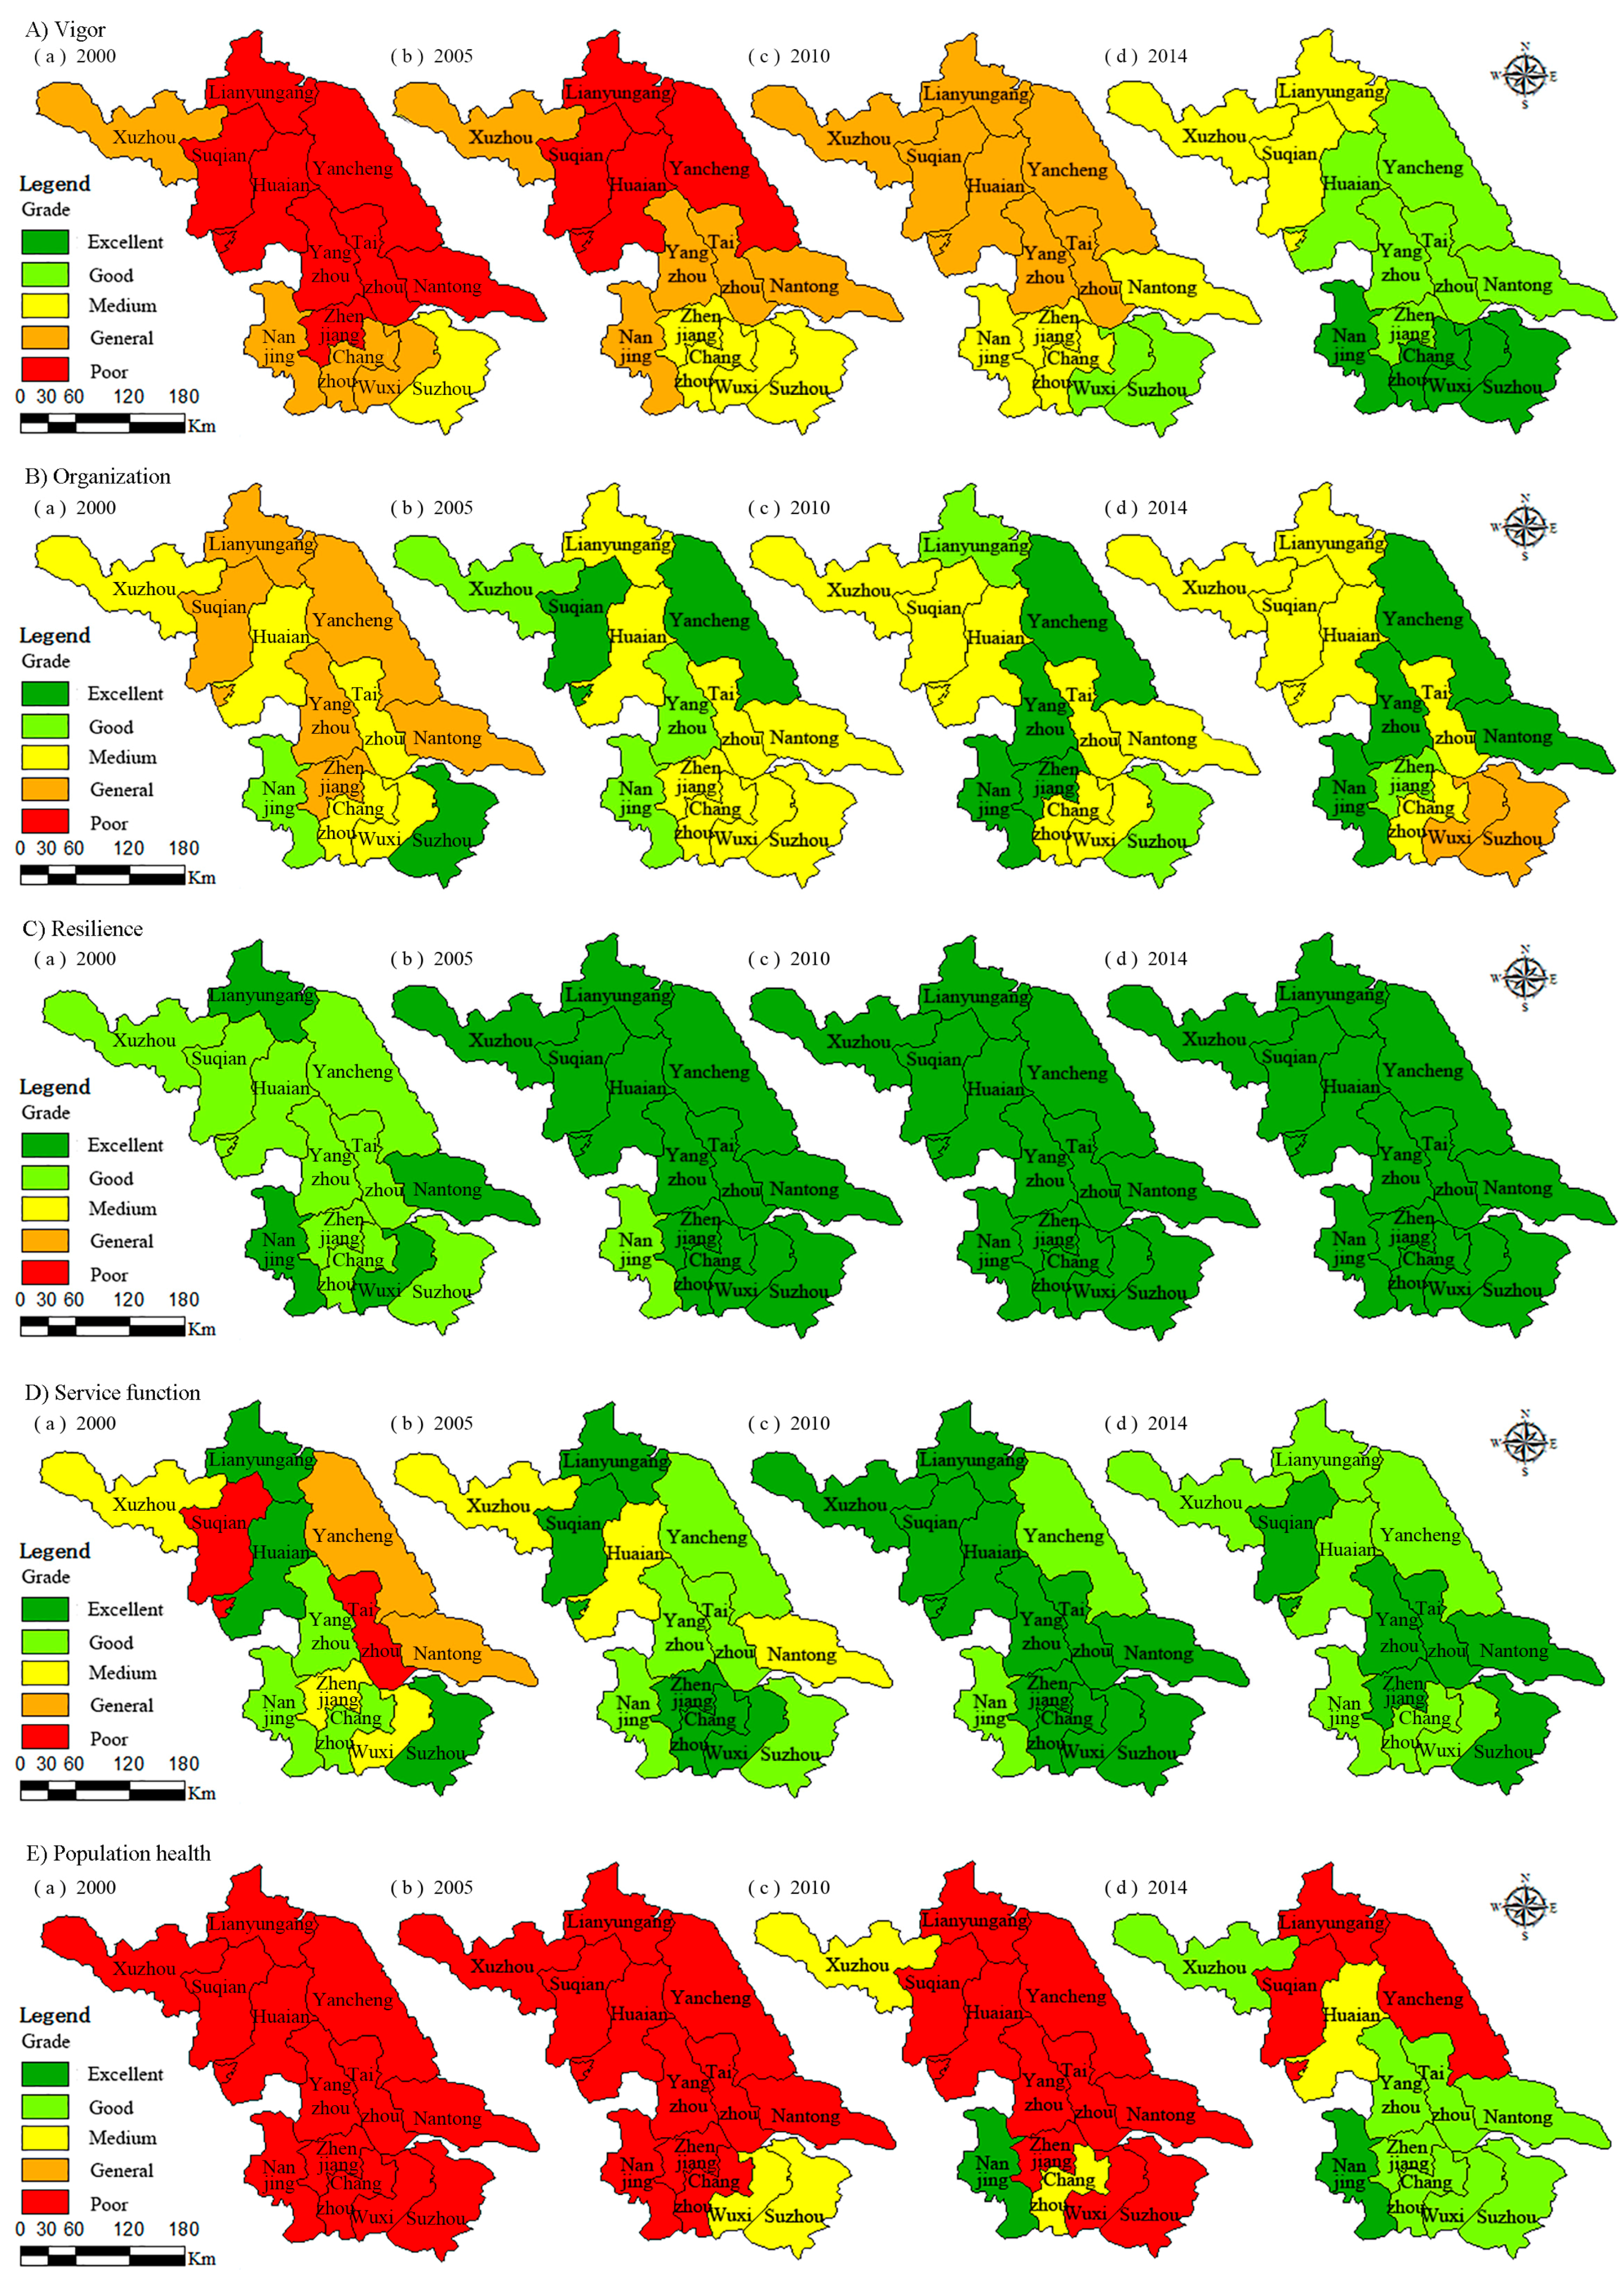
3.3. The Contribution Value to Overall Health Index from Each Component
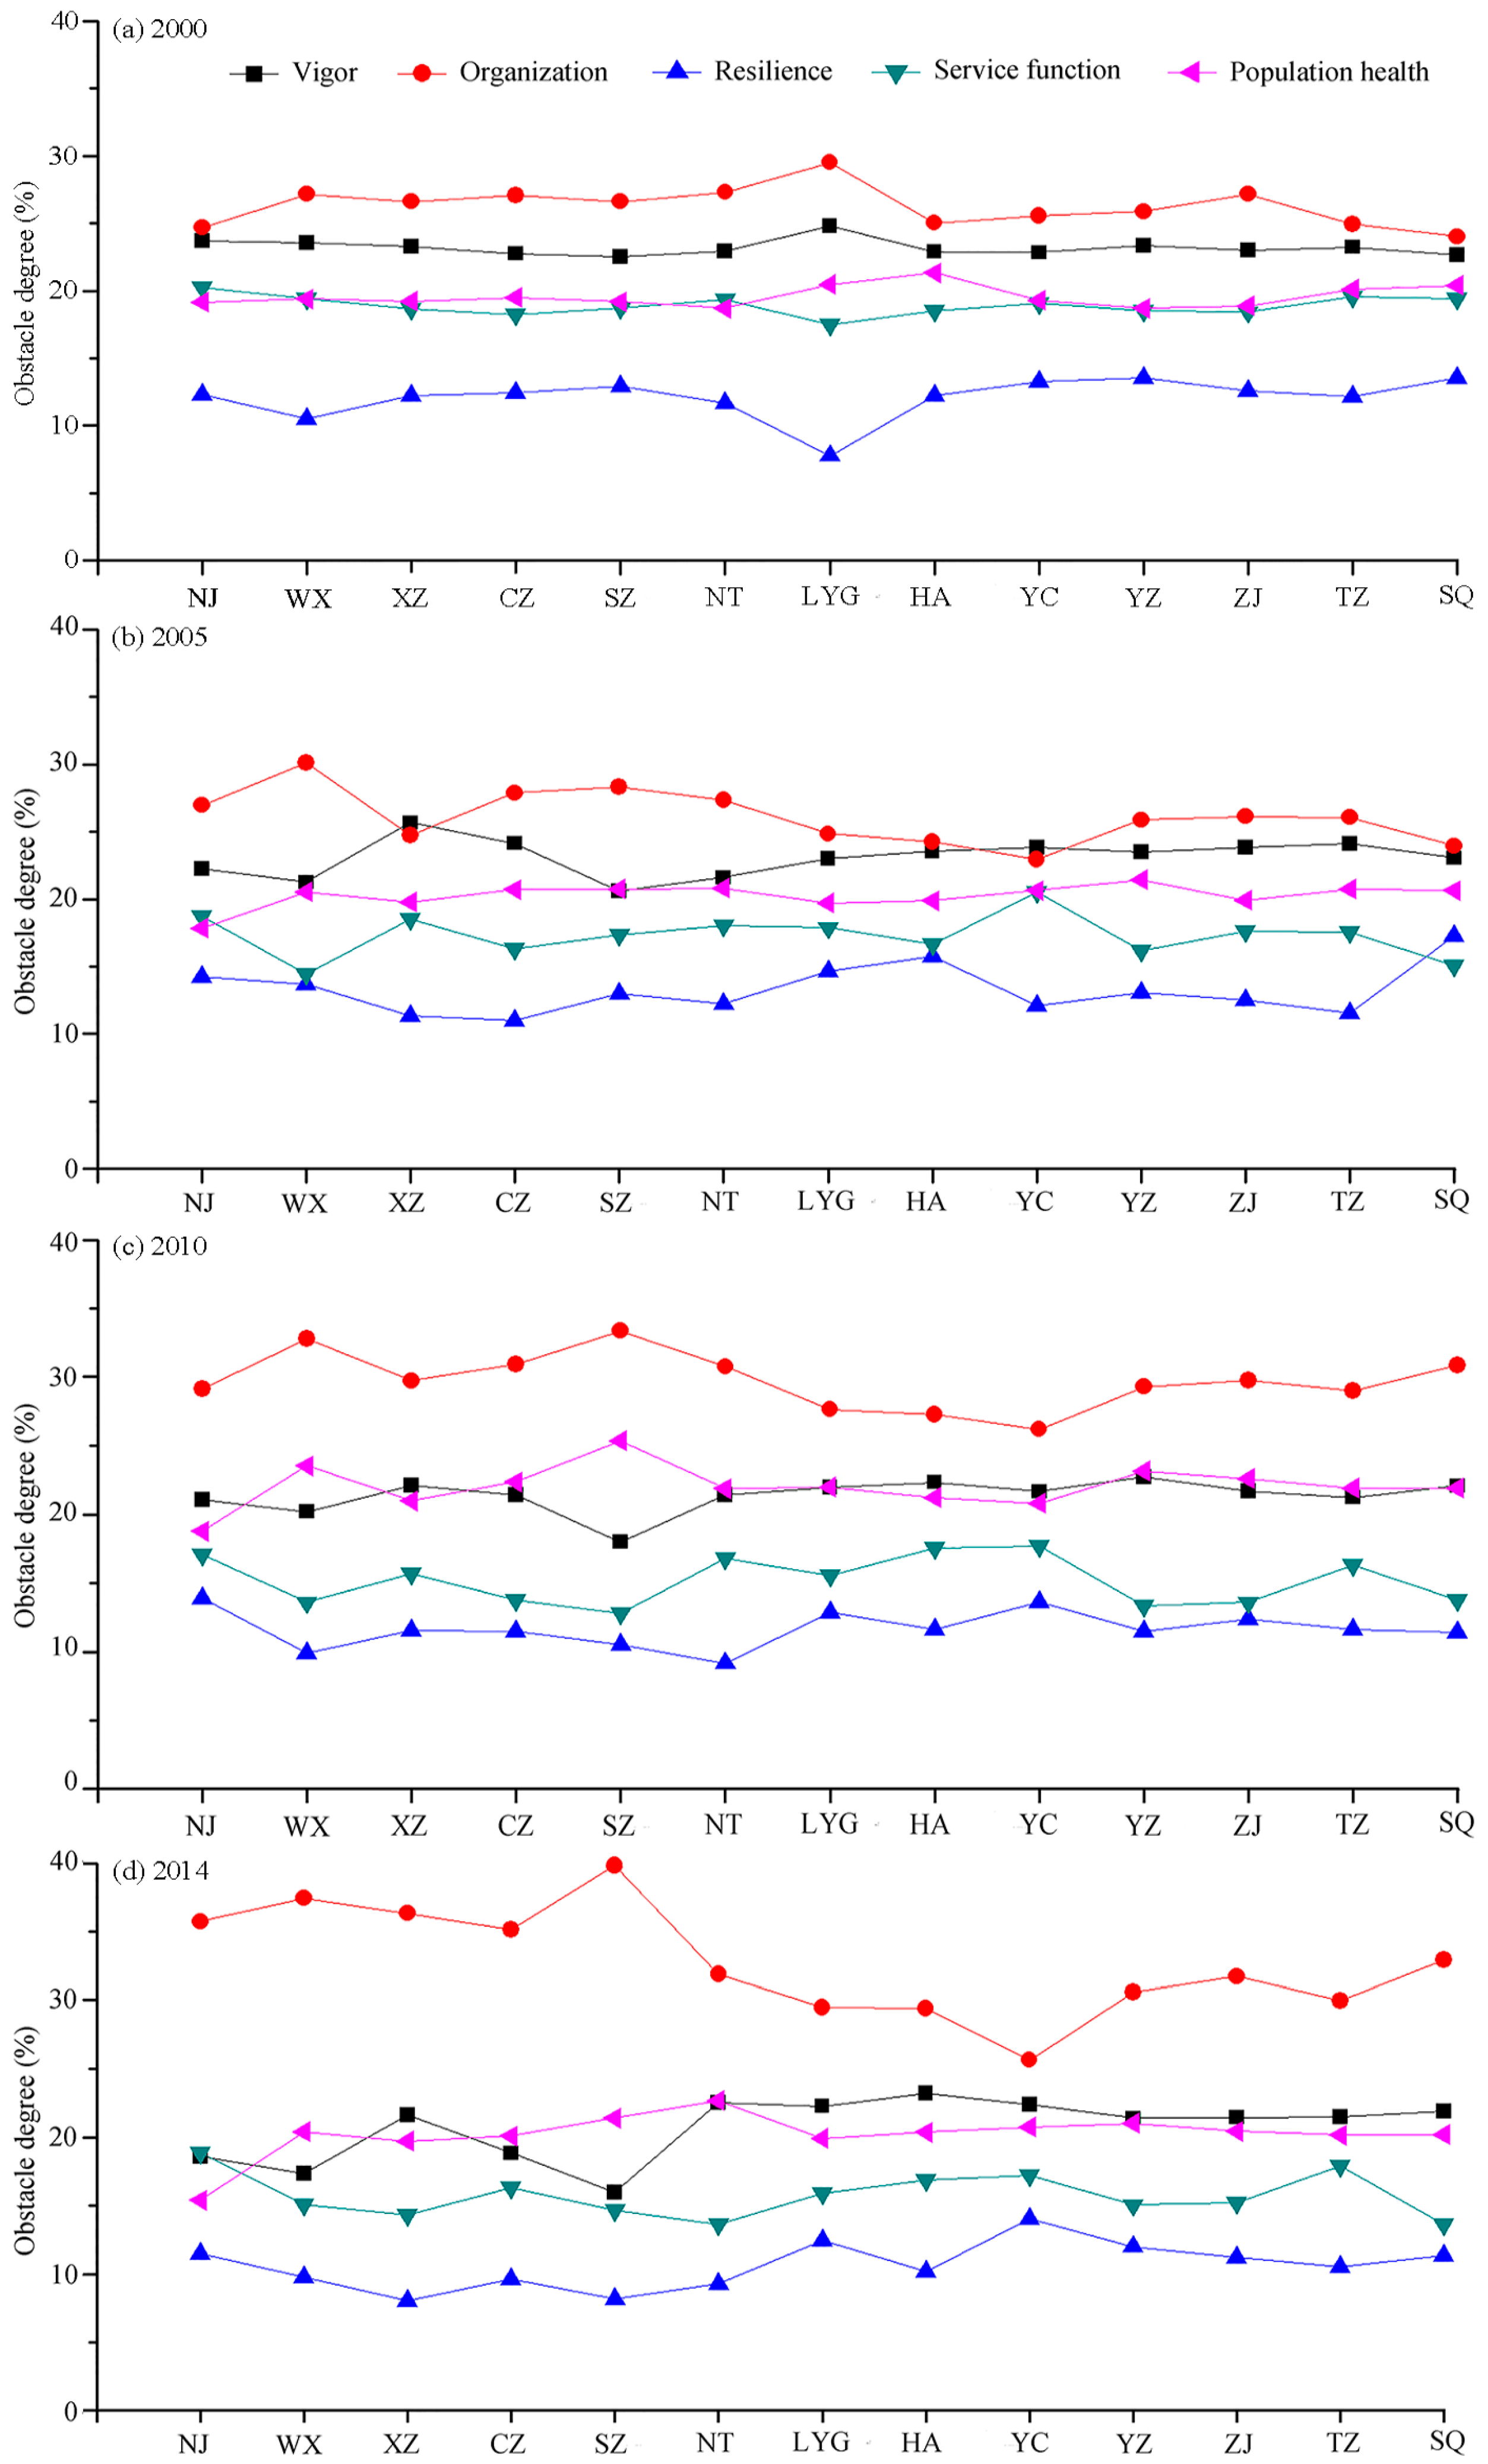
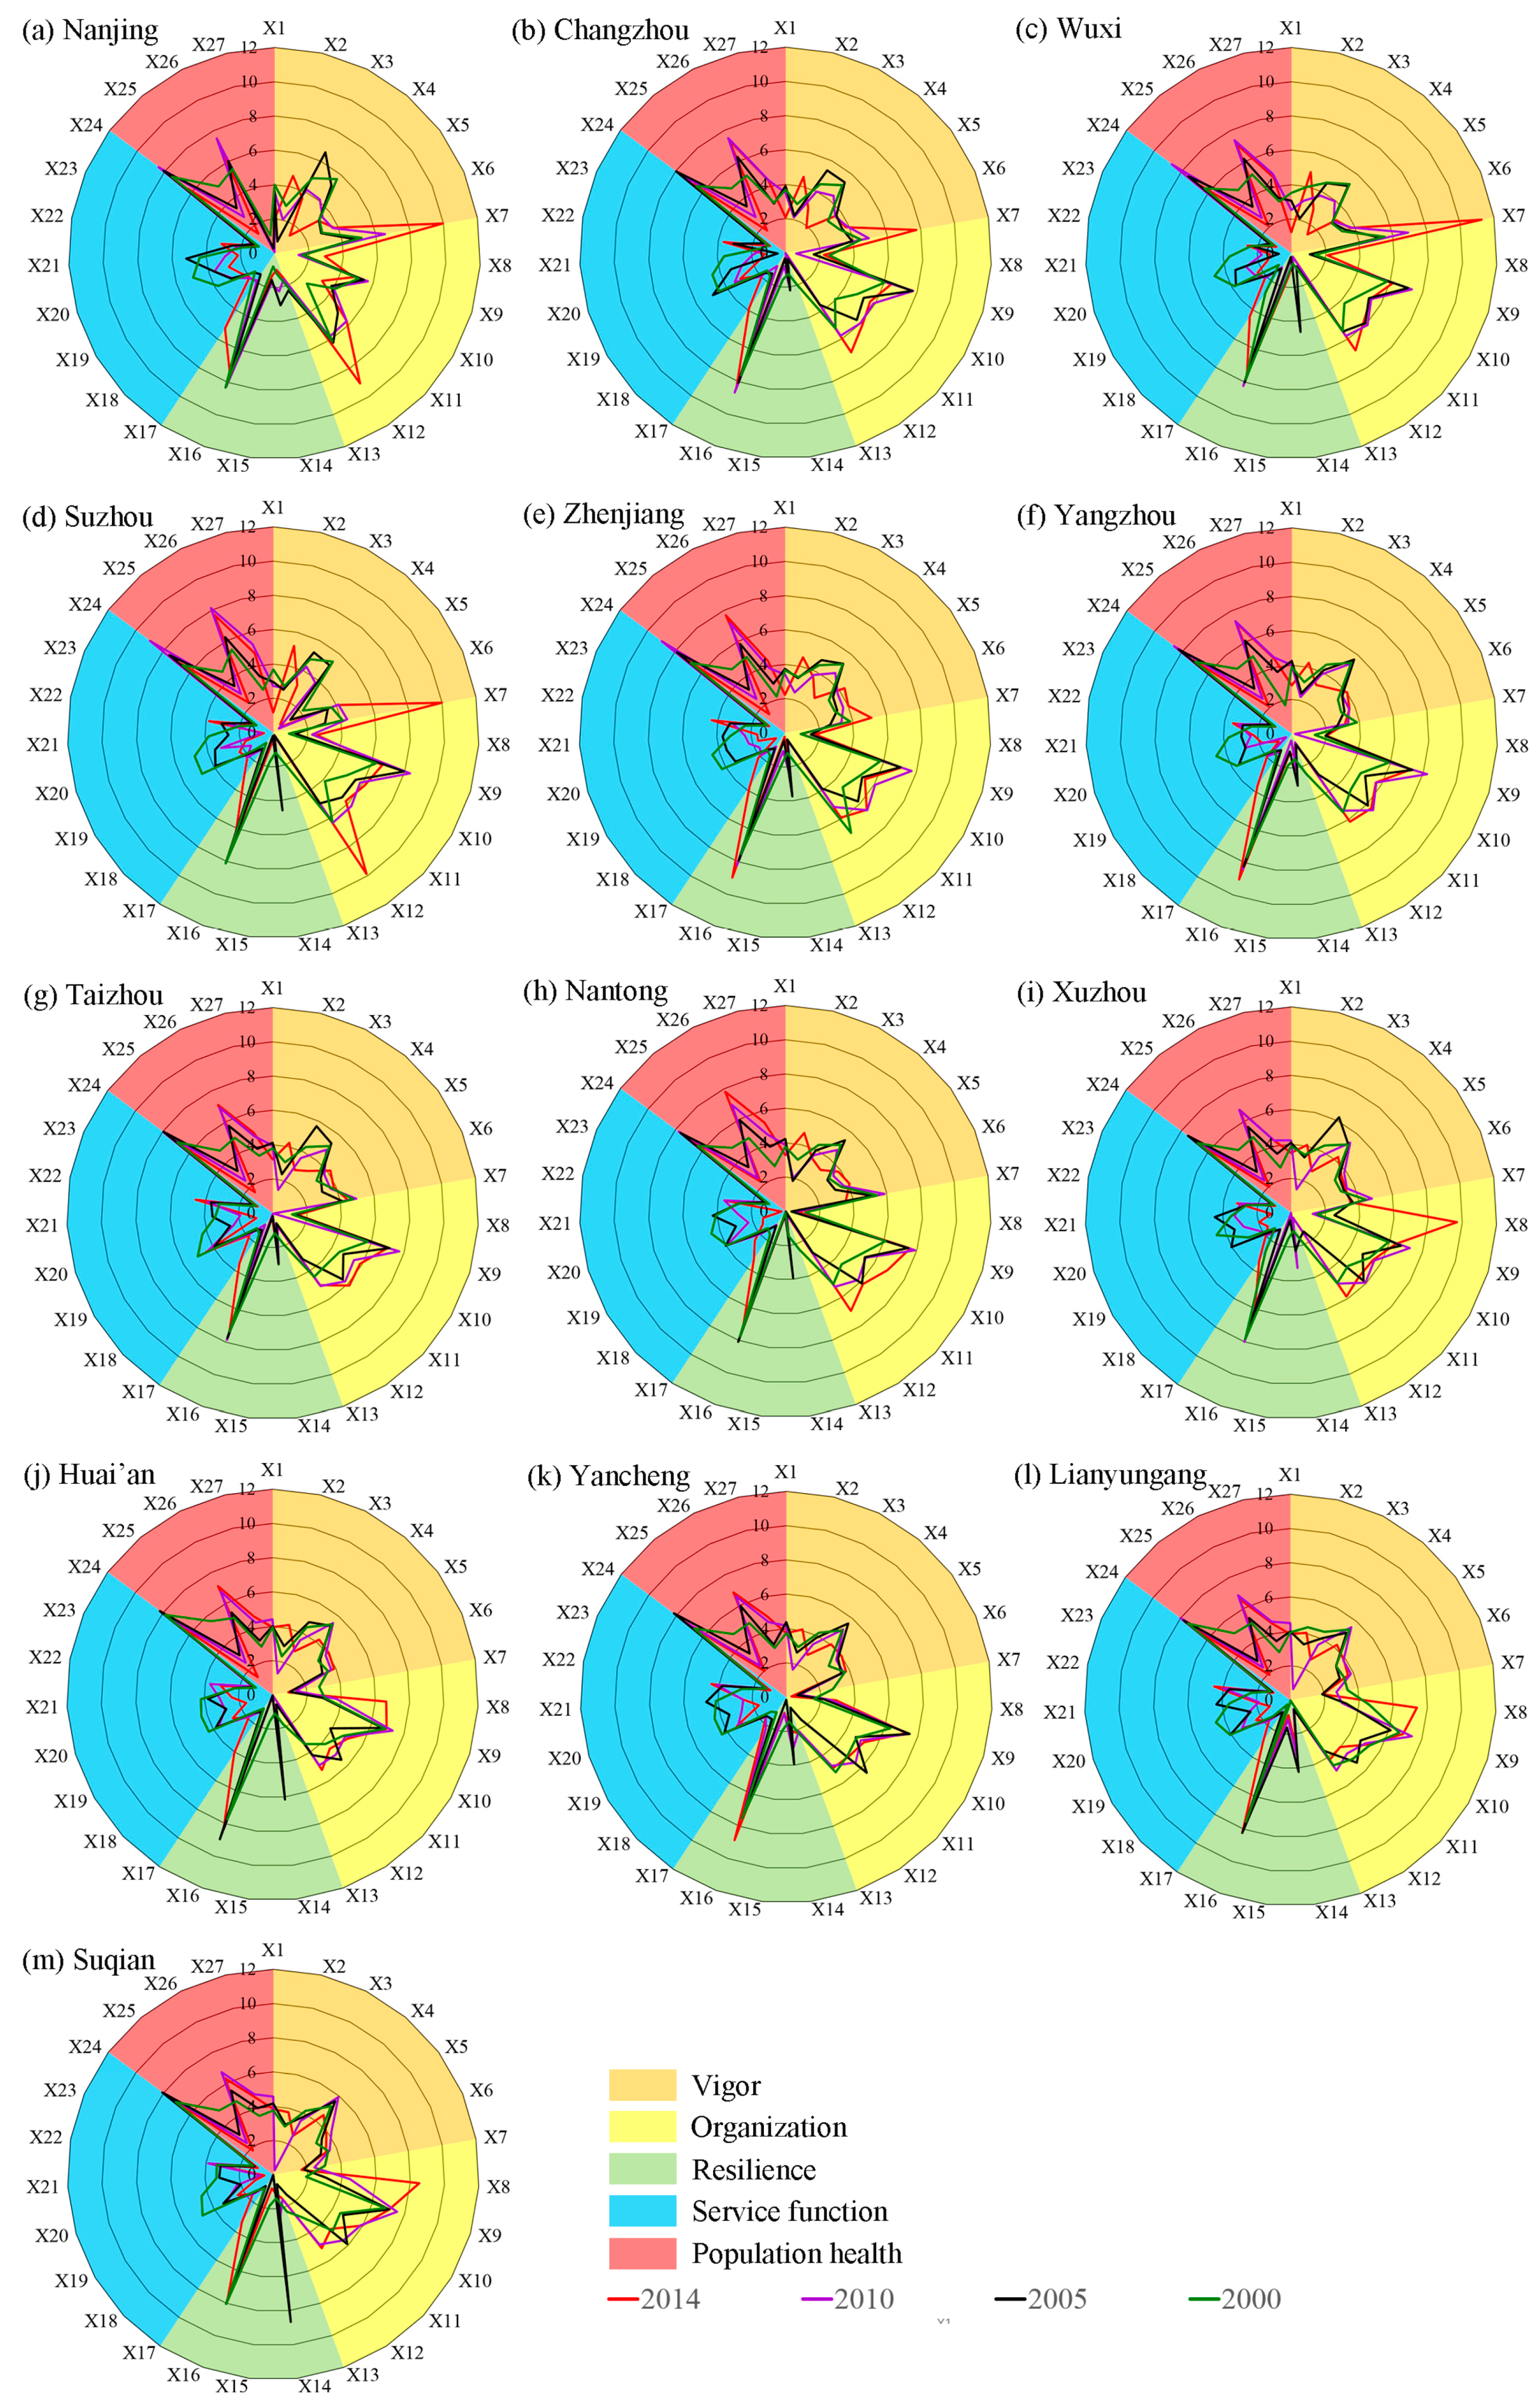
3.4. Limiting Factors Analysis of Urban Ecosystem Health
4. Discussion
5. Conclusions
Acknowledgments
Author Contributions
Conflicts of Interest
References
- Harpham, T. Urban health in the Gambia: A review. Health Place 1996, 2, 45–49. [Google Scholar] [CrossRef]
- Piña, W.H.A.; Martínez, C.I.P. Urban material flow analysis: An approach for Bogotá, Colombia. Ecol. Indic. 2014, 42, 32–42. [Google Scholar] [CrossRef]
- Su, M.R.; Brian, D.F.; Yang, Z.F. Urban ecosystem health assessment: A review. Sci. Total Environ. 2010, 408, 2425–2434. [Google Scholar] [CrossRef] [PubMed]
- Costanza, R. Toward an operational definition of health. In Ecosystem Health: New Goals for Environmental Management; Costanza, R., Norton, B.G., Haskell, B.D., Eds.; Island Press: Washington, DC, USA, 1992; pp. 239–256. [Google Scholar]
- Rapport, D.J.; Costanza, R.; McMichael, A.J. Assessing ecosystem health. Trends Ecol. Evol. 1998, 13, 397–402. [Google Scholar] [CrossRef]
- Zhang, Y.; Yang, Z.F.; Li, W. Analyses of urban ecosystem based on information entropy. Ecol. Model. 2006, 197, 1–12. [Google Scholar] [CrossRef]
- Guidotti, T. Perspective on the health of urban ecosystems. Ecosyst. Health 1995, 3, 141–149. [Google Scholar]
- Costanza, R. Ecosystem health and ecological engineering. Ecol. Eng. 2012, 45, 24–29. [Google Scholar] [CrossRef]
- O’Brien, A.; Townsend, K.; Hale, R.; Sharley, D.; Pettigrove, V. How is ecosystem health defined and measured? A critical review of freshwater and estuarine studies. Ecol. Indic. 2016, 69, 722–729. [Google Scholar] [CrossRef]
- Lv, Y.L.; Wang, R.S.; Zhang, Y.Q.; Su, S.Q.; Wang, P.; Jenkins, A.; Ferrier, R.C.; Bailey, M.; Squire, G. Ecosystem health towards sustainability. Ecosyst. Heal. Sustain. 2015, 1, 1–15. [Google Scholar]
- Moral, F.J.; Rebollo, F.J.; Me’ndez, F. Using an objective model to estimate overall ozone levels at different urban locations. Stoch. Environ. Res. Risk Assess. 2014, 28, 455–465. [Google Scholar] [CrossRef]
- Zeng, C.; Deng, X.Z.; Xu, S.; Wang, Y.T.; Cui, J.X. An integrated approach for assessing the urban ecosystem health of megacities in China. Cities 2016, 53, 110–119. [Google Scholar] [CrossRef]
- Liu, G.Y.; Yang, Z.F.; Chen, B.; Zhang, Y.; Zhang, L.X.; Zhao, Y.W.; Jiang, M.M. Emergy-based urban health evaluation and development pattern analysis. Ecol. Model. 2009, 220, 2291–2301. [Google Scholar] [CrossRef]
- Yang, Q.; Lin, A.; Zhao, Z.Z.; Zou, L.; Sun, C. Assessment of urban ecosystem health based on entropy weight extension decision model in urban agglomeration. Sustainability 2016, 8, 869. [Google Scholar] [CrossRef]
- Li, Y.F.; Li, D. Assessment and forecast of Beijing and Shanghai’s urban ecosystem health. Sci. Total Environ. 2014, 487, 154–163. [Google Scholar] [CrossRef] [PubMed]
- Mageau, M.T.; Costanza, R.; Ulanowicz, R.E. The development and initial testing of a quantitative assessment of ecosystem health. Health 1995, 1, 201–213. [Google Scholar]
- Wang, R.S.; Li, F.; Hu, D.; Li, B.L. Understanding eco-complexity: Social-Economic-Natural Complex Ecosystem approach. Ecol. Complex. 2011, 8, 15–29. [Google Scholar] [CrossRef]
- Liu, D.L.; Hao, S.L. Ecosystem health assessment at county-scale using the pressure-state-response framework on the Loess Plateau, China. Int. J. Environ. Res. Public Health 2016, 14, 2. [Google Scholar] [CrossRef] [PubMed]
- Tzoulas, K.; Korpela, K.; Venn, S.; Ylipelkonen, V.; Ka´zmierczak, A.; Niemela, J.; James, P. Promoting ecosystem and human health in urban areas using Green Infrastructure: A literature review. Landsc. Urban Plan. 2007, 81, 167–178. [Google Scholar] [CrossRef]
- Peng, J.; Liu, Y.X.; Wu, J.S.; Lv, H.L.; Hu, X.X. Linking ecosystem services and landscape patterns to assess urban ecosystem health: A case study in Shenzhen City, China. Landsc. Urban Plan. 2015, 143, 56–68. [Google Scholar] [CrossRef]
- Su, M.R.; Yang, Z.F.; Chen, B.; Ulgiati, S. Urban ecosystem health assessment based on emergy and set pair analysis: A comparative study of typical Chinese cities. Ecol. Model. 2009, 220, 2341–2348. [Google Scholar] [CrossRef]
- Tao, X.Y. Synthetic assessment of ecosystem health in typical resource-exhausted cities in China. In Proceedings of the IEEE International Geoscience and Remote Sensing Symposium, Shanghai, China, 21–22 December 2008; IEEE: Shanghai, China; pp. 193–196. [Google Scholar]
- Zhao, S.; Chai, L.H. A new assessment approach for urban ecosystem health basing on maximum information entropy method. Stoch. Environ. Res. Risk Assess. 2015, 29, 1601–1613. [Google Scholar] [CrossRef]
- Shi, X.Q.; Yang, J.X. A material flow-based approach for diagnosing urban ecosystem health. J. Clean. Prod. 2014, 64, 437–446. [Google Scholar] [CrossRef]
- Wei, T.; Zhu, X.D.; Li, Y.F. Ecosystem health assessment of Xiamen city: The catastrophe progression method. Acta Ecol. Sin. 2008, 28, 6312–6320. (In Chinese) [Google Scholar]
- Jørgensen, S.E.; Xu, F.; Marques, J.; Salas, F. Application of indicators for the assessment of ecosystem health. In Handbook of Ecological Indicators for Assessment of Ecosystem Health, 2nd ed.; Jørgensen, S., Ed.; CRC Press: Boca Raton, FL, USA, 2011; pp. 9–76. [Google Scholar]
- Jin, J.; Qian, H.; Chen, Y.F.; Xi, W.J. Assessment of groundwater quality based on matter element extension model. J. Chem. 2013, 2013, 715647. [Google Scholar]
- Pan, G.B.; Xu, Y.P.; Yu, Z.H.; Song, S.; Zhang, Y. Analysis of river health variation under the background of urbanization based on entropy weight and matter-element model: A case study in Huzhou City in the Yangtze River Delta, China. Environ. Res. 2015, 139, 31–35. [Google Scholar] [CrossRef] [PubMed]
- Feng, L.H.; Hong, W.H. Application of matter element analysis in weather forecasting. Meteorol. Appl. 2014, 21, 398–402. [Google Scholar] [CrossRef]
- Cai, W. Extension theory and its application. Chin. Sci. Bull. 1999, 44, 1538–1548. [Google Scholar] [CrossRef]
- Ou, Z.R.; Zhu, Q.K.; Sun, Y.Y. Regional ecological security and diagnosis of obstacle factors in underdeveloped regions: A case study in Yunnan Province, China. J. Mt. Sci 2017, 14, 870–884. [Google Scholar] [CrossRef]
- Yang, Z.F.; Su, M.R.; Zhang, B.; Zhang, Y.; Hu, T.L. Limiting factor analysis and regulation for urban ecosystems—A case study of Ningbo, China. Commun. Nonlinear Sci. Numer. Simul. 2010, 15, 2701–2709. [Google Scholar] [CrossRef]
- Cai, W. Matter Element Model and Its Application; Literature Press of Science and Technology: Beijing, China, 1994. (In Chinese) [Google Scholar]
- Jiangsu Provincial Government. Planning of Ecological Civilization Construction in Jiangsu Province: 2013–2022. Available online: http://www.jiangsu.gov.cn/jsgov/tj/bgt/201308/t20130807_391925.html (accessed on 1 July 2016).
- Shankar, K.M.; Kumar, P.U.; Kannan, D. Analyzing the drivers of advanced sustainable manufacturing system using AHP approach. Sustainability 2016, 8, 824. [Google Scholar] [CrossRef] [Green Version]
- Veisi, H.; Liaghati, H.; Alipour, A. Developing an ethics-based approach to indicators of sustainable agriculture using analytic hierarchy process (AHP). Ecol. Indic. 2016, 60, 644–654. [Google Scholar] [CrossRef]
- Zhou, B.; Zhong, L.S.; Chen, T.; Zhang, A.P. Spatio-temporal pattern and obstacle factors of ecological security of tourism destination: A case of Zhejiang Province. Sci. Geogr. Sin. 2015, 35, 599–607. [Google Scholar]
- National Bureau of Statistics of the People’s Republic of China. The 2001 Jiangsu Statistical Yearbook; China Statistics Press: Beijing, China, 2001. (In Chinese)
- National Bureau of Statistics of the People’s Republic of China. The 2006 Jiangsu Statistical Yearbook; China Statistics Press: Beijing, China, 2006. (In Chinese)
- National Bureau of Statistics of the People’s Republic of China. The 2011 Jiangsu Statistical Yearbook; China Statistics Press: Beijing, China, 2011. (In Chinese)
- National Bureau of Statistics of the People’s Republic of China. The 2015 Jiangsu Statistical Yearbook; China Statistics Press: Beijing, China, 2015. (In Chinese)
- Jiangsu Provincial Department of Environmental Protection. The 2001 Jiangsu Environmental Quality Bulletin; Jiangsu Provincial Department of Environmental Protection: Nanjing, China, 2001. (In Chinese)
- Jiangsu Provincial Department of Environmental Protection. The 2006 Jiangsu Environmental Quality Bulletin; Jiangsu Provincial Department of Environmental Protection: Nanjing, China, 2006. (In Chinese)
- Jiangsu Provincial Department of Environmental Protection. The 2011 Jiangsu Environmental Quality Bulletin; Jiangsu Provincial Department of Environmental Protection: Nanjing, China, 2011. (In Chinese)
- Jiangsu Provincial Department of Environmental Protection. The 2015 Jiangsu Environmental Quality Bulletin; Jiangsu Provincial Department of Environmental Protection: Nanjing, China, 2015. (In Chinese)
- Su, M.R.; Chen, C.; Lu, W.W.; Liu, G.Y.; Yang, Z.F.; Chen, B. Urban public health assessment and pattern analysis: Comparison of four cities in different countries. Front. Earth Sci. 2013, 7, 191–198. [Google Scholar] [CrossRef]
- Su, M.R.; Zhang, Y.; Liu, G.Y.; Xu, L.Y.; Zhang, L.X.; Yang, Z.F. Urban ecosystem health assessment: Perspectives and Chinese practice. Int. J. Environ. Res. Public Health 2013, 10, 5874–5885. [Google Scholar] [CrossRef] [PubMed]


| Characteristic | Region | ||||||||||||
|---|---|---|---|---|---|---|---|---|---|---|---|---|---|
| NJ | WX | XZ | CZ | SZ | NT | LYG | HA | YC | YZ | ZJ | TZ | SQ | |
| X1 | 10.77 | 12.65 | 5.78 | 10.45 | 13.01 | 7.75 | 4.44 | 5.09 | 5.31 | 8.27 | 10.28 | 7.27 | 4.01 |
| X2 | 10.1 | 8.2 | 10.6 | 10.1 | 8.4 | 10.6 | 10.2 | 11 | 10.9 | 11 | 10.9 | 10.8 | 10.8 |
| X3 | 0.55 | 0.46 | 0.46 | 0.46 | 0.46 | 0.505 | 0.46 | 0.46 | 0.46 | 0.505 | 0.55 | 0.46 | 0.46 |
| X4 | 4.26 | 4.17 | 2.41 | 3.95 | 4.67 | 3.34 | 2.36 | 2.58 | 2.59 | 3.03 | 3.58 | 3.13 | 2.04 |
| X5 | 213.9 | 188.8 | 107.8 | 156.6 | 527.8 | 149.8 | 62 | 77.9 | 68.1 | 90.2 | 84.2 | 61 | 43.2 |
| X6 | 44.1 | 42.9 | 43.3 | 43 | 42.2 | 42.6 | 40 | 40.9 | 40.5 | 43.6 | 42.5 | 40.7 | 42.3 |
| X7 | 1247 | 1405 | 733 | 1074 | 1225 | 692 | 585 | 484 | 427 | 679 | 826 | 802 | 568 |
| X8 | 4.09 | 2.54 | 20.32 | 2.7 | 3.08 | −0.59 | 15.51 | 12.48 | 4.5 | 2.33 | 1.53 | 1.21 | 18.93 |
| X9 | 56.5 | 48.4 | 45.2 | 48.0 | 48.4 | 44.2 | 41.4 | 44.1 | 40.8 | 42.9 | 46.1 | 43.4 | 38.9 |
| X10 | 56.4 | 38.8 | 34.8 | 37.2 | 35.9 | 31.2 | 36.2 | 40.5 | 37.7 | 36.4 | 41.0 | 33.9 | 27.7 |
| X11 | 10.2 | 9.4 | 9.5 | 8.9 | 10.5 | 9.7 | 13.3 | 12.6 | 10.9 | 8.0 | 8.5 | 8.2 | 10.9 |
| X12 | 6.6 | 16 | 18.8 | 16.1 | 4 | 18.1 | 27.1 | 23.6 | 24.1 | 19.3 | 22.2 | 24.6 | 20.8 |
| X13 | 95.2 | 99.3 | 99 | 100 | 99.5 | 99.4 | 98.1 | 100 | 92.6 | 98.3 | 98.5 | 97.4 | 94.7 |
| X14 | 95.3 | 96.8 | 92.7 | 95 | 95.7 | 92.8 | 84.1 | 91 | 89.2 | 93.7 | 92.8 | 89.5 | 93.5 |
| X15 | 91.9 | 91.1 | 99 | 98.2 | 96.7 | 98.3 | 93.7 | 99.5 | 93.9 | 92.3 | 98.6 | 98.3 | 94 |
| X16 | 3.5 | 3.4 | 3.7 | 3.2 | 3.9 | 3.7 | 2.9 | 3.1 | 2.8 | 2.9 | 3.1 | 3.4 | 2.9 |
| X17 | 52.1 | 57.7 | 65.6 | 63.8 | 72.6 | 70.8 | 69.4 | 60.8 | 74 | 65.5 | 65.9 | 65.8 | 63.8 |
| X18 | 53.8 | 56.2 | 56.7 | 52.6 | 54 | 58 | 53.3 | 53.9 | 51.3 | 54.6 | 54.8 | 53.3 | 53 |
| X19 | 15 | 14.8 | 16.2 | 13.2 | 15.2 | 16.8 | 14.2 | 13.8 | 12 | 18 | 18.7 | 9.5 | 13.8 |
| X20 | 36.3 | 44.8 | 40.5 | 43.7 | 44 | 46.3 | 45.3 | 43.6 | 42.7 | 42.1 | 44.2 | 48 | 46.5 |
| X21 | 22.2 | 25.2 | 25.3 | 25.5 | 28.1 | 29.2 | 21.4 | 20.9 | 20.1 | 21.7 | 24.2 | 24.3 | 27.7 |
| X22 | 11.5 | 13.3 | 9.8 | 9 | 9.2 | 10.2 | 2.9 | 11.2 | 4.2 | 9.5 | 6.8 | 4.2 | 6.4 |
| X23 | 2.5 | 2.12 | 2.4 | 2.14 | 2.4 | 2.3 | 2.6 | 2.6 | 2.4 | 2.3 | 2.12 | 2.2 | 2.5 |
| X24 | 26 | 28.7 | 30.8 | 28.3 | 26.9 | 29 | 32.3 | 31.3 | 31.9 | 30.9 | 28.5 | 29.1 | 36.1 |
| X25 | 3 | 4.4 | 4.4 | 3.5 | 4.4 | 4.4 | 4.4 | 2.9 | 4.4 | 4.4 | 2.8 | 3.4 | 4.4 |
| X26 | 47.6 | 47.7 | 50 | 45.8 | 49.9 | 46.8 | 37.1 | 47.1 | 46.6 | 39 | 40.2 | 42.1 | 41.6 |
| X27 | 980 | 176 | 159 | 231 | 198 | 111 | 86 | 139 | 78 | 181 | 266 | 106 | 36 |
| Component | Indicator | Weight | Reference |
|---|---|---|---|
| Vigor | X1 Per capita GDP (10,000 CNY) | 0.0221 | [12,14,15] |
| X2 GDP growth (%) | 0.0253 | [3,15] | |
| X3 Energy consumption per 10,000 CNY of GDP(ton of SCE/10,000 CNY) | 0.0474 | [14,15,32] | |
| X4 Per capita annual disposable income of urban households (10,000 CNY) | 0.0331 | [14,15,32] | |
| X5 Actual use of foreign capital (100 Million CNY) | 0.0179 | [25] | |
| X6 Green covered area as of completed area (%) | 0.0303 | [12,14] | |
| Organization | X7 Population density of urban area (persons/km2) | 0.0467 | [12,14,15] |
| X8 Natural growth rate of population (‰) | 0.0472 | [3,12,23] | |
| X9 Tertiary industry accounted for the proportion of GDP (%) | 0.0590 | [14,15,32] | |
| X10 Proportion of tertiary industry employment (%) | 0.0392 | [25] | |
| X11 Fiscal revenue accounted for the proportion of GDP (%) | 0.0352 | [3,25] | |
| X12 Growth rate of total investment in fixed assets (%) | 0.0378 | [23,25] | |
| Resilience | X13 Attainment rate of the industrial wastewater discharged (%) | 0.0602 | [12,15] |
| X14 Urban wastewater treatment rate (%) | 0.0438 | [12,15] | |
| X15 Common industrial solid wastes comprehensively utilized (%) | 0.0348 | [12,15] | |
| X16 Total investment in the treatment of environmental pollution as percent GDP (%) | 0.0660 | [14,15,32] | |
| Service function | X17 Proportion of days of air quality equal to or above grade II in the whole year (%) | 0.0396 | [14,15] |
| X18 Urban environmental noise (dB) | 0.0215 | [25] | |
| X19 Per capita area of parks and green land (m2) | 0.0332 | [12,14,15] | |
| X20 Per capita urban residential area (m2) | 0.0296 | [12,15,23] | |
| X21 Per capita area of paved roads in city (m2) | 0.0298 | [12,14,15] | |
| X22 Number of public transportation vehicles per 10,000 population in city (unit) | 0.0212 | [14,15] | |
| X23 Registered urban unemployment rate (%) | 0.0419 | [12,14,15] | |
| Population health | X24 Engel’s coefficient of urban households (%) | 0.0524 | [14,15,23] |
| X25 Under 5 mortality rate (‰) | 0.0360 | [25] | |
| X26 Number of beds of hospitals and health centers per 10,000 population (bed) | 0.0282 | [14,15,23] | |
| X27 Number of students’ enrollment of regular institutions of higher education per 10,000 population (10,000 persons) | 0.0208 | [3,14,15] |
| Indicators | Grade | Reference | ||||
|---|---|---|---|---|---|---|
| Poor | General | Medium | Good | Excellent | ||
| X1 | 0–2 | 2–4 | 4–8 | 8–12 | 12–16 | [12,14] |
| X2 | 0–4 | 4–8 | 8–12 | 12–16 | 16–30 | [32,34] |
| X3 | 1.5–2 | 1.2–1.5 | 0.9–1.2 | 0.6–0.9 | 0–0.6 | [14,32,34] |
| X4 | 0–0.8 | 0.8–1.5 | 1.5–2.5 | 2.5–3.5 | 3.5–5 | [14,32,34] |
| X5 | 0–100 | 100–200 | 200–300 | 300–400 | 400–600 | [25] |
| X6 | 0–20 | 20–30 | 30–40 | 40–50 | 50–80 | [14,32] |
| X7 | 1300–1500 | 1100–1300 | 900–1100 | 700–900 | 400–700 | [12,32] |
| X8 | 15–25 | 12–15 | 9–12 | 6–9 | 2–6 | Experts’ opinion |
| X9 | 0–20 | 20–30 | 30–40 | 40–50 | 50–80 | [14,32] |
| X10 | 0–20 | 20–30 | 30–40 | 40–50 | 50–80 | [25] |
| X11 | 0–5 | 5–10 | 10–15 | 15–20 | 20–25 | Experts’ opinion |
| X12 | 0–10 | 10–20 | 20–30 | 30–40 | 40–50 | Experts’ opinion |
| X13 | 50–75 | 75–80 | 80–85 | 85–95 | 95–100 | [12,14,32] |
| X14 | 40–50 | 50–70 | 70–80 | 80–90 | 90–100 | [14,32,34] |
| X15 | 40–50 | 50–70 | 70–80 | 80–90 | 90–100 | [12,32,34] |
| X16 | 0–1.5 | 1.5–2.5 | 2.5–3.5 | 3.5–4.5 | 4.5–6 | [14,25,34] |
| X17 | 0–20 | 20–40 | 40–60 | 60–80 | 80–100 | [14,32] |
| X18 | 85–100 | 70–85 | 55–70 | 45–55 | 30–45 | [25] |
| X19 | 0–4 | 4–7 | 7–10 | 10–16 | 16–20 | [12,14] |
| X20 | 0–15 | 15–25 | 25–35 | 35–45 | 45–55 | [12,25] |
| X21 | 0–5 | 5–10 | 10–20 | 20–25 | 25–30 | [12,14] |
| X22 | 0–5 | 5–10 | 10–15 | 15–20 | 20–25 | [14,25] |
| X23 | 20–25 | 15–20 | 10–15 | 5–10 | 0–5 | [12,14] |
| X24 | 40–60 | 35–40 | 30–35 | 25–30 | 0–25 | [14,32,34] |
| X25 | 16–20 | 12–16 | 8–12 | 4–8 | 0–4 | Experts’ opinion |
| X26 | 0–100 | 100–300 | 300–500 | 500–800 | 800–1200 | [14,25] |
| X27 | 0–50 | 50–150 | 150–300 | 300–600 | 600–1000 | [25] |
| Region | Urban Ecosystem Health Grade of Each Index (2014) | ||||||||||||||||||||||||||
|---|---|---|---|---|---|---|---|---|---|---|---|---|---|---|---|---|---|---|---|---|---|---|---|---|---|---|---|
| X1 | X2 | X3 | X4 | X5 | X6 | X7 | X8 | X9 | X10 | X11 | X12 | X13 | X14 | X15 | X16 | X17 | X18 | X19 | X20 | X21 | X22 | X23 | X24 | X25 | X26 | X27 | |
| Nanjing | IV | III | V | V | III | IV | II | V | V | V | III | I | V | V | V | III | III | IV | IV | IV | IV | III | V | IV | V | I | V |
| Wuxi | V | III | V | V | II | IV | I | V | IV | III | II | II | V | V | V | III | III | III | IV | IV | V | III | V | IV | IV | I | III |
| Xuzhou | III | III | V | III | II | IV | IV | I | IV | III | II | II | V | V | V | IV | IV | III | V | IV | V | II | V | III | IV | I | III |
| Changzhou | IV | III | V | V | II | IV | III | V | IV | III | II | II | V | V | V | III | IV | IV | IV | IV | V | II | V | IV | V | I | III |
| Suzhou | V | III | V | V | V | IV | II | V | IV | III | III | I | V | V | V | IV | IV | IV | IV | IV | V | II | V | IV | II | I | III |
| Natong | III | III | V | IV | II | IV | V | I | IV | III | II | II | V | V | V | IV | IV | III | V | V | V | III | V | IV | II | I | II |
| Lianyungang | III | III | V | III | I | IV | V | II | IV | III | III | III | V | IV | V | III | IV | IV | IV | V | IV | I | V | III | II | I | II |
| Huai’an | III | III | V | IV | I | IV | V | V | IV | IV | III | III | V | V | V | III | IV | IV | IV | IV | IV | III | V | III | V | I | II |
| Yancheng | III | III | V | IV | I | IV | V | V | IV | III | III | III | V | IV | V | III | IV | IV | IV | IV | IV | I | V | III | II | I | II |
| Yangzhou | IV | III | V | IV | I | IV | V | V | IV | III | II | II | V | V | V | III | IV | IV | V | IV | IV | II | V | III | II | I | III |
| Zhenjiang | IV | III | V | V | I | IV | IV | V | IV | IV | II | III | V | V | V | III | IV | IV | V | IV | IV | II | V | IV | V | I | III |
| Taizhou | III | III | V | IV | I | IV | IV | V | IV | III | II | III | V | IV | V | III | IV | IV | III | V | IV | I | V | IV | V | I | II |
| Suqian | III | III | V | III | I | IV | V | I | III | II | III | III | V | V | V | III | IV | IV | IV | V | V | II | V | II | II | I | I |
| Region | Synthetically Correlation Degree (2014) | 2014 | 2010 | 2005 | 2000 | ||||
|---|---|---|---|---|---|---|---|---|---|
| Poor | General | Medium | Good | Excellent | Grade | ||||
| Nanjing | –0.4549 | –0.3786 | –0.2670 | –0.1723 | –0.1439 | Excellent | Excellent | Good | Good |
| Wuxi | –0.5458 | –0.4722 | –0.3789 | –0.2918 | –0.2063 | Excellent | Excellent | Medium | General |
| Xuzhou | –0.5132 | –0.4357 | –0.3253 | –0.2486 | –0.2369 | Excellent | Excellent | Medium | General |
| Changzhou | –0.5625 | –0.4509 | –0.3529 | –0.2815 | –0.1946 | Excellent | Excellent | Medium | General |
| Suzhou | –0.5809 | –0.5168 | –0.4400 | –0.3267 | –0.1835 | Excellent | Excellent | Medium | Medium |
| Nantong | –0.5925 | –0.4873 | –0.3962 | –0.3001 | –0.1790 | Excellent | Excellent | Medium | General |
| Lianyungang | –0.4896 | –0.4139 | –0.2896 | –0.2320 | –0.2507 | Good | Excellent | Medium | General |
| Huaian | –0.5291 | –0.4309 | –0.2955 | –0.2621 | –0.2163 | Excellent | Excellent | Medium | General |
| Yancheng | –0.5228 | –0.4296 | –0.3044 | –0.2214 | –0.2252 | Good | Good | Excellent | General |
| Yangzhou | –0.5498 | –0.4461 | –0.3294 | –0.2428 | –0.2020 | Excellent | Excellent | Good | General |
| Zhenjiang | –0.5705 | –0.4832 | –0.3701 | –0.2653 | –0.1798 | Excellent | Excellent | Medium | General |
| Taizhou | –0.5405 | –0.4552 | –0.3386 | –0.2522 | –0.2184 | Excellent | Excellent | Medium | General |
| Suqian | –0.4783 | –0.4113 | –0.3375 | –0.2975 | –0.2581 | Excellent | Excellent | Excellent | Poor |
| UEH Level | 2000 | 2005 | 2010 | 2014 | ||||
|---|---|---|---|---|---|---|---|---|
| Area (km2) | Proportion (%) | Area (km2) | Proportion (%) | Area (km2) | Proportion (%) | Area (km2) | Proportion (%) | |
| Excellent | 0 | 0.0 | 25,444 | 24.8 | 85,711 | 83.5 | 78,265 | 76.3 |
| Good | 6597 | 6.4 | 13,231 | 12.9 | 16,889 | 16.5 | 24,335 | 23.7 |
| Medium | 8488 | 8.3 | 63,814 | 62.3 | 0 | 0.00 | 0 | 0.00 |
| General | 78,960 | 77.0 | 0 | 0.00 | 0 | 0.00 | 0 | 0.00 |
| Poor | 8555 | 8.3 | 0 | 0.00 | 0 | 0.00 | 0 | 0.00 |
© 2017 by the authors. Licensee MDPI, Basel, Switzerland. This article is an open access article distributed under the terms and conditions of the Creative Commons Attribution (CC BY) license (http://creativecommons.org/licenses/by/4.0/).
Share and Cite
Xie, X.; Pu, L. Assessment of Urban Ecosystem Health Based on Matter Element Analysis: A Case Study of 13 Cities in Jiangsu Province, China. Int. J. Environ. Res. Public Health 2017, 14, 940. https://doi.org/10.3390/ijerph14080940
Xie X, Pu L. Assessment of Urban Ecosystem Health Based on Matter Element Analysis: A Case Study of 13 Cities in Jiangsu Province, China. International Journal of Environmental Research and Public Health. 2017; 14(8):940. https://doi.org/10.3390/ijerph14080940
Chicago/Turabian StyleXie, Xuefeng, and Lijie Pu. 2017. "Assessment of Urban Ecosystem Health Based on Matter Element Analysis: A Case Study of 13 Cities in Jiangsu Province, China" International Journal of Environmental Research and Public Health 14, no. 8: 940. https://doi.org/10.3390/ijerph14080940