2.1. Study Population
A list of potential candidate companies for RCS monitoring was obtained from the Taiwan Association of Casting Industry (TACI) in 2014. Data on the main products manufactured, employee numbers, geographic locations, and manufacturing processes were collected from the TACI website [
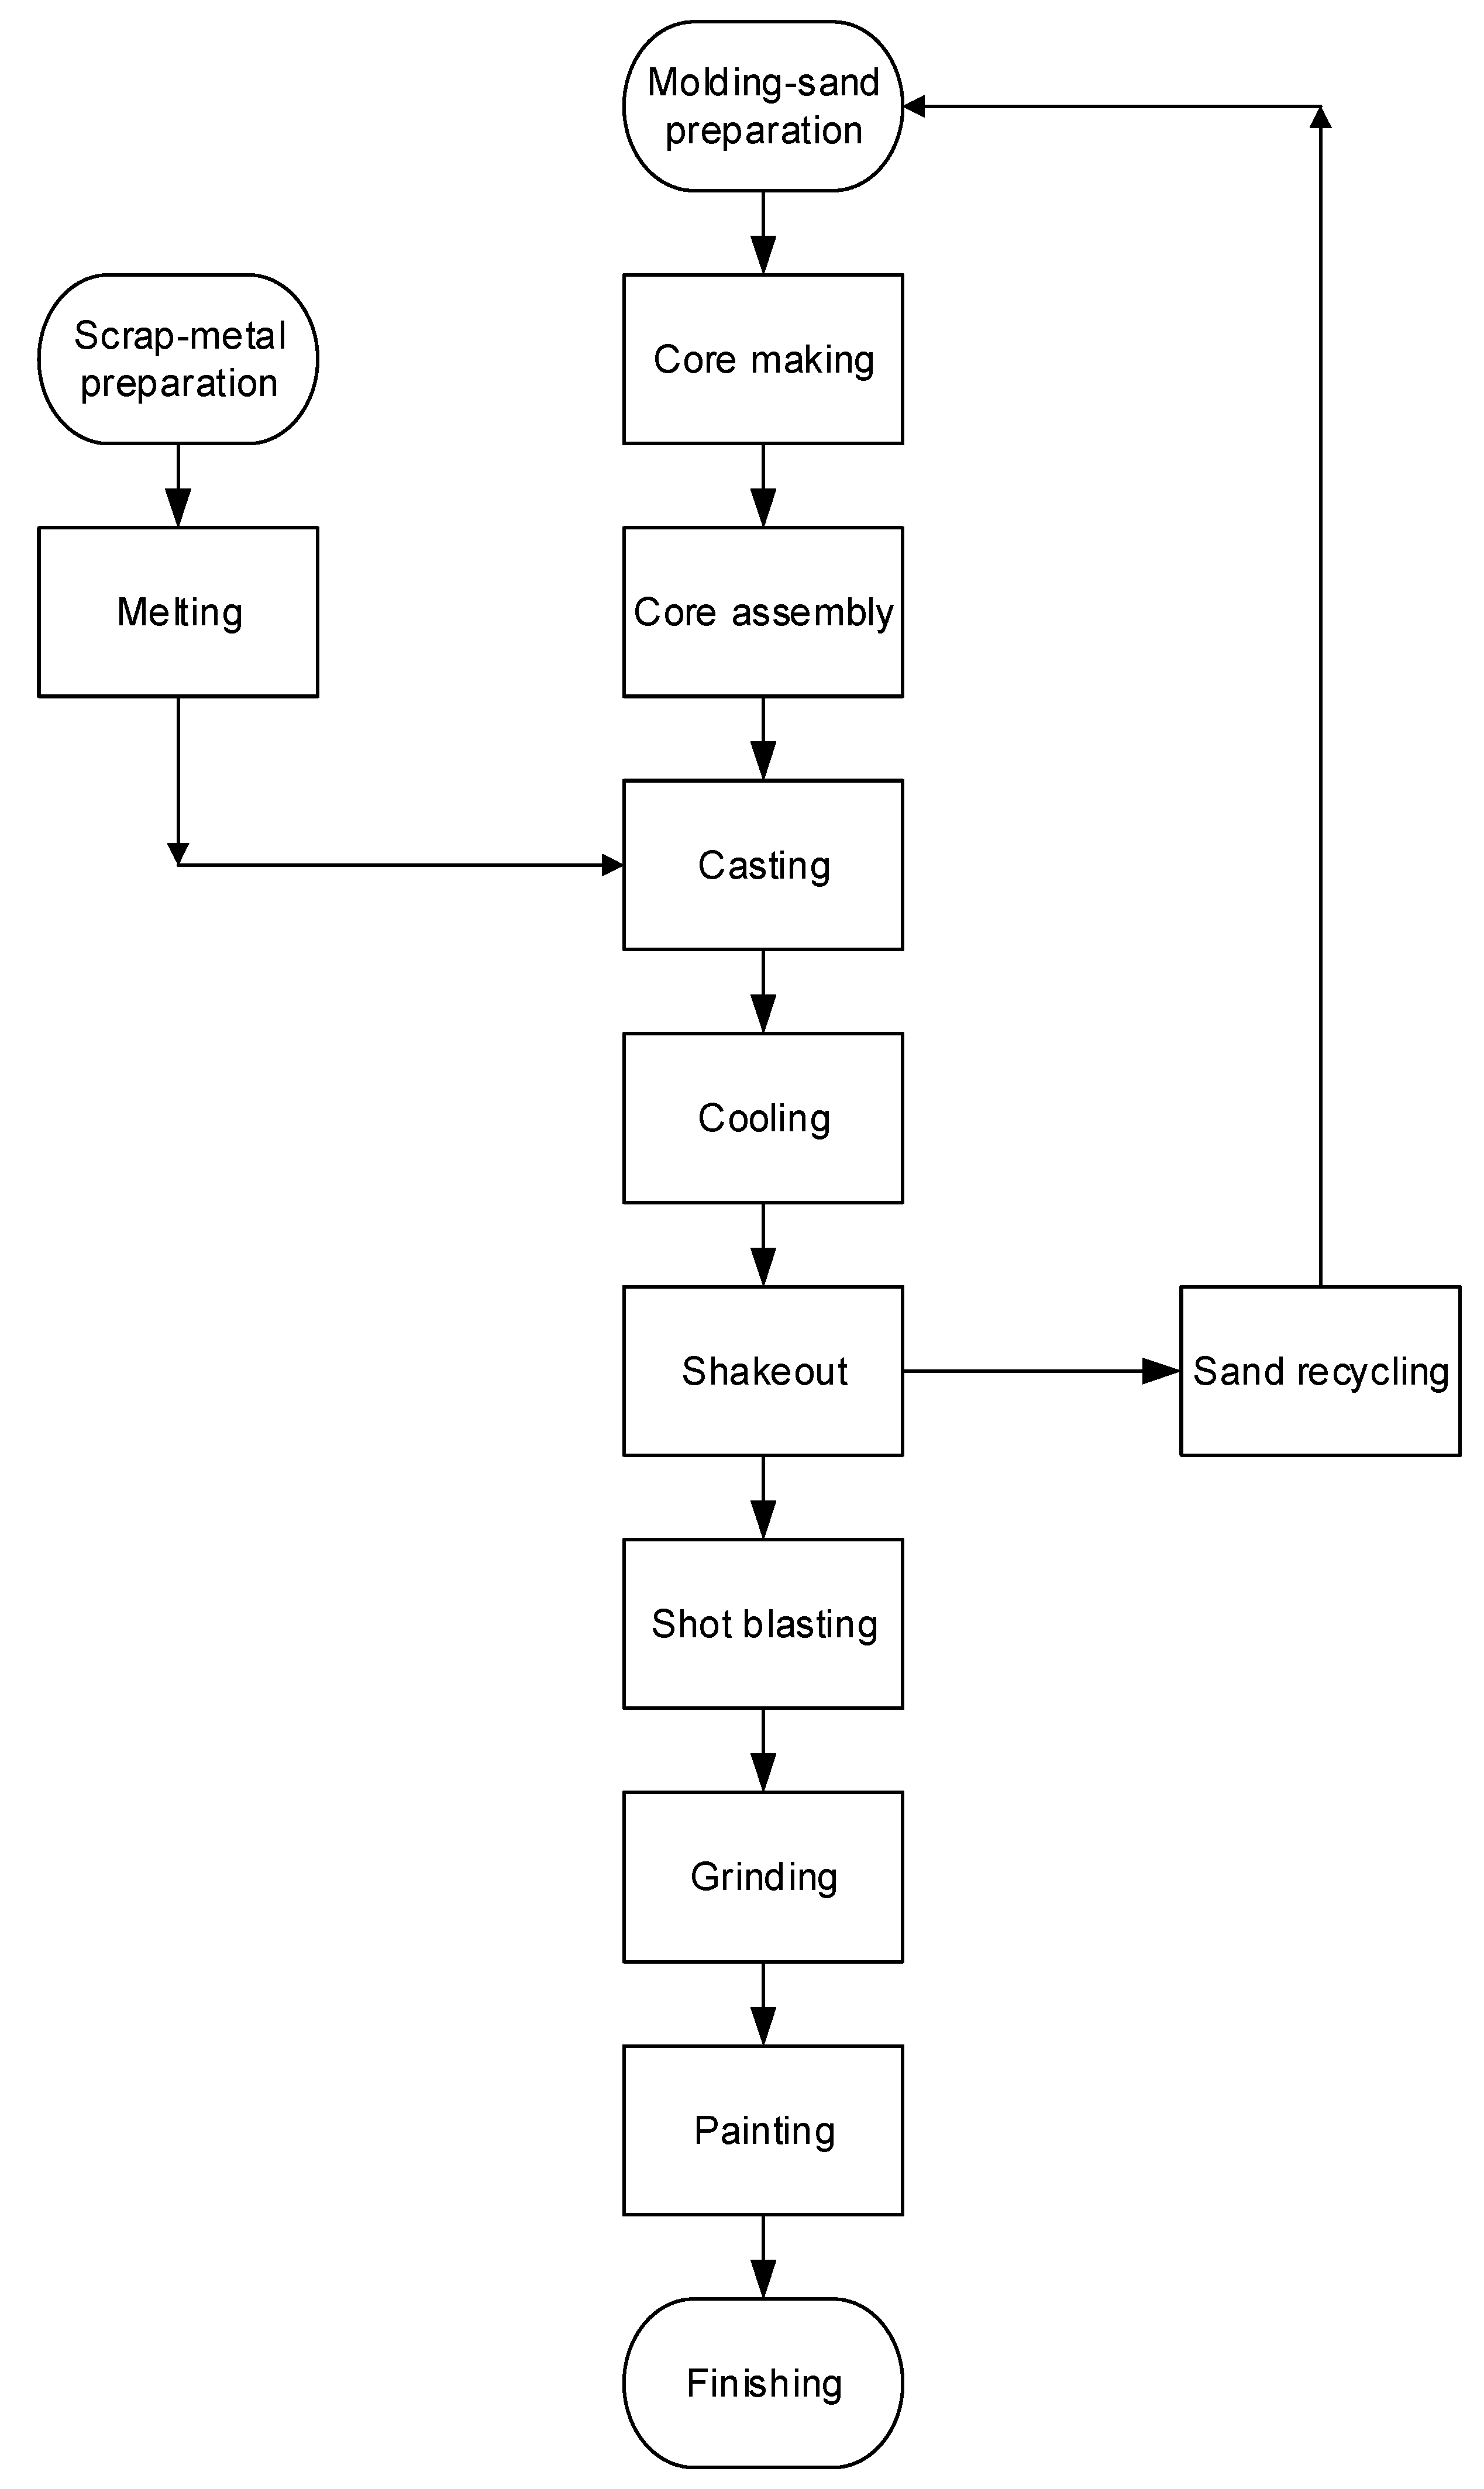
27]. Three companies were selected as representative: an organization manufacturing large items which followed a mandated occupational safety and health program (Factory A; 78 workers); an organization manufacturing large items which did not follow the mandated occupational safety and health program (Factory B; 110 workers); and an organization manufacturing small items which did not follow a health and safety program (Factory C; 48 workers). A fourth company, manufacturing large products which did not follow the occupational safety and health program (Factory D; 88 workers), was used to test the validity of the predictive models established using data from Factories A–C. The selected factories produced various types of cast iron (i.e., nodular, grey, and ductile), and conducted machine-tool casting, Meehanite casting, general machine casting, and steel casting from different materials (e.g., carbon, friction-resisting, anti-corrosion, heat-resisting, stainless, and nickel-base). The main processes of the foundry industry are shown in
Figure 1. Because this study is part of an exposure assessment in an epidemiological study, it has been reviewed and approved by the Institute Review Board of College of Public Health of the China Medical University (Ethic code: 100-03-10-04) before the implementation. Written informed consent was acquired from each company and participant before the commencement of the study.
2.2. Exposure Assessment and Sampling Strategy
A walk-through survey was conducted at each factory by an industrial hygienist, who collected information including the safety data sheet of used silica sand, details regarding production processes, the number of production-line workers, operating styles, casting materials and fuel, use of personal protective equipment, and climatic conditions (i.e., air-velocity direction, wind speed, temperature, relative humidity, and ventilation) in the workplace. Workers mixed silica sand with binders manually to prepare the mold and cores or collected scrap metal for melting in the furnace at 700–1200 °C before casting. After pouring the molten metal into a mold cavity with refractory cores to create void spaces, the mold was then moved for cooling. Shake out was conducted to remove the molding media around the metal casting and shot blasting was then performed. The remaining molding sand was recycled and conditioned for molding-sand preparation. Finally, grinding/fettling and painting completed the process.
Because each worker was responsible for at least two operations, subjects in each company were classified into one of six similar exposure groups (SEGs) based on their operating processes, tasks, and work locations as determined by the walk-through survey. These SEGs were modeling (i.e., molding-sand preparation, core making, and core assembly), casting (such as scrap-metal preparation, melting, casting, and cooling), sand-box cleaning (i.e., shakeout and sand recycling), sand blasting (i.e., shot blasting and transportation), polishing (such as grinding/fettling and painting), and office areas. Based on production scale, process characteristics, and employee numbers at each factory, one worker was selected to represent the similar exposure level for an average of eight workers in the same SEG. A total of 38 personal air samples were collected from the individual breathing zones of subjects among the four companies. Personal air sampling was performed for each worker with a shift from 09:00–16:00 (with a one-hour break taken for lunch) on work days during 2014–2015. Air samples obtained from office workers in each company were considered to be the reference group. In this study, there were 11 air samples from Factory A on December 16 (Tuesday) in 2014, 13 from Factory B on January 8 (Thursday) in 2015, six from Factory C on February 4 (Wednesday) in 2015, and eight from Factory D on March 25 (Wednesday) in 2015.
During personal air sampling, the wind speed, temperature, and relative humidity were measured simultaneously using an air-velocity meter (Velocicalc Model 9545, TSI Inc., Shoreview, MN, USA). The measured ranges (accuracy) for these atmospheric parameters were 0 to 30 m/s (±0.015 m/s), −10 to 60 °C (±0.3 °C), and 0 to 95% (±3%) for wind speed, temperature, and relative humidity, respectively. The instrument was calibrated before use.
2.3. Respirable Dust Sampling and Respirable Crystalline Silica Analysis
Personal air samples of respirable dust were obtained using the method established by the Institute of Labor, Occupational Safety and Health (ILOSH), Ministry of Labor, Taiwan (method number: 4003) [
28]. A personal air sampling pump (AirChek 52, SKC Inc., Eighty Four, PA, USA) was set to an air flow rate of 2.5 L/min and linked to a 25 mm aluminum cyclone assembly (SKC225-01-01, SKC Inc., Eighty Four, PA, USA) with a 25 mm filter cassette that contained a glass microfiber filter coating with a polytetrafluoroethylene filter (T60A20, PALL Life Sciences, Westborough, MA, USA) for collecting air samples. The filter was analyzed gravimetrically using an electronic balance (ER-182A, A & D Mercury Ltd., Thebarton, Australia; accuracy: 0.01 mg) with conditioning at 25 ± 3 °C and 50 ± 5% relative humidity for 24 h before analysis. The cyclone assembly and air sampling pump were placed on each participant to collect respirable dust in their personal breathing zone during a six-hour shift. Because the workers did not wear personal protective respirators, the collected air samples present the personal external exposure in the workplace. These samples were then properly packaged and shipped to the laboratory for gravimetric and component analysis.
After the gravimetric analysis of respirable dust, the air sample was further analyzed for the concentration of respirable crystalline-free silica using an X-ray diffractometer (Shimadzu 6000, Shimadzu Corp., Kyoto, Japan) with an irradiation of Cu Kα (λ = 1.5418 Å, 40.0 kV, 30.0 mA). The instrument recorded from 5° to 70° (2θ) with a scanning step of 0.5°/min for qualitative measurements, and quartz, cristobalite, and tridymite were set at 26.2–27.0°, 21.4–22.4°, and 20.3–21.1° of 0.02°/min, respectively, for quantitative determination. A calibration curve was established for each composition that ranged from 0.03–5.16 mg/sample for quartz, 0.03–4.56 mg/sample for cristobalite, and 0.041–2.49 mg/sample for tridymite. All calibration curves had R
2 ≥ 0.995. Background concentration was adjusted according to the Japanese Industrial Standards (JIS) method A1481 applied to the correction of aluminum-based substrate absorption [
29]. The qualitative limit of detection (LOD) for quartz, cristobalite, and tridymite was 8 μg, 6 μg, and 42 μg, respectively. A reagent blank was analyzed after every 10 samples for quality assurance purposes to determine whether the analytical system was contaminated. If the blank value was higher than twice the LOD, the source of contamination or interference was identified and excluded before the re-analysis of the samples. Further laboratory details are available from the ILOSH [
28]. For measured RCS below the LOD, the half LOD (i.e., 1.5 μg/m
3) was recorded due to the highly skewed distribution of raw RCS data [
30].
2.4. Statistical Analysis
The Shapiro—Wilk test was used to evaluate the normality of continuous variables, including respirable dust level, RCS level, wind speed, temperature, and relative humidity. Because these variables were not normally distributed, the non-parametric Kruskal–Wallis test was conducted to compare the differences between companies and/or processes. Later, the Wilcoxon rank sum test was used to perform the post-hoc examination for those variables with significant between-group differences. In addition, the median, range, geometric mean (GM), and geometric standard deviation (GSD) were calculated as the statistical descriptors.
The concentrations of respirable dust and RCS were used a base-10 logarithmic transformation to produce a normal distribution for further analysis. Simple linear regression was applied to identify the significant predictive variables for the normally distributed levels of respirable dust and RCS. Of the 27 RCS samples collected, 10 were less than the LOD (i.e., 0.003 mg/m
3); hence, they were not included in the dataset to develop the predictive model to avoid interference and improve predictive capacity. Three personal samples collected from office workers at each company were used as the model reference group. Labor scale was defined as large (≥100 employees) or small (<100 employees) for companies. Both labor scale (as compared to the small company) and process variables (as compared to the office area) were coded as 1/0 in the analyses. Multiple linear regression models were performed to establish the predictive levels of respirable dust and RCS. Only those variables that produced a change greater than 10% in the adjusted R
2 values for the base-10 logarithmically transformed levels of respirable dust and RCS were used in the final model [
31,
32]. A stepwise approach using Akaike Information Criteria (AIC) was applied to select variables in the final model, where the model with the lowest AIC value was preferred. All variables in the final model had
p values < 0.10. A maximum variance inflation factor (VIF) of 10 was selected as the cutoff value to indicate excessive multi-collinearity between predictive variables [
33]. The Durbin–Watson (DW) value was used to present a lack of autocorrelation in the residuals of a regression model as being higher than the test bound based on the significance level, sample size, and the number of included variables [
34]. Furthermore, residual diagnostics were performed to test whether all the linear regression model assumptions were fitted in the analysis. The Statistical Analysis Software (SAS), standard package version 9.4 for Windows, was used for statistical analysis (SAS Institute Incorporation, Cary, NC, USA) and a significance level of 0.050 was used for all tests.
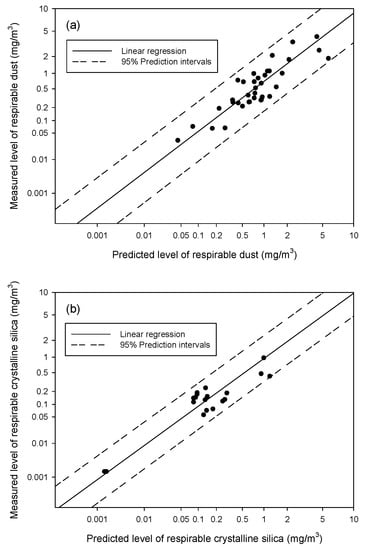
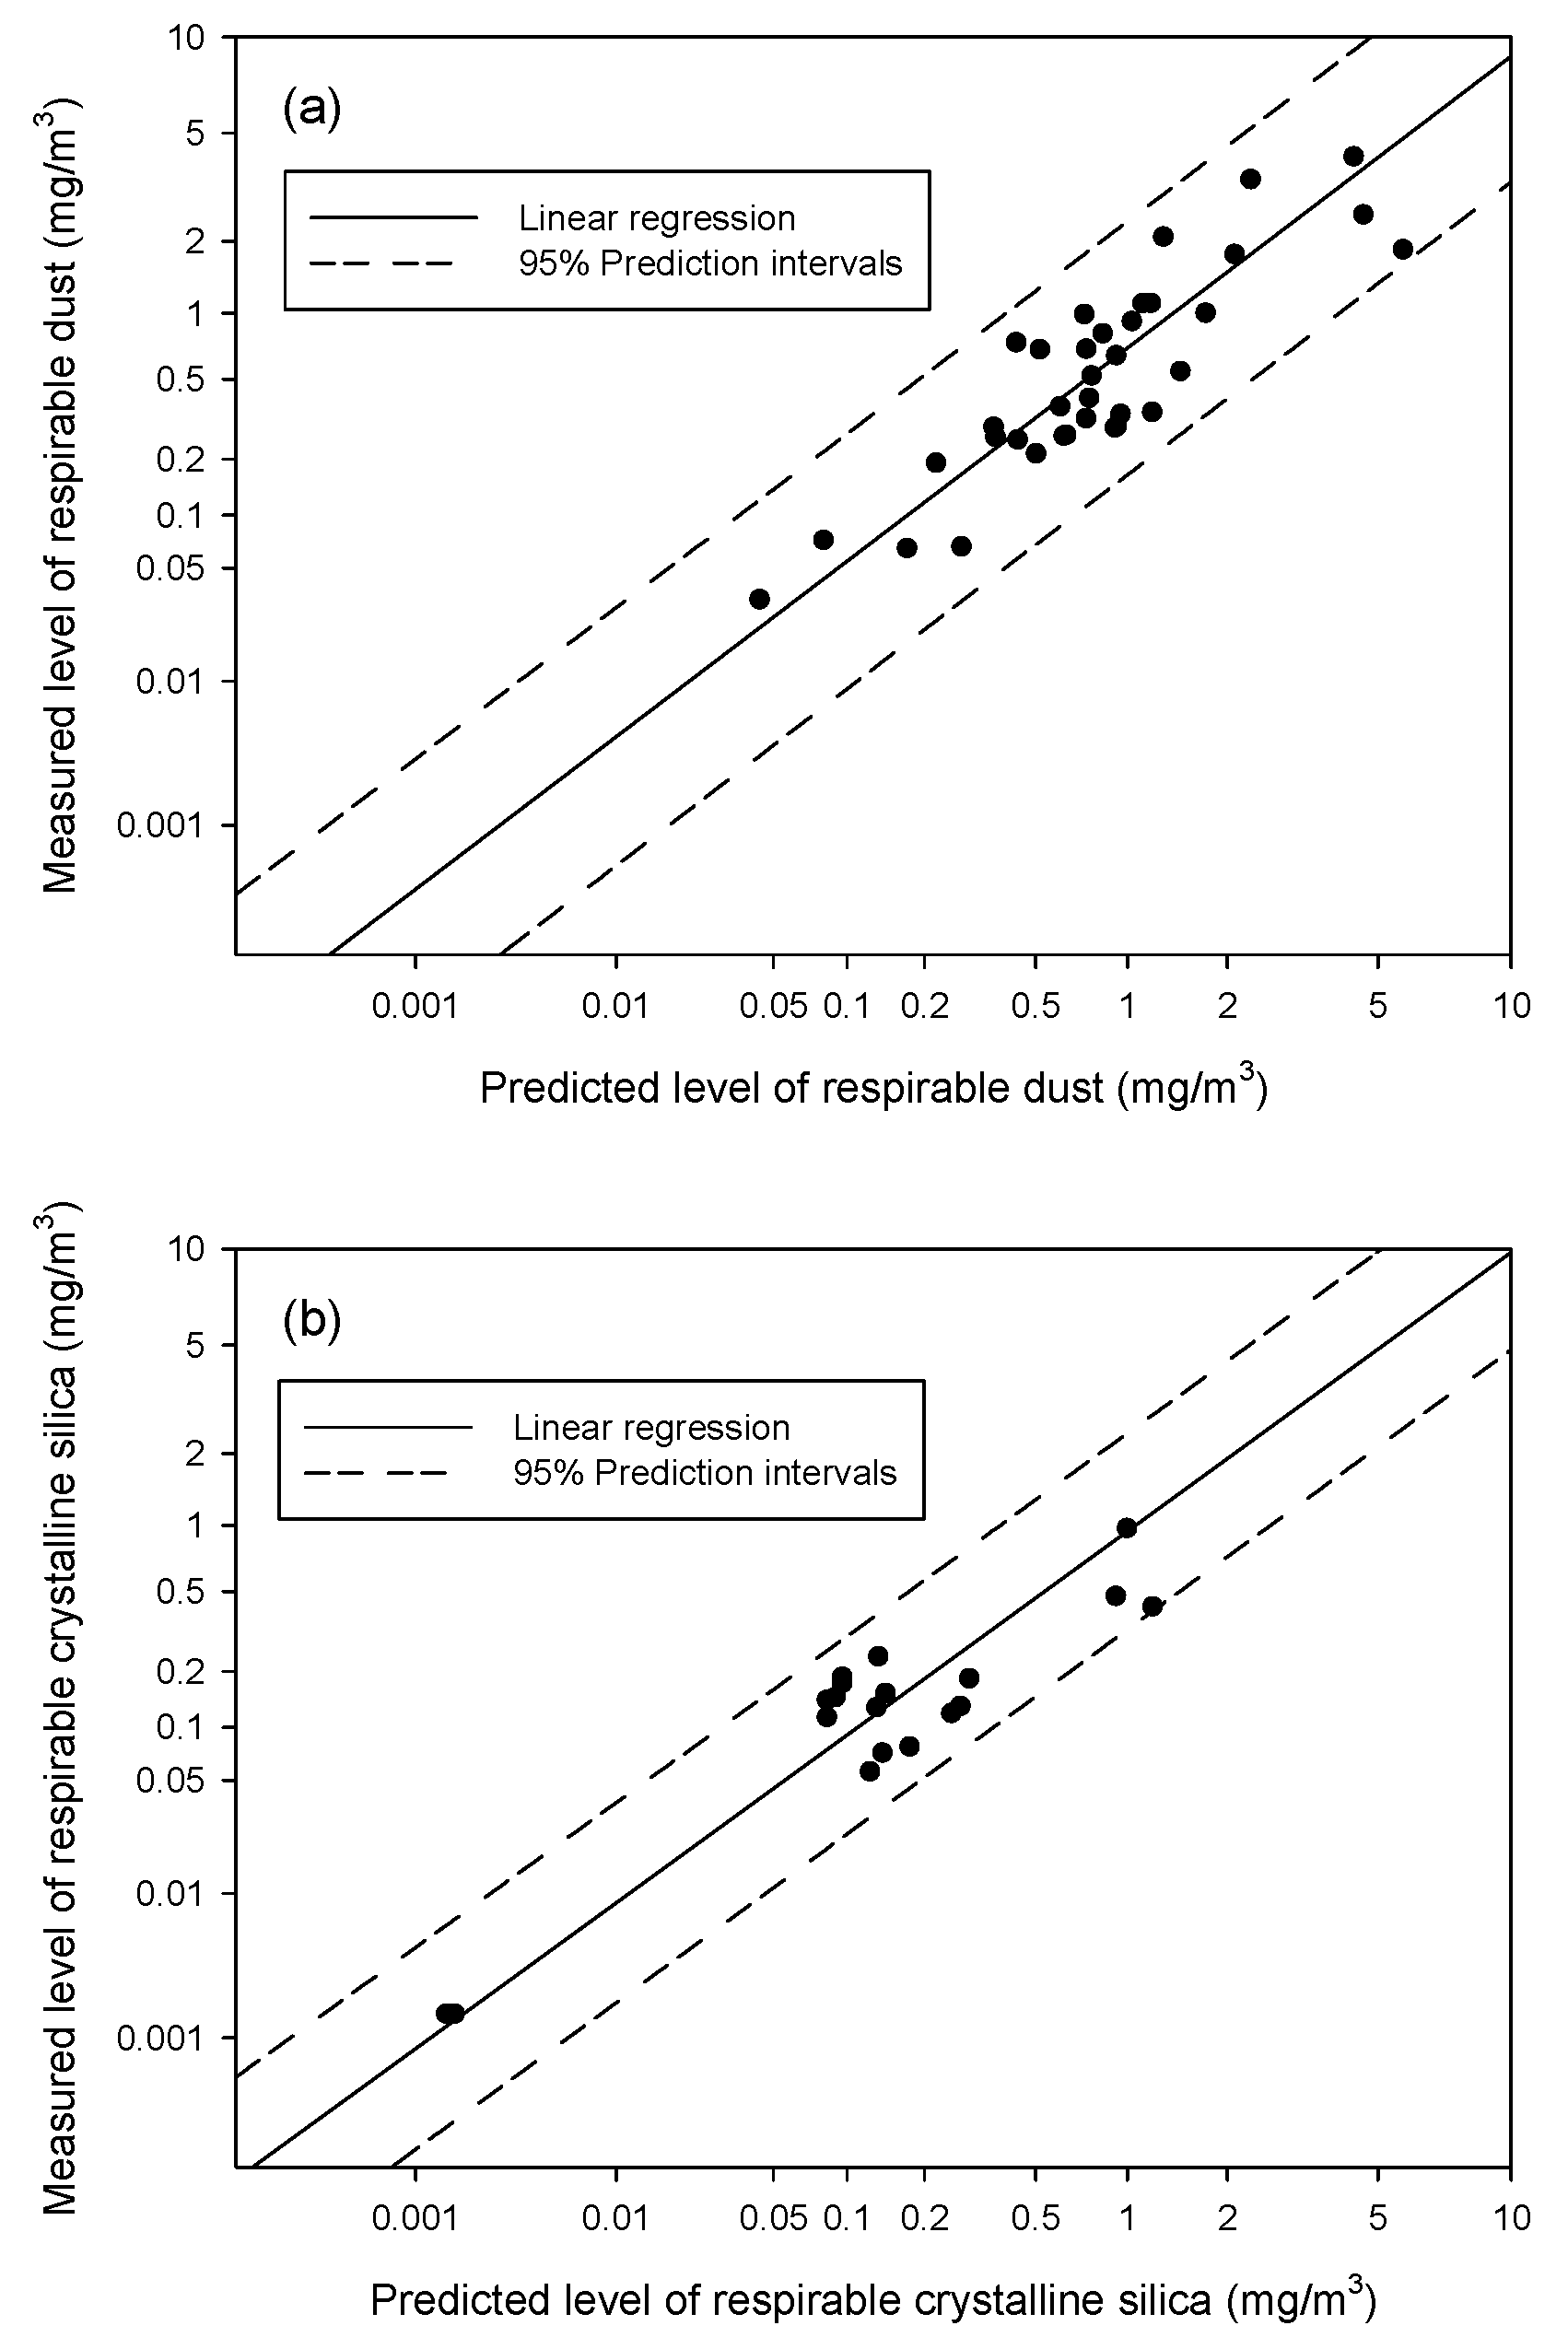
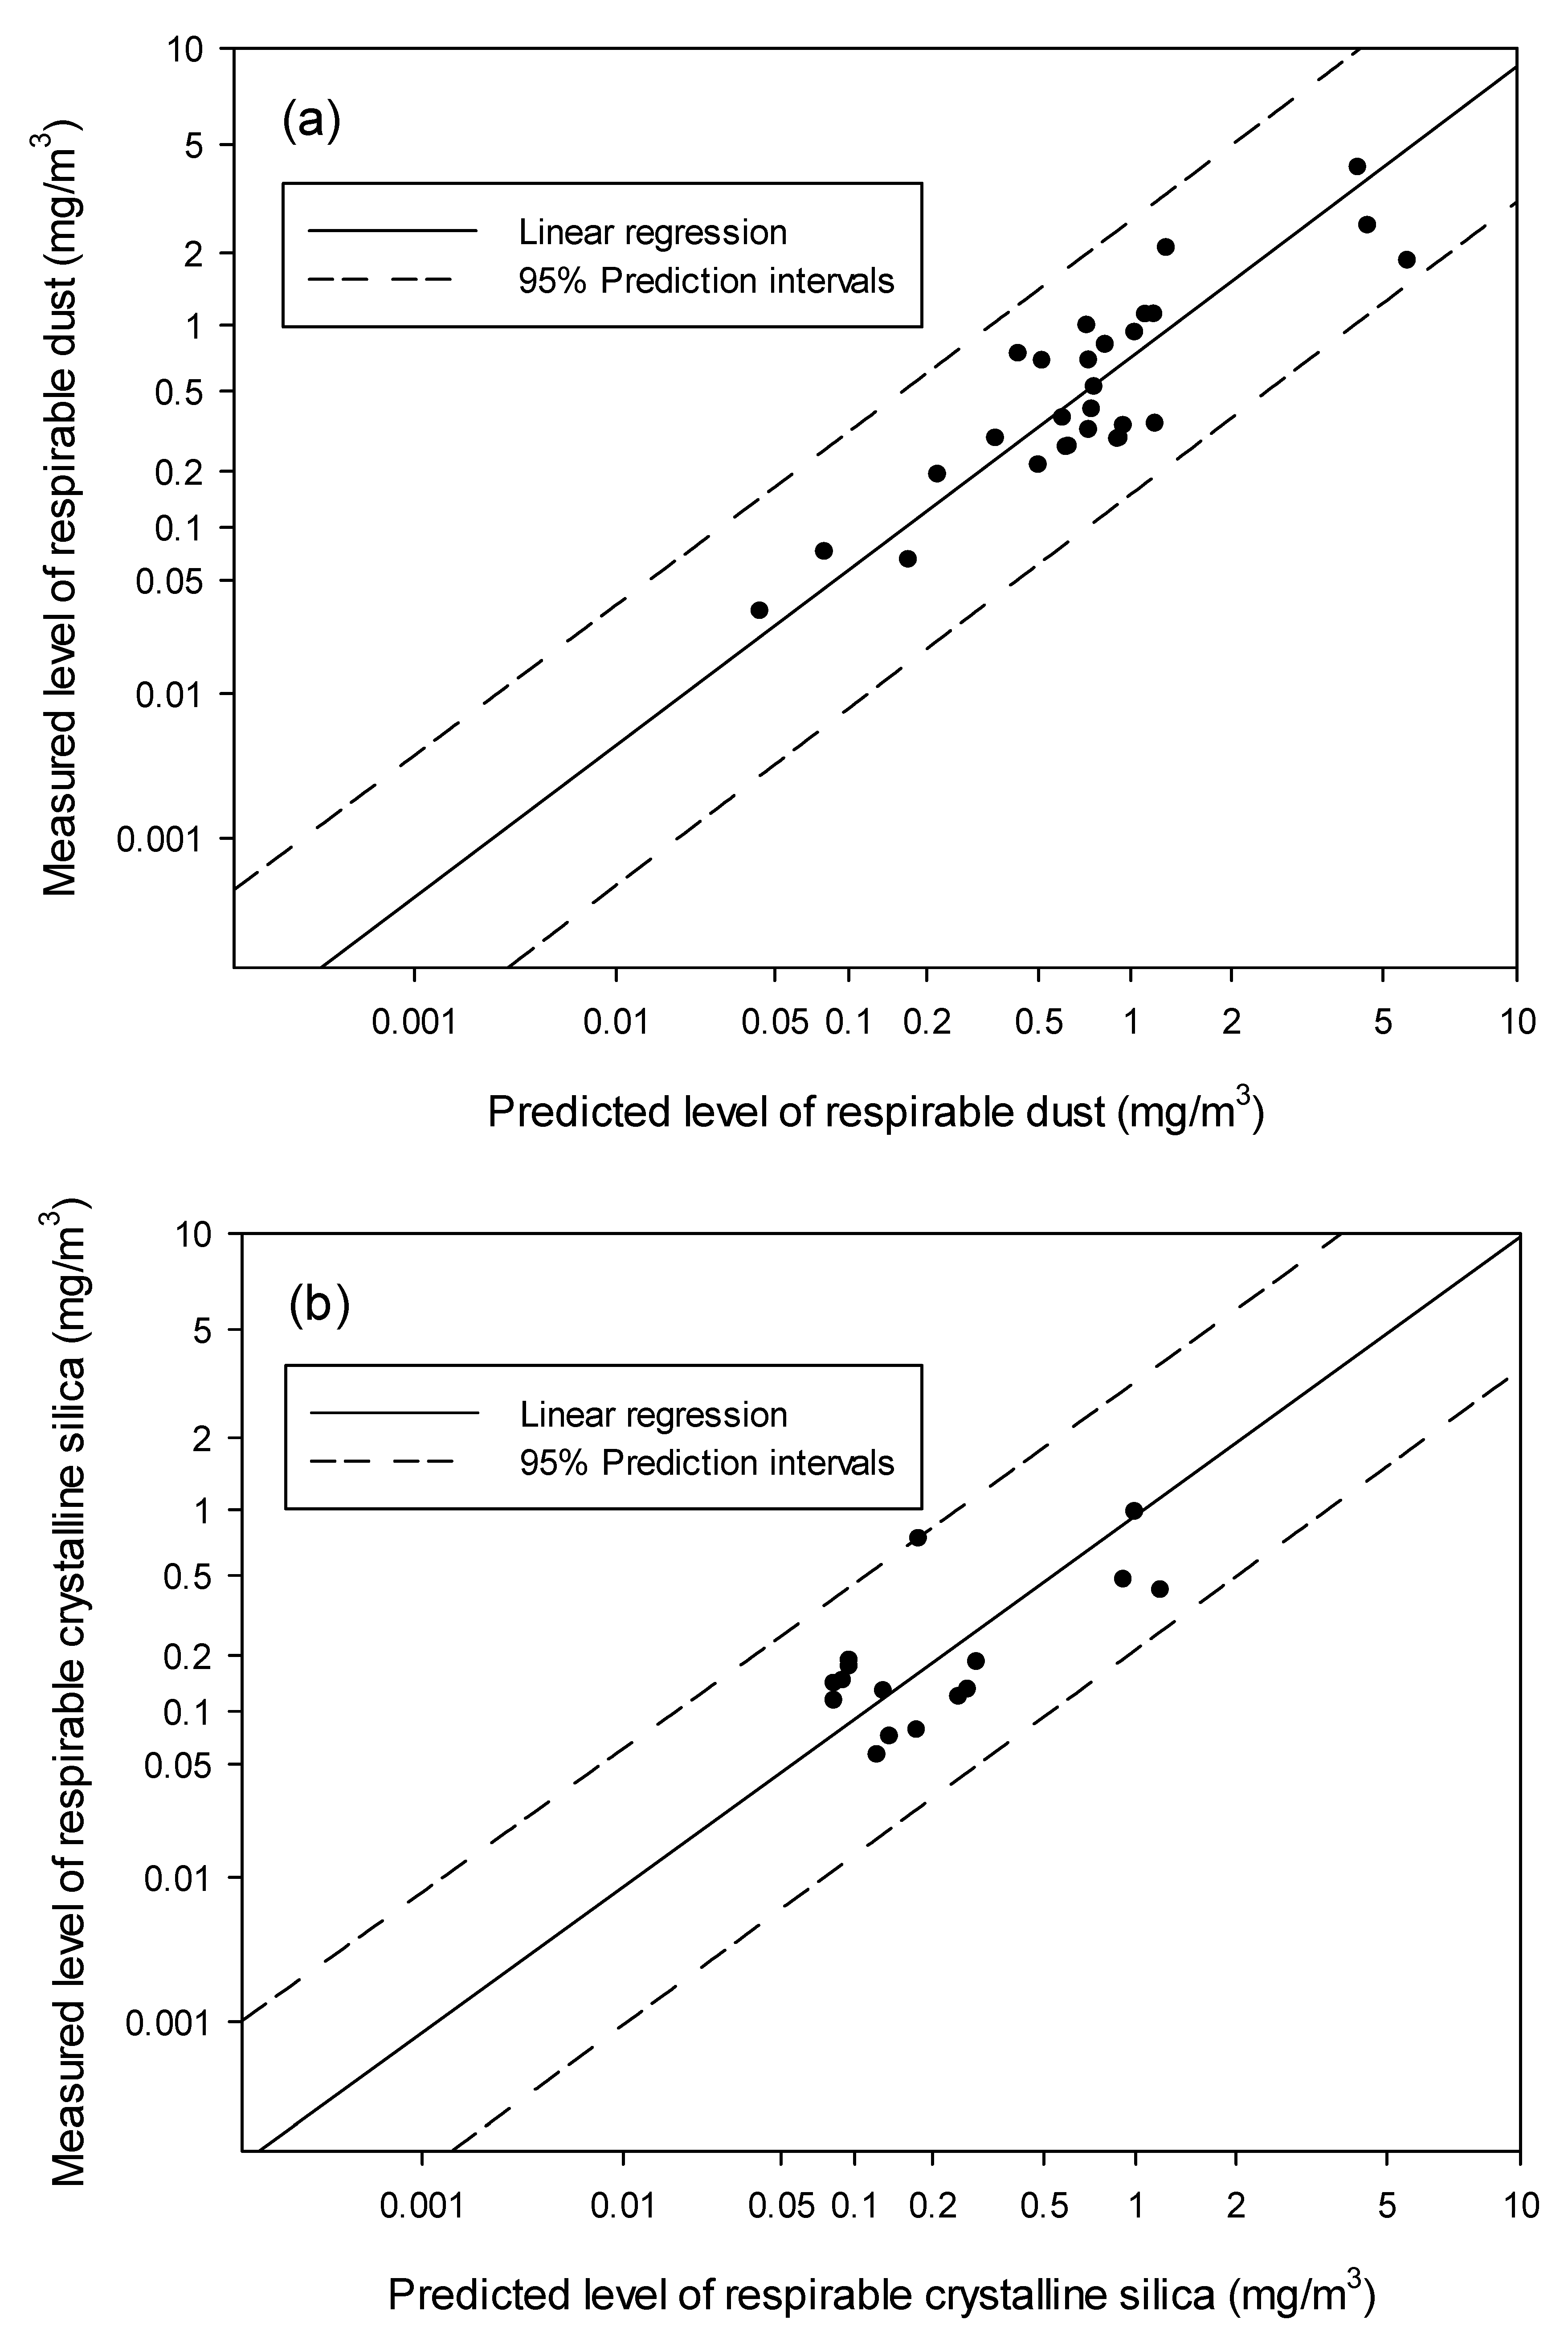
Finally, the measured respiratory dust and RCS data from Factory D was used to test the validity of the predictive model established using the data from three factories. We applied the following Equation [
35]:
to calculate model accuracy using the sum of the square of the mean difference between the predictive and measured values (bias) and the square of the standard deviation of the mean difference (precision).


