2.2.1. Computational Methods
The indicators and corresponding computational methods are described in
Table 2.
In
Table 2, the data for C
n was retrieved from the recycled WEEE database built by the Ministry of Environmental Protection (MEP), and were originally reported by the 109 authorized recyclers. We assume that all WEEE entering the authorized enterprises will be recycled instantly, with no stock remaining. The data for D
n and P
n were also taken from the MEP database mentioned above. More specifically, in order to obtain the data for D
n, the MEP will further check and review the data reported by the authorized recyclers (namely the data for C
n) and eliminate unreasonable parts. Therefore, the values of D
n were generally less than those of C
n. However, under the guidance of the WEEE treatment fund, the authorized recyclers were more familiar with the standardized operation, which led to the situation in which the gap between C
n and D
n narrowed gradually. The data for f
i and
, which were used to estimate the recovered resources, were collected based on the practices of several authorized enterprises, including TES-AMM (Guangzhou) Co., Ltd. and Li Tong Group (LTG) in Guangdong Province (see
supplementary files Tables S1 and S2) . The resources recovered from five categories of WEEE generally include iron and its alloys, copper and its alloys, aluminum and its alloys, nickel, gold, glass, plastic. Only the total quantity of WEEE (Q
n′) and the environmental impact need to be calculated separately.
2.2.2. Estimation of Total Quantity of WEEE
The total quantity of WEEE is the sum of the stock in society and the theoretical estimation of WEEE. As the WEEE treatment fund was implemented in 2012, the collection and recycling activities under the framework of the fund were absent before 2012. As a result, we set 2012 as the initial year and the total quantity of WEEE in 2012 is the sum of the stock in society in 2012 and the theoretical estimation of WEEE in 2012. However, the stock in society in 2013–2015 is equal to the total quantity of WEEE in the previous year minus the collected quantity in the previous year. The equation is as follows:
where Q
n′ is the total quantity of WEEE; St
0 is the WEEE stock in society in 2012; Q
n is the theoretical estimation of WEEE; and C
n−1 is the collected quantity. As a matter of fact, it is very difficult to obtain the data for WEEE stocks in society. However, because the key factor to the effectiveness assessment of the WEEE treatment fund is the change of the collection rate, St
0 can be assumed to be 0. And the data for the theoretical WEEE estimation (Q
n) can be calculated using Equation (2).
The theoretical estimation of WEEE refers to the quantities of WEEE that are no longer suitable or able to be used for various reasons. The estimation methods can be divided into three categories, including (1) methods based on the product’s characteristics (here, mainly the lifetime); (2) methods based on the law of the conservation of matter; and (3) methods based on mathematical modeling [
18,
19,
20,
21,
22,
23,
24,
25]. According to the analysis of the characteristics of various estimation methods, such as data requirements, advantages and disadvantages, limitations and source of errors, the “market supply A” method [
19] was selected (Equation (2)).
where S
i is the sale of EEE in year
n-i; p
i is the lifespan distribution of EEE;
i is the lifespan of EEE; and
n is a given year.
Using the assumptions about the lifespan of EEE proposed by several experts [
26,
27,
28,
29,
30,
31], the lifespans of the TV set, refrigerator, washing machine, air-conditioner, and personal computer were identified as 8–10 years, 8–12 years, 8–12 years, 7–11 years, and 2–6 years, respectively. Then we determined the lifespan distribution of five categories of WEEE, which was supposed to obey the normal distribution (see
supplementary files Table S3).
Since the statistical data for the sales of EEE were not available, they should be estimated using Equation (3).
where P
i, I
i, and E
i are the production, import, and export of EEE in year
n-i, respectively;
i is the lifespan of EEE. These data were taken from the China Statistical Yearbook and China Customs Statistical Yearbook. Because of the differences in their lifespans, the data for the sales of five categories of EEE were from different years. The sales of EEE and the theoretical estimation of WEEE are presented in
supplementary files Tables S4 and S5 respectively.
2.2.3. Estimation of the Environmental Impact
• Goal and scope
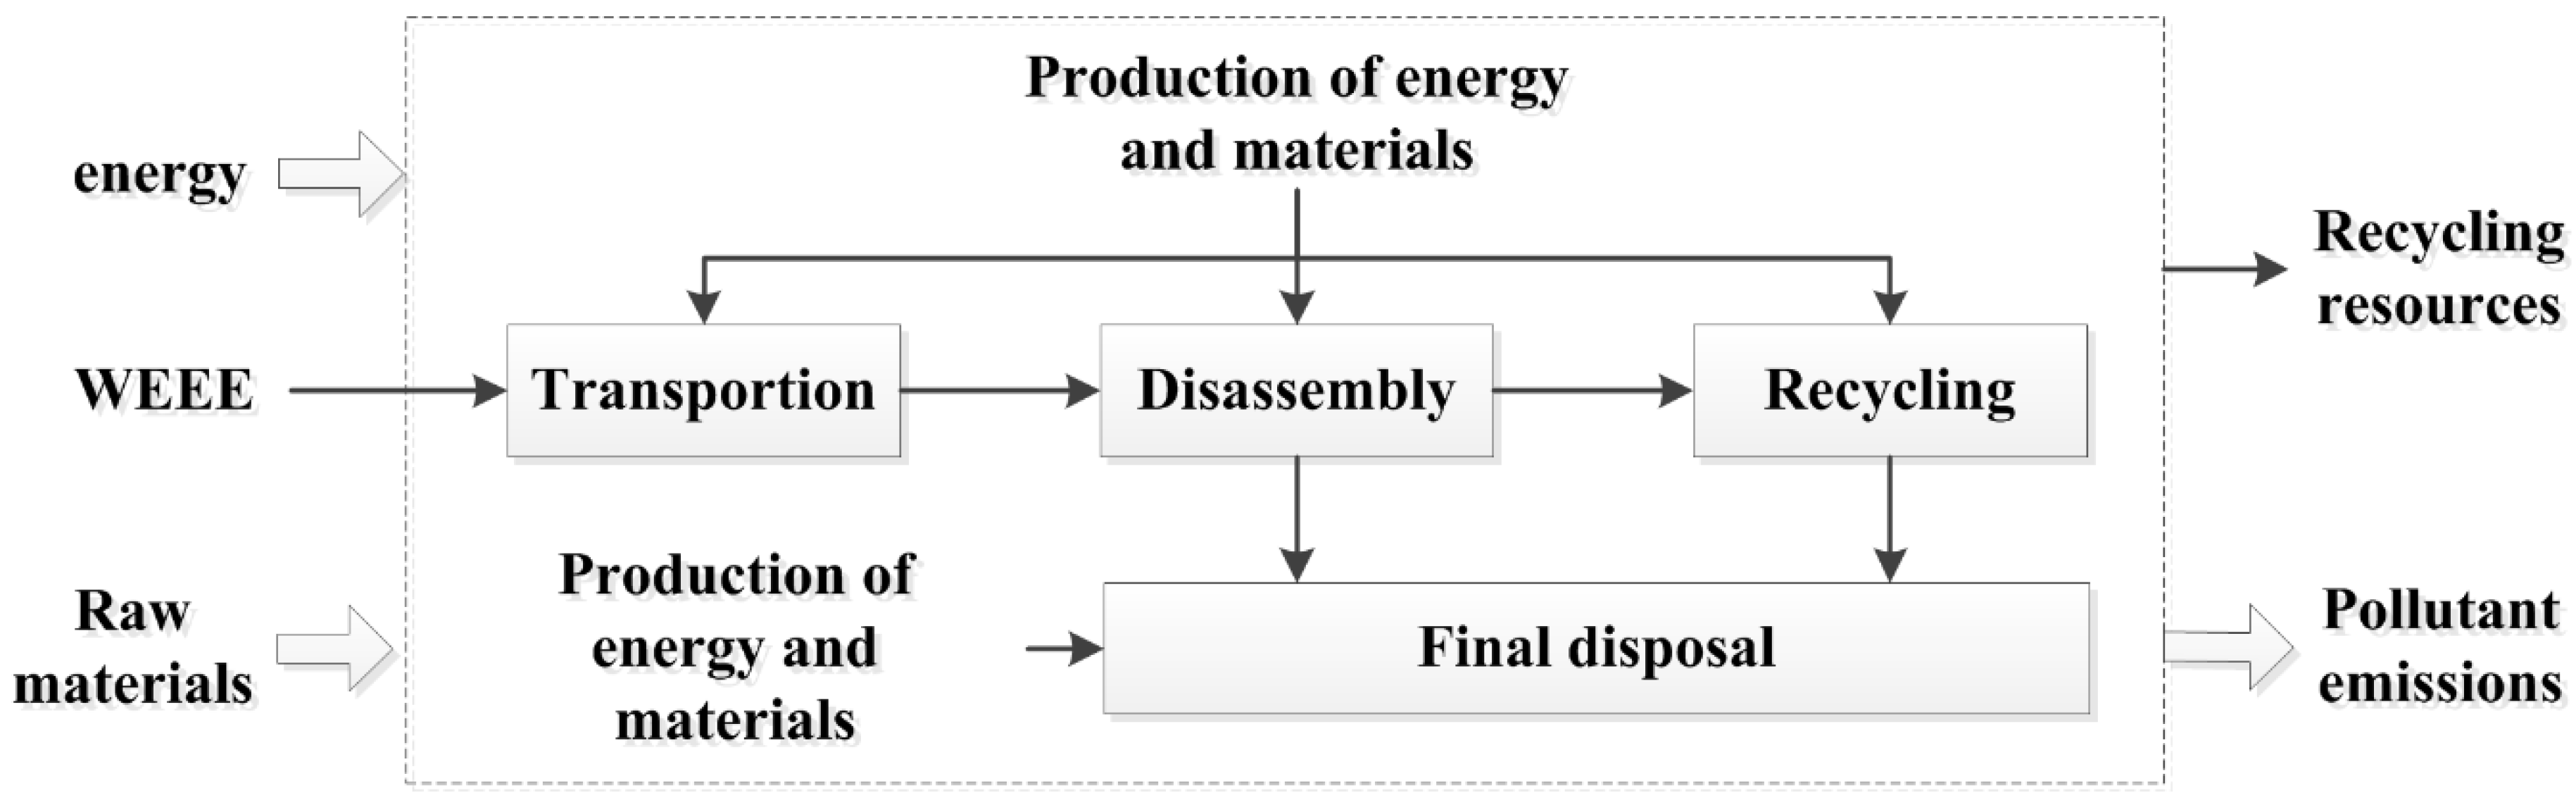
With the support of LCA, the goal of this research was to learn about the environmental performance of the collection and recycling activities carried out by the authorized and informal recyclers. The system boundary is represented in
Figure 1. Due to the diversification of the collection approaches, along with the complexity of the collectors [
1], only the transportation between the WEEE owners and the WEEE recyclers was included in the system boundary (with respect to the collection stage). Since we were limited by the data available, the following processes were also excluded from the system boundary: the transportation of WEEE in recycling processes, the transportation of solid wastes after recycling, and the related infrastructure construction and maintenance. The functional unit was defined as one unit of one kind of WEEE that contained TV set, refrigerator, washing machine, air-conditioner, or personal computer.
• Life cycle inventory (LCI)
Both the input and output data are required for the LCI. For this research, the input data contained both the direct and indirect energy consumption and material consumption in the recycling processes. The output data contained the products of recycling and the direct pollution emitted to the atmosphere, water, and soil from the recycling processes, as well as the indirect emissions from the production of the energy and materials consumed in the recycling processes.
The process data of several representative authorized enterprises were synthesized to meet the data requirements of LCI. The data sources are described in detail in
Table 3 and the recycling process data can be found in
supplementary files Tables S6–S9. We compared our results with the results of the technology investigation carried out by the China Household Electric Appliance Research Institute (CHEARI) [
32] and confirmed that the depth of processing, technology, and treatment method of the controlled components in the above-mentioned authorized enterprises that provided the basic data were consistent with those of most domestic authorized enterprises. In summary, the data adopted in this research were representative of the WEEE recycling industry. Besides, since the data were derived from the environmental impact reports or technical evaluation reports of typical authorized recycling, they were deemed to be credible in regards to reflecting the level of technology of the authorized enterprises.
In contrast, it is difficult to collect the data about the informal recyclers due to the lack of governance. To this end, the following assumptions [
11] were made in consideration of the recycling processes of the authorized enterprises and the actual situations in informal sectors. First, it was assumed that the recycling processes of the informal recyclers were the same as those of the authorized enterprises, but some relevant equipment was removed. Second, it was assumed that the recovery rates of the informal recyclers were equal to those of the authorized enterprises. Third, it was assumed that all kinds of pollutants generated in the collection and recycling activities in informal channels were emitted into the environment directly without any treatment. Based on these hypotheses, the modified data of the authorized enterprises were used to simulate the conditions of the informal recyclers.
Furthermore, due to the emergence of urban agglomerations, the surrounding informal recyclers also developed rapidly to meet the growing demand for WEEE collection and recycling activities [
10,
37,
38,
39,
40]. For this reason, some WEEE was recycled by the informal recyclers near the urban agglomeration. Therefore, the distances between the gathering places of the informal recyclers and the major cities nearby in the corresponding urban agglomeration, such as the Yangtze River Delta urban agglomeration, Pearl River Delta urban agglomeration, and Beijing-Tianjin-Hebei agglomeration, were collected with the help of Google Maps. We found that most of the informal recyclers were at a distance of 400–600 km from the cities, while the average distance between consumers and authorized enterprises was 500 km (based on a field investigation). To highlight the differences in the environmental performance of the recycling activities in the back-end stage between the authorized and informal recyclers, the average distance between the consumers and the informal recyclers was also identified as 500 km.
After the data collection, we built the LCI models of five categories of WEEE in Simapro (V8.2). We obtained the life cycle inventories, which consisted of the energy consumption (typically referring to the energy consumption of transportation and power consumption of equipment), material consumption, and the pollutant emissions to the atmosphere, water, and soil. Due to the large quantity of data, it was not possible (or necessary) to list the data individually.
The results of Life cycle impact assessment (LCIA) were calculated at the endpoint level using the ReCiPe (v1.04) method. In order to eliminate the barriers of method selection in LCIA, ReCiPe, which integrates the existing midpoint approach and endpoint approach, was created on the basis of the Eco-indicator99 method and CML2001 method [
41,
42,
43]. At the midpoint level, 18 impact categories related to different environmental issues are addressed with associated sets of characterization factors. At the endpoint level, the impact categories mentioned above are converted and aggregated into three endpoint categories further, which consists of damage to human health, ecosystem diversity and resource availability. Weighting factors are also provided for these damage categories, and a single score can be obtained by aggregating the weighting results. We chose this method because it takes into consideration a broad set of impact categories so that the environmental impact can be fully realized. Moreover, the Eco-indicator99 method and CML2001 method have both been widely applied in LCA analysis [
44].


