Acknowledgments
This work was supported by National Key R&D Program of China (2016YFC0401601, 2017YFC0804607), National Natural Science Foundation of China (Grant Nos. 51739003, 51479054, 51779086, 51579086, 51379068, 51579083, 51579085, 51609074), Project Funded by the Priority Academic Program Development of Jiangsu Higher Education Institutions ( YS11001), Jiangsu Natural Science Foundation (Grant No. BK20160872), Special Project Funded of National Key Laboratory(20145027612, 20165042112), Key R&D Program of Guangxi (AB17195074), Central University Basic Research Project (2017B11114), the Fundamental Research Funds for the Central Universities (Grant No. 2017B617X14), Postgraduate Research & Practice Innovation Program of Jiangsu Province (Grant Nos. KYCX17_0424, KYZZ16_0283).
Figure 1.
Statistics of dam types of the world (excluding China) and China.
Figure 1.
Statistics of dam types of the world (excluding China) and China.
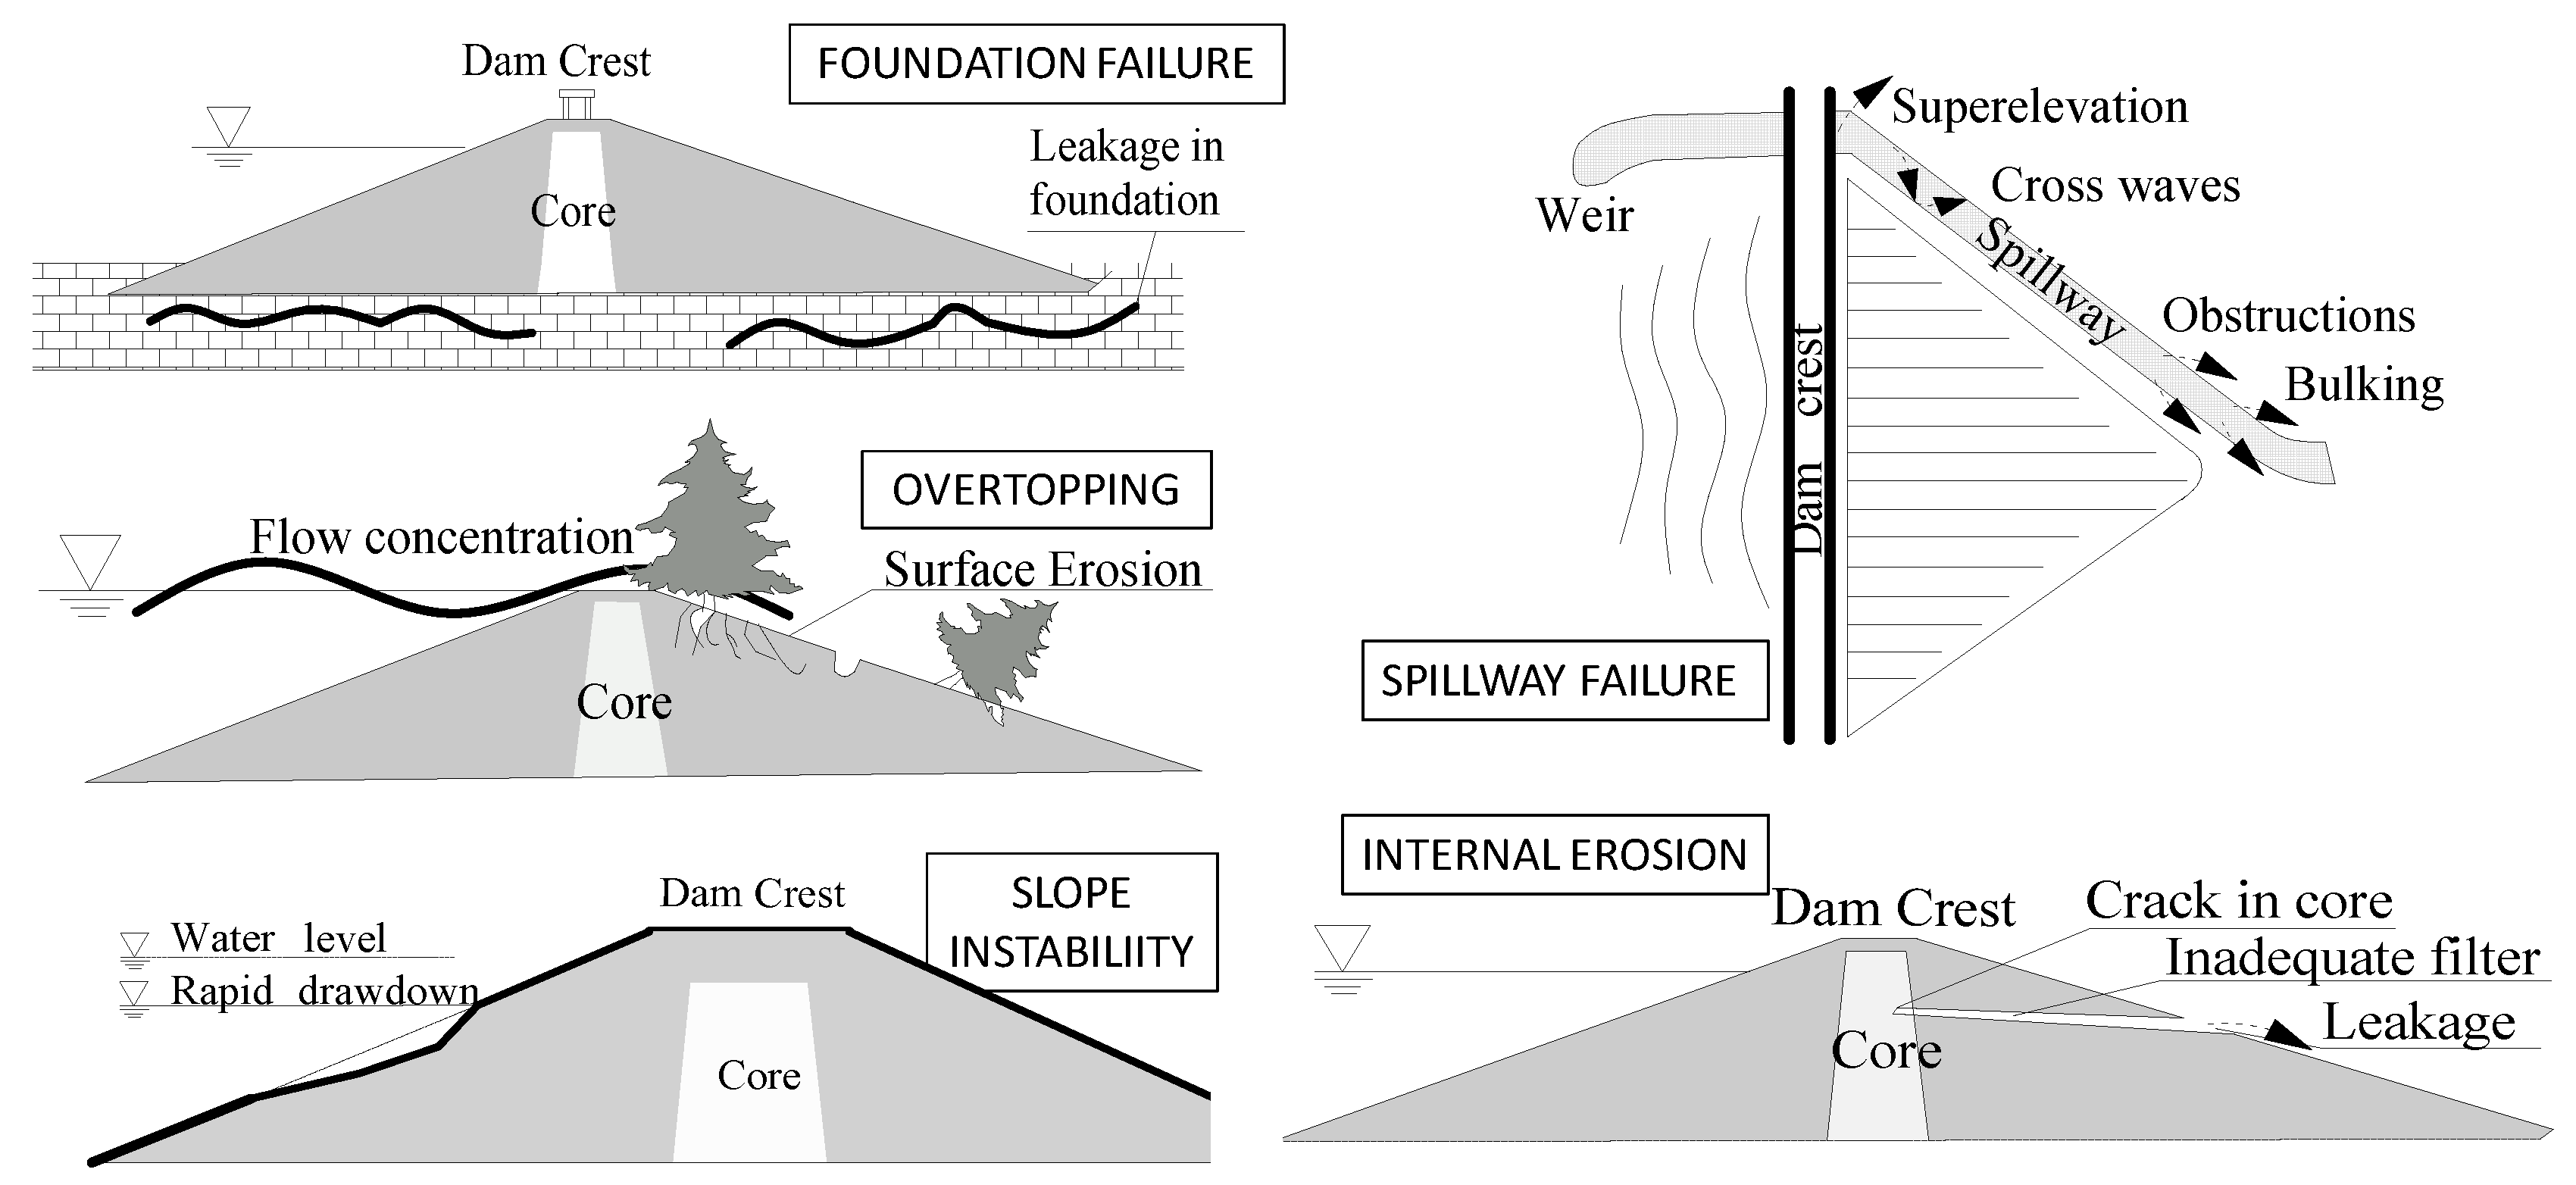
Figure 2.
Several failure modes of earth-rock dams.
Figure 2.
Several failure modes of earth-rock dams.
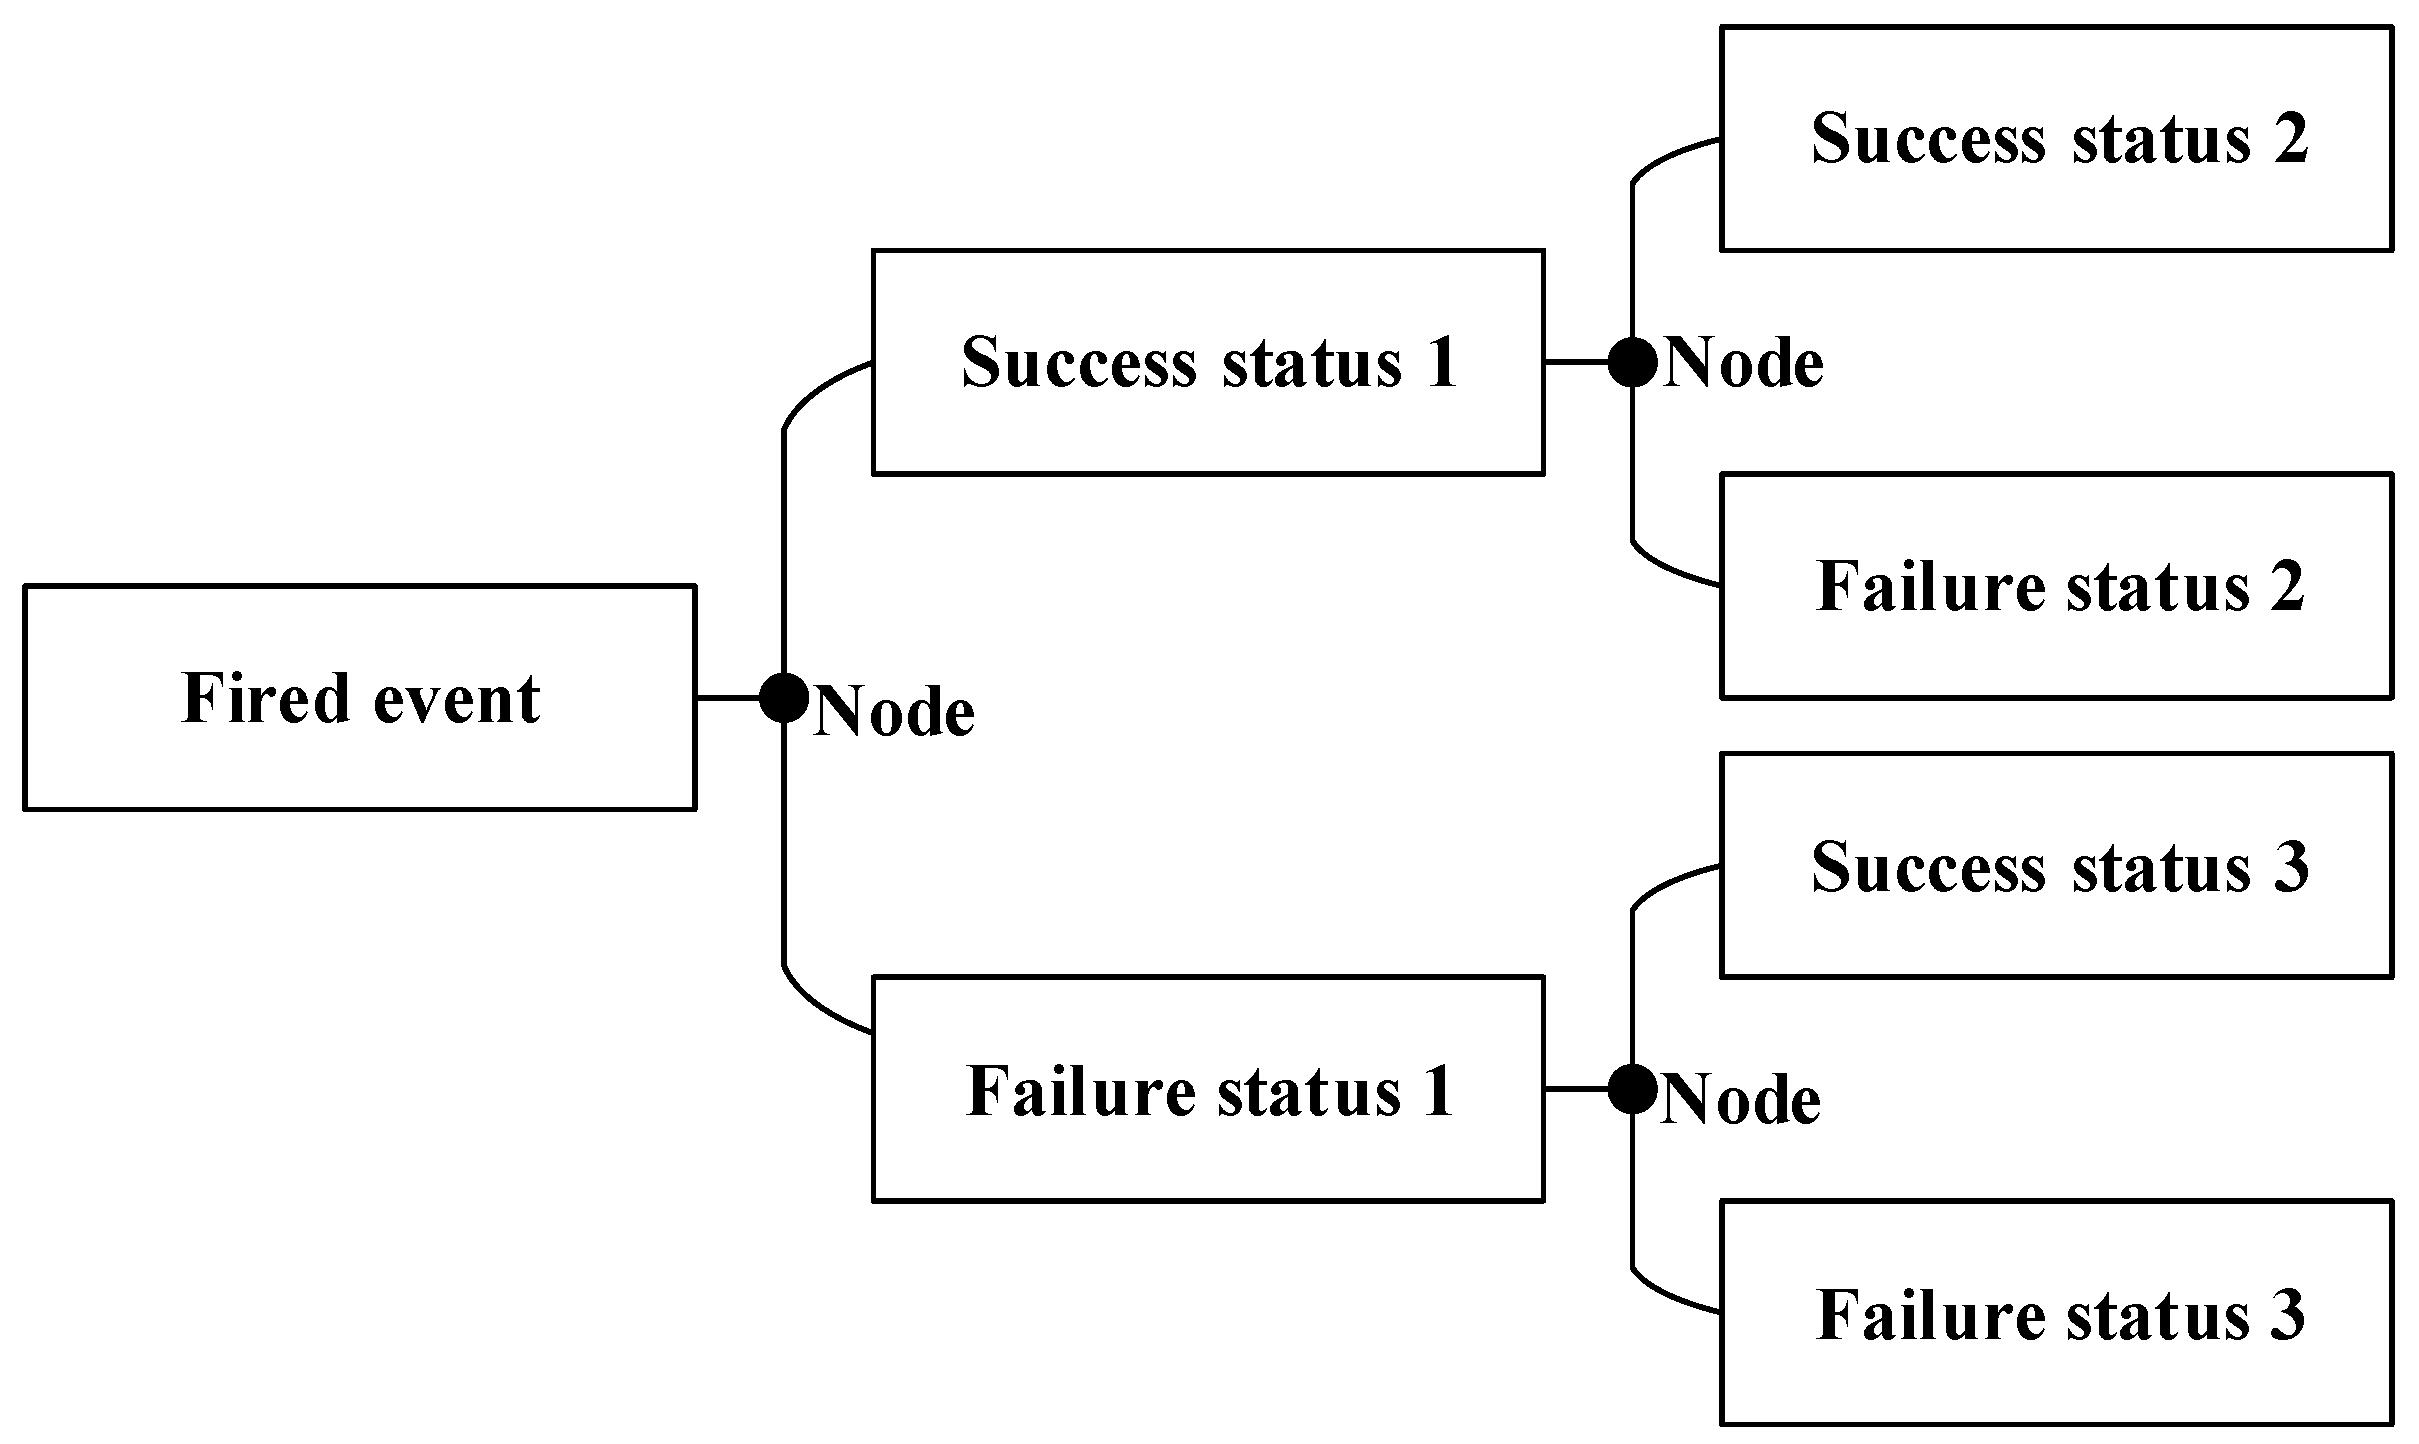
Figure 3.
Event tree analysis of dam failure.
Figure 3.
Event tree analysis of dam failure.
Figure 4.
Membership function of fuzzy language.
Figure 4.
Membership function of fuzzy language.
Figure 5.
Layout plan of the reservoir project.
Figure 5.
Layout plan of the reservoir project.
Figure 6.
Typical cross-section structure dimensions of the dam.
Figure 6.
Typical cross-section structure dimensions of the dam.
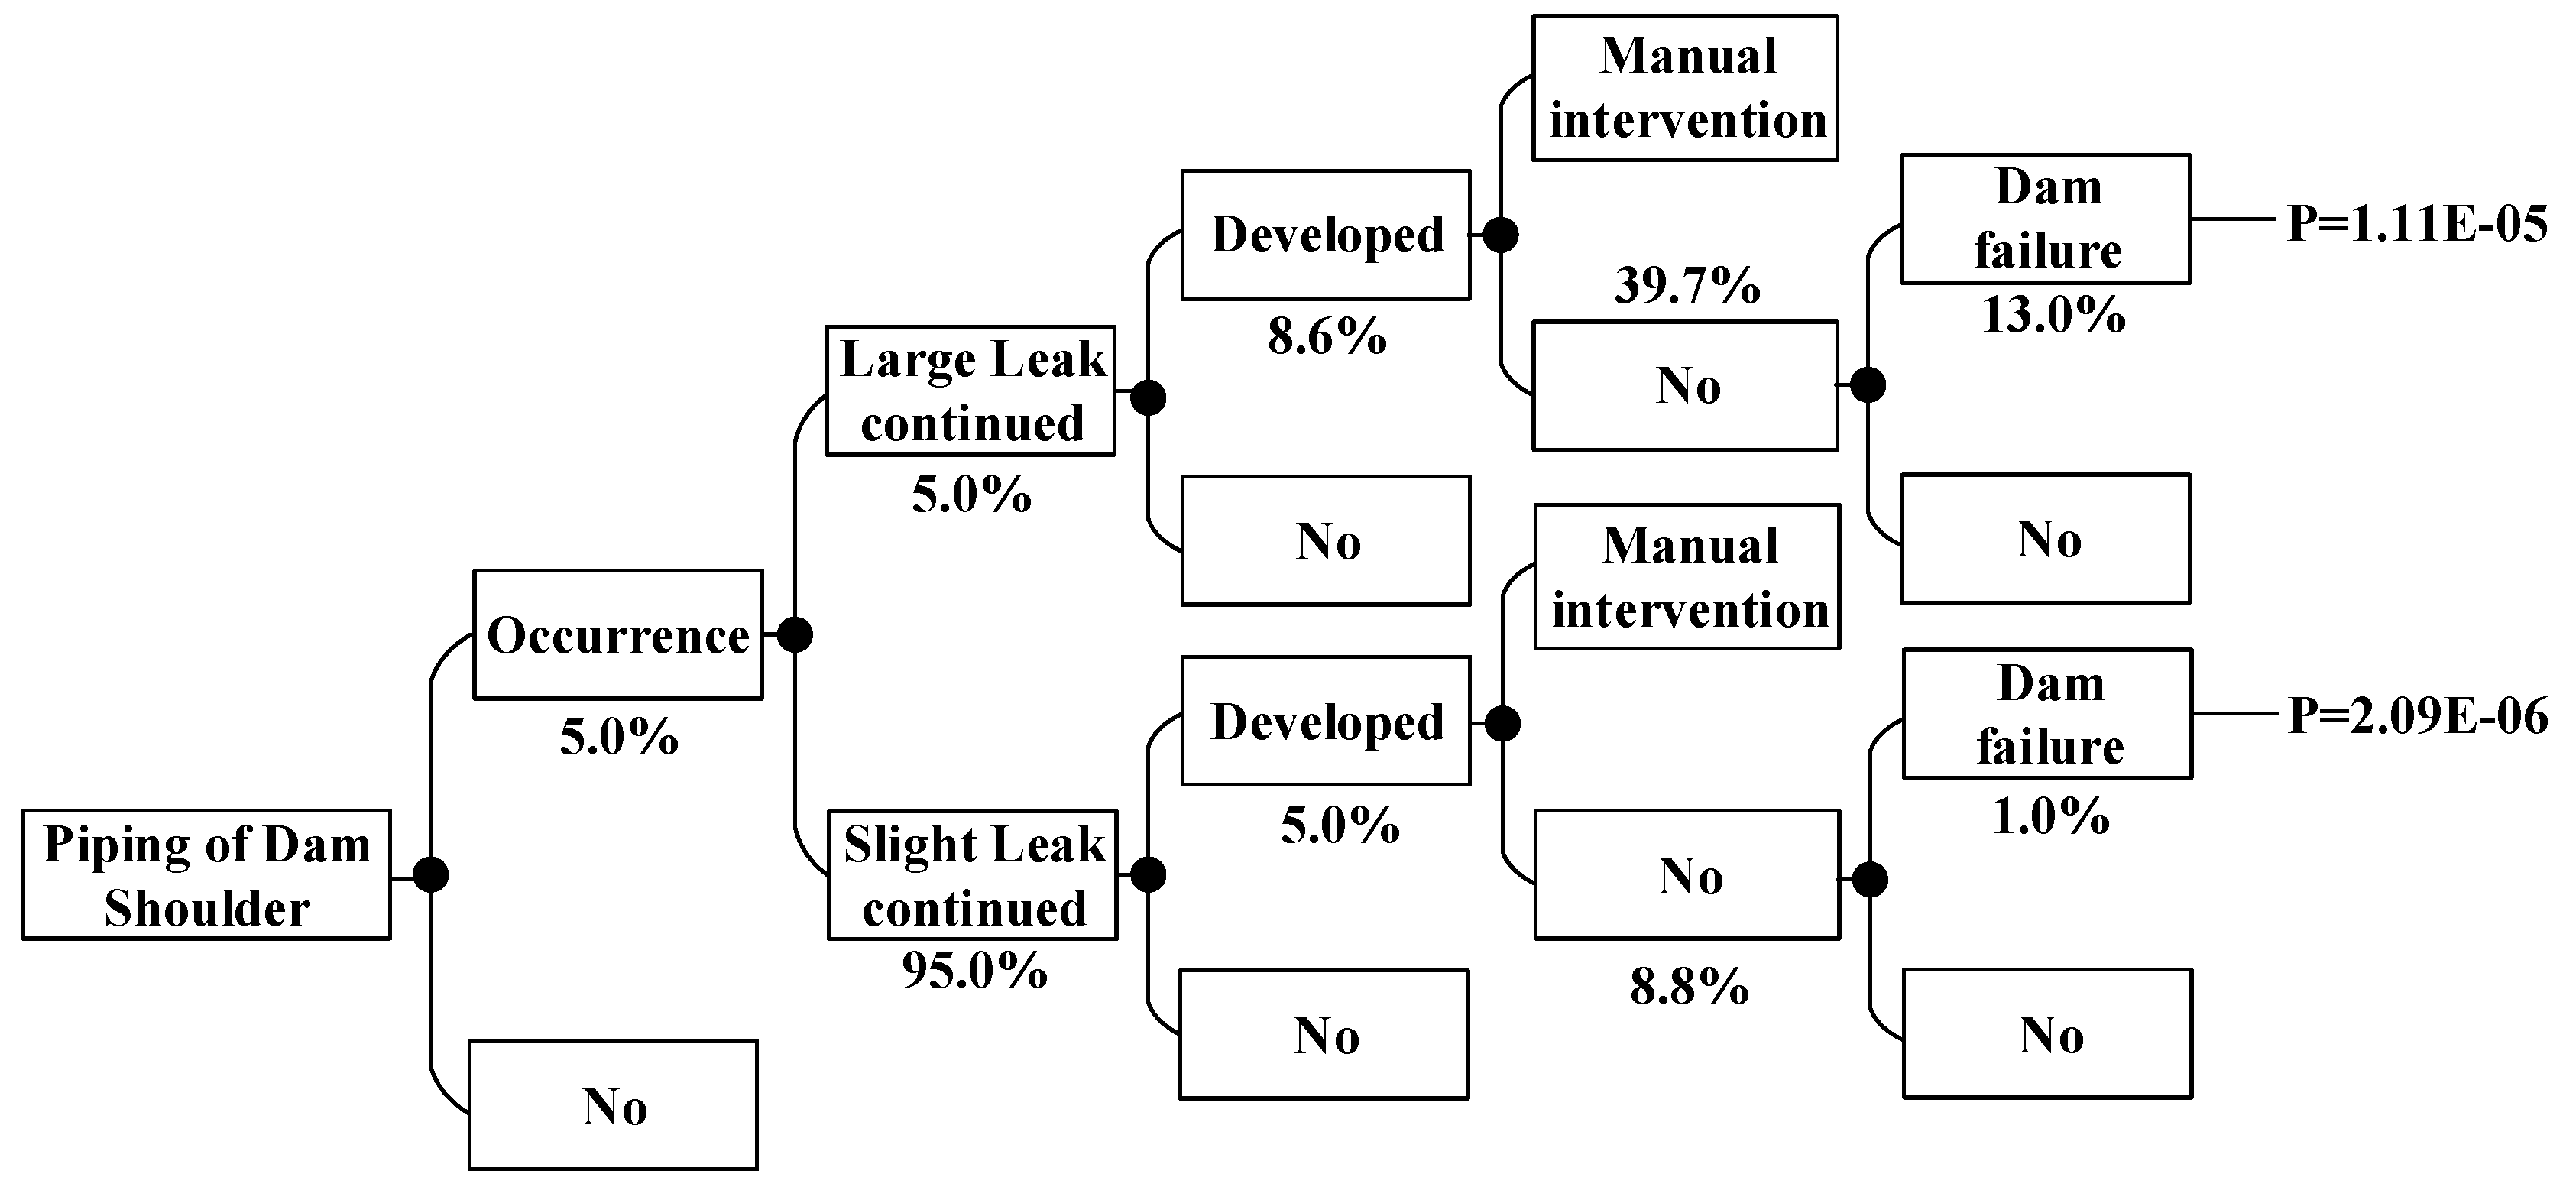
Figure 7.
Piping of auxiliary dam shoulder event tree in the flood season.
Figure 7.
Piping of auxiliary dam shoulder event tree in the flood season.
Figure 8.
Piping of main dam foundation event tree in the non-flood season.
Figure 8.
Piping of main dam foundation event tree in the non-flood season.
Figure 9.
Piping of auxiliary dam foundation event tree in the non-flood season.
Figure 9.
Piping of auxiliary dam foundation event tree in the non-flood season.
Figure 10.
Piping of auxiliary dam shoulder event tree in the non-flood season.
Figure 10.
Piping of auxiliary dam shoulder event tree in the non-flood season.
Figure 11.
Piping of main dam foundation event tree in the flood season.
Figure 11.
Piping of main dam foundation event tree in the flood season.
Figure 12.
Piping of auxiliary dam foundation event tree in the flood season.
Figure 12.
Piping of auxiliary dam foundation event tree in the flood season.
Figure 13.
Piping of auxiliary dam shoulder event tree in the flood season.
Figure 13.
Piping of auxiliary dam shoulder event tree in the flood season.
Figure 14.
Piping of sloping core event tree in the flood season.
Figure 14.
Piping of sloping core event tree in the flood season.
Figure 15.
Failure of spillway structure core event tree in the flood season.
Figure 15.
Failure of spillway structure core event tree in the flood season.
Table 1.
Several famous large dam failure events and deaths in the world.
Table 1.
Several famous large dam failure events and deaths in the world.
| Dam Name | Country | Year of Accident | Dam Type | Reservoir Volume (×106 m3) | Deaths |
|---|
| Mohne Dam | German | 1943 | Gravity dam | 134.0 | 1200 |
| Malpasset Dam | France | 1959 | Arch dam | 15.0 | 421 |
| Vaiont Dam | Italy | 1963 | Arch dam | 169.0 | 2000 |
| Buffalo Creek Dam | USA | 1972 | Tailings dam | 49.8 | 125 |
| Machhu II Dam | India | 1979 | Earth dam | 101.0 | 3000 |
| Shakidor Dam | Pakistan | 2005 | Earth-rock dam | - | 135 |
| Situ Gintung Dam | Indonesia | 2009 | Earth-rock dam | 2.0 | 100 |
Table 2.
Several large dam failure events and deaths in China.
Table 2.
Several large dam failure events and deaths in China.
| Dam Name | Location | Date | Dam Type | Reservoir Volume (106 m3) | Deaths |
|---|
| Longtun Dam | Suizhong, Liaoning province | 1959.7.22 | Clay sloping core dam | 30.0 | 707 |
| Liujiatai Dam | Yixian, Hebei province | 1963.8.8 | Clay core wall dam | 40.5 | 943 |
| Hengjiang Dam | Jiexi, Guangdong province | 1970.9.15 | Homogeneous earth dam | 78.8 | 941 |
| Lijiaju Dam | Zhuanglang, Gansu province | 1973.4.29 | Homogeneous earth dam | 1.1 | 580 |
| Banqiao Dam | Luoyang, Henan province | 1975.8.8 | Clay core wall dam | 492.0 | 22,564 |
| Shimantan Dam | Wugang, Henan province | 1975.8.8 | Homogeneous earth dam | 91.8 |
| Gouhou Dam | Gonghe, Qinghai province | 1993.8.27 | Concrete-faced rock-fill dam | 3.0 | 400 |
Table 3.
Fuzzy numbers and corresponding -cut sets of fuzzy language.
Table 3.
Fuzzy numbers and corresponding -cut sets of fuzzy language.
| Fuzzy Language | Fuzzy Number | -Cut Set |
|---|
| Extremely unlikely | | |
| Very unlikely | | |
| Less likely | | |
| Uncertain | | |
| Likely | | |
| Very likely | | |
| Extremely Likely | | |
Table 4.
Criteria for determining the credibility of an expert.
Table 4.
Criteria for determining the credibility of an expert.
| Aspects | Educational Degree | Professional Title |
| Doctor | Master | Bachelor | Senior | Medium-grade | Junior |
| Scoring range | [8,10] | [7,9] | [6,8] | [8,10] | [7,10] | [5,7] |
| Aspects | Professional direction | Length of service |
| Hydraulic structure engineering | Hydropower engineering | Civil Engineering | >20a | 10a~20a | <10a |
| Scoring range | [7,10] | [5,10] | [5,8] | [8,10] | [5,7] | [4,6] |
Table 5.
Risk mortality rate suitable for China f.
Table 5.
Risk mortality rate suitable for China f.
| SD | WT(h) | UD | f |
|---|
| Recommended Average | Recommended Range |
|---|
| High | <0.25 | Fuzzy | 0.7500 | 0.3000~1.0000 |
| Explicit | 0.2500 | 0.1000~0.5000 |
| 0.25~1.0 | Fuzzy | 0.2000 | 0.0500~0.4000 |
| Explicit | 0.0100 | 0.0050~0.0200 |
| >1.0 | Fuzzy | 0.1800 | 0.0100~0.3000 |
| Explicit | 0.0005 | 0.0000~0.0010 |
| Medium | <0.25 | Fuzzy | 0.5000 | 0.1000~0.8000 |
| Explicit | 0.0750 | 0.0200~0.1200 |
| 0.25~1.0 | Fuzzy | 0.1300 | 0.0150~0.2700 |
| Explicit | 0.0008 | 0.0005~0.0020 |
| >1.0 | Fuzzy | 0.0500 | 0.0100~0.1000 |
| Explicit | 0.0004 | 0.0002~0.0010 |
| Low | <0.25 | Fuzzy | 0.0300 | 0.0100~0.0500 |
| Explicit | 0.0100 | 0.0000~0.0200 |
| 0.25~1.0 | Fuzzy | 0.0070 | 0.0000~0.0150 |
| Explicit | 0.0006 | 0.0000~0.0010 |
| >1.0 | Fuzzy | 0.0003 | 0.0000~0.0006 |
| Explicit | 0.0002 | 0.0000~0.0004 |
Table 6.
Experts’ judgments of piping of auxiliary dam shoulder in the flood season.
Table 6.
Experts’ judgments of piping of auxiliary dam shoulder in the flood season.
| | E1 | E2 | E3 | E4 | E5 |
|---|
| D1 | Uncertain | Likely | Uncertain | Likely | Uncertain |
| D2 | Likely | Uncertain | Uncertain | Likely | Uncertain |
| D3 | Uncertain | Uncertain | Uncertain | Likely | Less likely |
| D4 | Likely | Uncertain | Likely | Uncertain | Uncertain |
| D5 | Likely | Likely | Very likely | Likely | Uncertain |
| D6 | Less likely | Uncertain | Uncertain | Less likely | Uncertain |
| D7 | Uncertain | Less likely | Less likely | Less likely | Less likely |
| D8 | Less likely | Very unlikely | Very unlikely | Very unlikely | Very unlikely |
Table 7.
Judgment matrix of experts.
Table 7.
Judgment matrix of experts.
| Experts | E1 | E2 | E3 | E4 | E5 | Weight Coefficient |
|---|
| E1 | 1 | 3 | 4 | 2 | 1/2 | 0.283 |
| E2 | 1/3 | 1 | 2 | 4 | 1/3 | 0.168 |
| E3 | 1/4 | 1/2 | 1 | 3 | 1/2 | 0.123 |
| E4 | 1/2 | 1/4 | 1/3 | 1 | 1/3 | 0.073 |
| E5 | 2 | 3 | 2 | 3 | 1 | 0.353 |
Table 8.
Probabilities of each accident of the auxiliary dam shoulder.
Table 8.
Probabilities of each accident of the auxiliary dam shoulder.
| Event | D1 | D2 | D3 | D4 | D5 | D6 | D7 | D8 |
|---|
| P | 0.536 | 0.553 | 0.458 | 0.561 | 0.616 | 0.447 | 0.392 | 0.295 |
| PL | 0.474 | 0.486 | 0.387 | 0.491 | 0.539 | 0.379 | 0.307 | 0.214 |
| PU | 0.598 | 0.621 | 0.529 | 0.631 | 0.692 | 0.514 | 0.478 | 0.377 |
Table 9.
Dam failure probabilities summary.
Table 9.
Dam failure probabilities summary.
| Load | Failure Mode and Parts | Frequency f | Failure Probability P | f × P | Percentage |
|---|
| non-flood season (220.00 m) | Piping of main dam foundation | 100% | 4.00 × 10⁻⁵ | 4.00 × 10⁻⁵ | 34.54% |
| Piping of auxiliary dam foundation | 100% | 1.88 × 10⁻⁵ | 1.88 × 10⁻⁵ | 16.23% |
| Piping of auxiliary dam shoulder | 100% | 1.32 × 10⁻⁵ | 1.32 × 10⁻⁵ | 11.40% |
| flood season (233.70 m) | Piping of main dam foundation | 0.02% | 6.38 × 10⁻² | 1.28 × 10⁻⁵ | 11.05% |
| Piping of auxiliary dam foundation | 0.02% | 5.93 × 10⁻² | 1.18 × 10⁻⁵ | 10.28% |
| Piping of auxiliary dam shoulder | 0.02% | 5.03 × 10⁻² | 1.01 × 10⁻⁵ | 8.72% |
| Piping of sloping core | 0.02% | 1.11 × 10⁻² | 2.21 × 10⁻⁶ | 1.91% |
| Failure of spillway structure | 0.02% | 3.40 × 10⁻² | 6.80 × 10⁻⁶ | 5.87% |
| Total | 1.16 × 10⁻⁴ |
Table 10.
PAR of the submerged area.
Table 10.
PAR of the submerged area.
| Administrative Region | Households | Population | PAR (Daytime) | PAR (Night) |
|---|
| Fujiang township | 1261 | 4727 | 2363 | 3782 |
| Nan’an town | 18,727 | 65,735 | 32,868 | 52,588 |
| Total | 19,988 | 70,462 | 35,232 | 56,370 |
Table 11.
Average D × V value and corresponding SD.
Table 11.
Average D × V value and corresponding SD.
| Administrative Region | D × V (m2/s) | SD |
|---|
| Fujiang township | 14.48 | High |
| Nan’an town | 11.26 | High |
Table 12.
Understanding of PAR to SD (UD).
Table 12.
Understanding of PAR to SD (UD).
| Warning Time | 0~0.25 h | 0.25~1.0 h | >1.0 h |
|---|
| Daytime | Fuzzy | Explicit | Explicit |
| Night | Fuzzy | Fuzzy | Explicit |
Table 13.
Corresponding correction coefficient .
Table 13.
Corresponding correction coefficient .
| Warning Time | 0~0.25 h | 0.25~1.0 h | >1.0 h |
|---|
| Daytime | 0.80 | 0.60 | 0.40 |
| Night | 0.80 | 0.65 | 0.50 |
Table 14.
Estimated dam failure loss of life when WT = 0~0.25 h.
Table 14.
Estimated dam failure loss of life when WT = 0~0.25 h.
| Administrative Region | Fujiang Township | Nan’an Town |
|---|
| DV (m2/s) | 14.48 | 11.26 |
| SD | High | High |
| WT | 0~0.25 h | 0~0.25 h |
| Daytime | PAR | 2363 | 32,868 |
| UD | Fuzzy | Fuzzy |
| F | 0.30 | 0.30 |
| 0.80 | 0.80 |
| LOL | 567 | 7888 |
| Night | PAR | 3782 | 52,588 |
| UD | Fuzzy | Fuzzy |
| F | 0.70 | 0.70 |
| 0.80 | 0.80 |
| LOL | 2118 | 29,449 |
Table 15.
Estimated dam failure loss of life when WT = 0.25~1.0 h.
Table 15.
Estimated dam failure loss of life when WT = 0.25~1.0 h.
| Administrative Region | Fujiang Township | Nan’an Town |
|---|
| DV(m2/s) | 14.48 | 11.26 |
| SD | High | High |
| WT | 0.25~1.0 h | 0.25~1.0 h |
| Daytime | PAR | 2363 | 32,868 |
| UD | Explicit | Explicit |
| f | 0.01 | 0.01 |
| 0.6 | 0.6 |
| LOL | 14 | 197 |
| Night | PAR | 3782 | 52,588 |
| UD | Fuzzy | Fuzzy |
| f | 0.2 | 0.2 |
| 0.65 | 0.65 |
| LOL | 492 | 6836 |
Table 16.
Estimated dam failure loss of life when WT > 1.0 h.
Table 16.
Estimated dam failure loss of life when WT > 1.0 h.
| Administrative Region | Fujiang Township | Nan’an Town |
|---|
| DV(m2/s) | 14.48 | 11.26 |
| SD | High | High |
| WT | >1.0 h | >1.0 h |
| Daytime | PAR | 2363 | 32,868 |
| UD | Explicit | Explicit |
| f | 0.001 | 0.001 |
| 0.4 | 0.4 |
| LOL | 1 | 13 |
| Night | PAR | 3782 | 52,588 |
| UD | Explicit | Explicit |
| f | 0.001 | 0.001 |
| 0.5 | 0.5 |
| LOL | 2 | 26 |
Table 17.
Estimated dam failure loss of life.
Table 17.
Estimated dam failure loss of life.
| 0~0.25 h | 0.25~1.0 h | >1.0 h |
|---|
| LOL | Daytime | 8455 | 211 | 14 |
| Night | 31,567 | 7328 | 28 |
Table 18.
Possible loss of life of the dam failure estimated.
Table 18.
Possible loss of life of the dam failure estimated.
| 0~0.25 h | 0.25~1.0 h | >1.0 h |
|---|
| LOL | Daytime | 9.79 × 10⁻¹ | 2.44 × 10⁻² | 1.62 × 10⁻³ |
| Night | 3.66 | 8.49 × 10⁻¹ | 3.24 × 10⁻³ |


