Application of Positive Matrix Factorization in the Identification of the Sources of PM2.5 in Taipei City

Abstract
:1. Introduction
2. Methodology
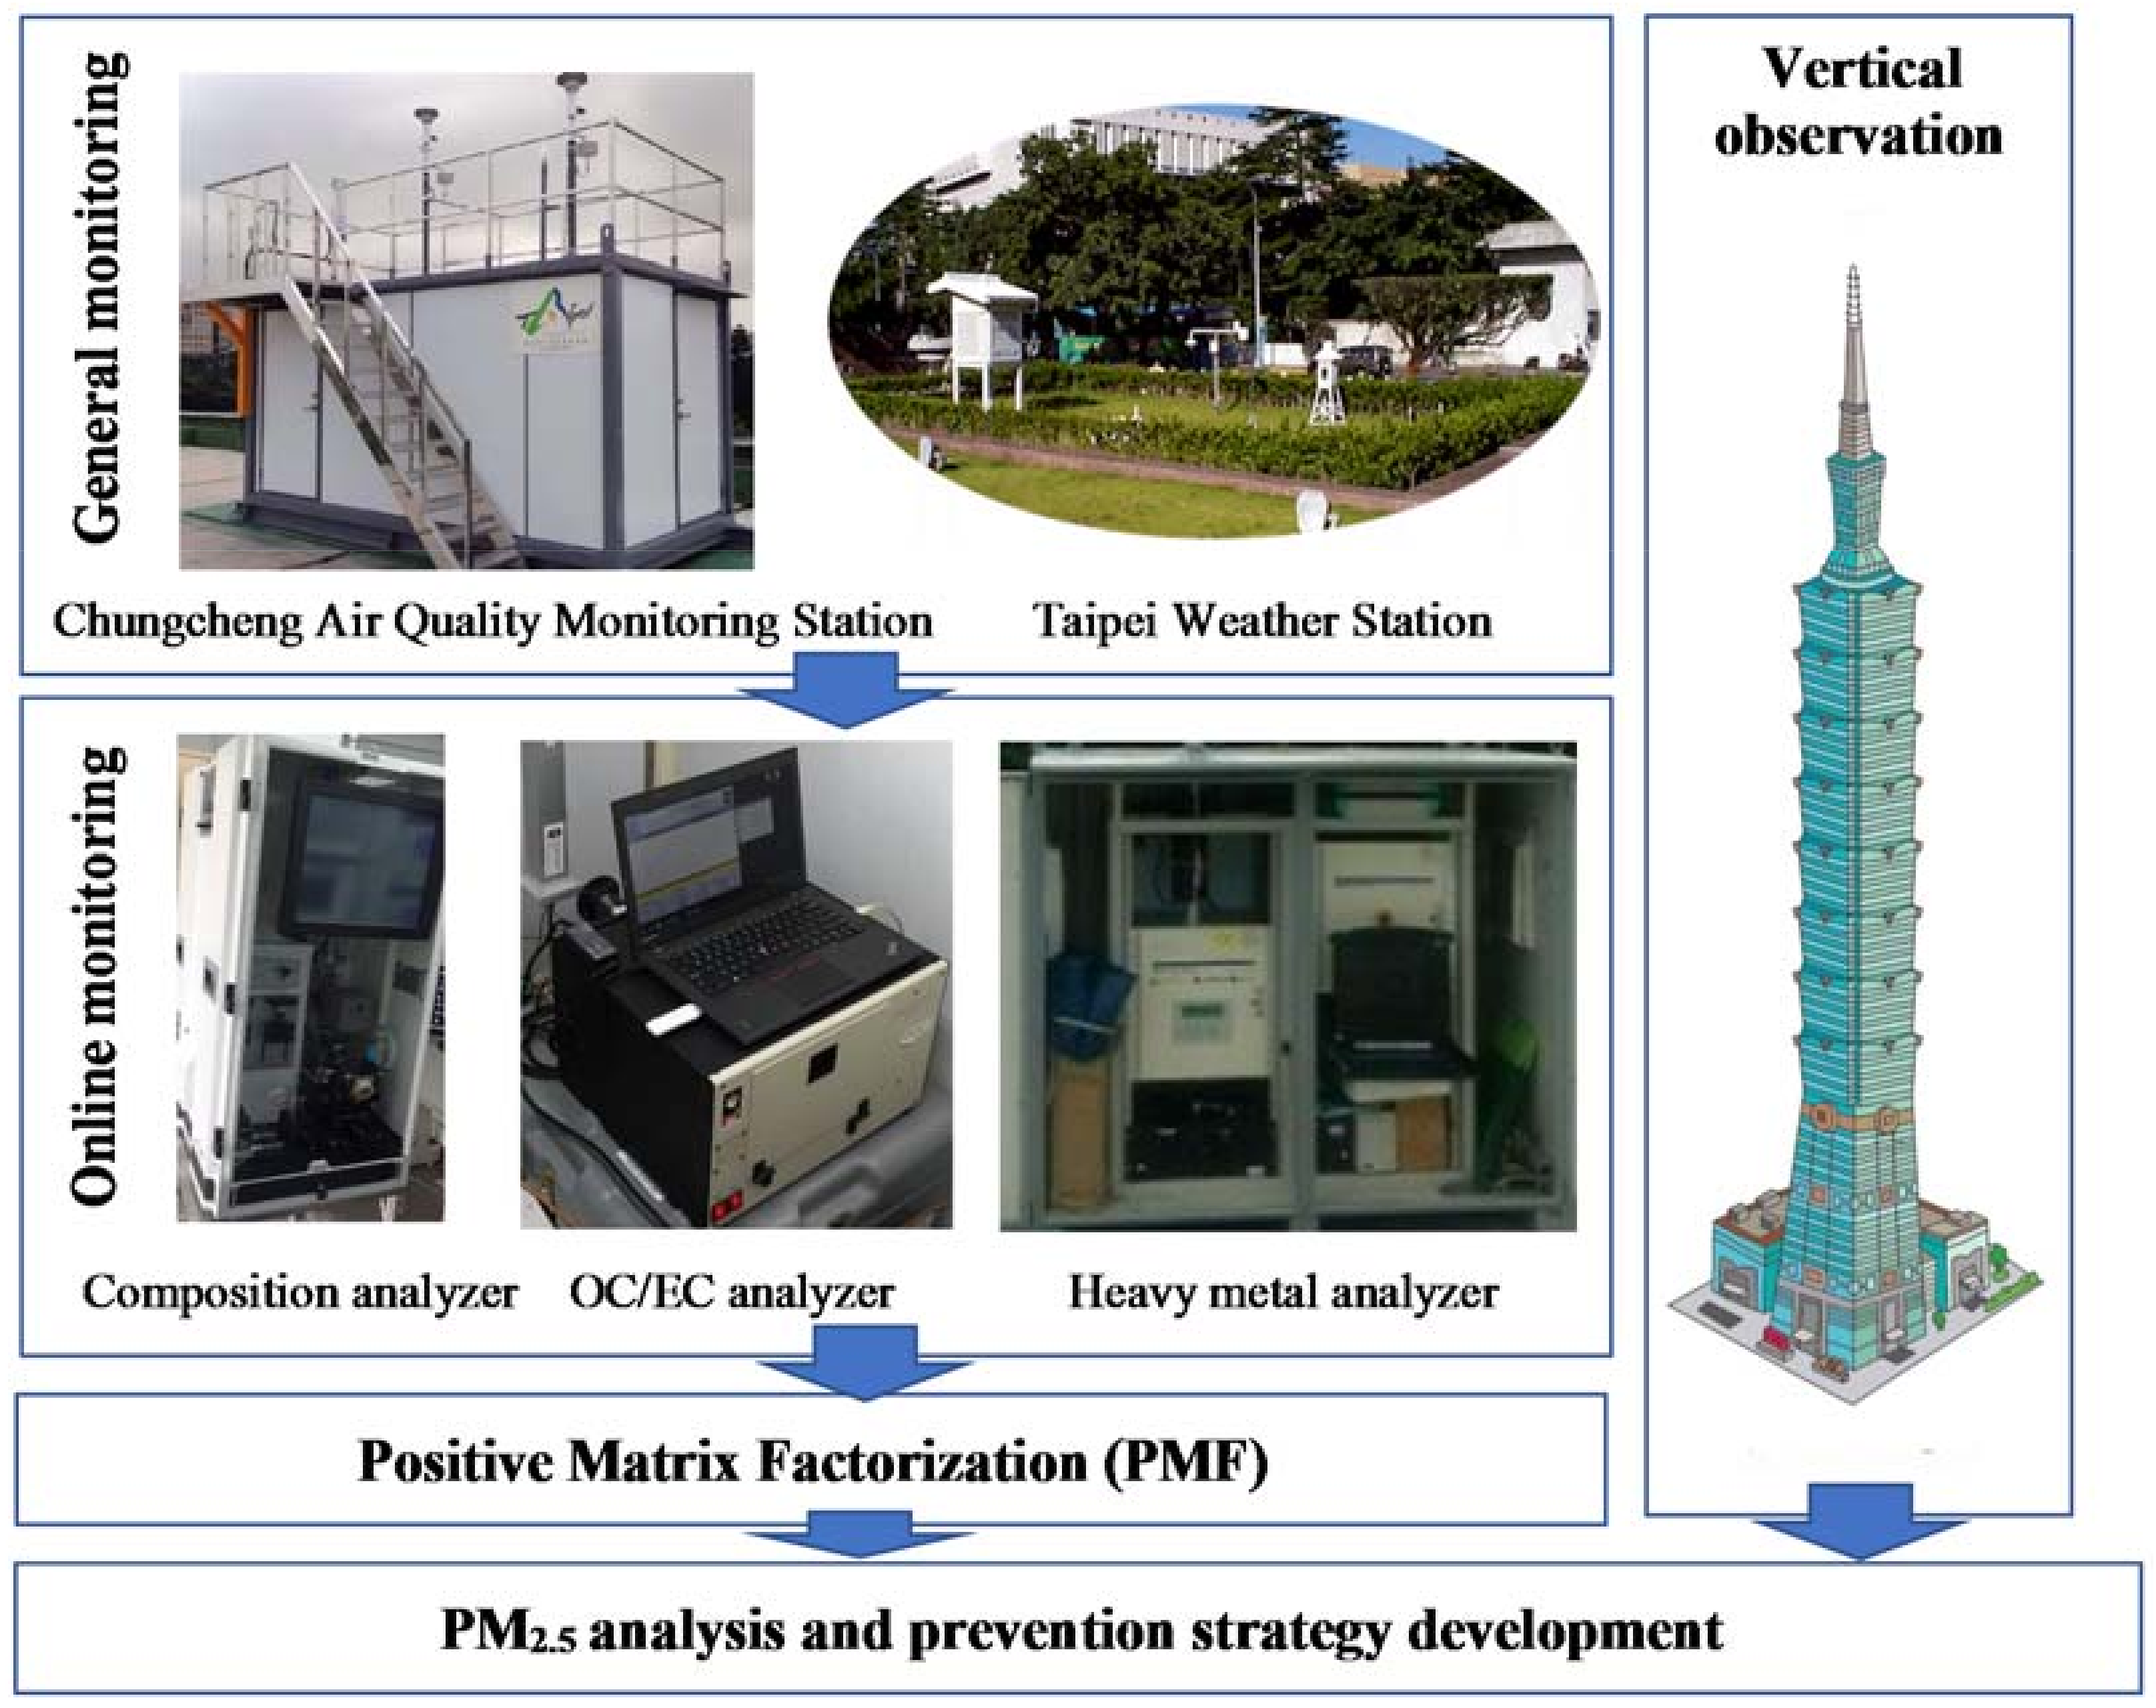
2.1. Monitoring Experiment
2.2. PMF Model
3. Results and Discussion
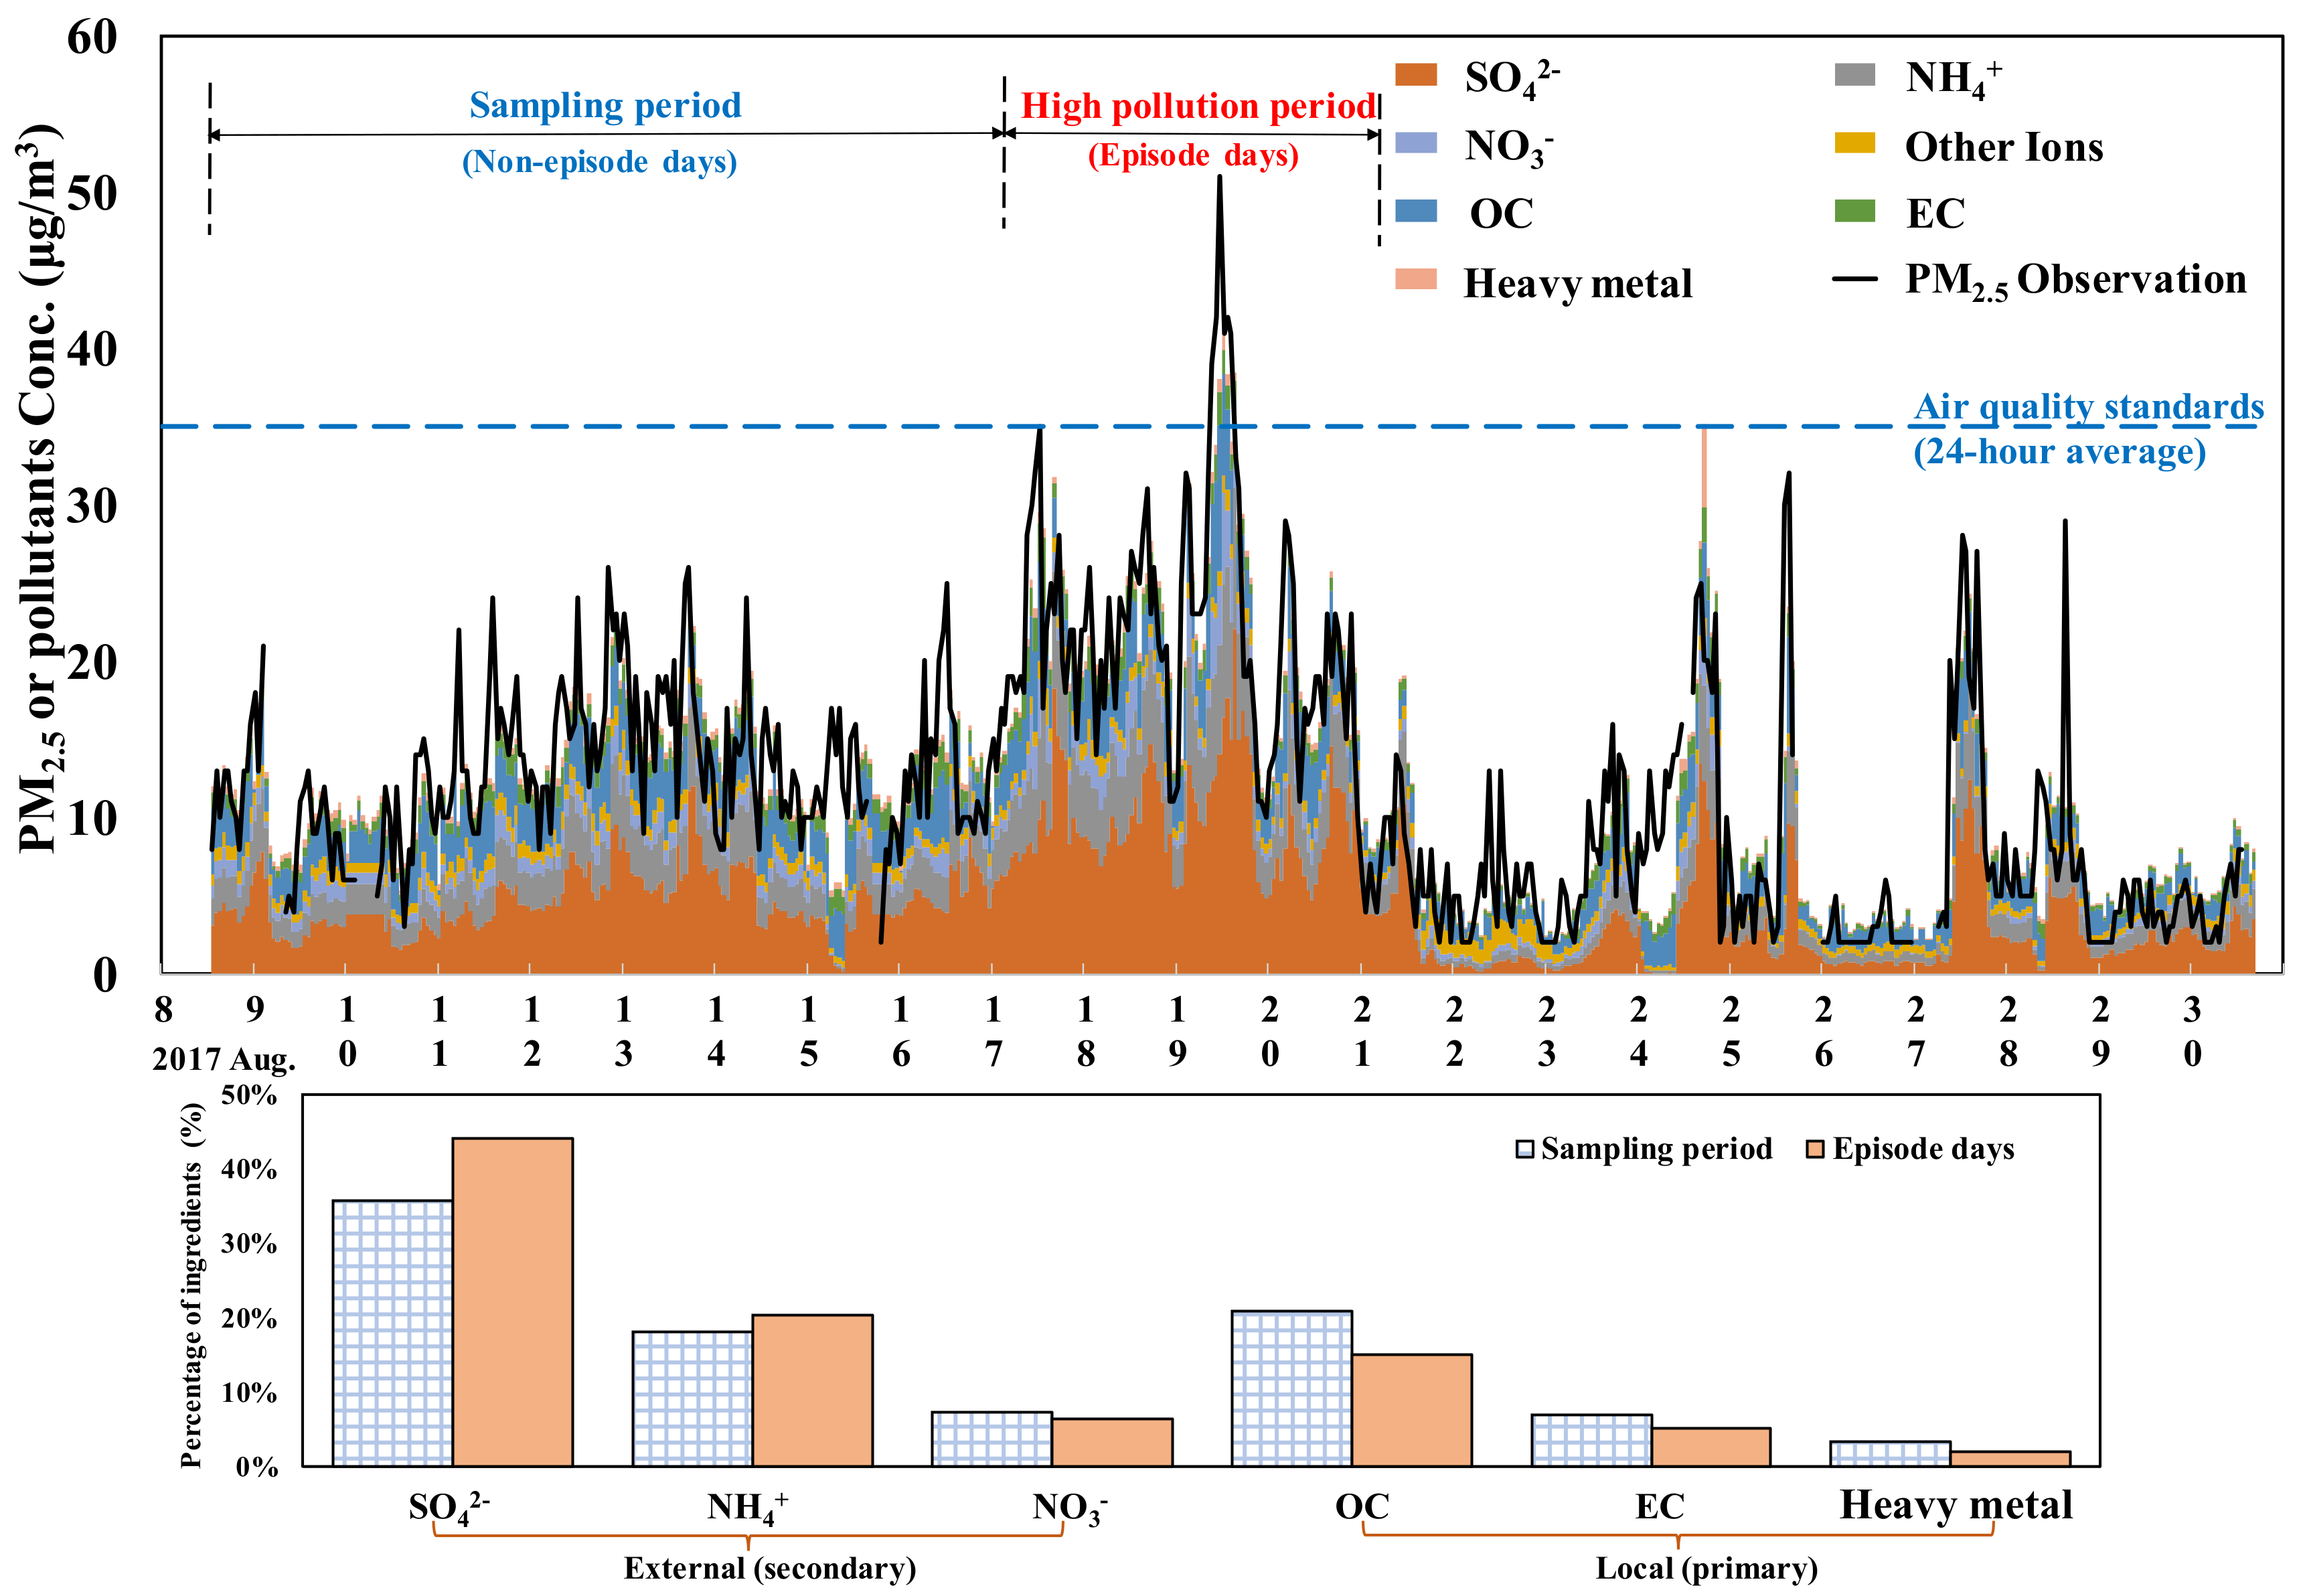
3.1. Analysis of the Time Series of Monitoring Values
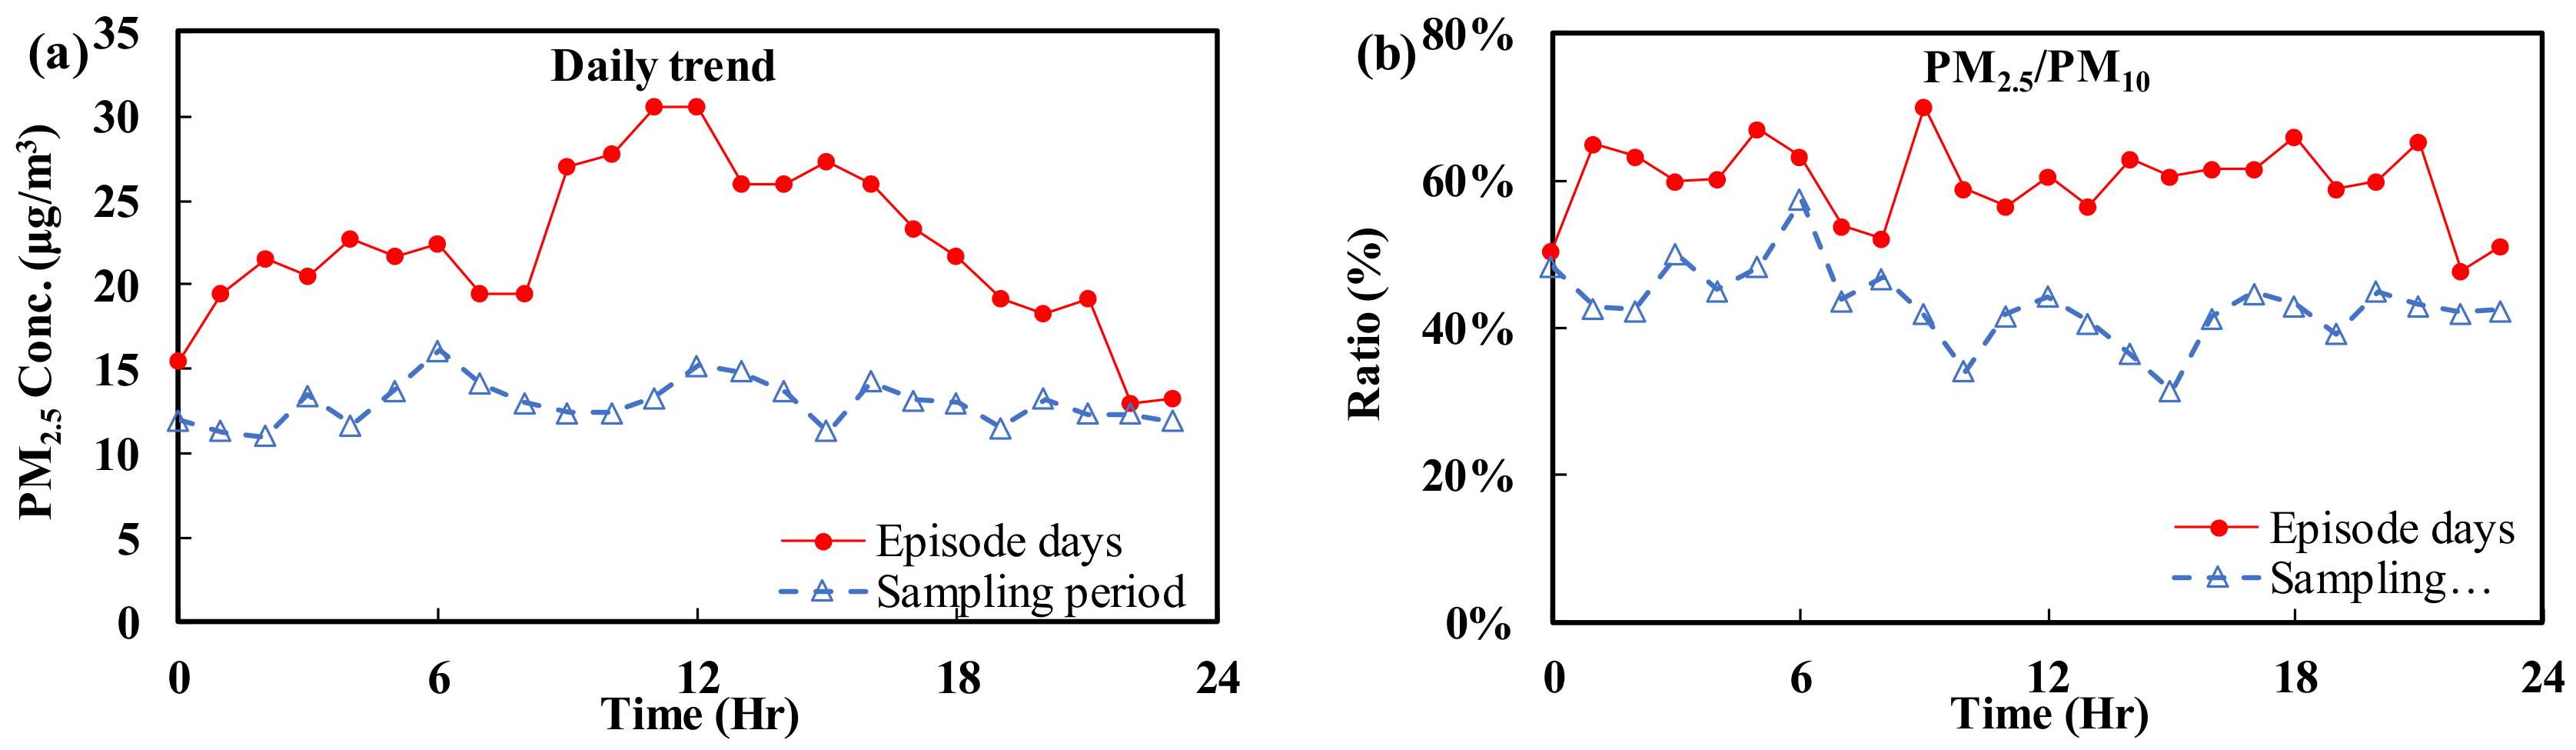
3.2. Automatic Continuous Hourly Monitoring: Daily Trends
- (A)
- Fine particulate matter (PM2.5)
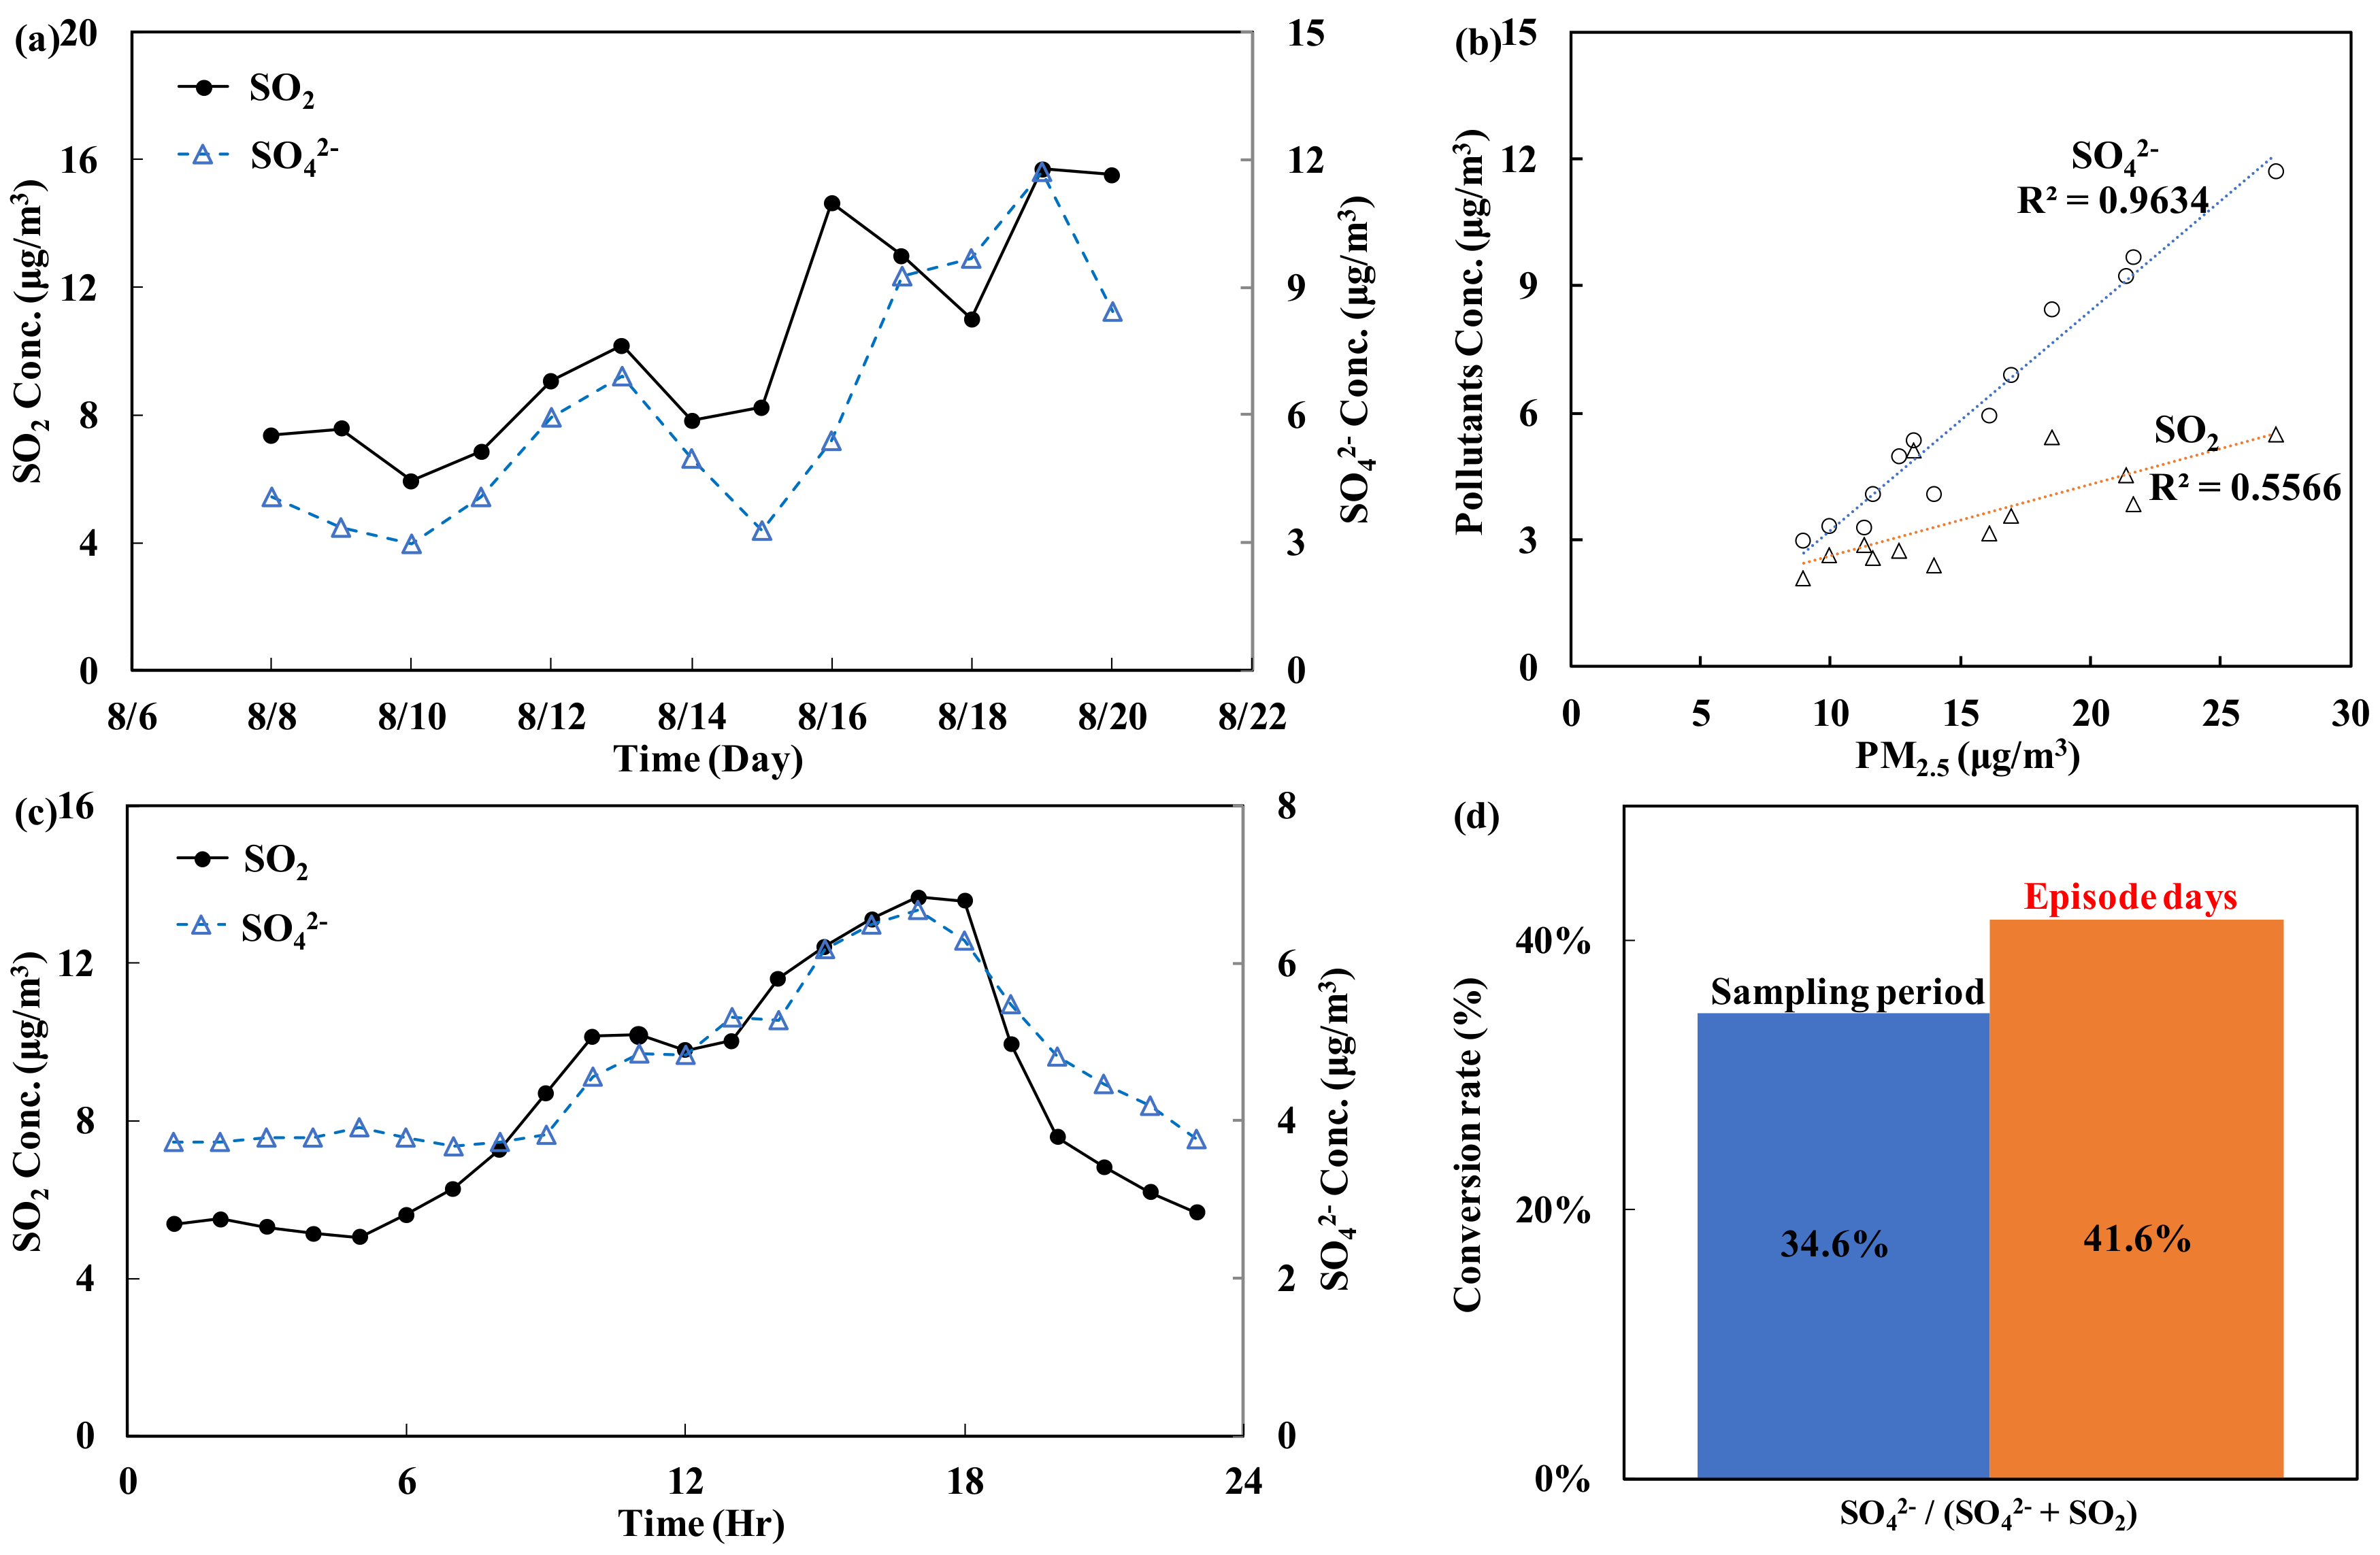
- (B)
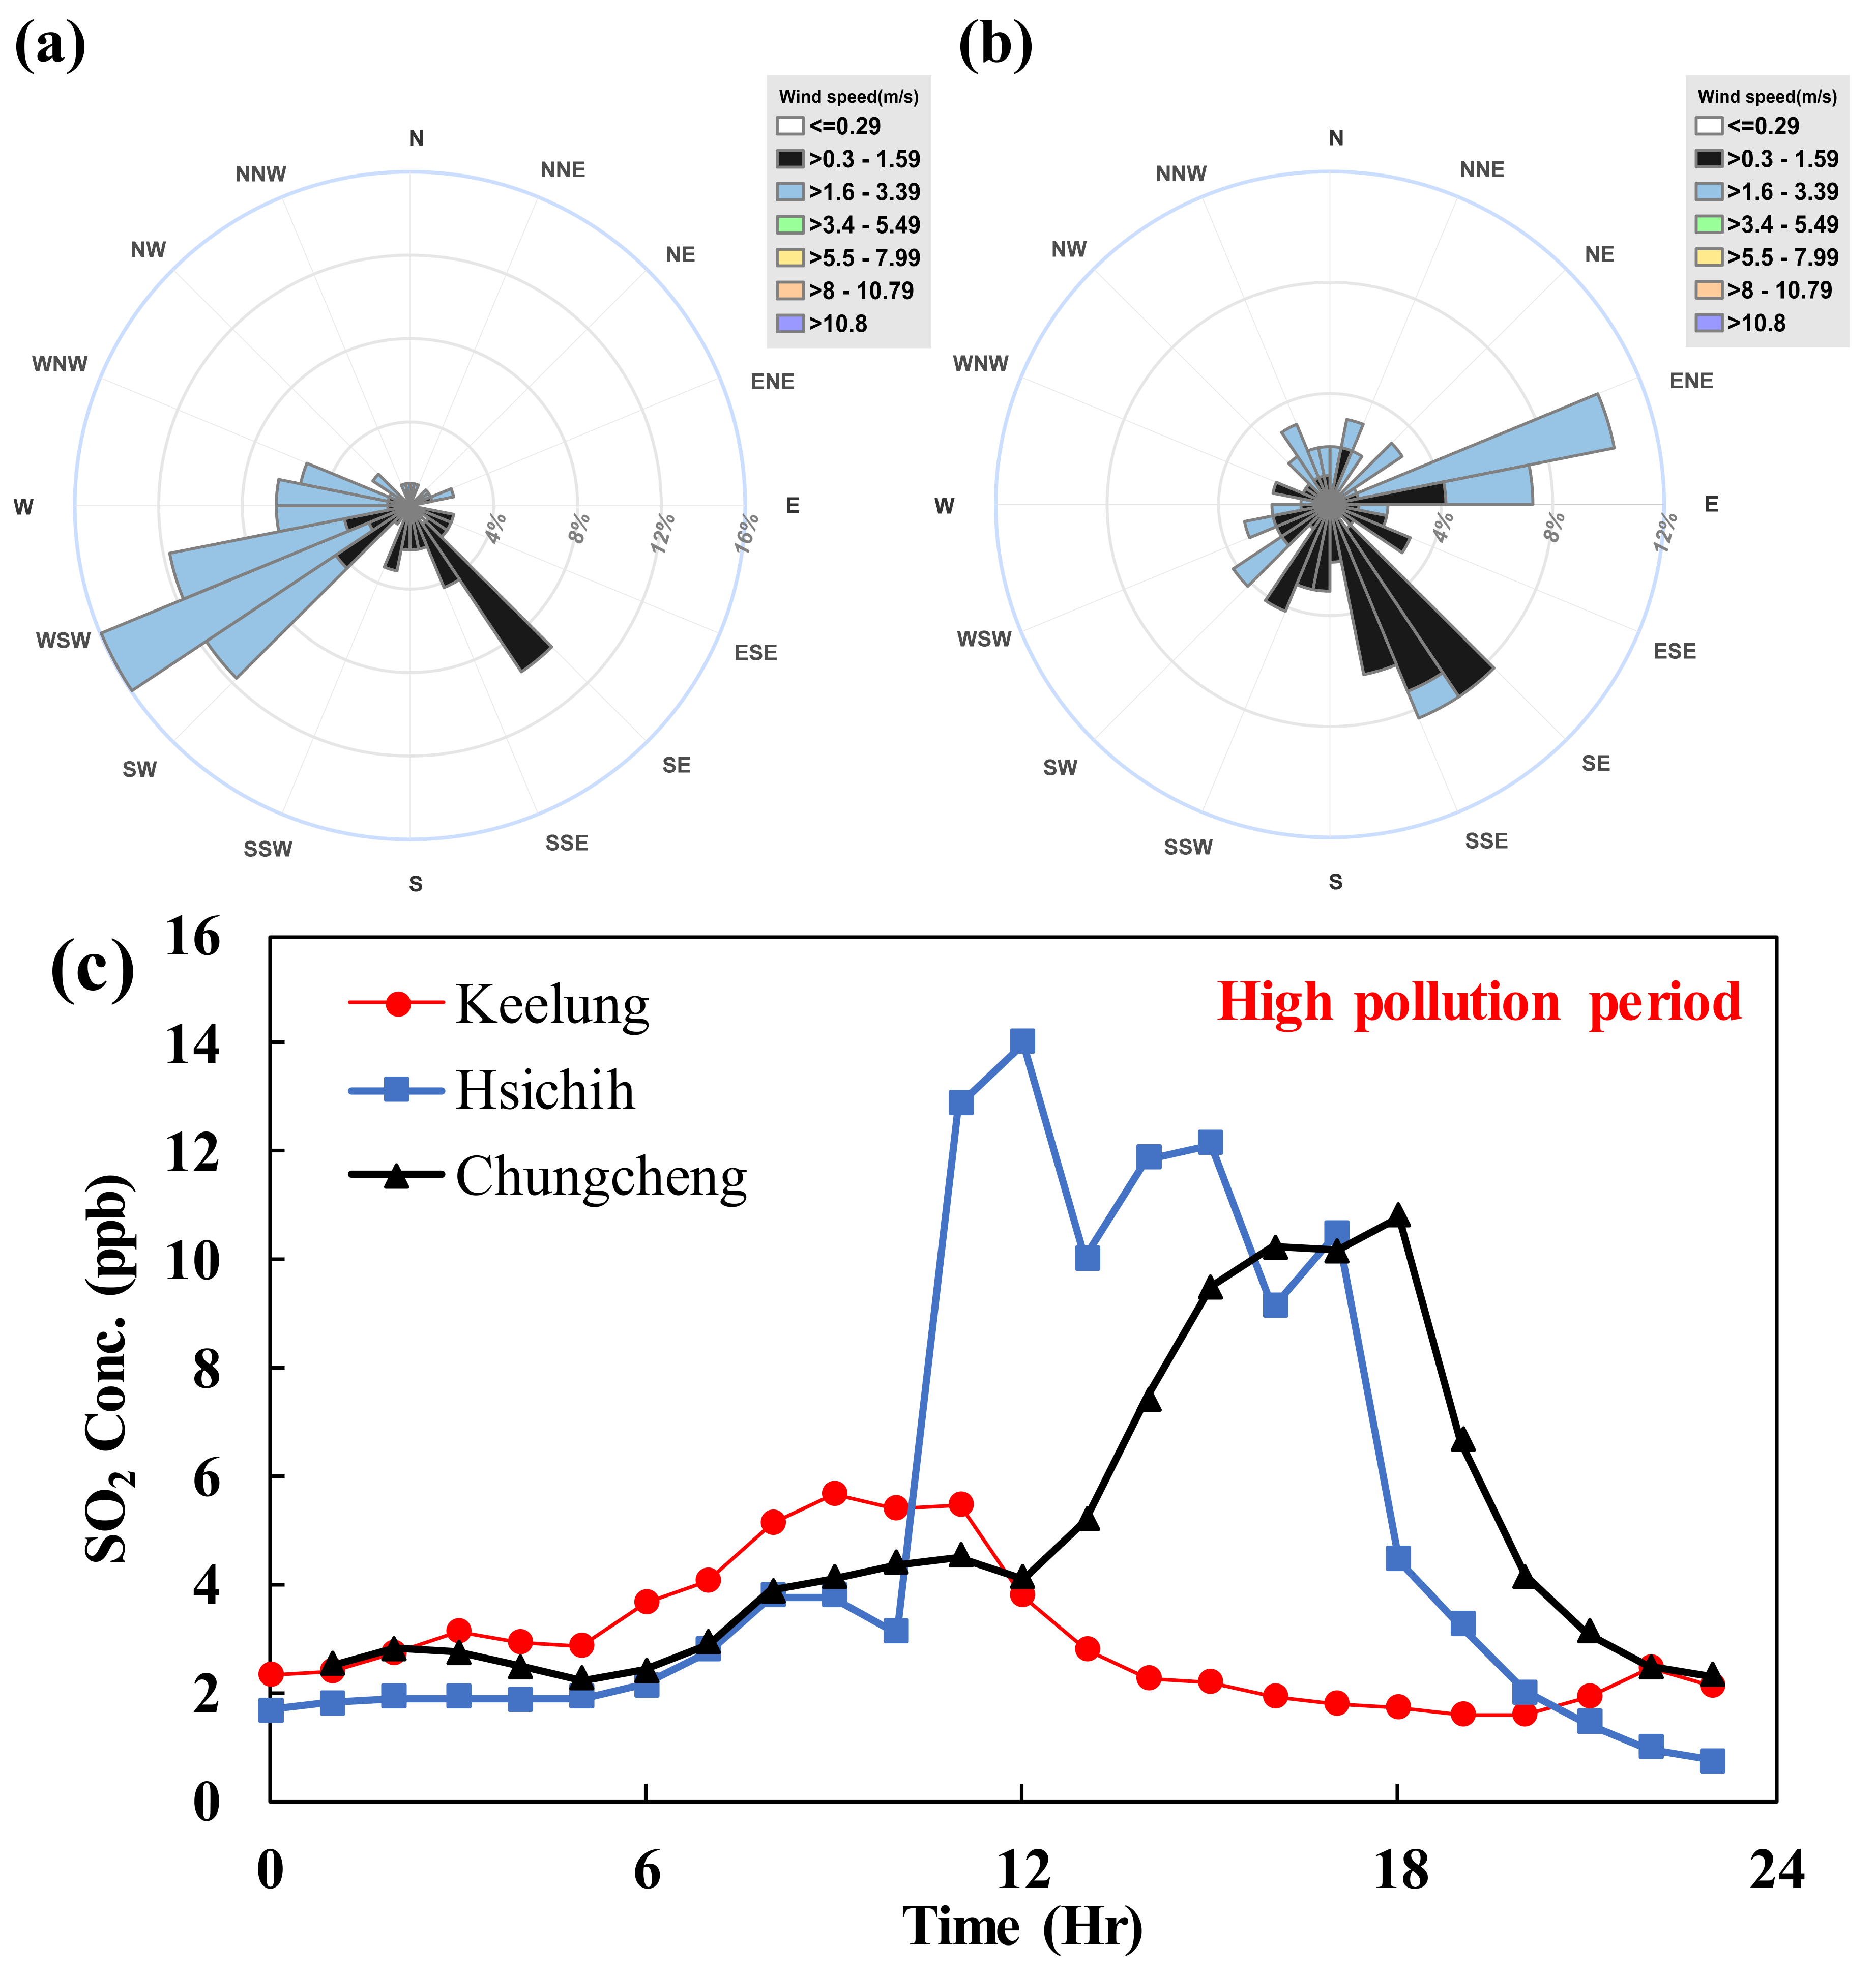
- Sulfur oxides (SO2, SO42−)
- (C)
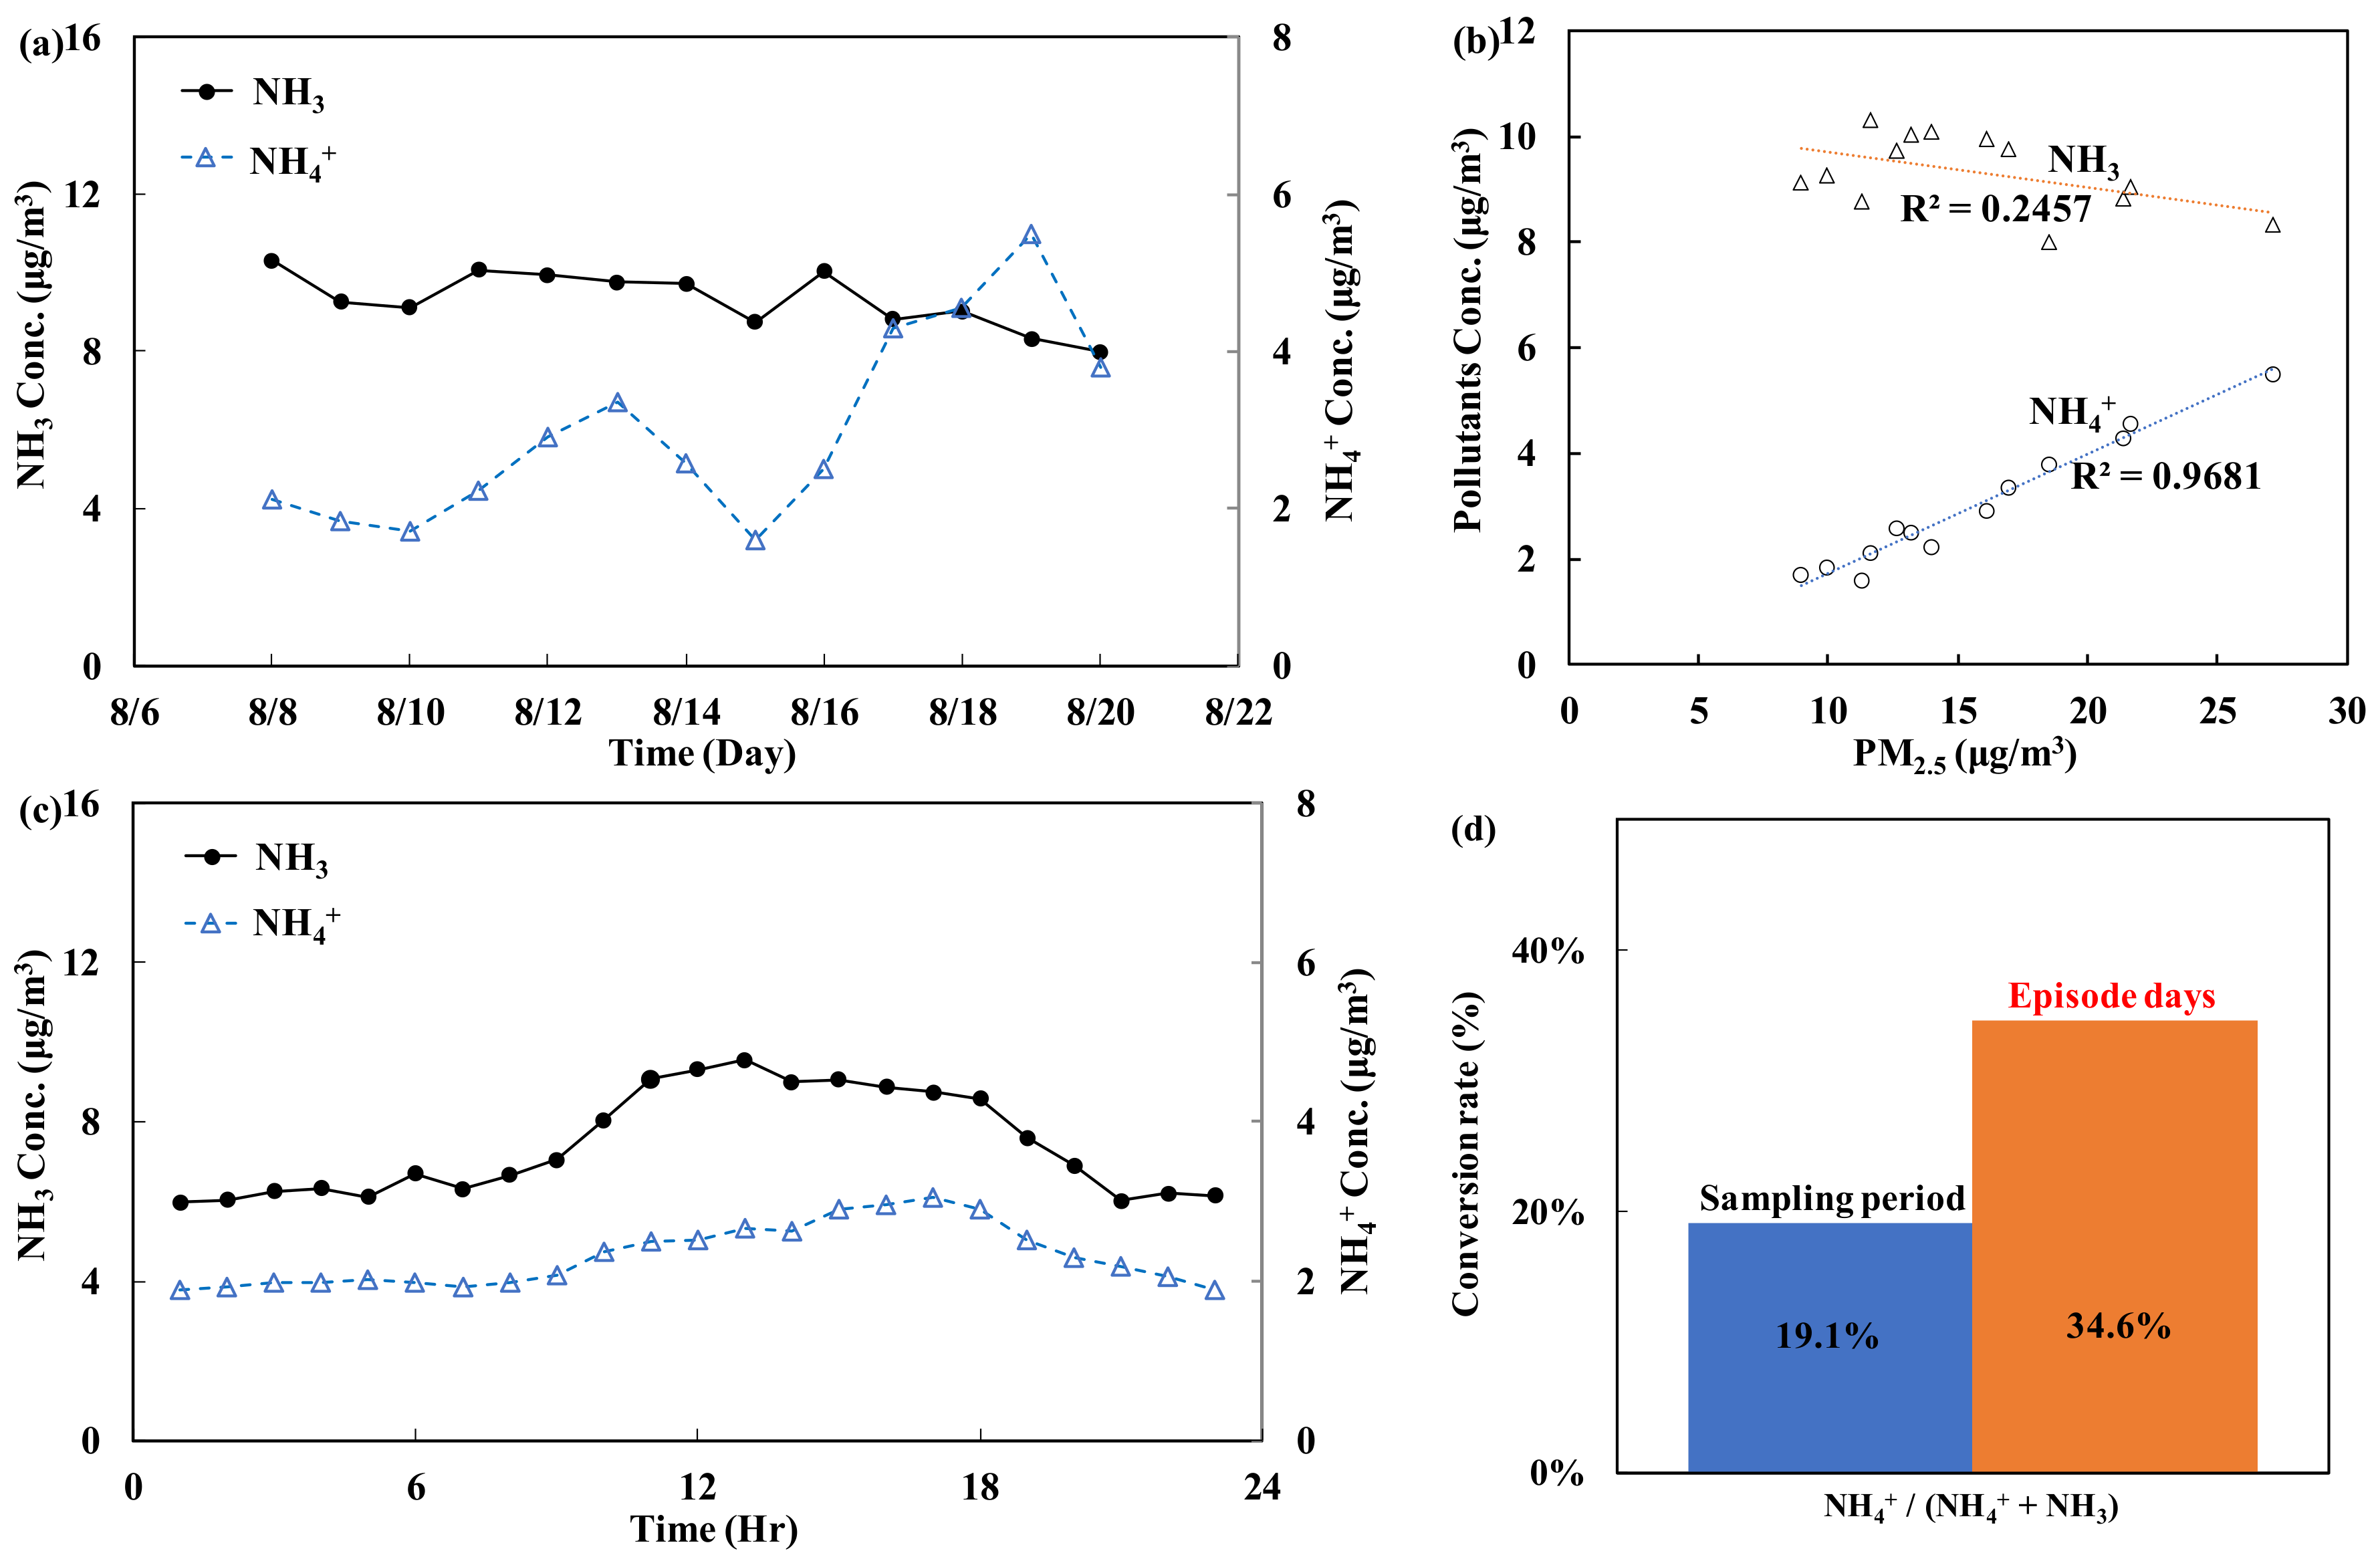
- NH3/NH4+
- (D)
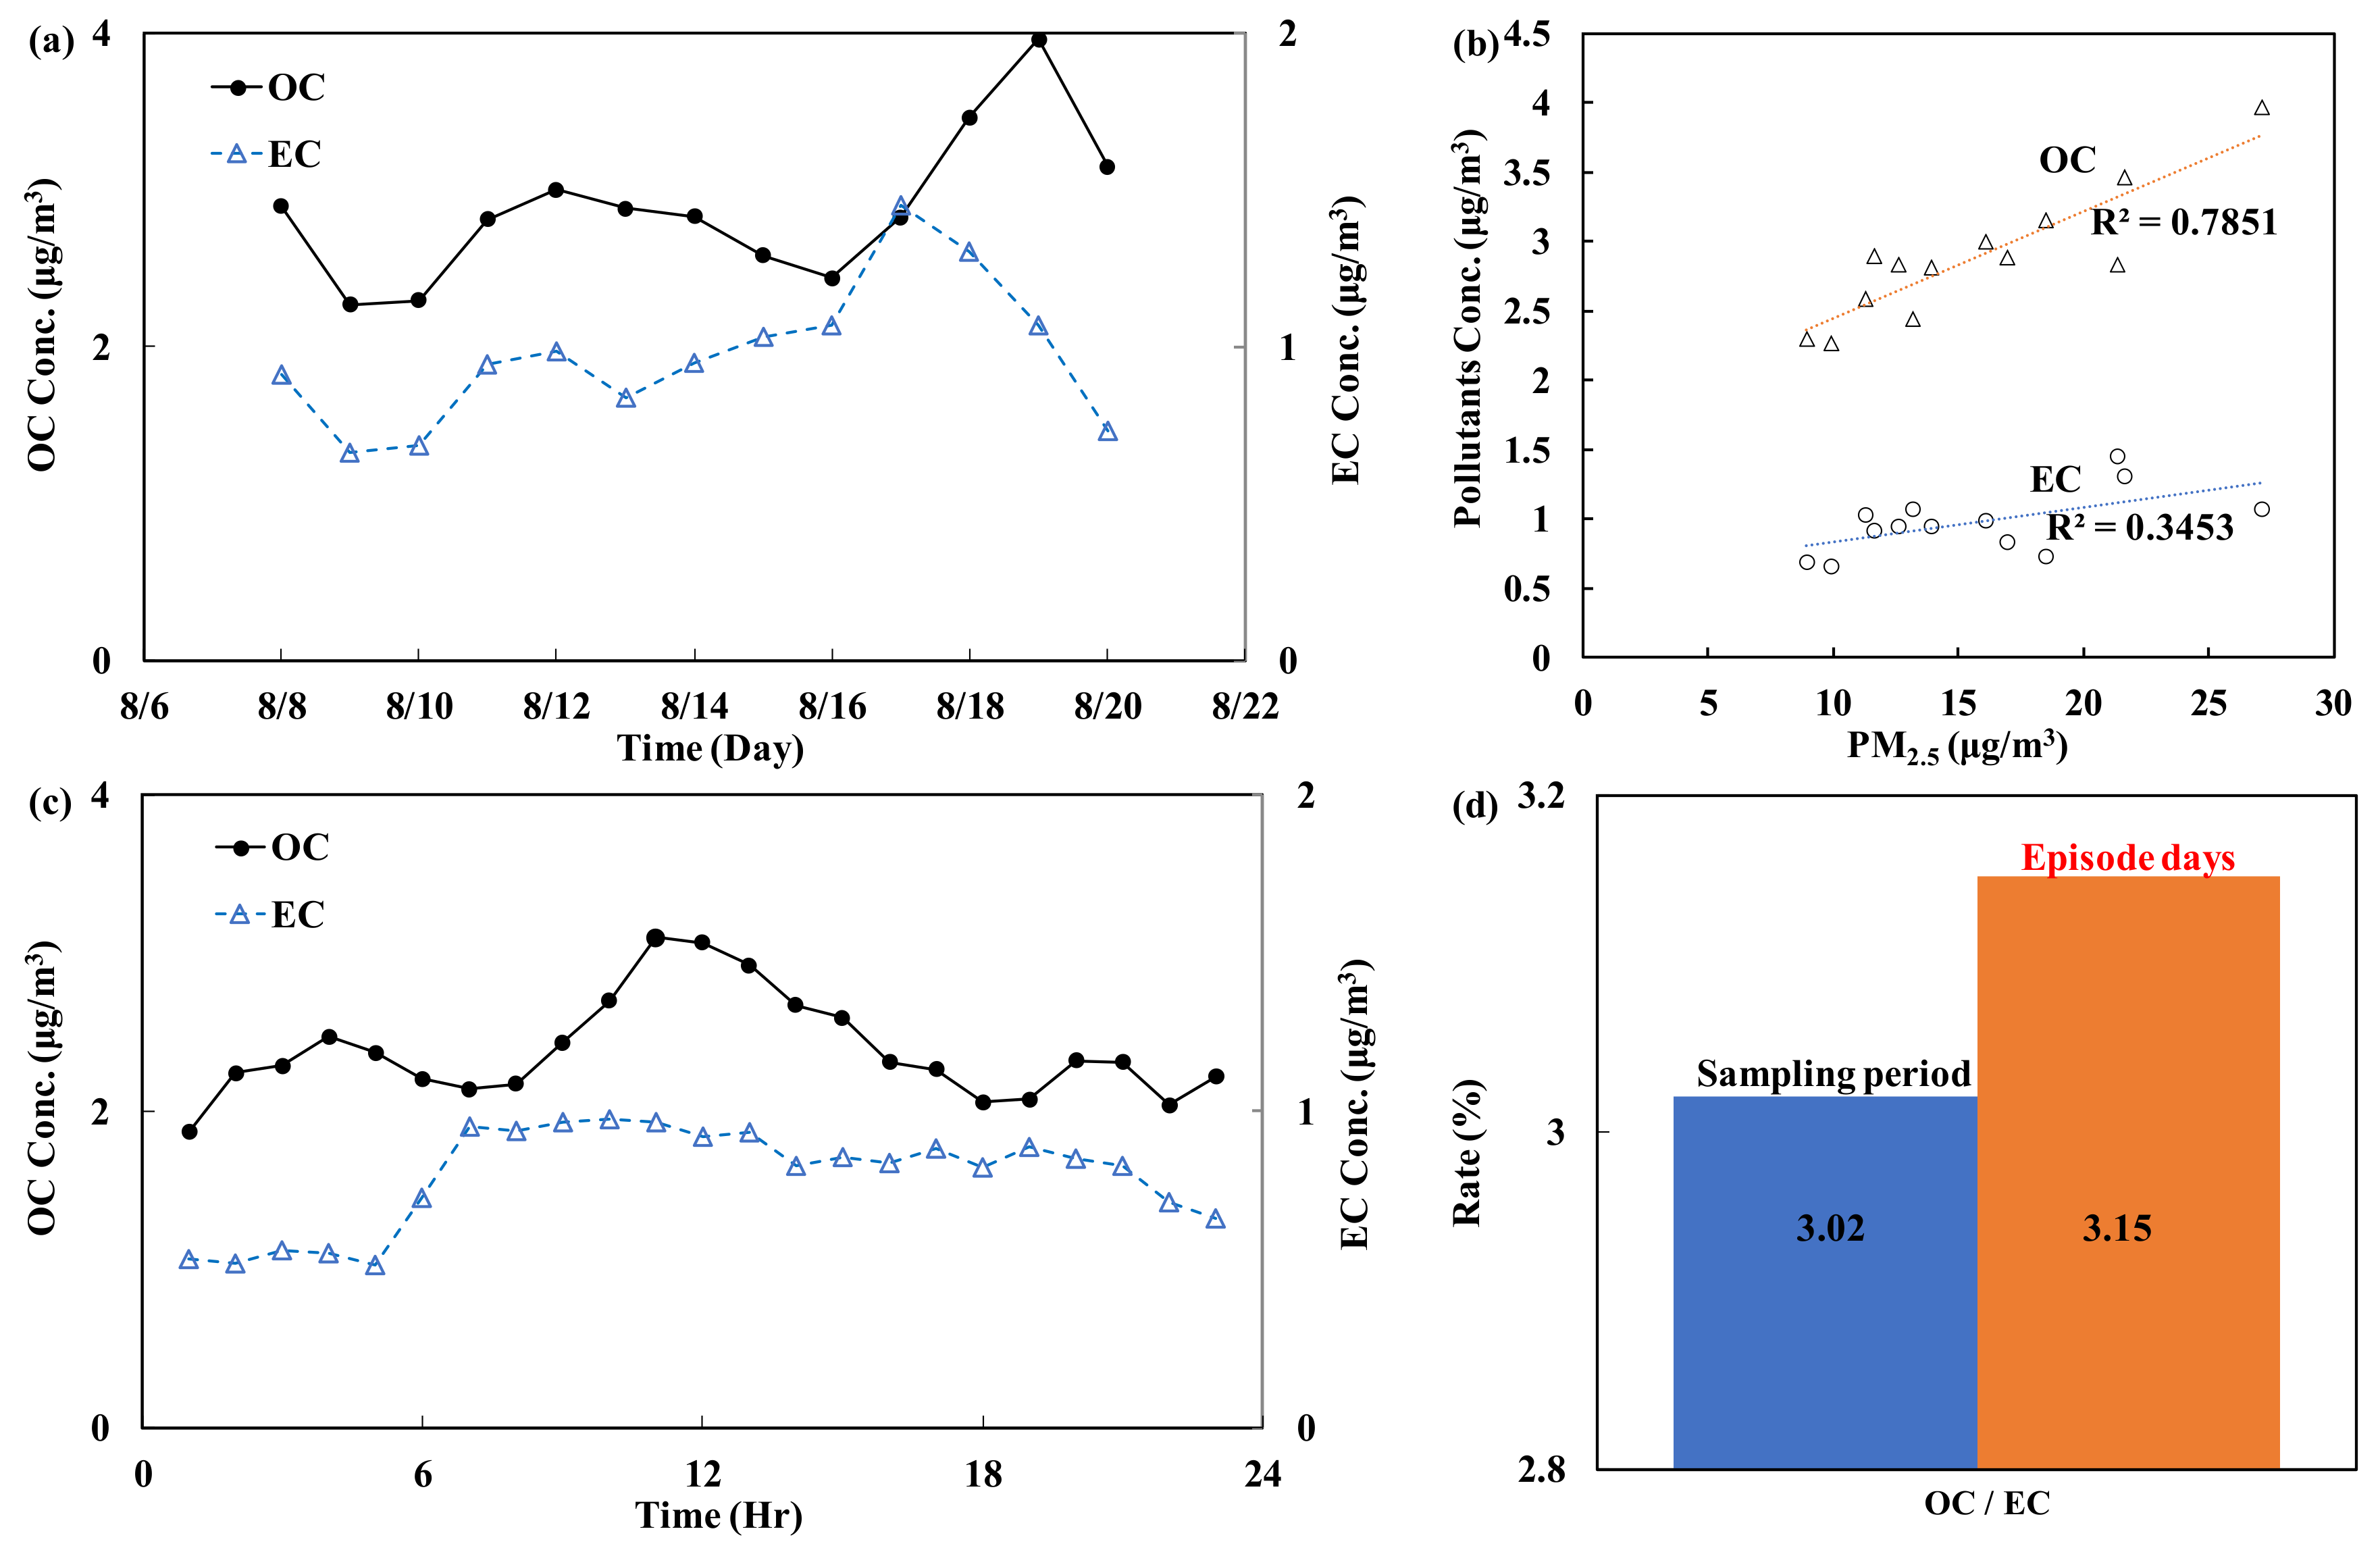
- Carbon (EC/OC)
3.3. PM Pollution Source Classification
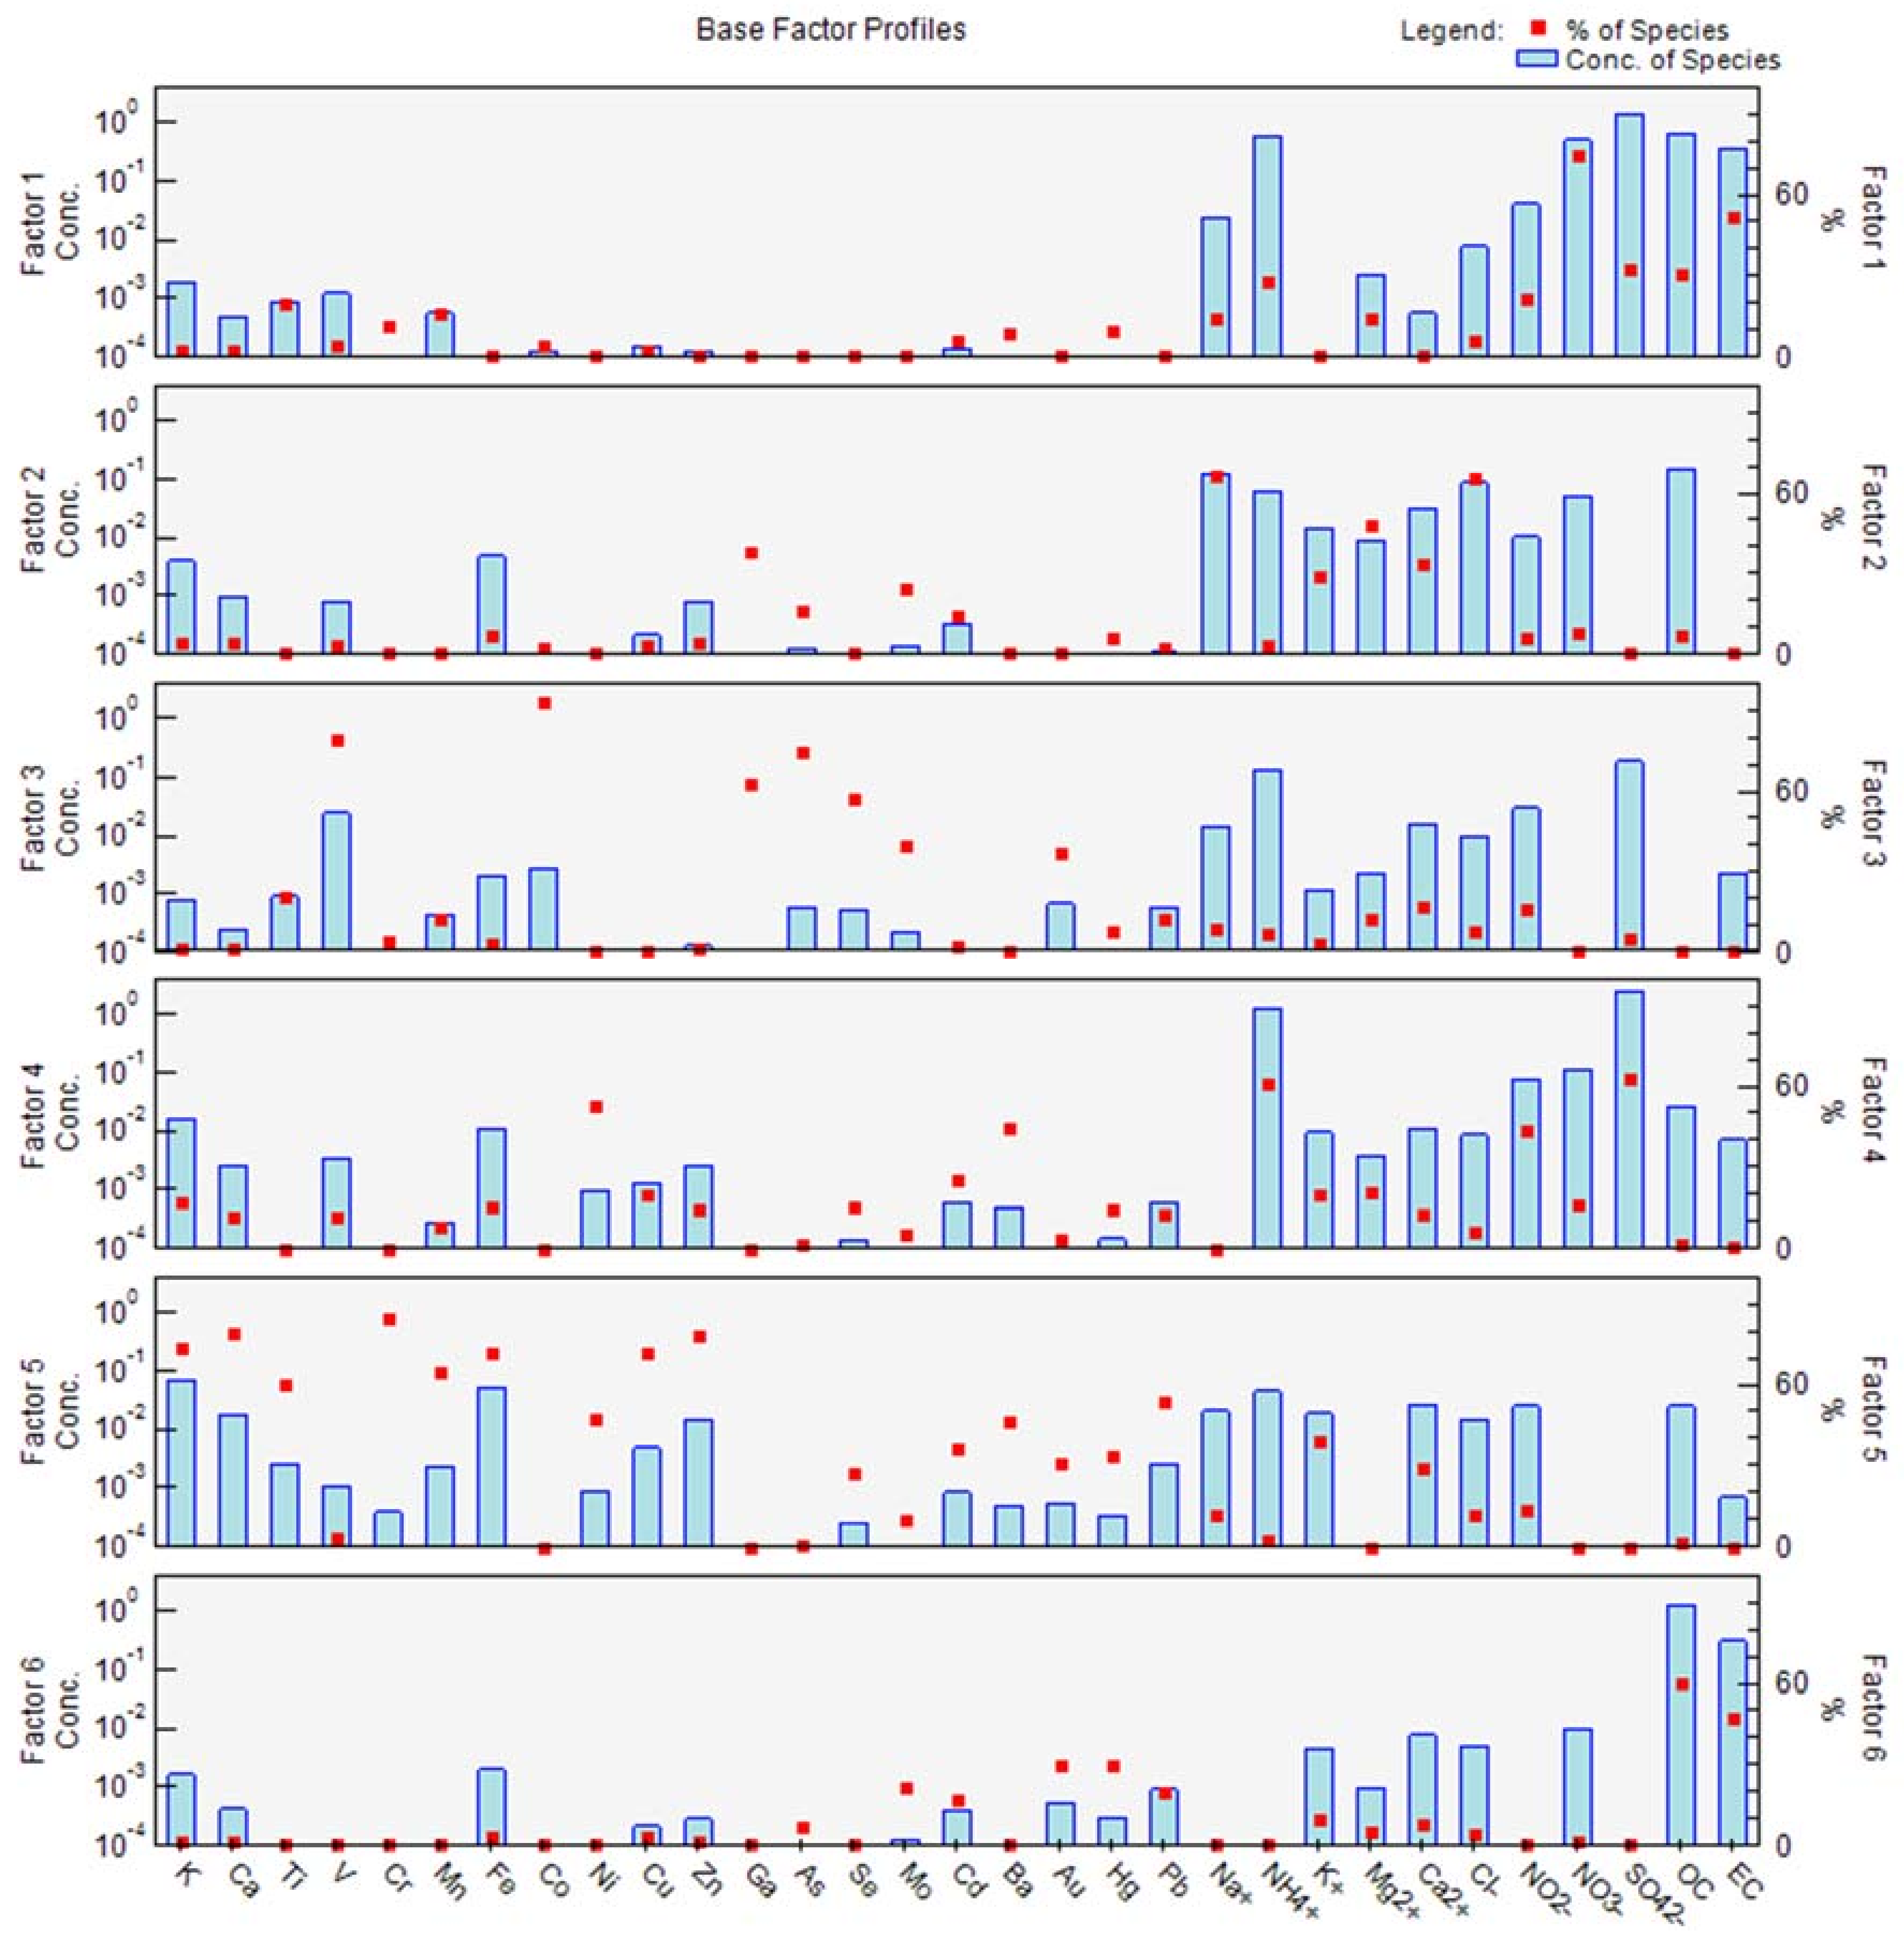
- Factor 1
- This factor includes four major characteristic species: NO3−, EC, SO42− and OC. The major source of EC and NO3− is vehicles, particularly exhaust emitted by vehicles with a diesel engine.
- Factor 2
- This factor is composed of four major characteristic species: Na+, Cl−, Mg2+ and Ca2+. These major characteristic species can be classified as originating from sea spray.
- Factor 3
- The major characteristic species included in this factor are Co, V, As, Ga, and Se, which are fuel indicators. As, Ga, and Se might also be coal indicators. After integrating the major characteristic species of this factor, the emissions can be attributed to oil boilers used by hospitals, hotels and restaurants in the city [36,37].
- Factor 4
- This factor incorporates the following major characteristic species: NH4+, SO42−, Ni, and Ba. These species are mainly derived from pollutants emitted by industrial entities. One example is pollutants transported by air masses, which undergo photochemical reactions and attach to PM. These types of pollutants might be PM2.5 derived from large-scale industrial sources (e.g., power plants and petrochemical plants) at locations upwind of the metropolitan area.
- Factor 5
- The major characteristic species incorporated in this factor are Cr, Ca, Zn, Cu, Fe, and Mn. These elements originate from the Earth’s crust. Fe and Mn are indicator species of dust and are mainly derived from street dust.
- Factor 6
- The major characteristic species incorporated in this factor are OC, OC, Au, Hg, and Pb. According to the VOC emission inventory in Taipei, gasoline vehicles and motorcycles are the major source of these species. Because the sampling site is near a road, OC might originate from the exhaust of gasoline vehicles, including motorcycles [38,39,40].
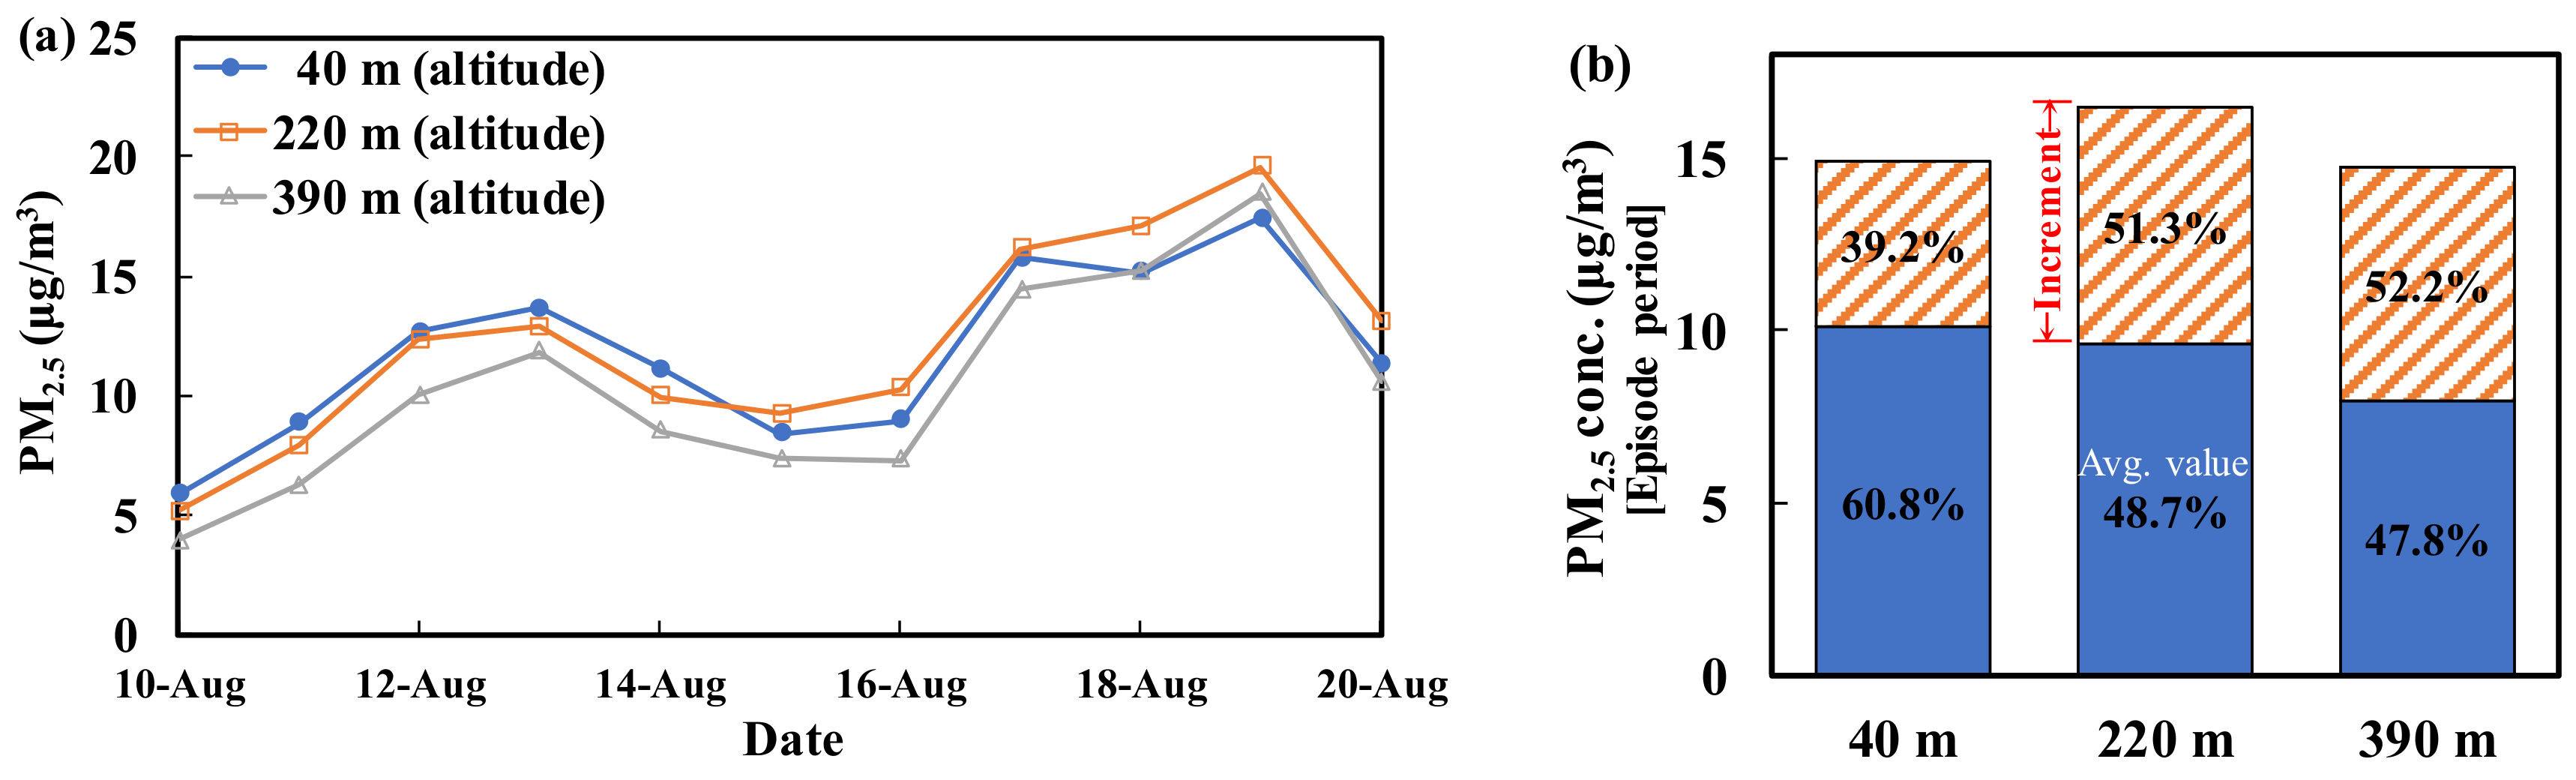
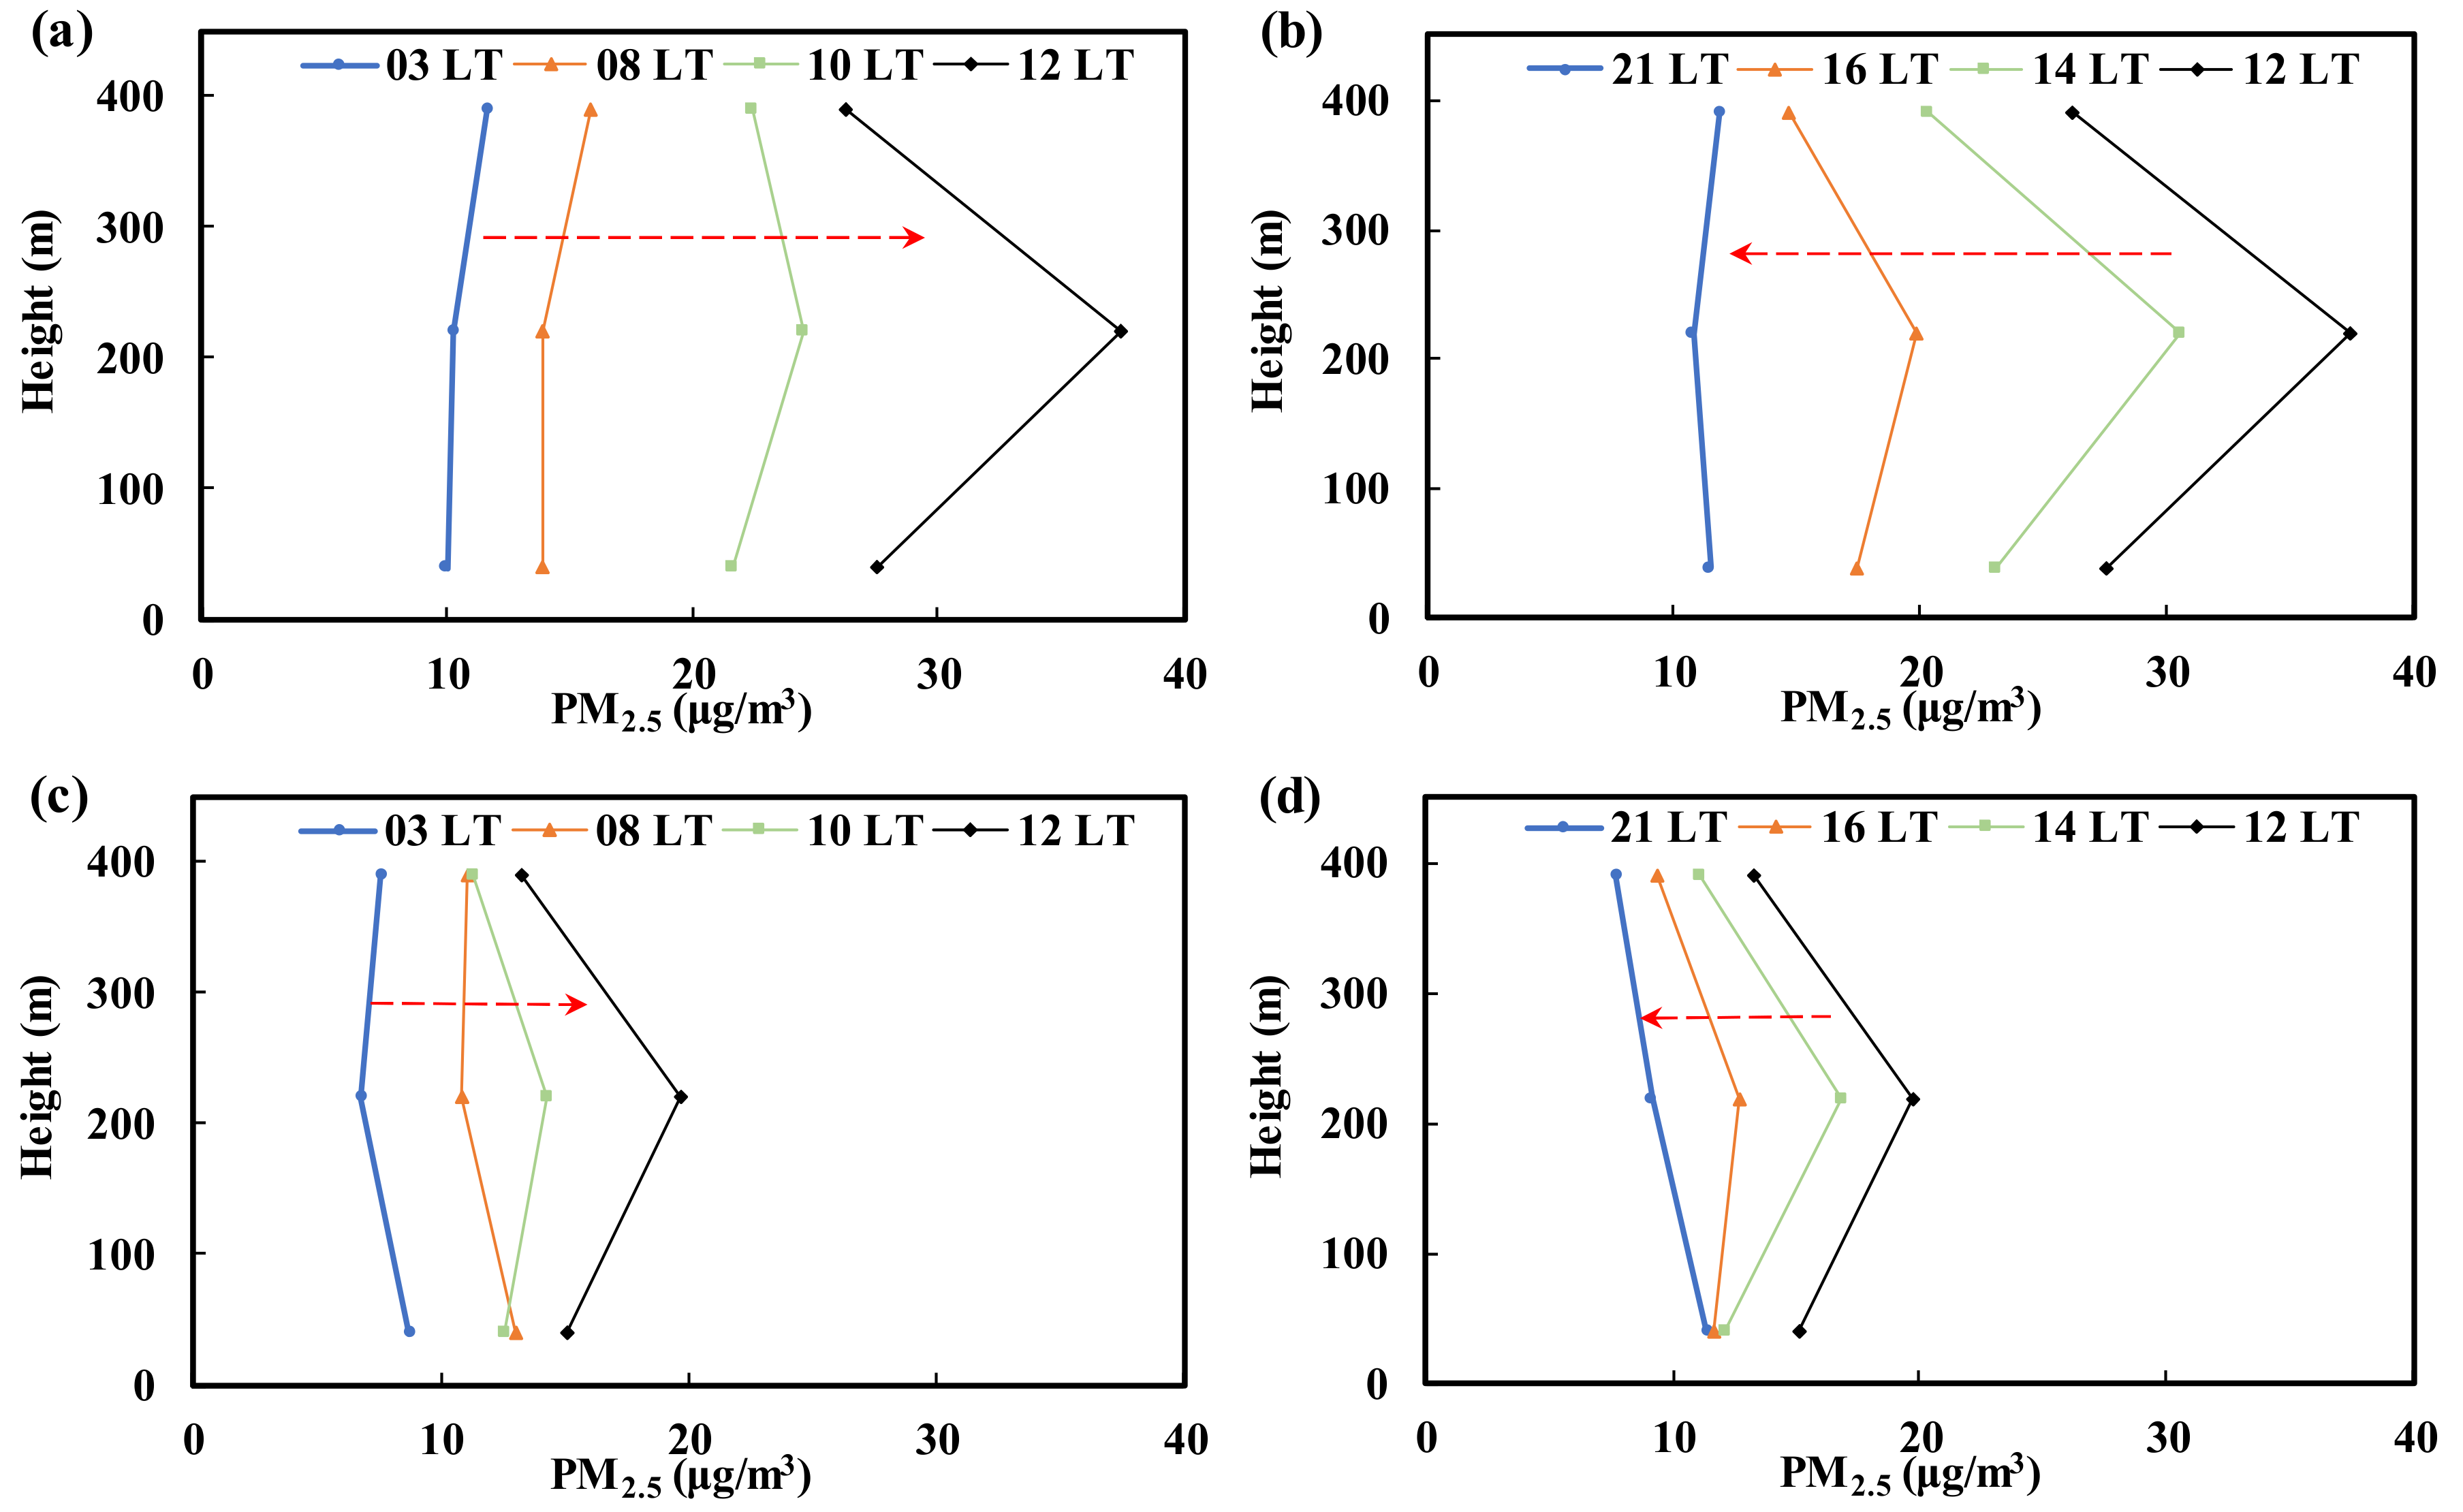
3.4. Vertical PM2.5 Concentration Trends
4. Conclusions
Author Contributions
Funding
Acknowledgments
Conflicts of Interest
References
- Lo, W.C.; Shie, R.H.; Chan, C.C.; Lin, H.H. Burden of disease attributable to ambient fine particulate matter exposure in Taiwan. J. Formos. Med. Assoc. 2017, 116, 32–40. [Google Scholar] [CrossRef] [PubMed] [Green Version]
- Zhang, Y.L.; Cao, F. Fine particulate matter (PM2.5) in China at a city level. Sci. Rep. 2015, 5, 14884. [Google Scholar] [CrossRef] [PubMed]
- Joseph, A.E.; Unnikrishnan, S.; Kumar, R. Chemical Characterization and Mass Closure of Fine Aerosol for Different Land Use Patterns in Mumbai City. Ambient Air Qual. Res. 2011, 12, 61–72. [Google Scholar] [CrossRef]
- Apte, J.S.; Marshall, J.D.; Cohen, A.J.; Brauer, M. Addressing Global Mortality from Ambient PM2.5. Environ. Sci. Technol. 2015, 49, 8057–8066. [Google Scholar] [CrossRef] [PubMed]
- Chan, C.; Yao, X. Air pollution in mega cities in China. Atmos. Environ. 2008, 42, 1–42. [Google Scholar] [CrossRef]
- World Health Organization (WHO). Health Risks of Air Pollution in Europe—HRAPIE Project: Recommendations for Concentration—Response Functions for Cost-Benefit Analysis of Particulate Matter, Ozone and Nitrogen Dioxide; WHO: Geneva, Switzerland, 2013. [Google Scholar]
- Phung, V.L.H.; Ueda, K.; Kasaoka, S.; Seposo, X.; Tasmin, S.; Yonemochi, S.; Phosri, A.; Honda, A.; Takano, H.; Michikawa, T.; et al. Acute Effects of Ambient PM2.5 on All-Cause and Cause-Specific Emergency Ambulance Dispatches in Japan. Int. J. Environ. Res. Public Health 2018, 15, 307. [Google Scholar] [CrossRef] [PubMed]
- Wan Mahiyuddin, W.R.; Sahani, M.; Aripin, R.; Latif, M.T.; Thach, T.Q.; Wong, C.M. Short-term effects of daily air pollution on mortality. Atmos. Environ. 2013, 65, 69–79. [Google Scholar] [CrossRef]
- European Environment Agency (EEA). Air Quality in Europe—2014 Report; EEA Report No. 5; EEA: Copenhagen, Denmark, 2014. [Google Scholar]
- United Nations (UN). Open Working Group on Sustainable Development Goals. 2014. Available online: http://sustainabledevelopment.un.org (accessed on 14 July 2014).
- European Environment Agency (EEA). Air Quality in Europe—2013 Report; EEA Report No. 9; EEA: Copenhagen, Denmark, 2013. [Google Scholar]
- Linares, C.; Díaz, J. Impact of particulate matter with diameter of less than 2.5 microns (PM2.5) on daily hospital admissions in 0~10 year olds in Madrid, Spain (2003–2005). Gac. Sanit. 2009, 23, 192–197. [Google Scholar] [CrossRef] [PubMed]
- Zhang, R.; Jing, J.; Tao, J.; Hsu, S.; Wang, G.; Cao, J.; Les, C.; Zhu, L.; Chen, Z.; Zhao, Y.; et al. Chemical characterization and source apportionment of PM2.5 in Beijing: Seasonal perspective. Atmos. Chem. Phys. 2013, 13, 7053–7074. [Google Scholar] [CrossRef]
- Kim, E.; Turkiewicz, K.; Zulawnick, S.A. Sources of fine particles in the South Coast area, California. Atmos. Environ. 2010, 44, 3095–3100. [Google Scholar] [CrossRef]
- Pant, P.; Harrison, R.M. Critical review of receptor modelling for particulate matter: A case study of India. Atmos. Environ. 2012, 49, 1–12. [Google Scholar] [CrossRef]
- Hopke, P.K. Receptor Modeling in Environmental Chemistry; John Wiley & Sons, Inc.: New York, NY, USA, 1985. [Google Scholar]
- Paatero, P.; Tapper, U. Positive matrix factorization: A non-negative factor model with optimal utilization of error estimates of data values. Environmetrics 1994, 5, 111–126. [Google Scholar] [CrossRef]
- Tiwari, S.; Pervez, S.; Perrino, C.; Bisht, D.S.; Srivastava, A.K.; Chate, D. Chemical characterization of atmospheric particulate matter in Delhi, India, Part II: Source apportionment studies using PMF 3.0. Atmos. Res. 2013, 145, 45–56. [Google Scholar] [CrossRef]
- Amato, F.; Polfi, M.; Escrig, A.; Querol, X.; Alastuey, A.; Pey, J.; Perez, N.; Hopke, P.K. Quantifying road dust resuspension in urban environment by multilinear engine: A comparison with PMF2. Atmos. Environ. 2009, 43, 2770–2780. [Google Scholar] [CrossRef]
- Amato, F.; Hopke, P.K. Source apportionment of the ambient PM2.5 across St. Louis using constrained positive matrix factorisation. Atmos. Environ. 2012, 46, 329–337. [Google Scholar] [CrossRef]
- Zhao, Q.; Shen, G.; Li, L.; Chen, F.; Qiao, Y.; Li, C.; Liu, Q.; Han, J. Ambient Particles (PM10, PM2.5 and PM1.0) and PM2.5 Chemical Components in Western Yangtze River Delta (YRD): An Overview of Data from 1-year Online Continuous Monitoring at Nanjing. Aerosol Sci. Eng. 2017, 1, 107–118. [Google Scholar] [CrossRef]
- Gao, M.; Cao, J.; Seto, E. A distributed network of low-cost continuous reading sensors to measure spatiotemporal variations of PM2.5 in Xi’an, China. Environ. Pollut. 2015, 199, 56–65. [Google Scholar] [CrossRef] [PubMed]
- Ten Brink, H.; Otjes, R.; Jongejan, P.; Slanina, S. An instrument for semi-continuous monitoring of the size-distribution of nitrate, ammonium, sulphate and chloride in aerosol. Atmos. Environ. 2007, 41, 2768–2779. [Google Scholar] [CrossRef]
- Bigi, A.; Bianchi, F.; De Gennaro, G.; Di Gilio, A.; Fermo, P.; Ghermandi, G.; Prévôt, A.S.H.; Urbani, M.; Valli, G.; Vecchi, R.; et al. Hourly composition of gas and particle phase pollutants at a central urban background site in Milan, Italy. Atmos. Res. 2017, 186, 83–94. [Google Scholar] [CrossRef]
- Gao, J.; Peng, X.; Chen, G.; Xu, J.; Shi, G.L.; Zhang, Y.C.; Feng, Y.C. Insights into the chemical characterization and sources of PM2.5 in Beijing at a 1-h time resolution. Sci. Total Environ. 2016, 542, 162–171. [Google Scholar] [CrossRef] [PubMed]
- Vodička, P.; Schwarz, J.; Ždímal, V. Analysis of one year’s OC/EC data at a Prague suburban site with 2-h time resolution. Atmos. Environ. 2013, 77, 865–872. [Google Scholar] [CrossRef]
- Wang, M.; Shao, M.; Chen, W.; Yuan, B.; Lu, S.; Zhang, Q.; Zeng, L.; Wang, Q. A temporally spatially resolved validation of emission inventories by measurements of ambient volatile organic compounds in Beijing, China. Atmos. Chem. Phys. 2014, 14, 5871–5891. [Google Scholar] [CrossRef] [Green Version]
- Park, S.S.; Cho, S.Y.; Jo, M.R.; Gong, B.J.; Park, J.S.; Lee, S.J. Field evaluation of a near-real time elemental monitor and identification of element sources observed at an air monitoring supersite in Korea. Atmos. Pollut. Res. 2014, 5, 119–128. [Google Scholar] [CrossRef]
- Liang, C.S.; Yu, T.Y.; Lin, W.Y. Source Apportionment of Submicron Particle Size Distribution and PM2.5 Composition during an Asian Dust Storm Period in Two Urban Atmospheres. Aerosol Air Qual. Res. 2015, 15, 2609–2624. [Google Scholar] [CrossRef]
- Lai, L.W. Fine particulate matter events associated with synoptic weather patterns, long-range transport paths and mixing height in the Taipei Basin, Taiwan. Atmos. Environ. 2015, 113, 50–52. [Google Scholar] [CrossRef]
- Paatero, P. User’s Guide for Positive Matrix Factorization Programs PMF2 and PMF3 Part 2: Reference; University of Helsinki: Helsinki, Finland, 2002. [Google Scholar]
- Chang, S.C.; Chou, C.C.K.; Chan, C.C.; Lee, C.T. Temporal characteristics from continuous measurements of PM2.5 and speciation at the Taipei Aerosol Supersite from 2002 to 2008. Atmos. Environ. 2010, 44, 1088–1096. [Google Scholar] [CrossRef]
- Sillanpää, M.; Frey, A.; Hillamo, R.; Pennanen, A.S.; Salonen, R.O. Organic, elemental inorganic carbon in particulate matter of six urban environments in Europe. Atmos. Chem. Phys. 2005, 5, 2869–2879. [Google Scholar] [CrossRef]
- Lee, E.; Chan, C.K.; Paatero, P. Application of positive matrix factorization in source apportionment of particulate pollutants in Hong Kong. Atmos. Environ. 1999, 33, 3201–3212. [Google Scholar] [CrossRef]
- Han, J.S.; Moon, K.J.; Lee, S.J.; Kim, Y.J.; Ryu, S.Y.; Cliff, S.S.; Yi, S.M. Size-resolved source apportionment of ambient particles by positive matrix factorization at Gosan background site in East Asia. Atmos. Chem. Phys. 2006, 6, 211–223. [Google Scholar] [CrossRef] [Green Version]
- Zhao, M.; Zhang, Y.; Ma, W.; Fu, Q.; Yang, X.; Li, C.; Zhou, B.; Yu, Q.; Chen, L. Characteristics and ship traffic sources identification of air pollutants in China’s largest port. Atmos. Environ. 2013, 64, 277–286. [Google Scholar] [CrossRef]
- Okuda, T.; Nakao, S.; Katsuno, M.; Tanaka, S. Source Identification of nickel in TSP and PM2.5 in Tokyo, Japan. Atmos. Environ. 2007, 41, 7642–7648. [Google Scholar] [CrossRef]
- Cao, J.J.; Lee, S.C.; Ho, K.F.; Fung, K.; Chow, J.C. Characterization of roadside fine particulate carbon and its 8 fraction in Hong Kong. Aerosol Air Qual. Res. 2006, 6, 106–122. [Google Scholar] [CrossRef]
- Milando, C.; Huang, L.; Batterman, S. Trends in PM2.5 emissions, concentrations and apportionments in Detroit and Chicago. Atmos. Environ. 2016, 129, 197–209. [Google Scholar] [CrossRef] [PubMed]
- Kundu, S.; Stone, E.A. Composition and sources of fine particulate matter across urban and rural sites in the Midwestern United States. Environ. Sci. Process. Impacts 2014, 16, 1360–1370. [Google Scholar] [CrossRef] [PubMed] [Green Version]


| Date | OC | EC | SO42− | NH4+ | NO3− | Other Anions | Heavy Metals | All Chemical Components | PM2.5 |
|---|---|---|---|---|---|---|---|---|---|
| 8 August | 2.90 | 0.91 | 4.09 | 2.12 | 1.04 | 0.86 | 0.55 | 12.47 | 11.64 |
| 9 August | 2.27 | 0.66 | 3.35 | 1.83 | 0.81 | 0.75 | 0.47 | 10.14 | 9.95 |
| 10 August | 2.30 | 0.69 | 2.98 | 1.71 | 0.73 | 0.67 | 0.39 | 9.46 | 8.95 |
| 11 August | 2.81 | 0.94 | 4.08 | 2.23 | 0.96 | 0.90 | 0.43 | 12.36 | 13.96 |
| 12 August | 3.00 | 0.99 | 5.93 | 2.92 | 1.16 | 0.93 | 0.48 | 15.40 | 16.13 |
| 13 August | 2.88 | 0.84 | 6.92 | 3.36 | 1.17 | 0.93 | 0.43 | 16.52 | 16.96 |
| 14 August | 2.83 | 0.95 | 4.96 | 2.59 | 1.02 | 0.80 | 0.42 | 13.57 | 12.63 |
| 15 August | 2.58 | 1.03 | 3.28 | 1.60 | 0.67 | 0.66 | 0.39 | 10.22 | 11.29 |
| 16 August | 2.44 | 1.07 | 5.37 | 2.50 | 0.99 | 0.70 | 0.37 | 13.44 | 13.21 |
| 17 August | 2.83 | 1.45 | 9.25 | 4.29 | 1.45 | 0.87 | 0.44 | 20.58 | 21.38 |
| 18 August | 3.46 | 1.30 | 9.68 | 4.55 | 1.51 | 0.87 | 0.51 | 21.89 | 21.67 |
| 19 August | 3.96 | 1.07 | 11.72 | 5.49 | 1.91 | 0.85 | 0.49 | 25.50 | 27.13 |
| 20 August | 3.15 | 0.73 | 8.44 | 3.80 | 0.88 | 0.69 | 0.40 | 18.10 | 18.50 |
| 21 August | 1.29 | 0.51 | 3.68 | 1.71 | 0.47 | 0.93 | 0.14 | 8.73 | 6.54 |
| 22 August | 1.10 | 0.26 | 0.62 | 0.48 | 0.28 | 1.33 | 0.07 | 4.14 | 5.25 |
| 23 August | 1.62 | 0.70 | 1.78 | 0.96 | 0.62 | 0.69 | 0.12 | 6.50 | 6.75 |
| 24 August | 2.74 | 1.06 | 4.35 | 2.06 | 1.04 | 0.68 | 0.50 | 12.42 | 13.41 |
| 25 August | 2.04 | 0.62 | 2.81 | 1.47 | 0.06 | 0.55 | 0.16 | 7.72 | 8.50 |
| 26 August | 1.29 | 0.19 | 0.73 | 0.55 | 0.02 | 0.45 | 0.10 | 3.33 | 2.63 |
| 27 August | 2.21 | 0.50 | 4.23 | 2.16 | 0.06 | 0.54 | 0.19 | 9.90 | 13.22 |
| 28 August | 1.69 | 0.43 | 2.90 | 1.44 | 0.50 | 0.54 | 0.21 | 7.70 | 7.63 |
| 29 August | 1.11 | 0.36 | 1.97 | 1.22 | 0.35 | 0.51 | 0.09 | 5.61 | 3.96 |
| 30 August | 1.06 | 0.37 | 2.45 | 1.50 | 0.40 | 0.70 | 0.09 | 6.56 | 4.43 |
| Mean | 2.33 | 0.77 | 4.59 | 2.28 | 0.79 | 0.76 | 0.32 | 11.84 | 11.99 |
| Percent | 19.7% | 6.5% | 38.8% | 19.3% | 6.7% | 6.4% | 2.7% | 100% (98.75%) | |
| Factor | Major Characteristic Species | Possible Emission Sources | Contribution Percentage (%) |
|---|---|---|---|
| Factor 1 | NO3−, EC, SO42−, OC | Diesel vehicle exhaust Exhaust emissions | 32.8% |
| Factor 2 | Na+, Cl−, Mg2+, Ca2+ | Sea salt spray | 5.0% |
| Factor 3 | Co, V, As, Ga, Se | Boiler combustion | 3.9% |
| Factor 4 | NH4+, SO42−, Ni, Ba | NH4+, NO3− Emissions transported from large-scale pollution sources | 40.0% |
| Factor 5 | Cr, Ca, Zn, Cu, Fe, Mn | Crustal elements, street dust | 3.2% |
| Factor 6 | OC, EC, Au, Hg, Pb | Gasoline vehicle exhaust | 15.1% |
| Total | 100.0% | ||
© 2018 by the authors. Licensee MDPI, Basel, Switzerland. This article is an open access article distributed under the terms and conditions of the Creative Commons Attribution (CC BY) license (http://creativecommons.org/licenses/by/4.0/).
Share and Cite
Ho, W.-Y.; Tseng, K.-H.; Liou, M.-L.; Chan, C.-C.; Wang, C.-h. Application of Positive Matrix Factorization in the Identification of the Sources of PM2.5 in Taipei City. Int. J. Environ. Res. Public Health 2018, 15, 1305. https://doi.org/10.3390/ijerph15071305
Ho W-Y, Tseng K-H, Liou M-L, Chan C-C, Wang C-h. Application of Positive Matrix Factorization in the Identification of the Sources of PM2.5 in Taipei City. International Journal of Environmental Research and Public Health. 2018; 15(7):1305. https://doi.org/10.3390/ijerph15071305
Chicago/Turabian StyleHo, Wen-Yuan, Kuo-Hsin Tseng, Ming-Lone Liou, Chang-Chuan Chan, and Chia-hung Wang. 2018. "Application of Positive Matrix Factorization in the Identification of the Sources of PM2.5 in Taipei City" International Journal of Environmental Research and Public Health 15, no. 7: 1305. https://doi.org/10.3390/ijerph15071305