1. Introduction
Water is the foundation for all life on earth. Water quality influences the environment greatly within a watershed ecological system [
1]. A large amount of non-point source pollutants enter water-bodies through the process of runoff and groundwater migration, which are caused by human activities and urbanization and industrialization activities such as deforestation and excessive consumption of fertilizers. Water quality degradation threatens the whole ecosystem and human health [
2].
According to the source of pollutants, we divide water pollution into two types: point source pollution and non-point source pollution [
3]. The quantified monitoring of non-point source pollution is more difficult to conduct than point source pollution, due to the wide range of source of non-point source pollution. Hence, non-point source pollution becomes the dominant reason for water quality deterioration in watersheds gradually [
4]. Non-point source pollution in river basins becomes more harmful mainly due to human activities, such as excessive fertilization and discharged livestock excrement. Landscape patterns have great influence on non-point source pollution from the perspective of pollutants transmission [
5]. Non-point source pollutants transfer from their source to a river within the streams, and in this process, these pollutants go through various landscapes. Some landscapes can inhibit and absorb non-point source pollutants and can be categorized as sink landscapes, whereas other landscapes contribute substantially to pollutants and can be called source landscapes [
6]. Consequently, various source-sink landscape patterns have different impacts on the load of non-point source pollution [
7].
Remotely sensed data has gradually become a fundamental data source for landscape research due to the remarkable advantages of these data, as they are multitemporal, multiresolution and synchronous observations [
8]. Jorgenson pointed out that the development of remote sensing techniques based on a growing array of satellite and airborne platforms that cover a wide range of spatial and temporal scales increasingly allows robust detection of landscape pattern changes [
9]. Information about landscape patterns of a research area can be obtained accurately through the comprehensive use of multisensory remote sensing data [
10]. Remote sensing techniques can be employed to study the impacts of landscape patterns on the non-point source pollution loads [
11].
According to the classification standard of land use and non-point source pollution, combined with the practical situation of Jiulong River basin, we drafted a classification scheme of the source-sink landscape and analyzed the dynamic changes in the source-sink landscape after extracting the land use information of multitemporal landscape patterns of the study area [
12]. Various landscape metrics, such as Largest Patch Index (LPI), Landscape Shape Index (LSI), Mean Nearest Neighbor Distance (ENN_MN), Interspersion and Juxtaposition Index (IJI), Area Weighted Mean Shape Index (AWMSI), Number of Patches (NP), Patch Density (PD) and Aggregation Index (AI), were calculated to analyze the change in spatial structure in Jiulong River basin during the years of the study. However, these metrics characterized the spatial distribution and fragmentation degree of the landscape and they were not of ecological significance, thus an additional integrated research method was needed to analyze the impact of landscape patterns on specific ecological processes.
A location-weighted landscape contrast index (LCI) based on the theory of “pattern and process” which was mainly focused on the correlation between landscape pattern and certain ecological process in landscape ecology was proposed to evaluate the effect of landscape pattern on non-point source pollution loads [
13]. LCI is scale independent and it can characterize the relative contribution of landscape pattern to a specific monitoring point, and the value is positively correlated with the contribution. Based on the spatial load contrast index, Jiang put forward grid landscape contrast index (GLCI) which reflected the contribution of landscape in each grid to non-point source pollution [
14]. However, in the former studies, only surface distance, slope and relative height were taken into account in the calculation of LCI, which was obviously not comprehensive. An improved LCI model was constructed, taking more geographical factors into account, such as soil moisture, soil texture, land use types and annual precipitation [
15]. The hydrological response unit (HRU) with a single land use and soil type was applied as the smallest study unit in this paper. The location-weighted landscape contrast index was computed on the basis of the minimum hydrological response unit in this study (HRULCI). The impact of land use change on non-point source pollution was analyzed through the integrated analysis of landscape-pattern changes and multitemporal HRULCI values [
16]. The objective of this paper is to analyze the correlation between dynamic spatial distribution of landscape and change on load of non-point source pollution. The calculation results can be applied in the manipulation of future landscape pattern for the sustainable development in Jiulong River basin.
2. Study Areas and Data Sources
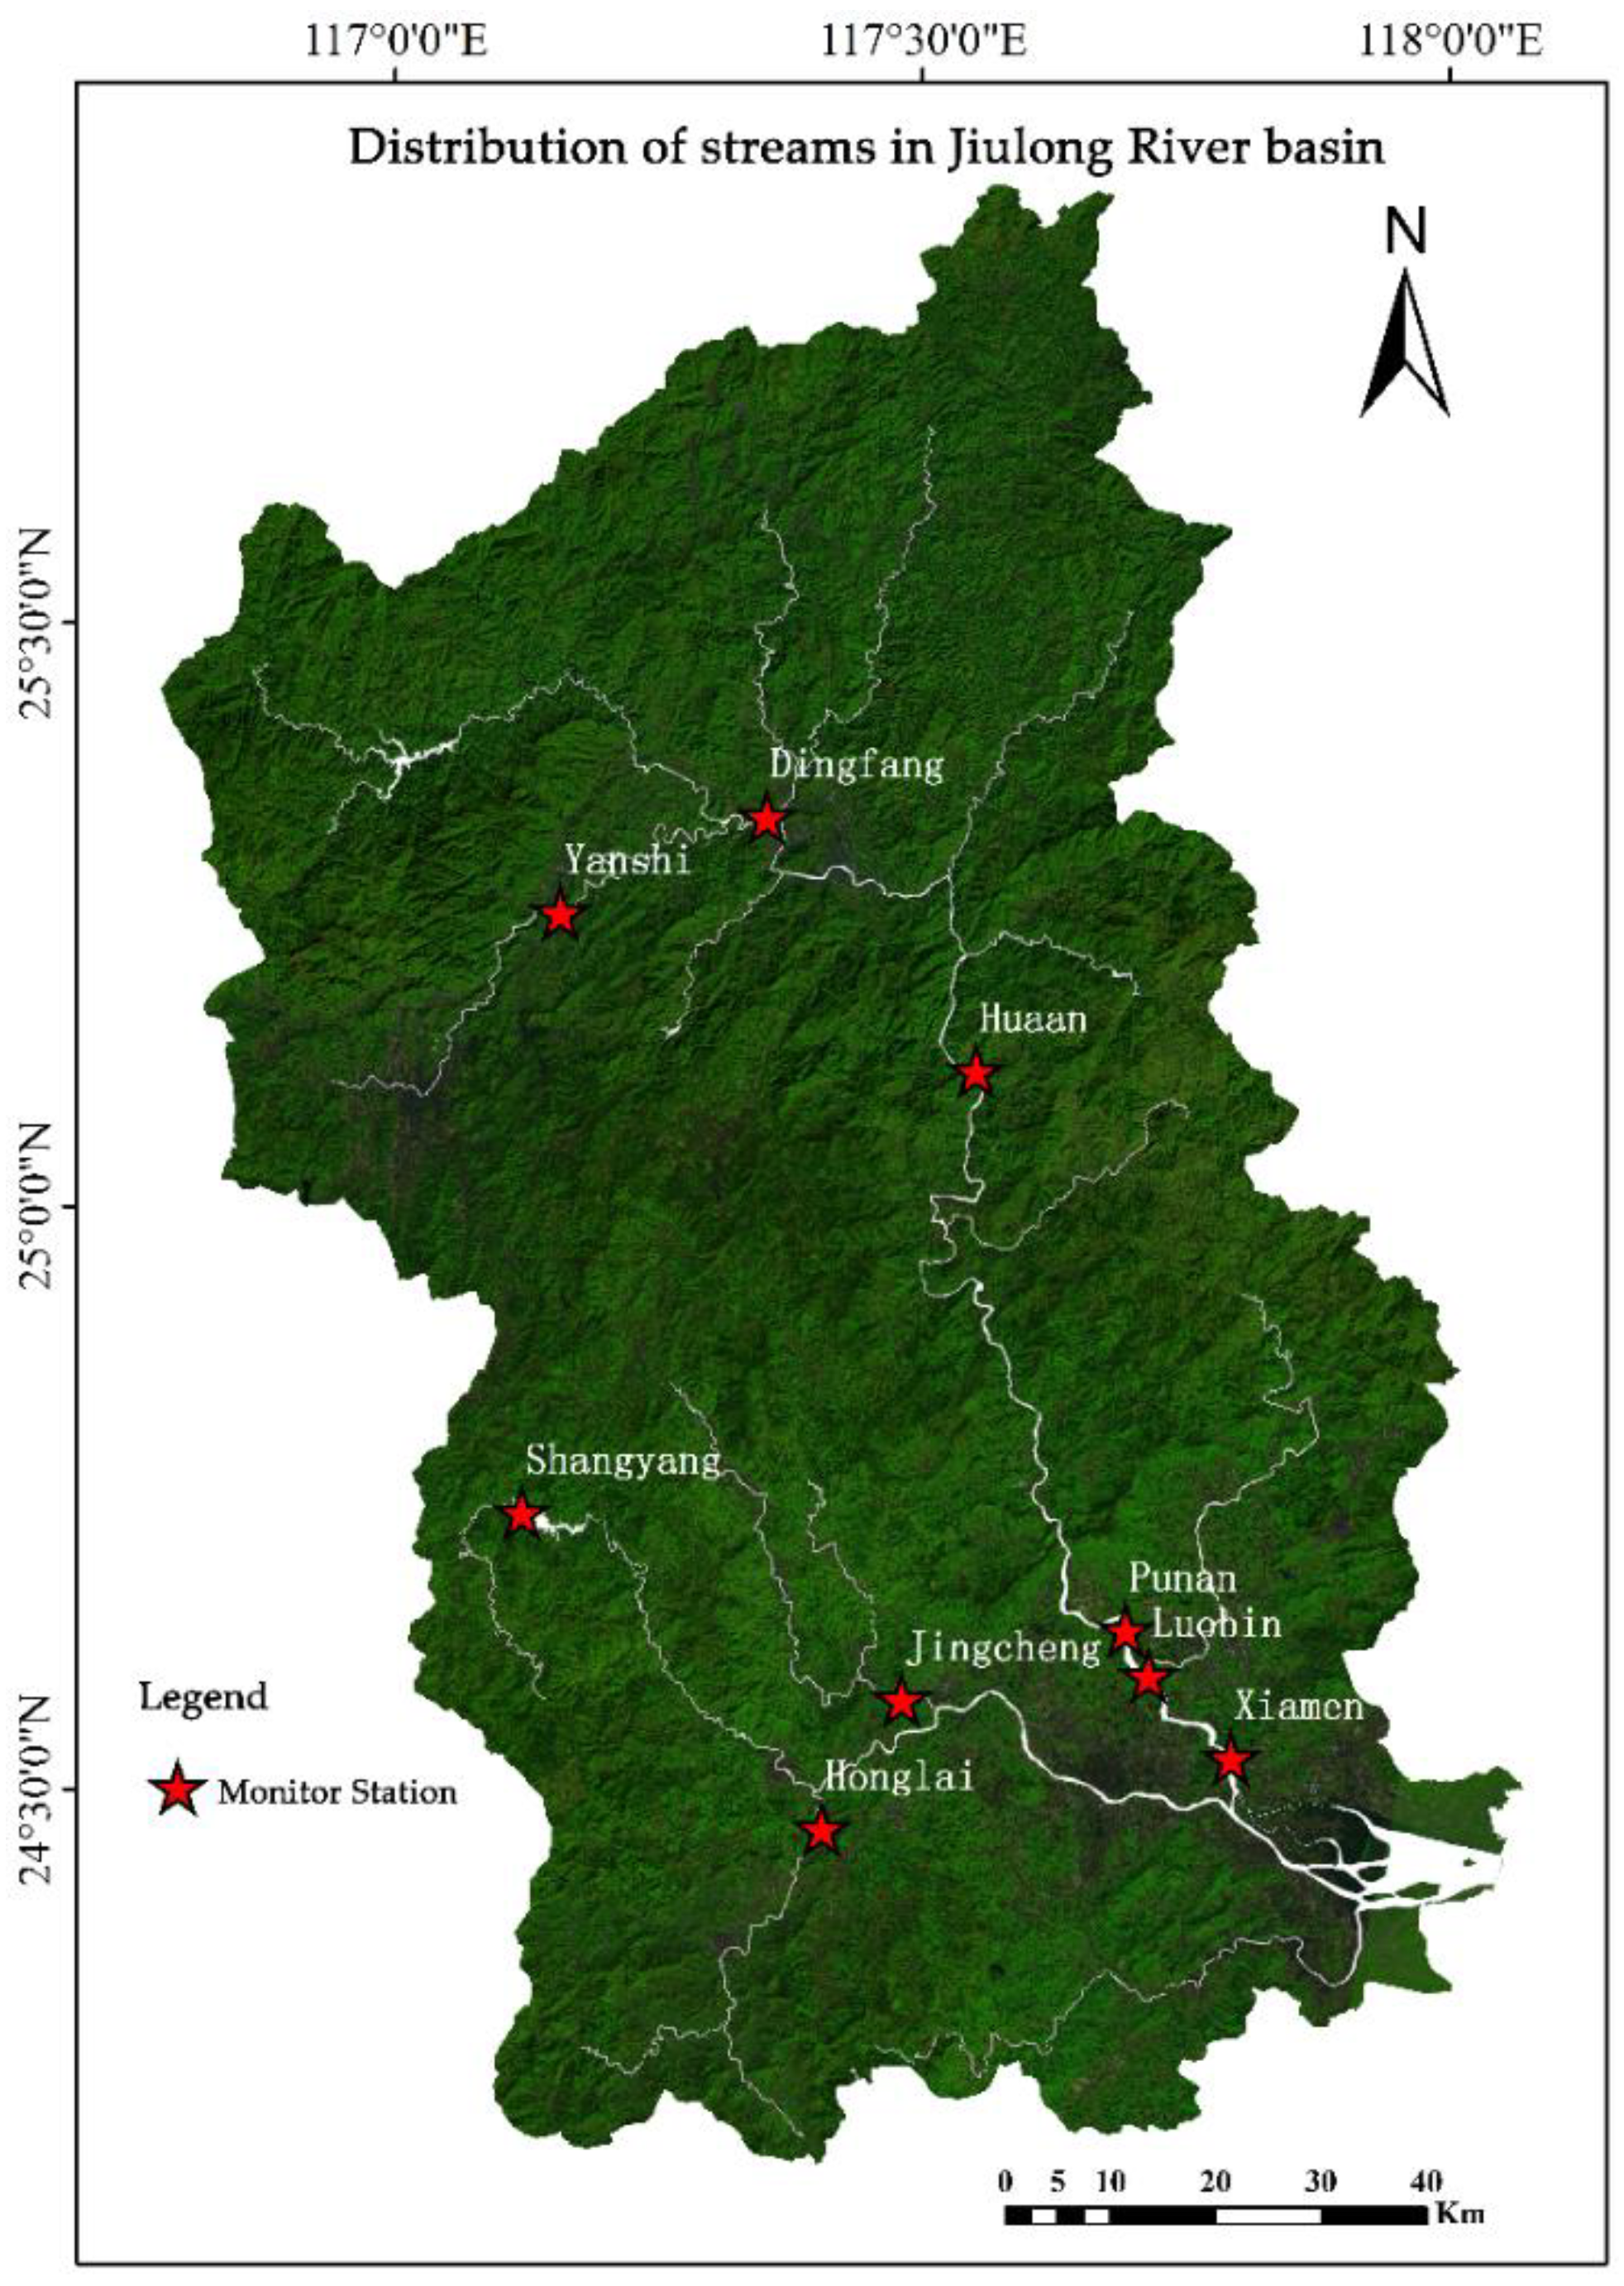
Jiulong River basin located in southeast of China was selected as the research area. This basin covers an area of 14,745 km
2 bounded between 116°47′ E to 118°02′ E and 24°13′ N to 25°51′ N [
17]. Landscape patterns have changed recently due to the urbanization and industrialization during the study period (from 2005 to 2017). Vegetative cover has been damaged from overexploitation of resources, such as the exploration of mineral resources and the rapid increase of cultivated land [
18], resulting in severe soil erosion in some areas [
19]. Animal husbandry has been developed in the drainage area, and the excrements of livestock cause serious water pollution. Construction of many hydropower stations without considering the ecological capacity of Jiulong River affects the water purification capacity of the river [
20]. Many factors have led to the deterioration of the river from non-point source pollution, and water quality degradation has an impact on production activities in Jiulong River basin [
15].
Figure 1 displayed the coverage of the Jiulong River basin.
Landsat TM/OLI remote sensing images were selected as the fundamental data sets in this study [
21], and
Table 1 displays the time when the images were acquired. A digital elevation model (DEM) of this area with a resolution of 30 m was downloaded from ASTER GDEM [
8]. Soil type data were 1:1,000,000 and provided by the Institute of Soil Science for the Second National Land Investigation, and the main soil classification system was FAO-90. Annual average precipitation data were obtained from the National Meteorological Data Sharing Platform. The consumption data of fertilizers were acquired from statistical yearbooks of different years for Fujian Province.
4. Results and Discussion
4.1. Land Use Change Analysis
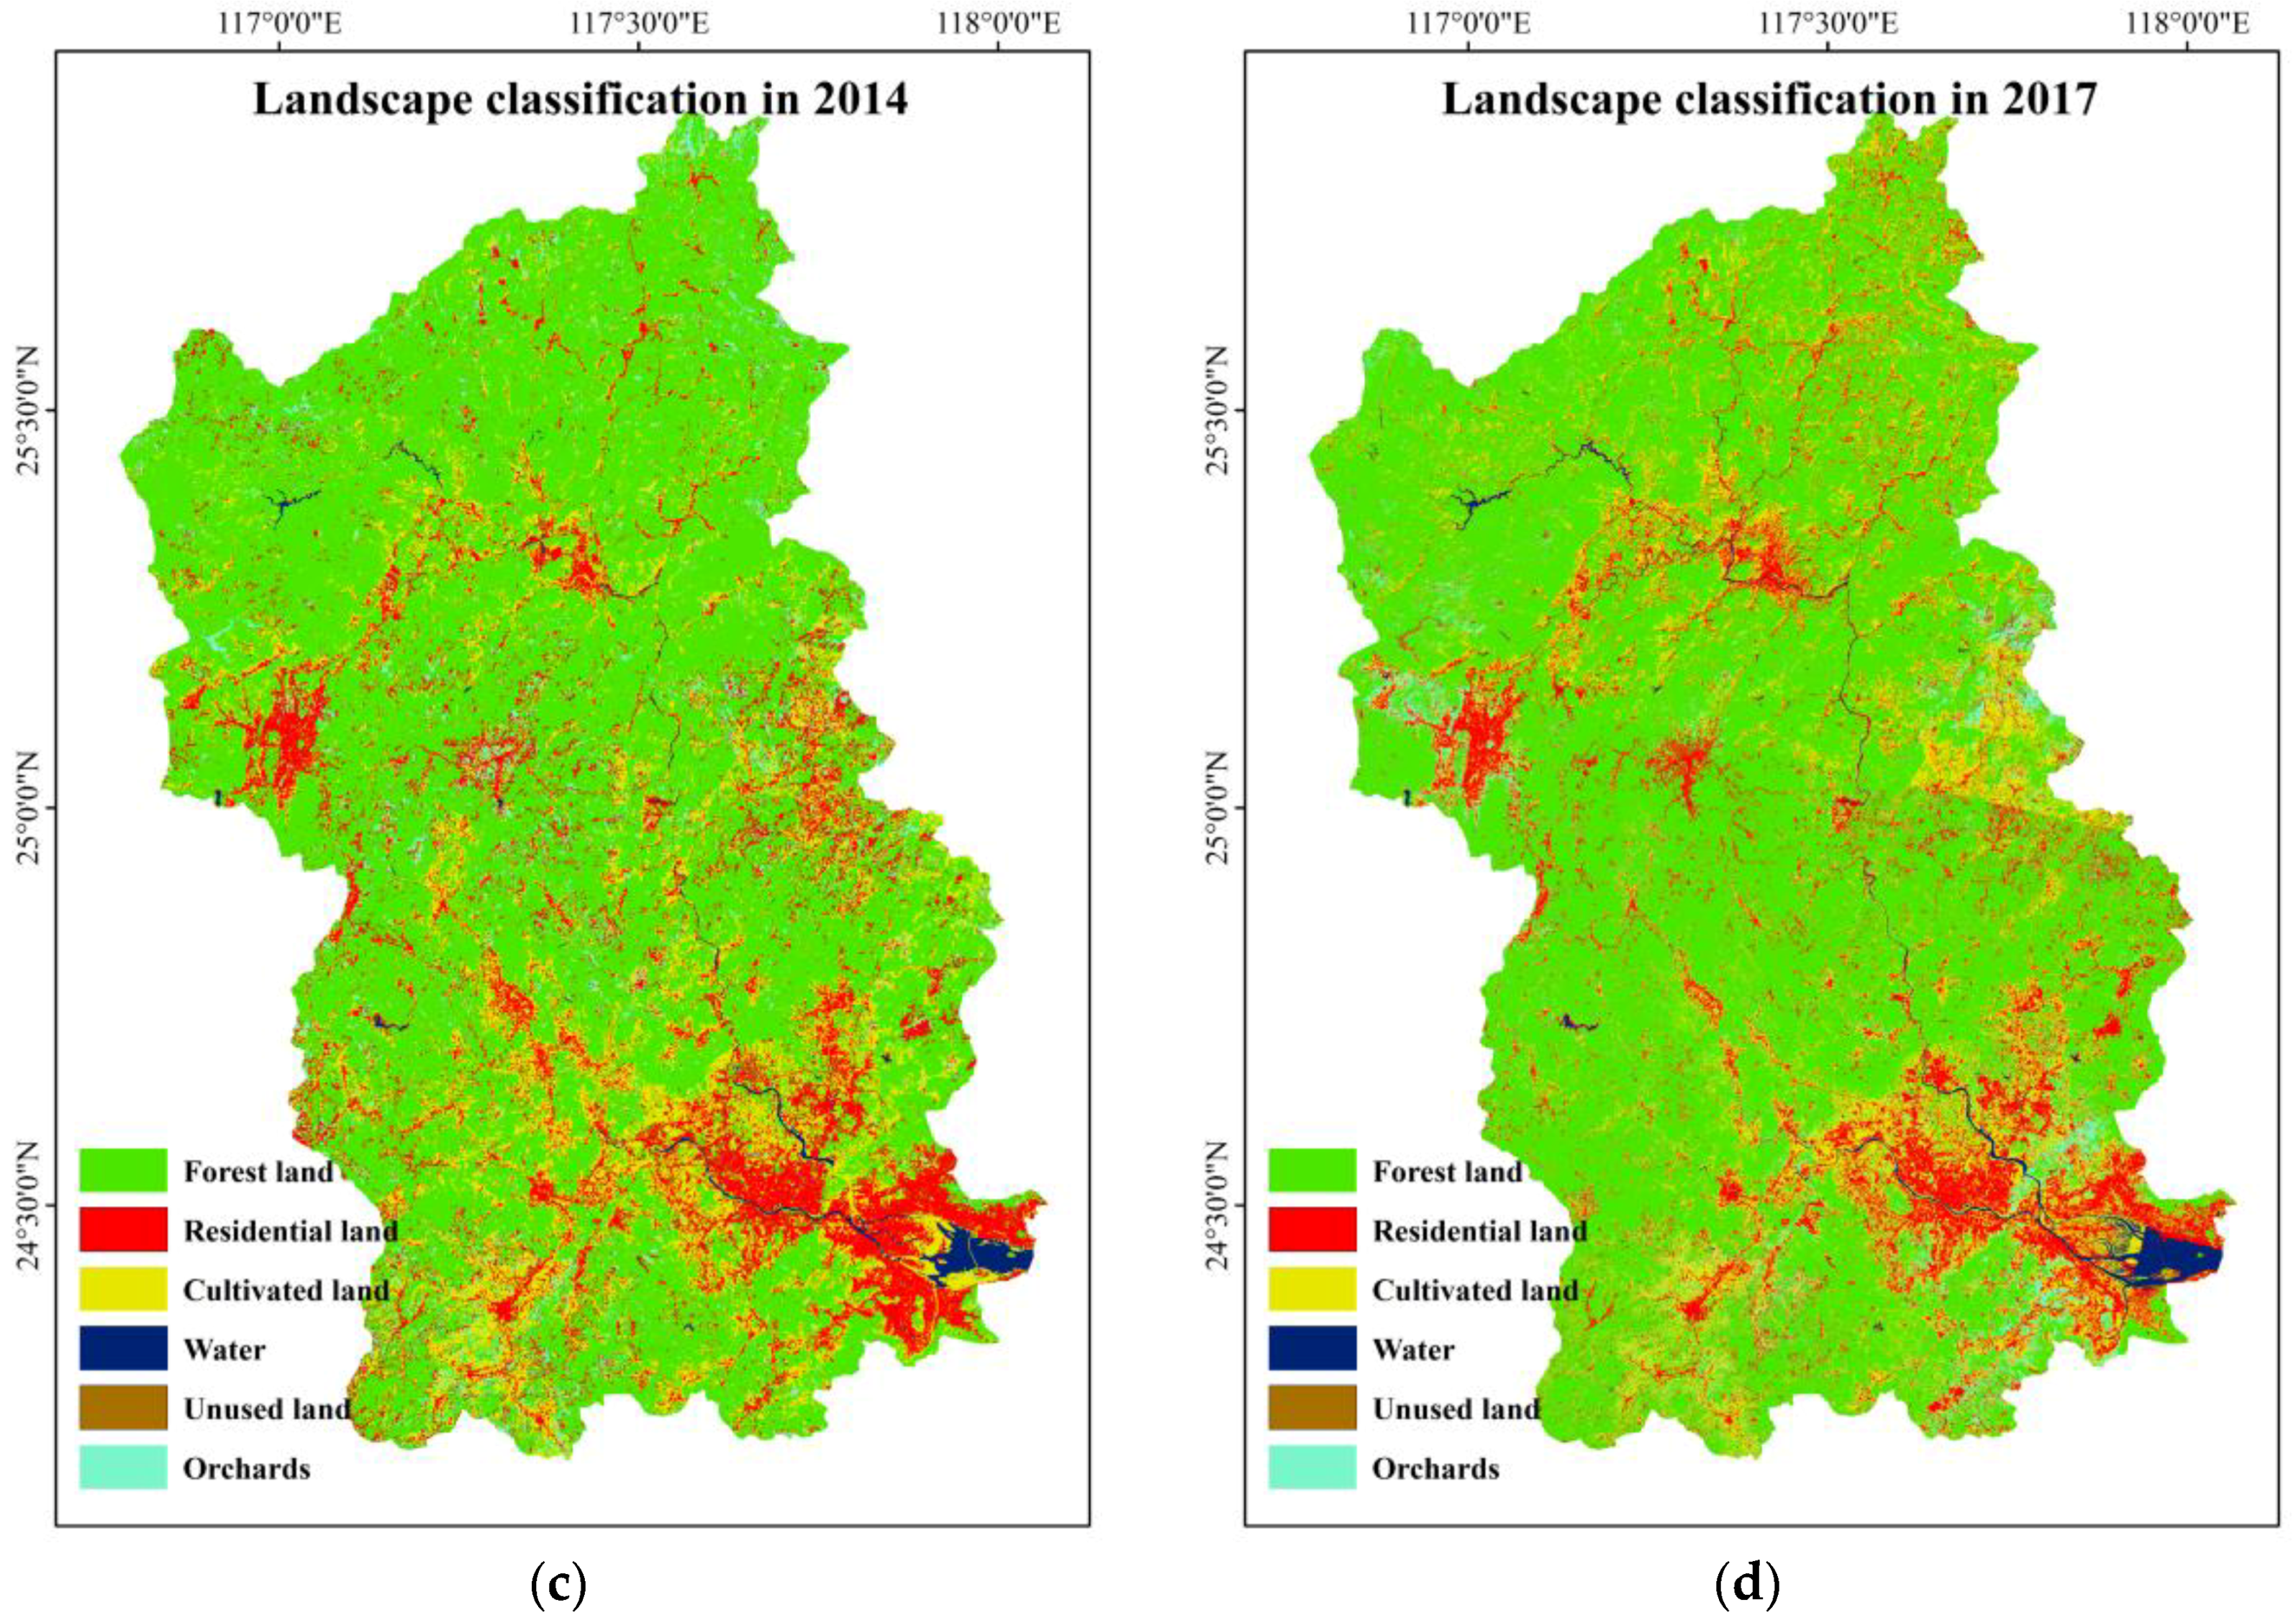
Land use area changes during the experimental period are displayed in
Figure 5. Comparing the area of the various landscapes in different years, we made a few basic conclusions.
The area of forestland increased slightly, but the growth was not obvious given its large area. Cultivated land showed a decreasing trend, especially from 2010 to 2014, and its area decreased rapidly, which could be result of effective implementation of the Grain to Green policy in Jiulong River basin [
27]. The area of water showed a significant decreasing trend during the study, which indicated a decrease in water resources in Jiulong River basin. While extracting the distribution of the water system in Jiulong River basin, the drainage system contracted, which was due to the narrowing of part of the river channels and the reduction of reservoir areas.
The area of residential land grew obviously from 2005 to 2017, indicating further urbanization in Jiulong River basin. We inferred that the main reason for the increase in area increase residential land was the increase in residential land area.
The area of orchards decreased slightly after a rapid increase during 2005–2010. The reduction was caused by the orchards to forestland policy adopted in Jiulong River basin. In some areas with a severe loss of water and soil, this reduction was particularly obvious.
The area of unused land decreased throughout the study period, which indicated an increasing extent of land use in Jiulong River basin. The destruction of natural landscapes such as forestland and water in the earlier stages of human activities led to a large number of unused land. However, with the improvements in human activities and the enhancement value of land, unused land has been utilized gradually and has been transferred to other land use types.
4.2. Landscape Metrics Results
The calculated landscape indexes are displayed in
Table 6.
On the basis of
Table 6, NP showed an obvious increasing trend from 2010 to 2017, after a decrease during 2005–2010. PD presented a similar trend, and both NP and PD increased overall. We inferred that this phenomenon was a consequence of the enhanced landscape fragmentation degree caused by the human activities in Jiulong River basin.
LPI remained stable during 2005–2017, which indicated that the abundance of the dominant landscape, forestland, was not substantially disturbed. Human activities had minimal impacts on forestland, and the area of forestland remained stable in the study years.
LSI characterized the shape of the landscape, and a higher LSI indicated a more complicated landscape shape [
12]. LSI decreased during 2005–2014 and then increased rapidly during 2014–2017, and in 2017, LSI was much larger than it was in 2005. The change trend showed that the landscape pattern tended to be complex after a trend of being simple. Analyzing this trend combined with land use changes, this phenomenon was due to the rapid increase in residential land area during 2014–2017, which destroyed the original landscape pattern.
AWMSI had a trend similar to LSI. The increase in LSI reflected the complexity of landscape shape, while the increasing AWMSI indicated a more enhanced edge effect of the landscape [
28]. Enhanced edge effects made pollutants transmission among various source-sink landscapes easier.
ENN_MN had change characteristics similar to IJI, which increased first and then decreased. ENN_MN and IJI reflect the neighboring distance and distribution of the same landscape type, respectively. ENN_MN and IJI measure the distribution of adjacencies among patch types. The trend of decreasing after increasing showed the concentrated tendency within the same landscape type [
23]. We speculated that the trend was due to the significant increase in forestland and residential land after 2010 with a combination of land use change information, and the increased area of the dominant landscape, forestland, led to a decrease in the index, while the expansion of residential land was based on the existing residential land. Hence, ENN_MN and IJI decreased in residential land as well.
AI which was class specific measured the aggregation in landscape pattern [
29]. He stated that AI was the quantitative basis to correlate spatial patterns with the process which were class specific [
30]. AI presented a slow upward trend during 2005–2010 but fell rapidly after 2014, indicating a decreasing overall landscape polymerization degree. This result was consistent with those for NP and PD, and the extent of landscape fragmentation increased, while the degree of landscape polymerization decreased.
4.3. Analysis of HRULCI Changes
The results of the HRULCI of Jiulong River basin in 2005, 2010, 2014 and 2017 are shown in
Figure 6.
The results of HRULCI show that numerically higher areas were concentrated in cultivated land use because cultivated land was covered with less vegetation, and soil texture was loose; therefore, soil erosion and nutrient loss on the cultivated land were more severe [
13]. Additionally, the application of fertilizers resulted in cultivated land playing an important role as a source of non-point source pollution.
The mid-range values were concentrated in residential land and orchards. Residential land with a low vegetation cover ratio was mostly impervious to water. Soil erosion and nutrients were not obvious in residential land, but the garbage produced by residents contributed substantial non-point source pollutants. Hence, the HRULCI of residential land was second only to that of cultivated land. Compared with soil on cultivated land, soil in orchards was more compact, and the soil and water conservation function of fruit trees was stronger than crops, yielding a smaller HRULCI value in orchards than in cultivated lands. HRULCIs in the above two land use types were higher than 1, indicating that orchards and cultivated land enabled the transmission of non-point source pollutants.
Chen pointed the view that a smaller LCI represents greater inhibition capacity [
13]. Values of HRULCI in forestland were lowest because of the high vegetation cover rate and strong capacity to conserve water and soil. HRULCI was lower than 1, indicating that forestland inhibited the transmission of non-point source pollution.
4.4. Discussion
Compared to the traditional non-point source pollution model (SWAT, AGNPS, GLEAMS, etc.), this paper evaluated the relationship between landscape pattern and non-point source pollution from another perspective. The calculation result of the traditional non-point source pollution model is always a fixed value, which was used to estimate the non-point source pollution load in the study area [
31,
32,
33]. But there are some disadvantages in these methods, specifically, a numerical result can not reflect the spatial difference of non-point source pollution load inside the study area. For example, in the same study area, the non-point source pollution load may be similar in different years, but the internal landscape pattern may have been greatly changed, and the traditional non-point source pollution model calculation results can not reflect this phenomenon. Based on the above reasons, this paper changes the quantitative calculation method of the nonpoint source pollution load, and evaluates the relationship between the different source and sink patterns on the transmission process of non-point source pollutants. Compared with the traditional non-point source model, the proposed method can be simpler to show the influence of different landscape regions on the transport of non-point source pollutants in the study area, and the calculation results can effectively show the spatial difference of the non-point source pollution in different regions of the study area.
The analysis of changes of land use types is not associated with the ecological processes, and this method is insufficient to measure the effects of landscape pattern on load of non-point source pollution in this paper. HRU with a single land use and soil type was taken as the minimum research scale in this study, HRULCI was thus of ecological significance. Jiang established GLCI to reflect the contribution of landscape in a certain space to non-point source pollution [
14]. Compared to the artificial division grid with a fixed size, the land use and soil types are homogeneity in the same HRU. The landscape pattern was related with ecological processes effecting non-point source pollution by constructing HRUs. When researchers take the grid unit as the minimum research scale, the scale effect should be noted and it should be verified whether the grid unit is appropriate for the research. While the use of minimum HRU as the minimum research scale can avoid the uncertainty of research scale.
5. Conclusions
In this paper, we analyzed the change of land use portions in Jiulong River basin and calculated eight traditional landscape metrics in 2005, 2010, 2014 and 2017. The area of residential land and orchards increased rapidly, while unused land and water decreased, which reflected the imbalanced migration between source and sink landscapes. Landscape metrics quantify and characterize spatial structure of landscape pattern. These metrics reflect the fragmentation extent and configuration features of the study area, and explain some of the variation in water quality not explained by land use portions [
8], while they are not linked with specific ecological process [
34]. It was concluded from the calculation results of landscape metrics that the overall landscape pattern of Jiulong River basin tended to be more fragmented.
An HRULCI with ecological significance and multiscale suitability was applied to qualitatively analyze the different effects of various landscapes on the transmission of non-point source pollutants. HRU with a single land use and soil type was used as the minimum unit for the calculation of the improved location-weighted landscape contrast index in this paper. The calculated results of HRULCI are important for two reasons. On the one hand, areas with a high HRULCI should be the key management areas, and decreases in the HRULCIs in such areas will be beneficial for controlling non-point source pollution. On the other hand, changes in a source-sink landscape within a watershed can be obtained by analyzing changes in the HRULCI over a certain time gradient. Increases in HRULCI values indicate the dominant status of source landscape in a drainage area and vice versa. Analyzing the HRULCI in a watershed is the foundation for studying source-sink landscape changes and predicting the change trend of a landscape in a river basin.


