1. Introduction
Despite considerable improvement in prevention, management, and regulation, air pollution remains a leading environmental health issue worldwide. From a recent air quality model, the World Health Organization (WHO) estimates that 92% of the global population lives in places where air quality levels exceed WHO limits [
1]. Air pollution has been identified as a health priority in the sustainable development agenda. Clean air is one of the fundamental requirements for human health and well-being [
2].
While the increased risk of air pollution to health is relatively low compared to other risk factors, the total number of people affected is significant. According to the Organization for Economic Cooperation and Development [
3], air pollution is known to be the main environmental cause of “premature” death. In 2012, WHO estimated from Global Health Observatory data that ambient air pollution contributed to 5.4% of all deaths worldwide [
4]. However, while most studies have focused on estimating a relationship between pollution and health, less attention has been given to the differential health effects of air pollution according to the socioeconomic status, measured at individual and/or neighborhood levels [
5,
6]. Identifying population subgroups that are the most vulnerable to the effects of air pollution remains a public health research concern. Recent studies have suggested that several contextual or individual characteristics (such as gender and socioeconomic position, for example) could modify the association between exposure and mortality. Chen et al. in 2005 [
7] found a significant increase of coronary death risk with PM
2.5 exposure in women only, while Deguen et al. in 2015 [
5] revealed a stronger association between short term variations of NO
2 concentrations and all-cause mortality for subjects living in areas with low socioeconomic status.
Today, to support environmental policies aiming to tackle air pollution, quantitative health impact assessments (HIAs) stand out as one of the best decision-making tools, because they provide valuable information regarding the future health effects of a potential plan or policy. HIAs are already routinely used by the U.S. Environmental Protection Agency [
8] in order to revise national ambient air quality standards. For instance, an increase in life expectancy of 0.61 years associated with a reduction of 10 μg/m
3 in PM was estimated in the U.S. by Pope et al. in 2009 [
9].
A study conducted in the Lausanne-Morges [
10] urban area in Switzerland quantified the reduction in “premature” deaths due to air pollution reduction over a period of 10 years, and estimated a decrease of 1% to 2% of total all-cause annual deaths. In two French areas (the Grenoble and Lyon areas) [
11], a recent study estimated at census block level that about 3–8% of deaths and 3–10% of lung cancer cases were attributable to PM
2.5 exposure [
11]. An HIA was also recently used to evaluate the health and economic impacts of a potential public transportation modification in terms of proposed fare increases and service cuts conducted in the U.S. state of Massachusetts [
12]. To our knowledge, only a few epidemiological studies have investigated the health impact of reducing air pollution according to socioeconomic deprivation measured at a small spatial scale [
13,
14], ignoring within-city variations of air pollutants. In addition, in order to build efficient policies, it is crucial to establish a full and detailed socioeconomic and health-related assessment at the local scale and identify the categories of citizens who have multiple risk factors. However, no risk assessment studies have quantified or mapped the health impact of air pollution reduction at a small spatial scale to develop targeted policies, and more specifically, environmental policies. This study attempts to remedy this by developing a novel small-area approach combining an HIA and the clustering approach to map the health impact by socioeconomic deprivation level, and to investigate the equity impact of a reduction of ambient NO
2, PM
10, and PM
2.5 concentrations.
In this context, this study has two objectives. First, we will estimate the number of “premature” deaths among an adult population older than 30 years associated with a reduction of NO
2, PM
10, and PM
2.5 concentrations at the census block level in Paris, based on the counterfactual method [
11]. Second, we will investigate the spatial distribution of the estimates number of “premature” deaths using a clustering approach to quantify how the number of “premature” deaths could vary according to neighborhood socioeconomic deprivation status measured at census block level.
4. Discussion
In this study, we developed a small-area analysis of the impact of air pollution on “premature” death to quantify and map the health and equity impact related to a reduction of air pollution. We evaluated the health impact of hypothetical air pollution reductions according to WHO recommendations. This allowed us to estimate at a small-area level the rate of “premature” deaths attributable to NO2, PM10, and PM2.5 taking into account the level of socioeconomic deprivation, and to visualize the spatial distribution of the risk of “premature” deaths.
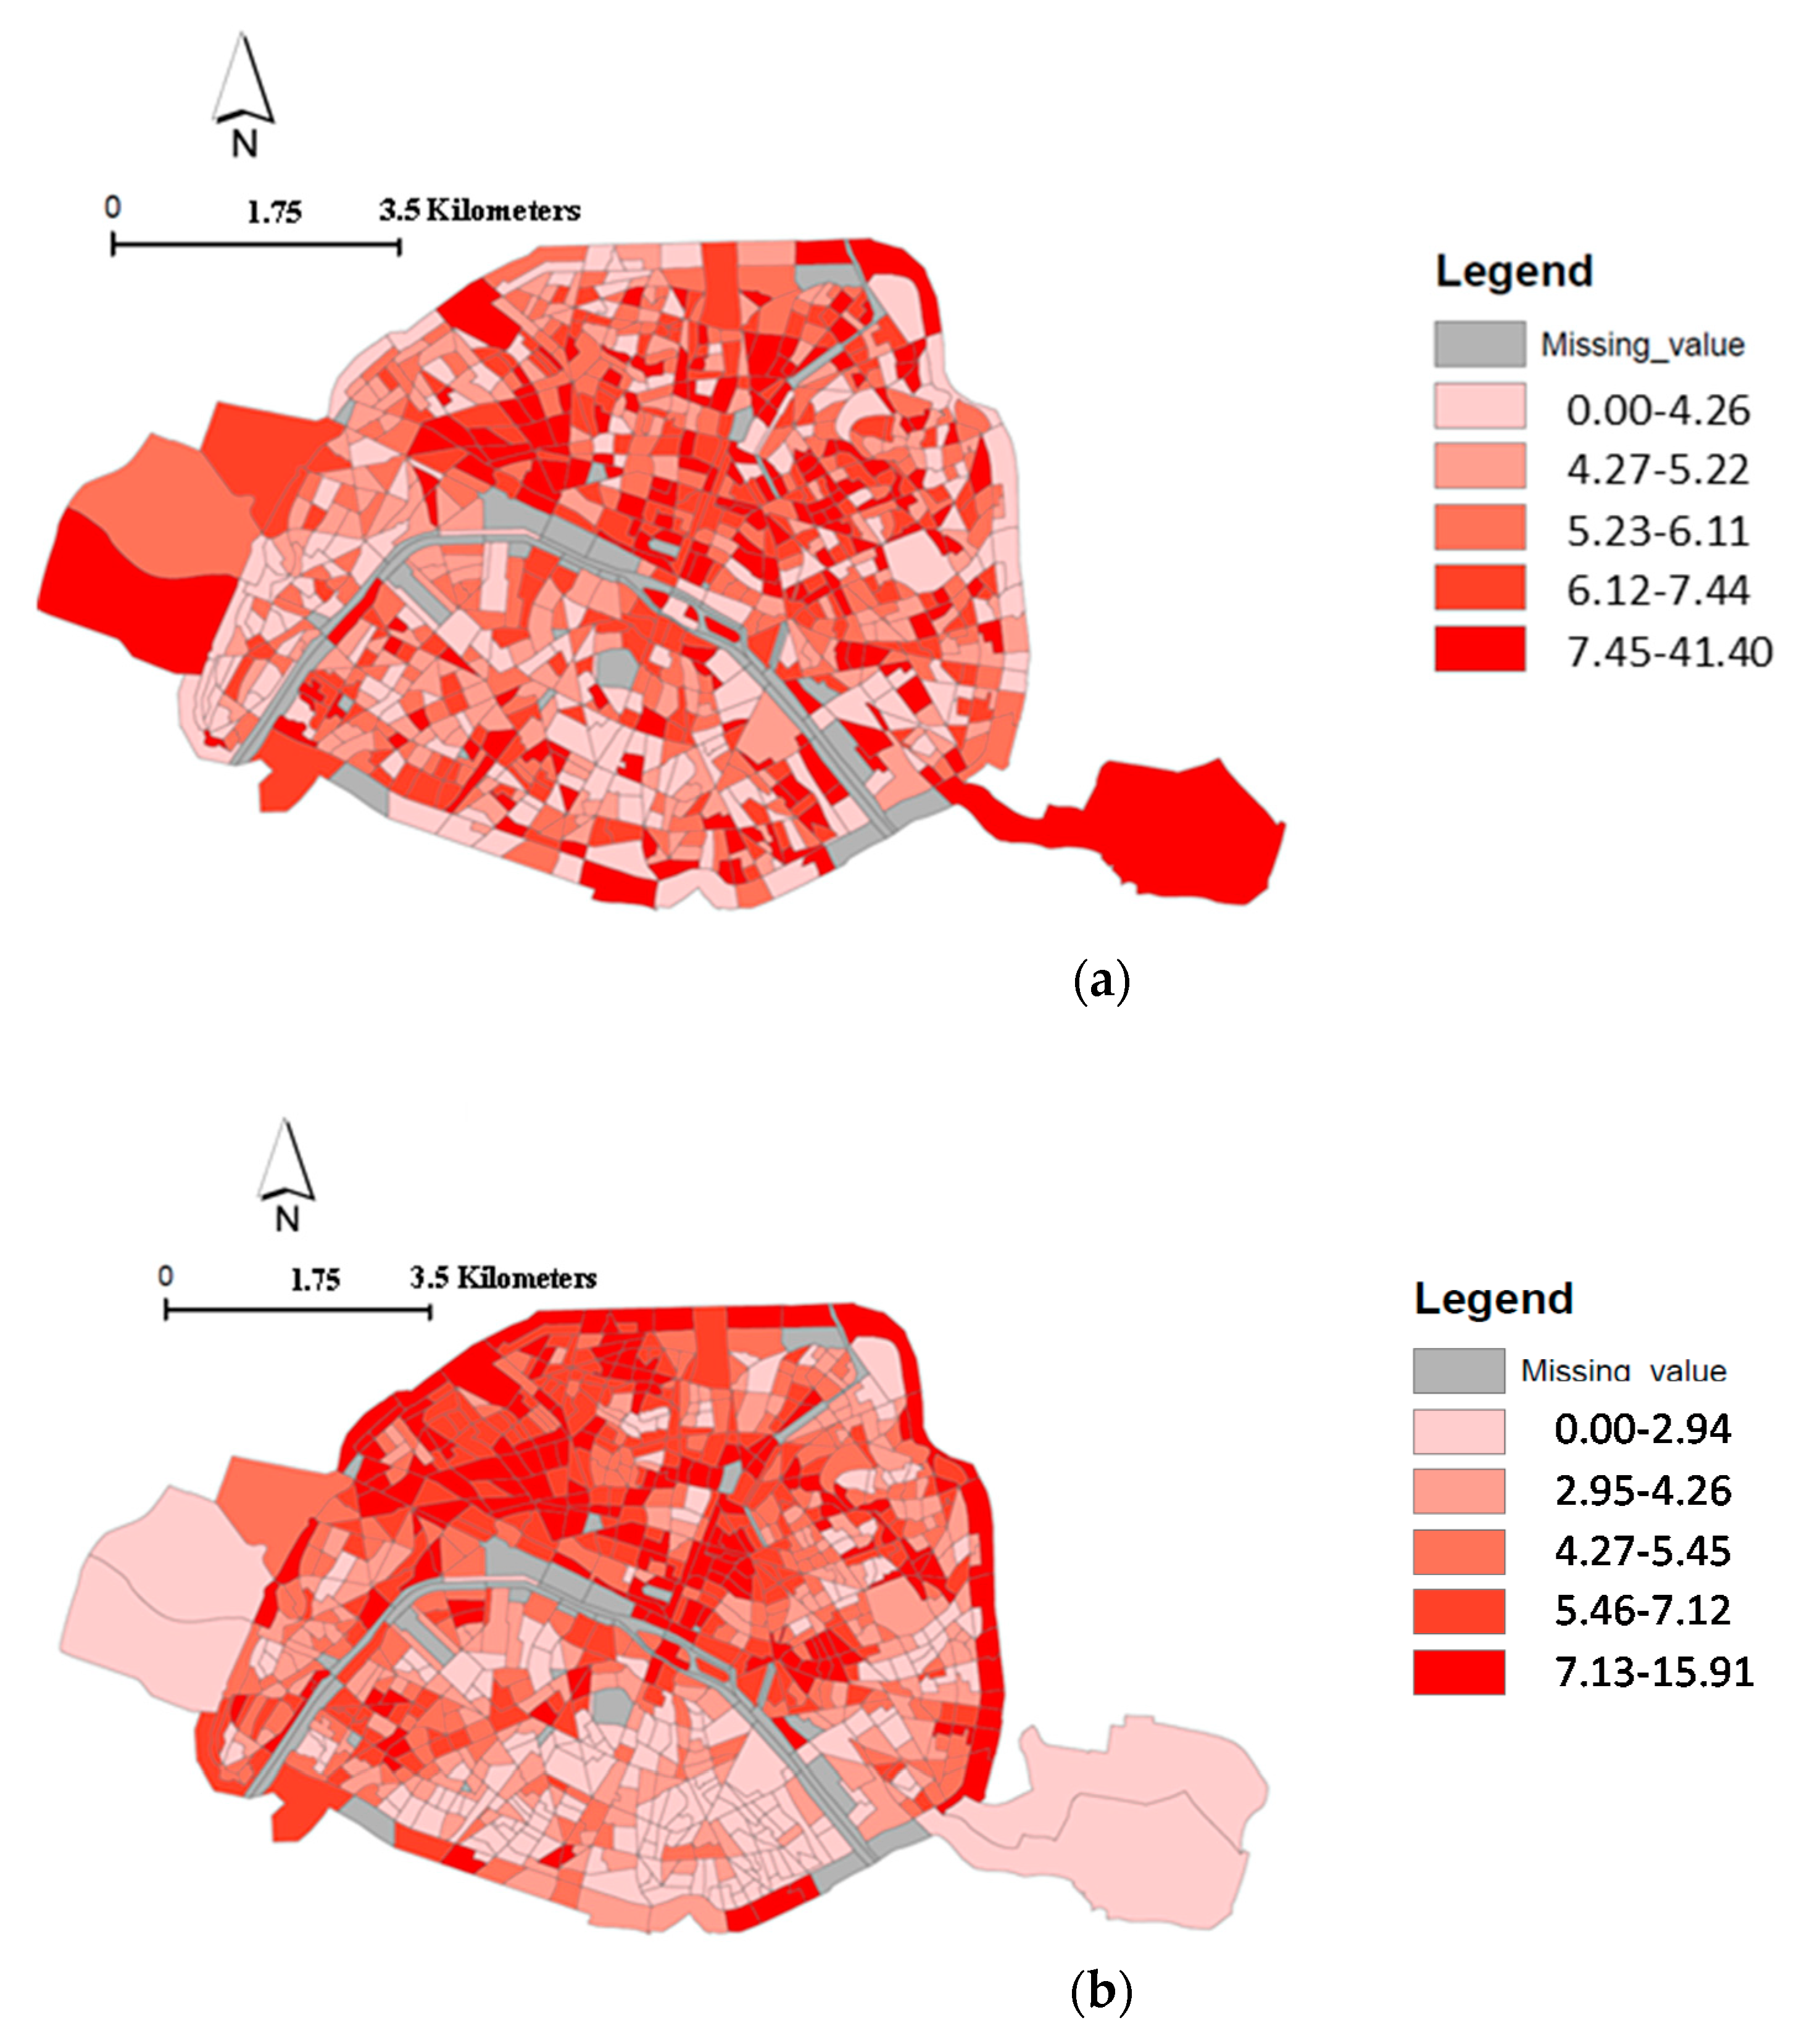
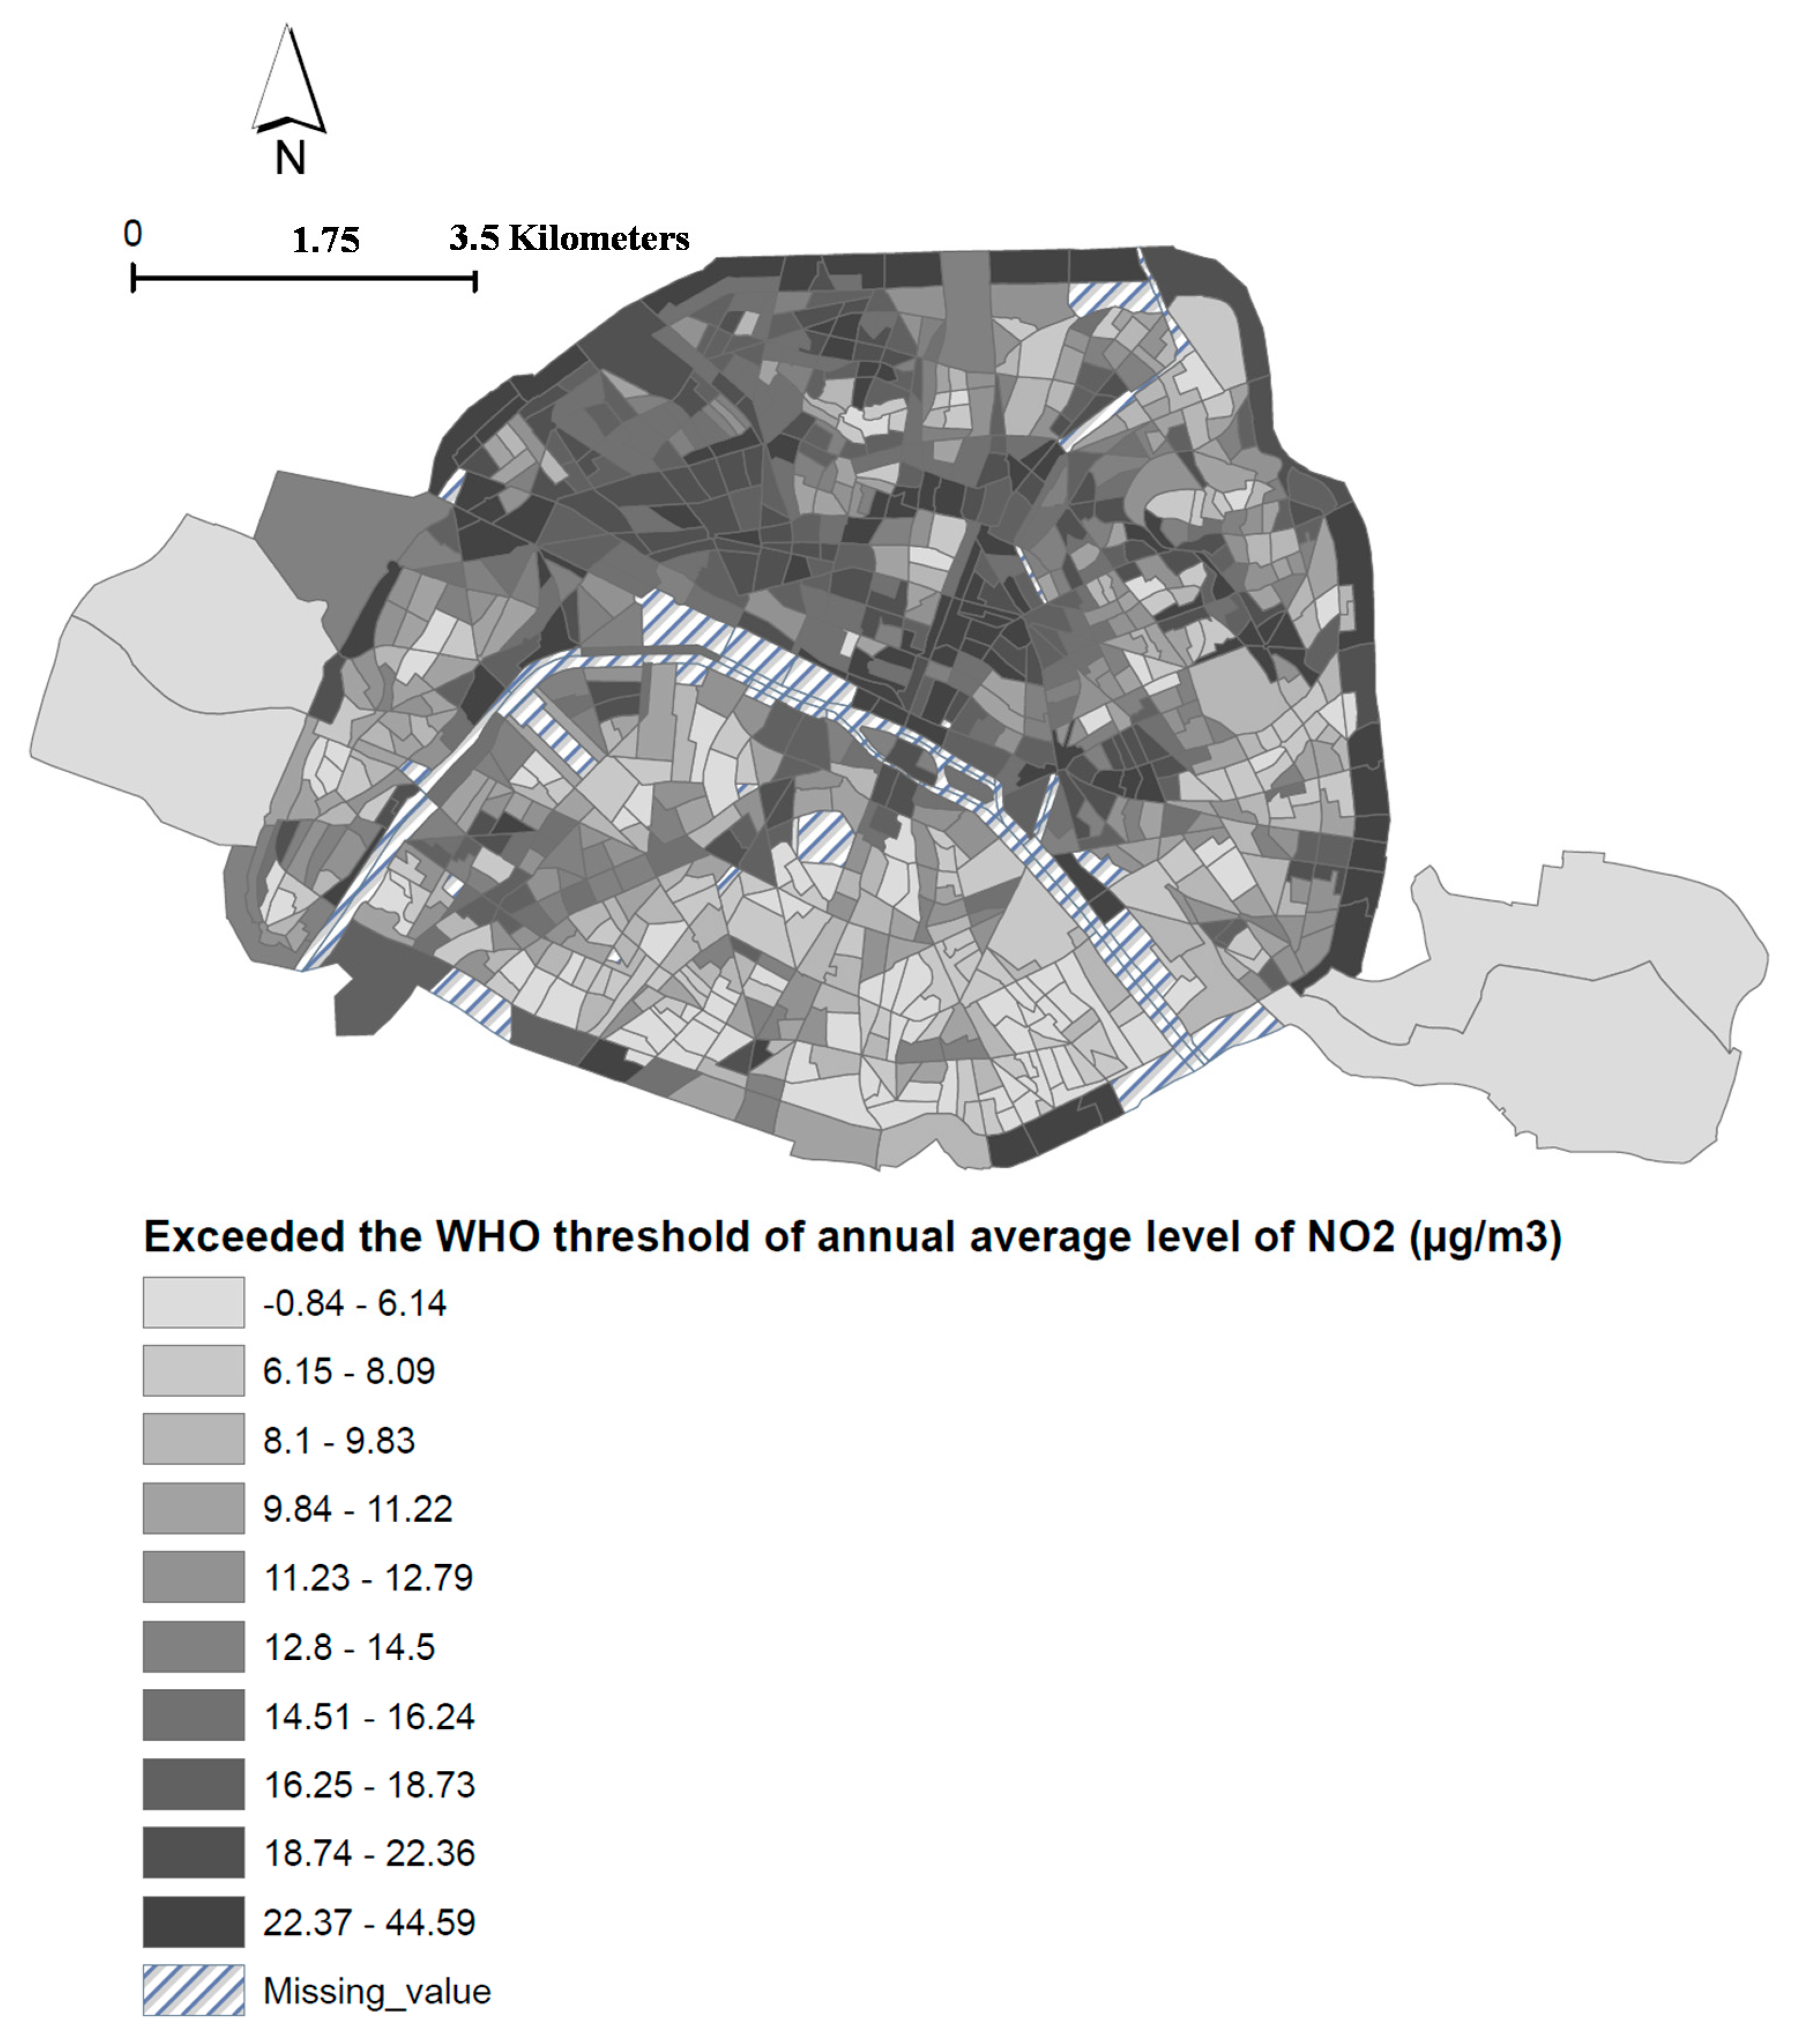
First, we predicted an overall mortality attributable to long-term NO
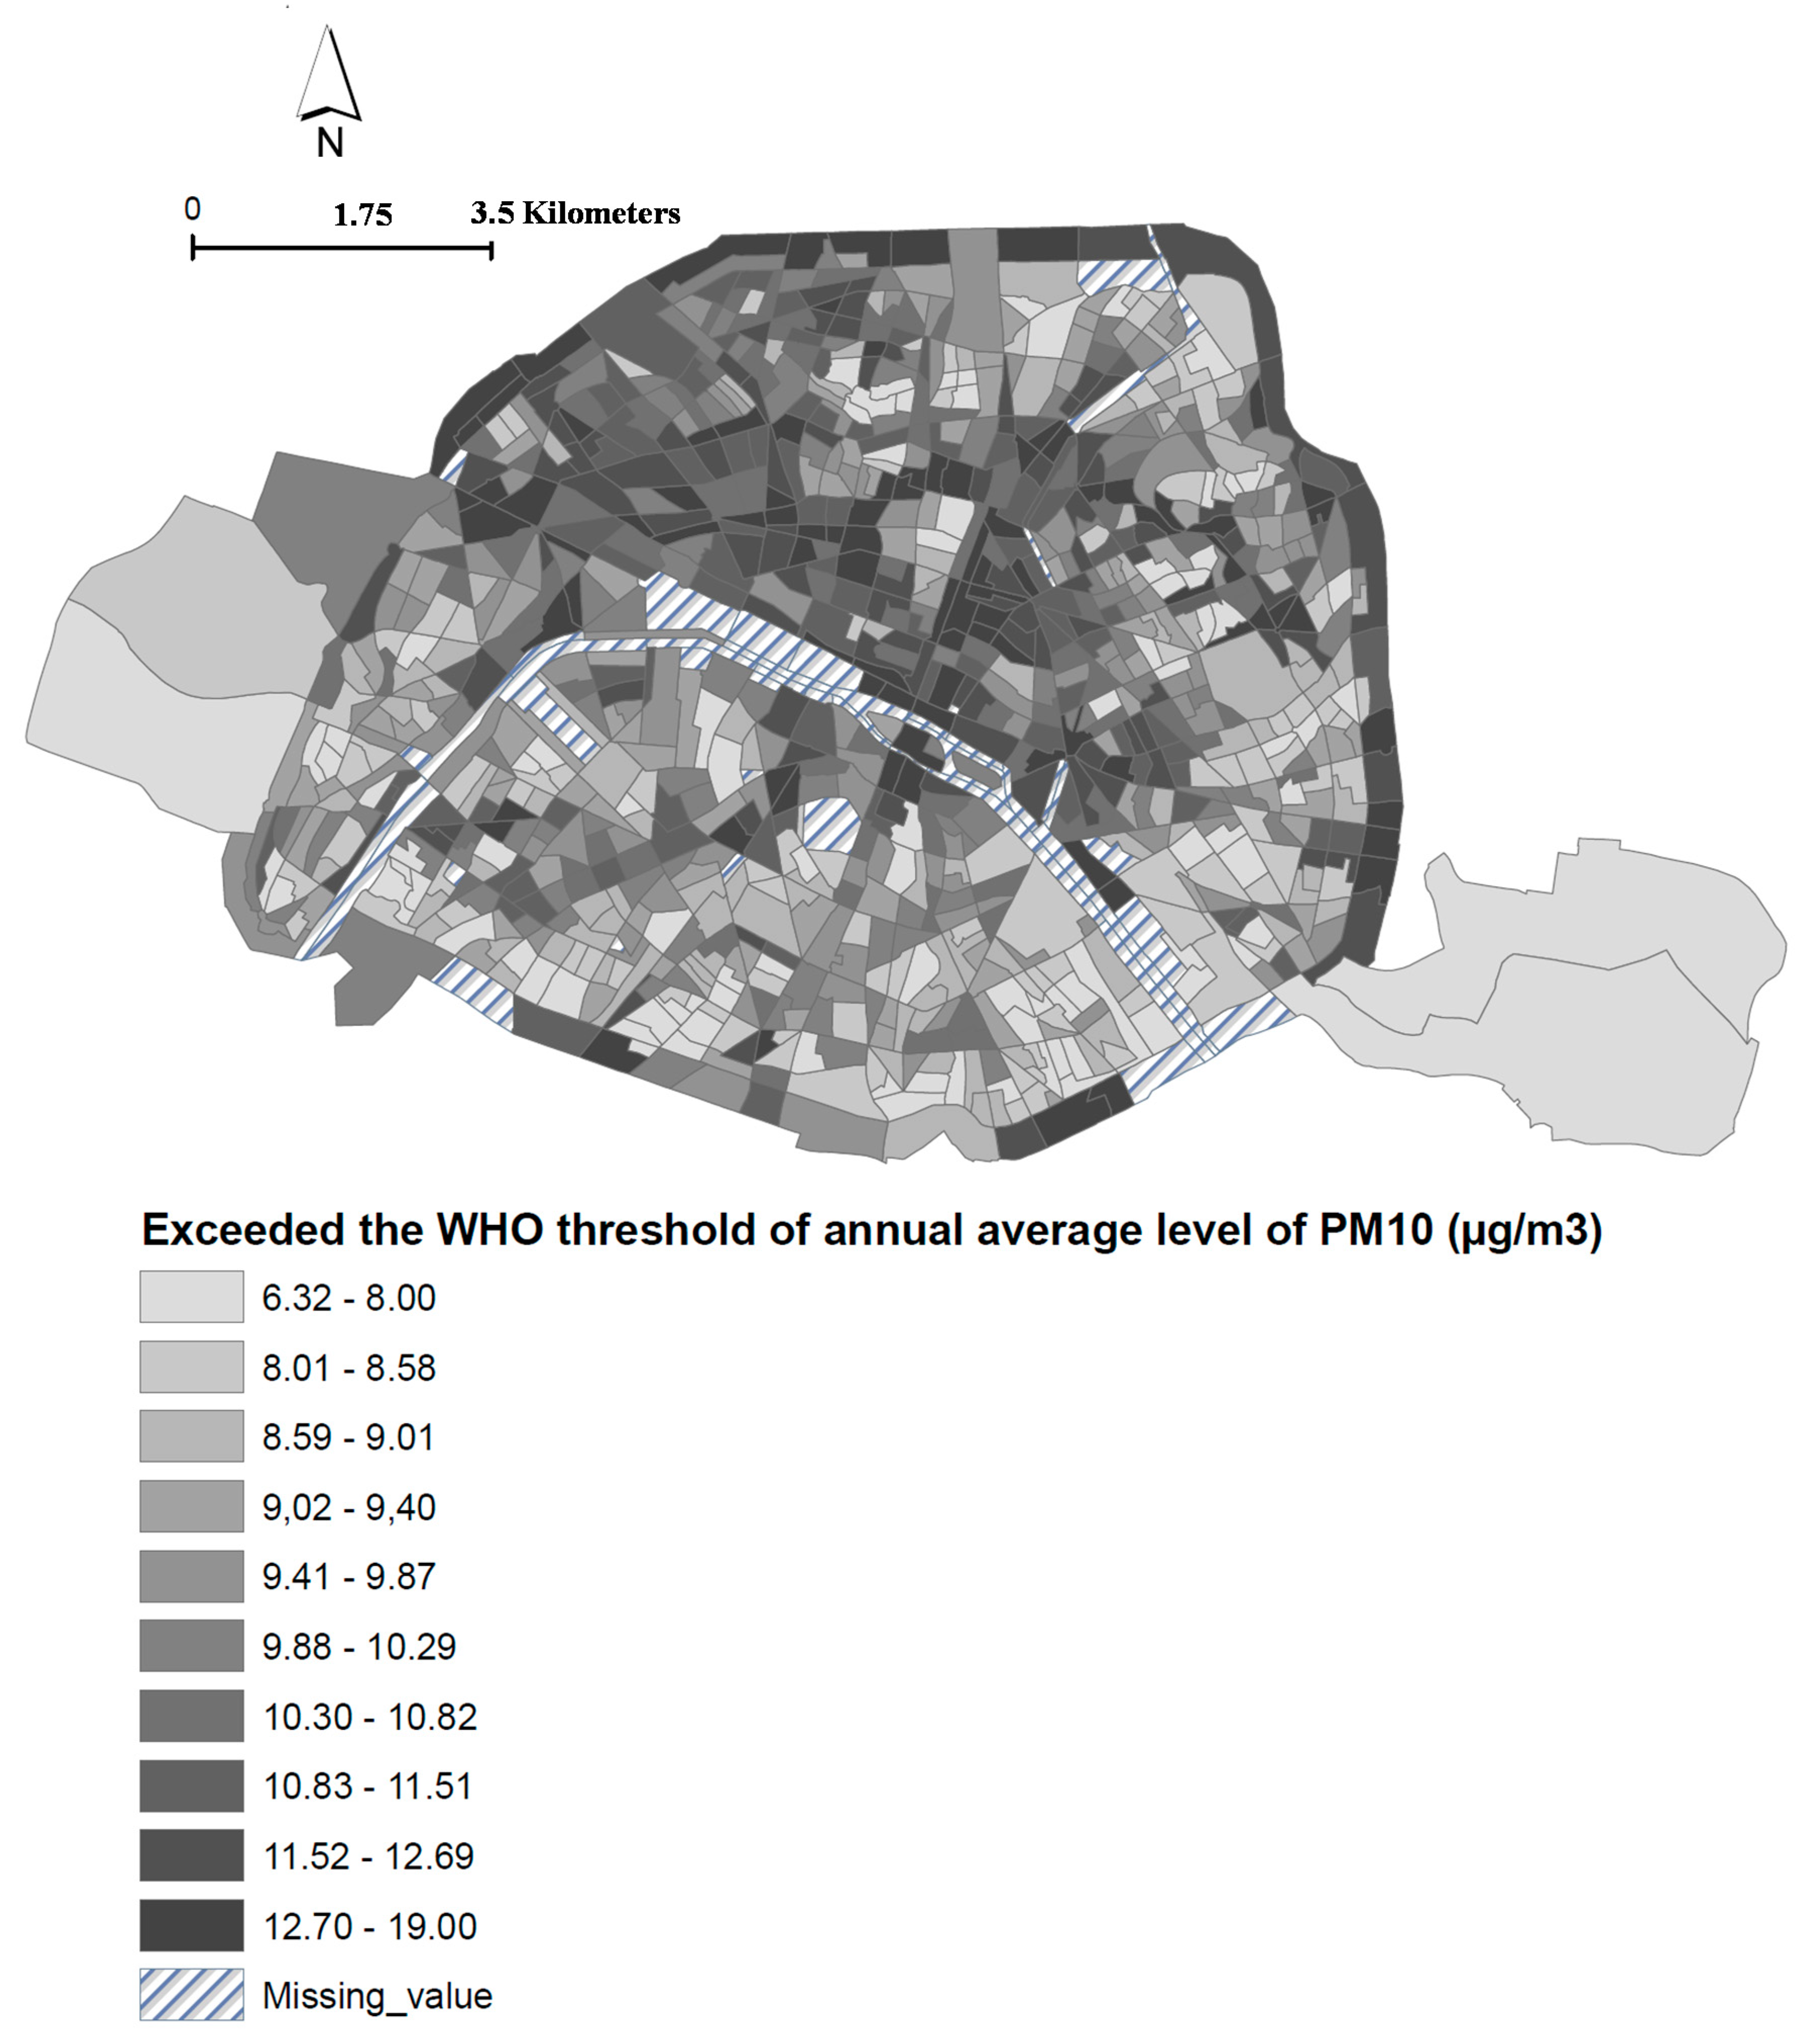
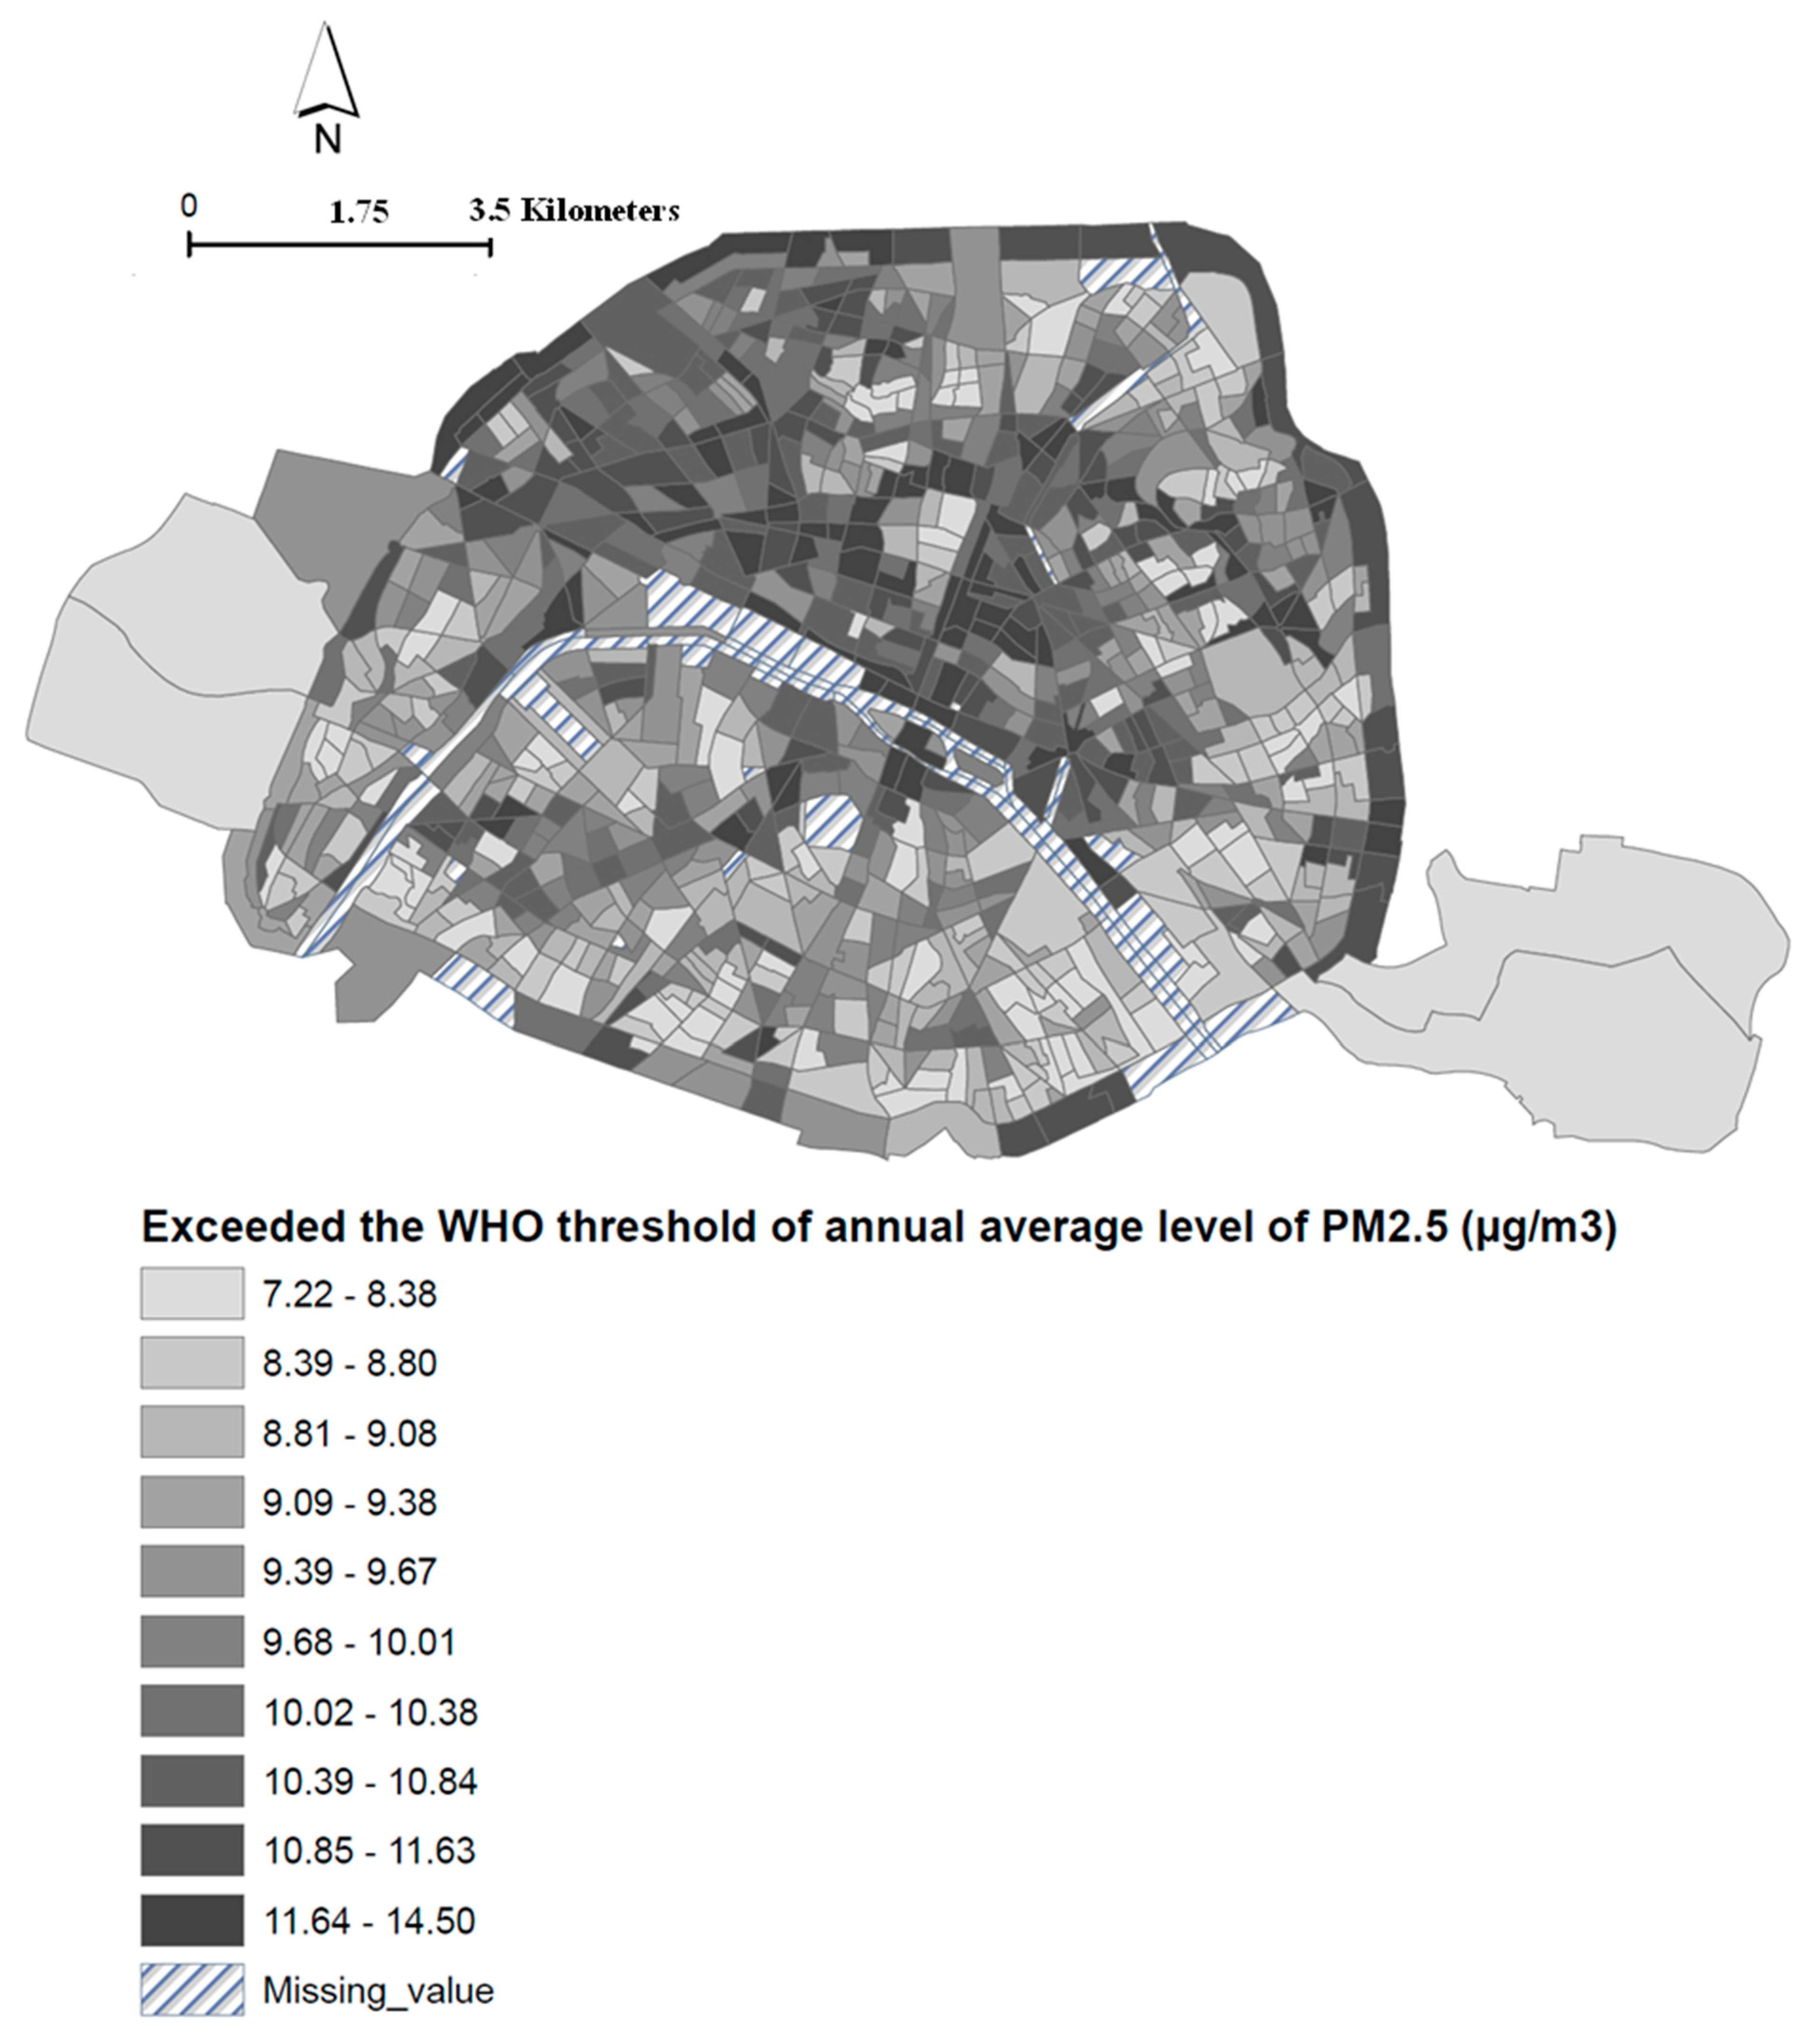
2 exposure equal to 4301 deaths (5% of the total deaths registered in Paris over the period 2004 to 2009). Over the shorter period 2007–2009, the number of deaths attributable to PM
10 and PM
2.5 were comparatively higher: 3209 and 2662 deaths, which corresponds to about 7.8% and 6.5% of total deaths. This percentage was consistent with the Global Burden of Disease published in 2015 [
25], which estimated that about 7.6% of total deaths were attributable to long-term exposure to PM
2.5.
A recent study conducted in greater Cairo, Egypt estimated that about 11% and 8% of non-accidental mortality (in the population over 30 years old) could be attributed to PM
2.5 and NO
2, respectively [
26]. The higher level of PM
2.5 concentrations varying between 50 µg/m
3 and 100 µg/m
3 in this megacity may partially explain the difference observed with our estimate, the maximum concentrations of PM
2.5 being equal to 28.7 µg/m
3 in Paris. In contrast, because the NO
2 concentration was found to be below the 40 µg/m
3 air quality guideline of WHO, the author used another limit equal to 10 µg/m
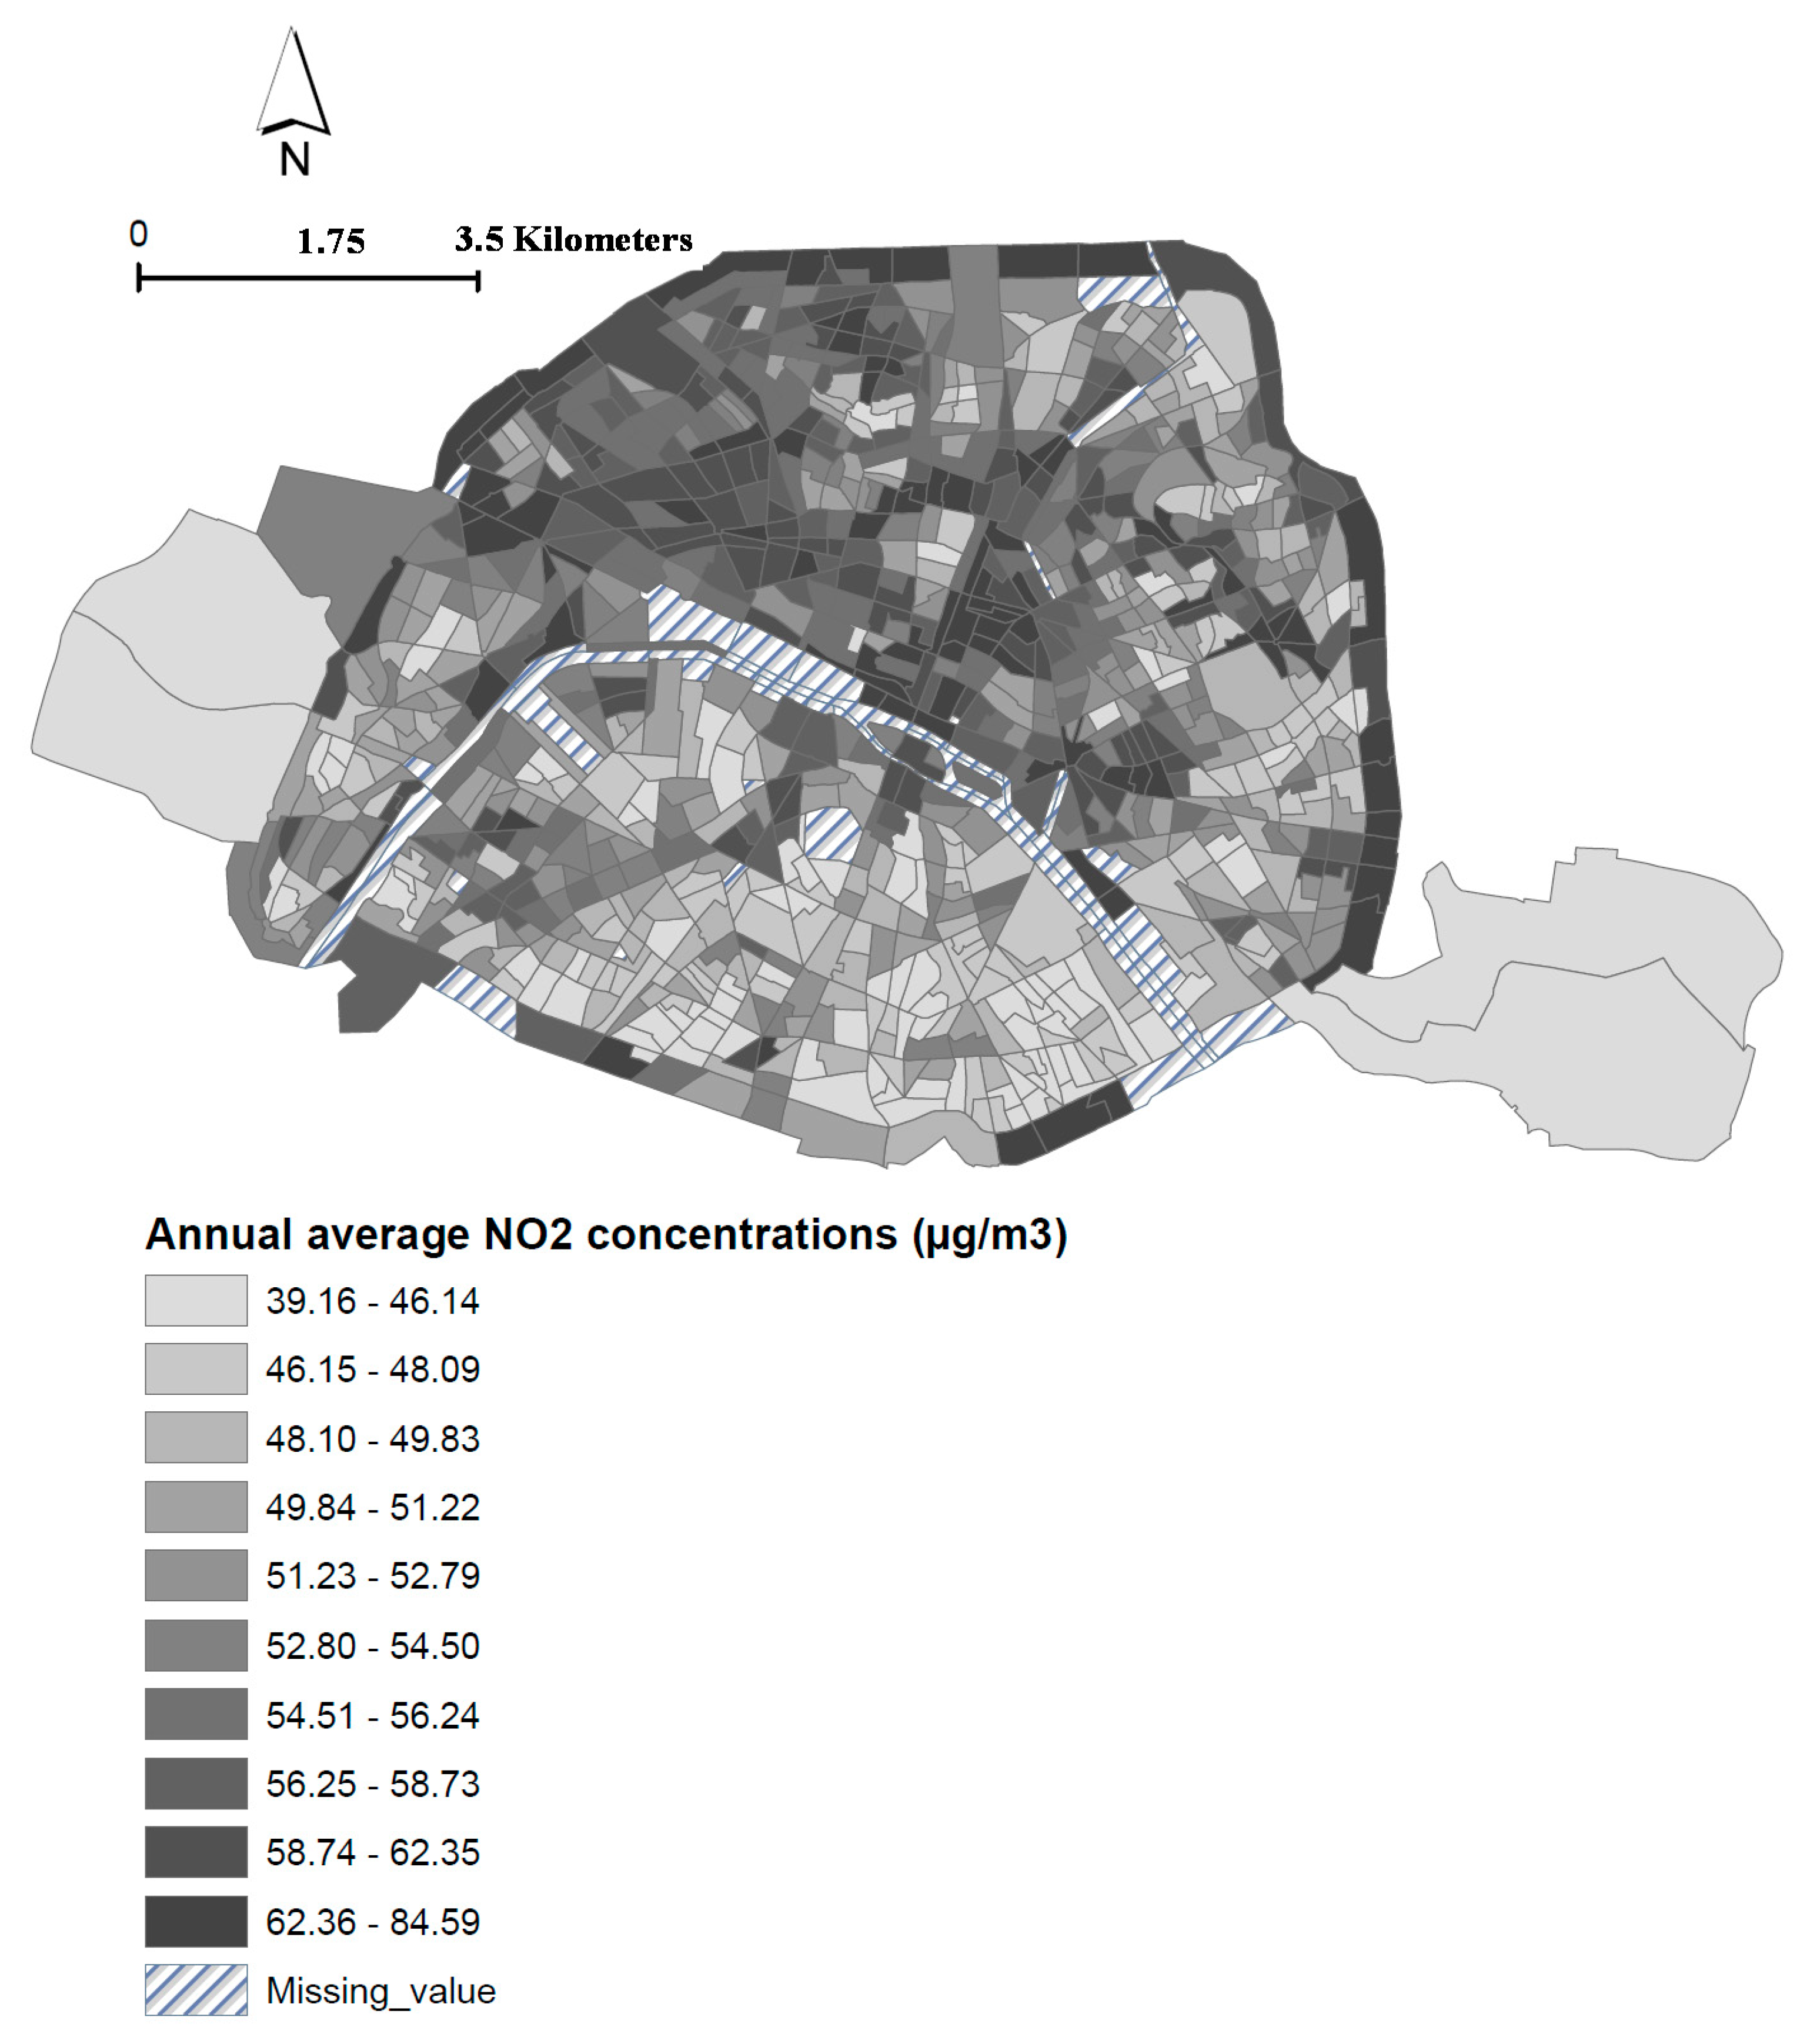
3, according to the recommendation of the Health Risks of Air Pollution in Europe project [
27]. While in Paris the annual average NO
2 concentration is higher, the stricter limit used in the Egyptian study may partially explain the difference with our estimate of deaths attributable to NO
2. A study conducted in the Lausanne-Morges urban area of Switzerland estimated the health benefits of a reduction of PM
10 and NO
2 exposure after implementing a clean air plan [
10]. Over a period of 10 years, the reduction of PM
10 and NO
2 exposure was equal to 3.3 μg/m
3 and 5.6 μg/m
3. These air quality improvements reduced total mortality by about 1% to 2%. Applying a similar reduction of PM
10 and NO
2 exposure in Paris produced comparable estimates of the percentage of “premature” deaths.
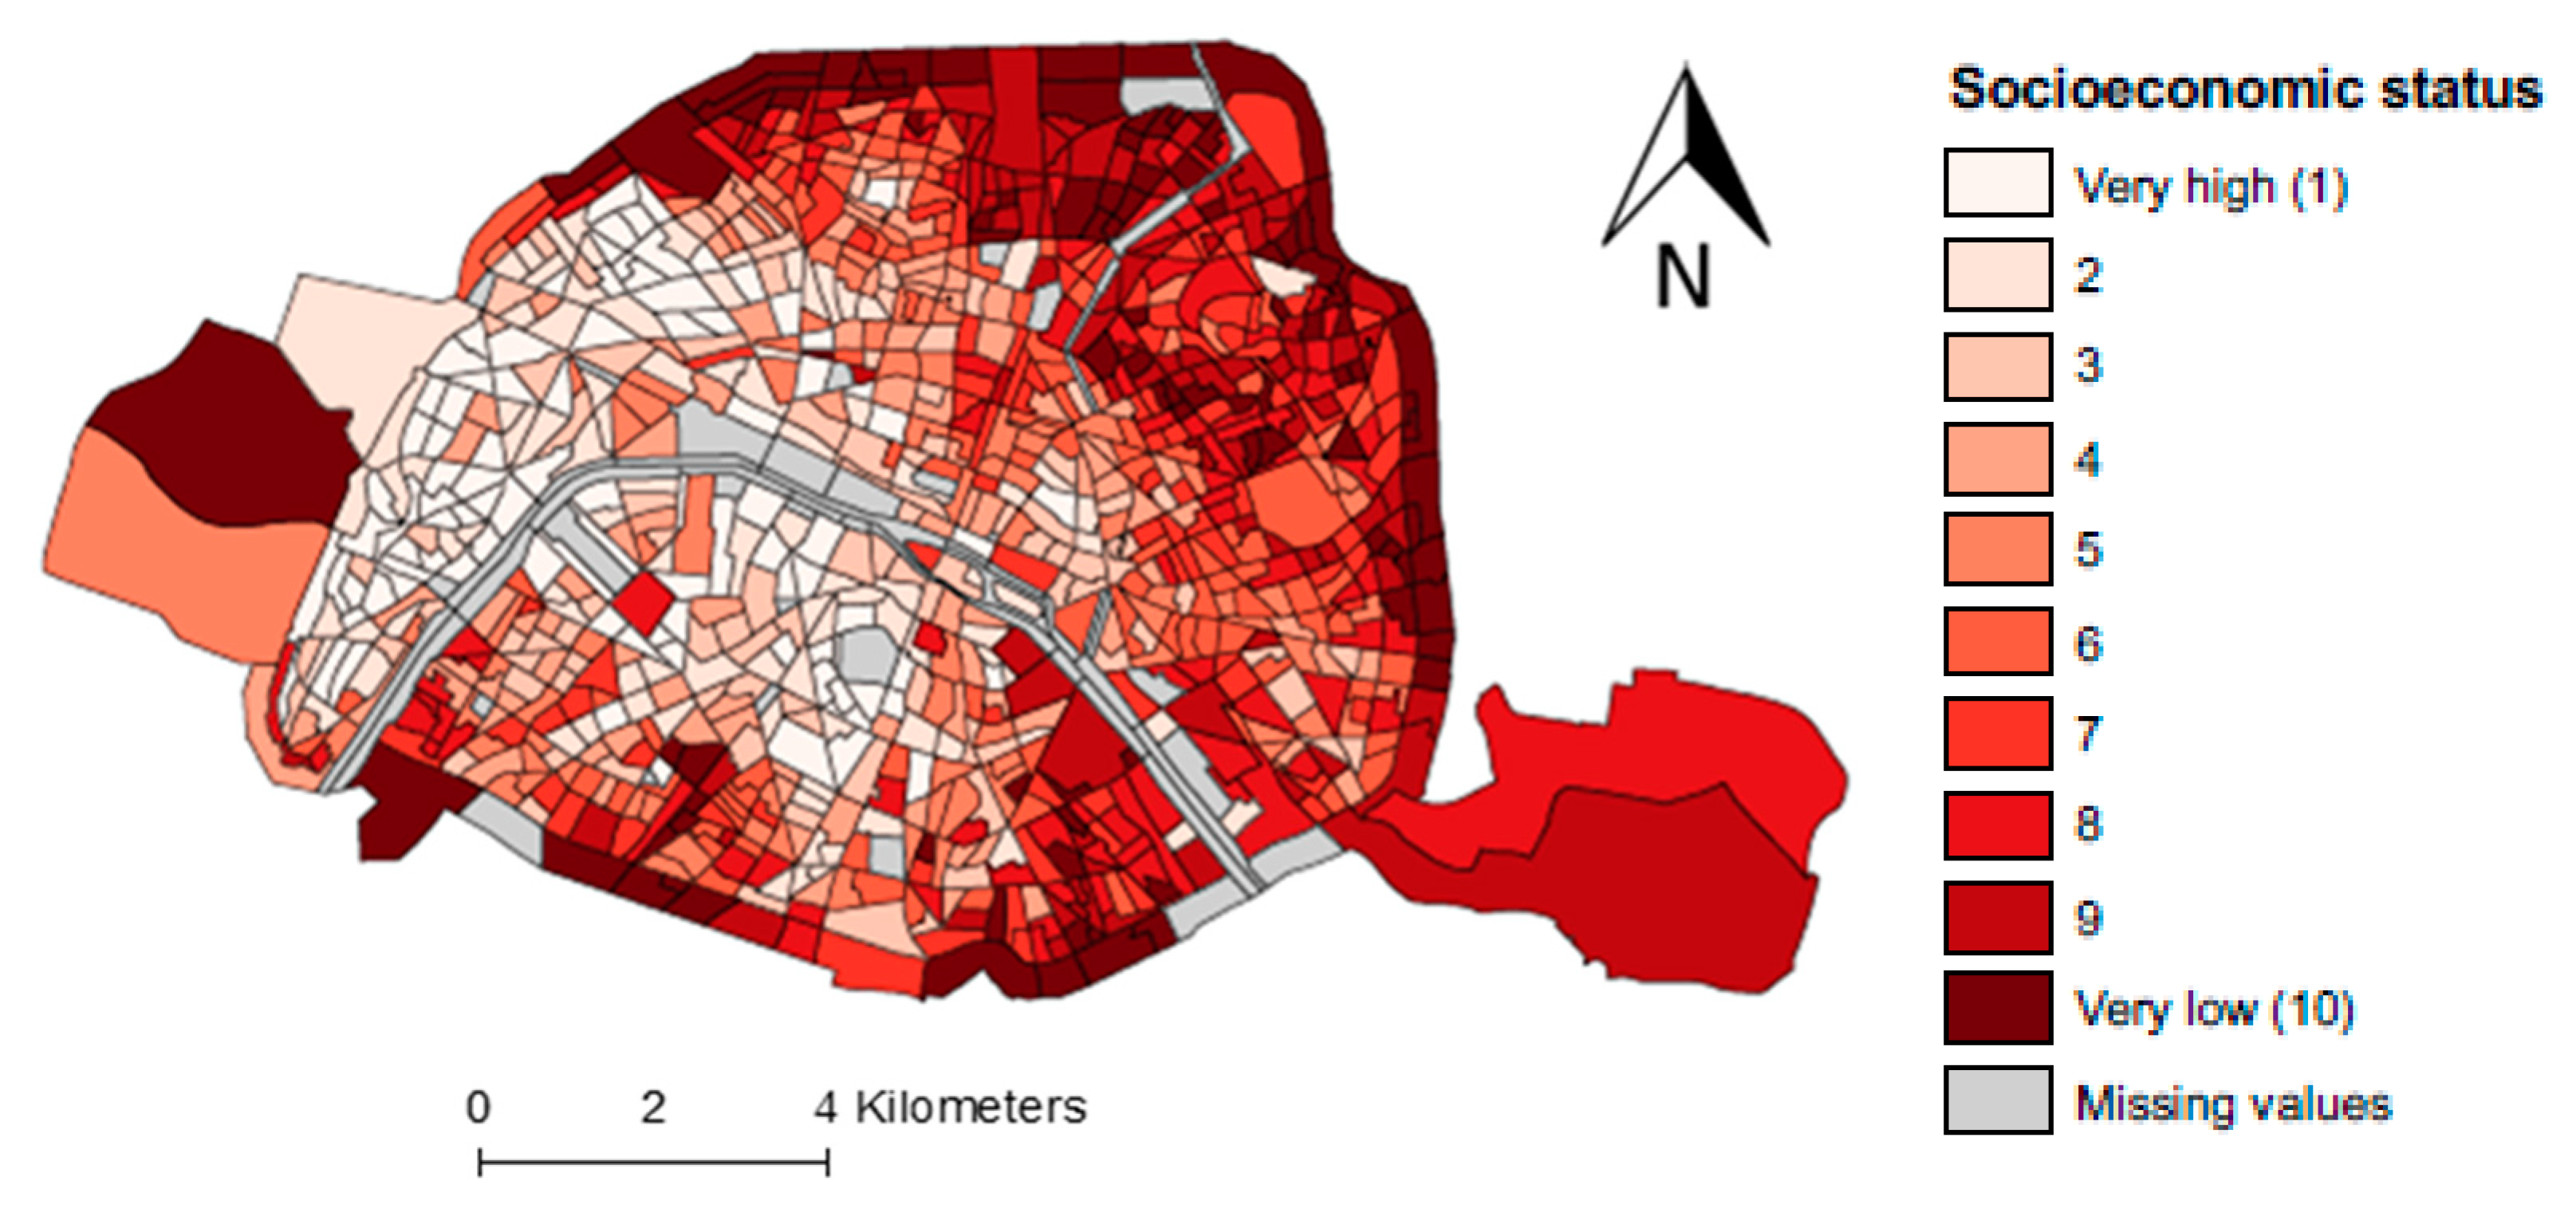
Second, our study demonstrated that the burden of mortality varied according to the level of socioeconomic deprivation. Populations living in the most deprived census blocks (those of the decile 10) appear particularly at risk of death related to NO2 exposure. Indeed, while the level of NO2 exposure decreases between the decile 5 and 9, population living in the census blocks of the decile 10 (the most deprived) accumulate a high level of exposure and a particular vulnerability to the adverse effect of air pollution. Consequently, for this population group, the two issues (exposure differential and vulnerability differential) may explain the high rate of death due to air pollution. However, it is not easy to draw a general statement about the most probable explanation between exposure differential, vulnerability differential, both because what we observed between socioeconomic level and NO2 exposure is not as clear with PM10 and PM2.5 exposure. Maybe, it could be partially explained by the lower spatial variability of PM.
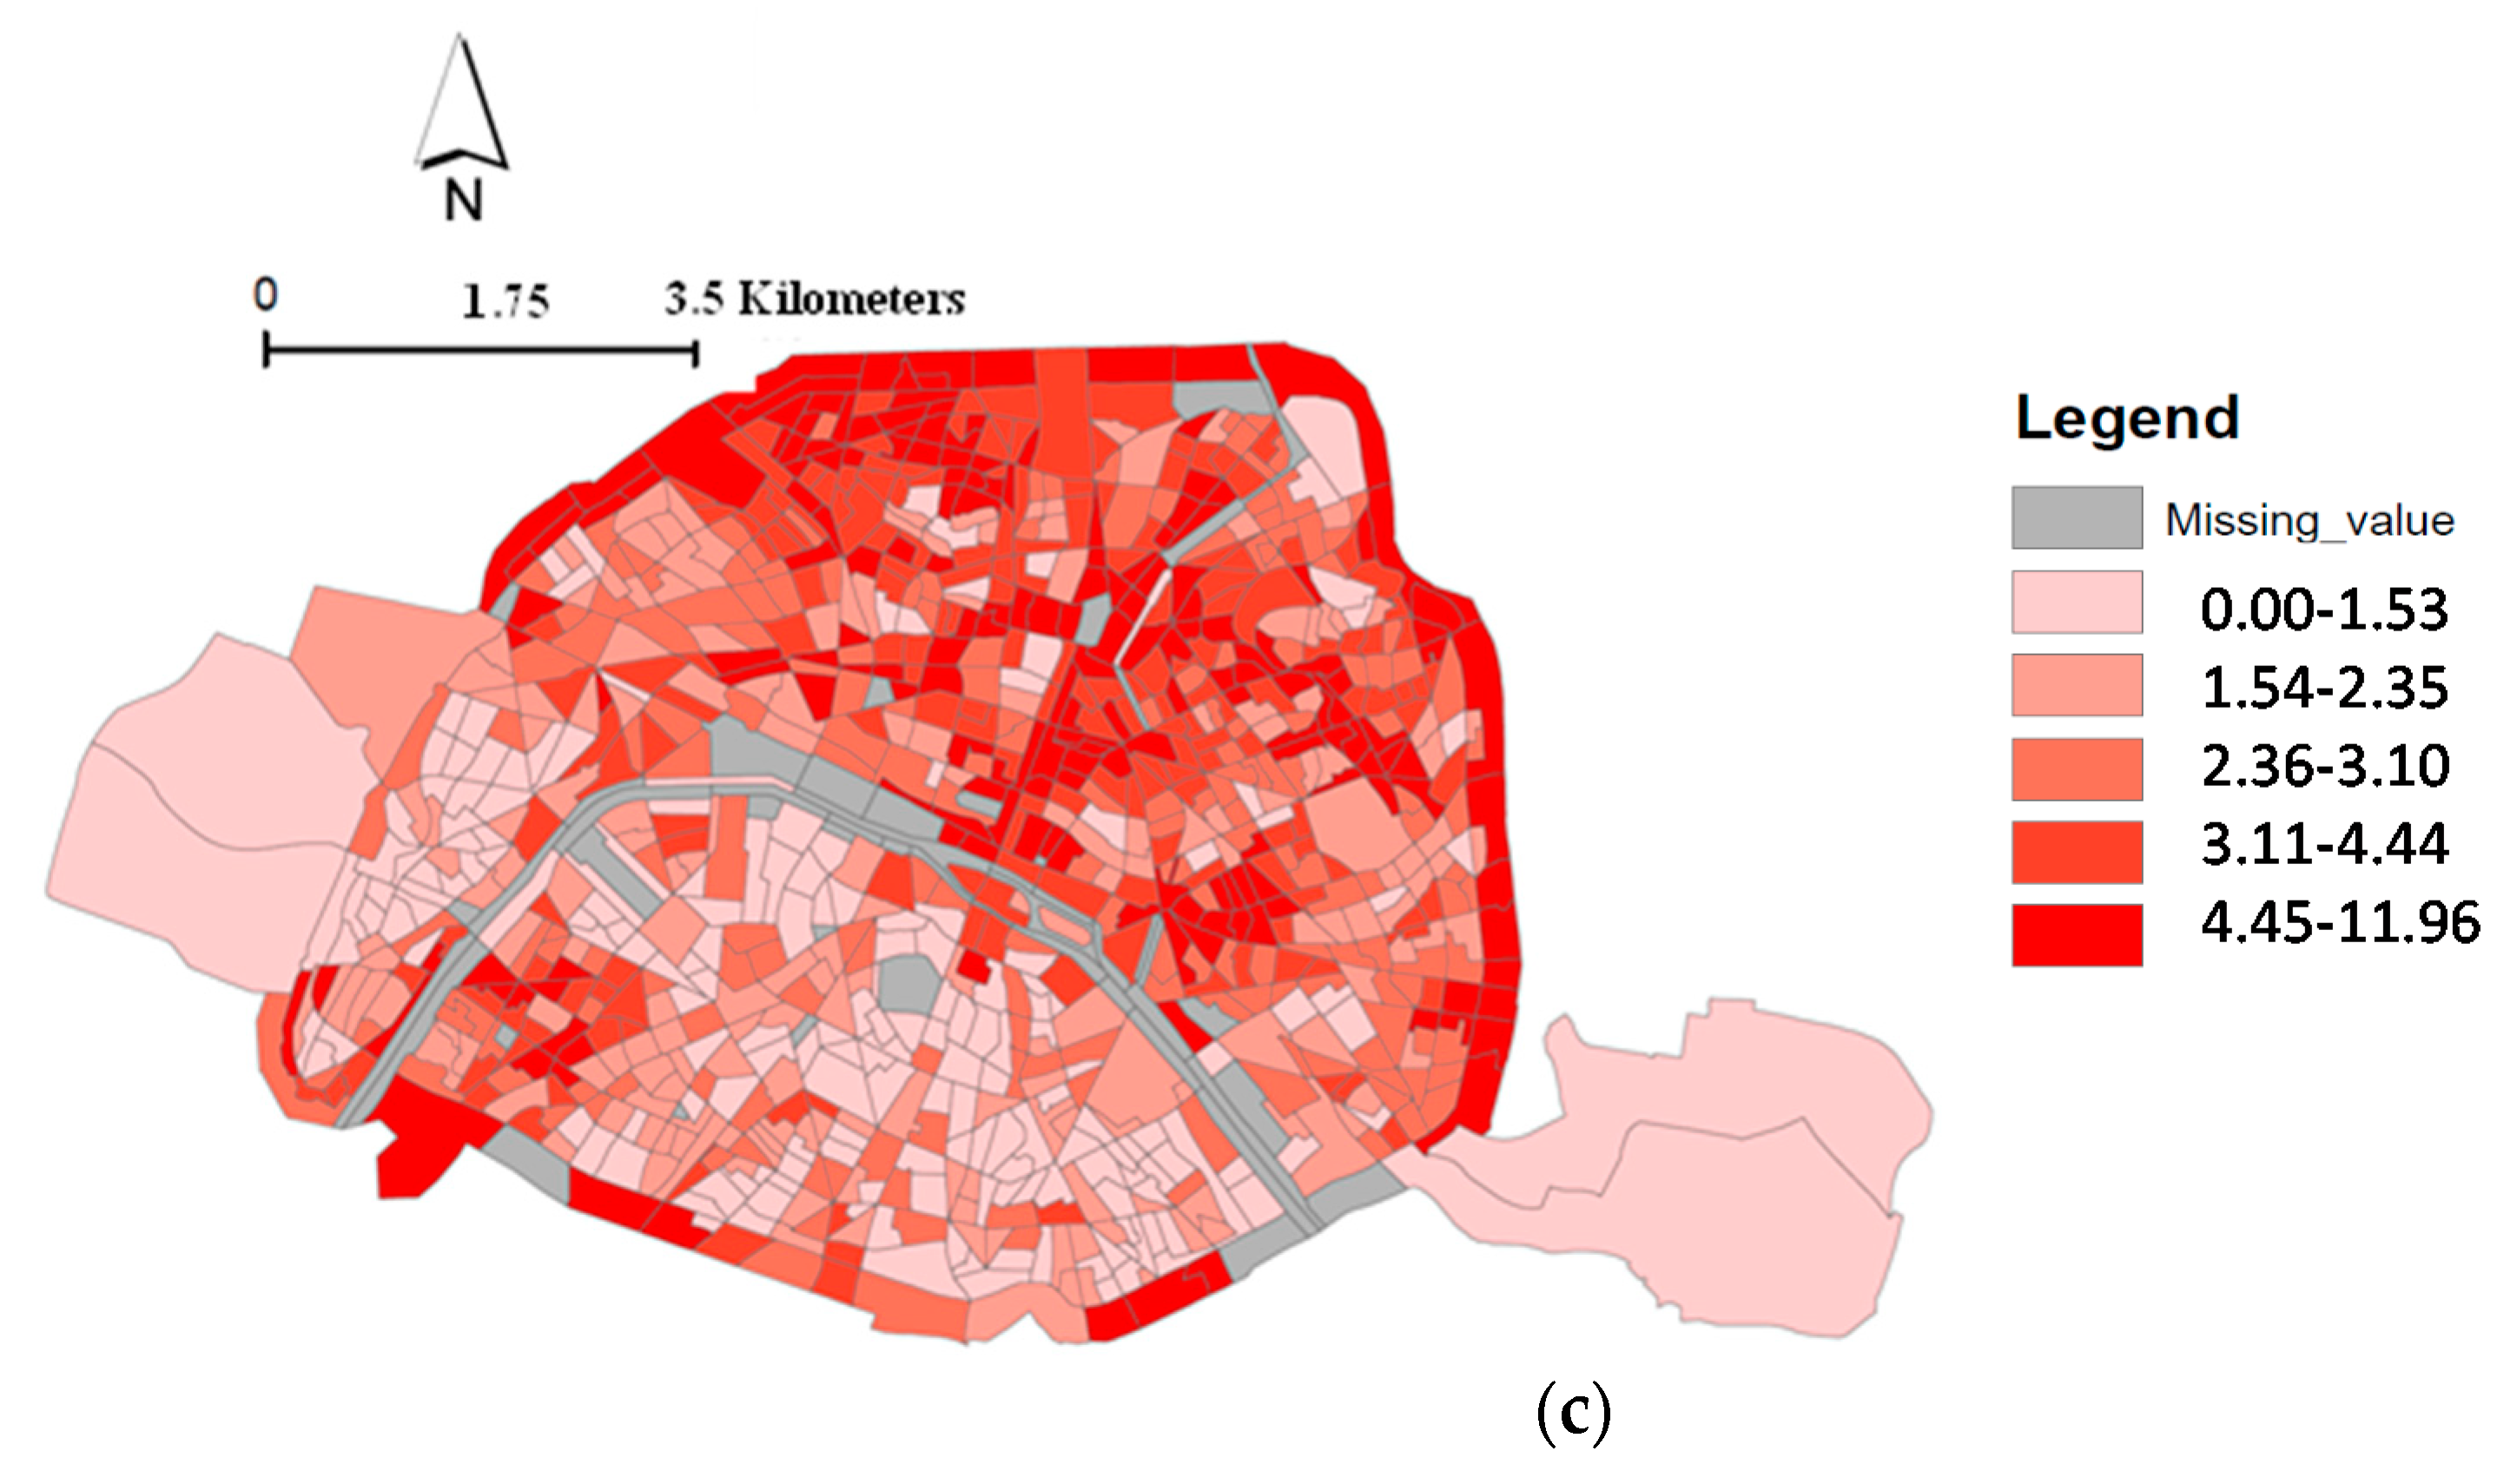
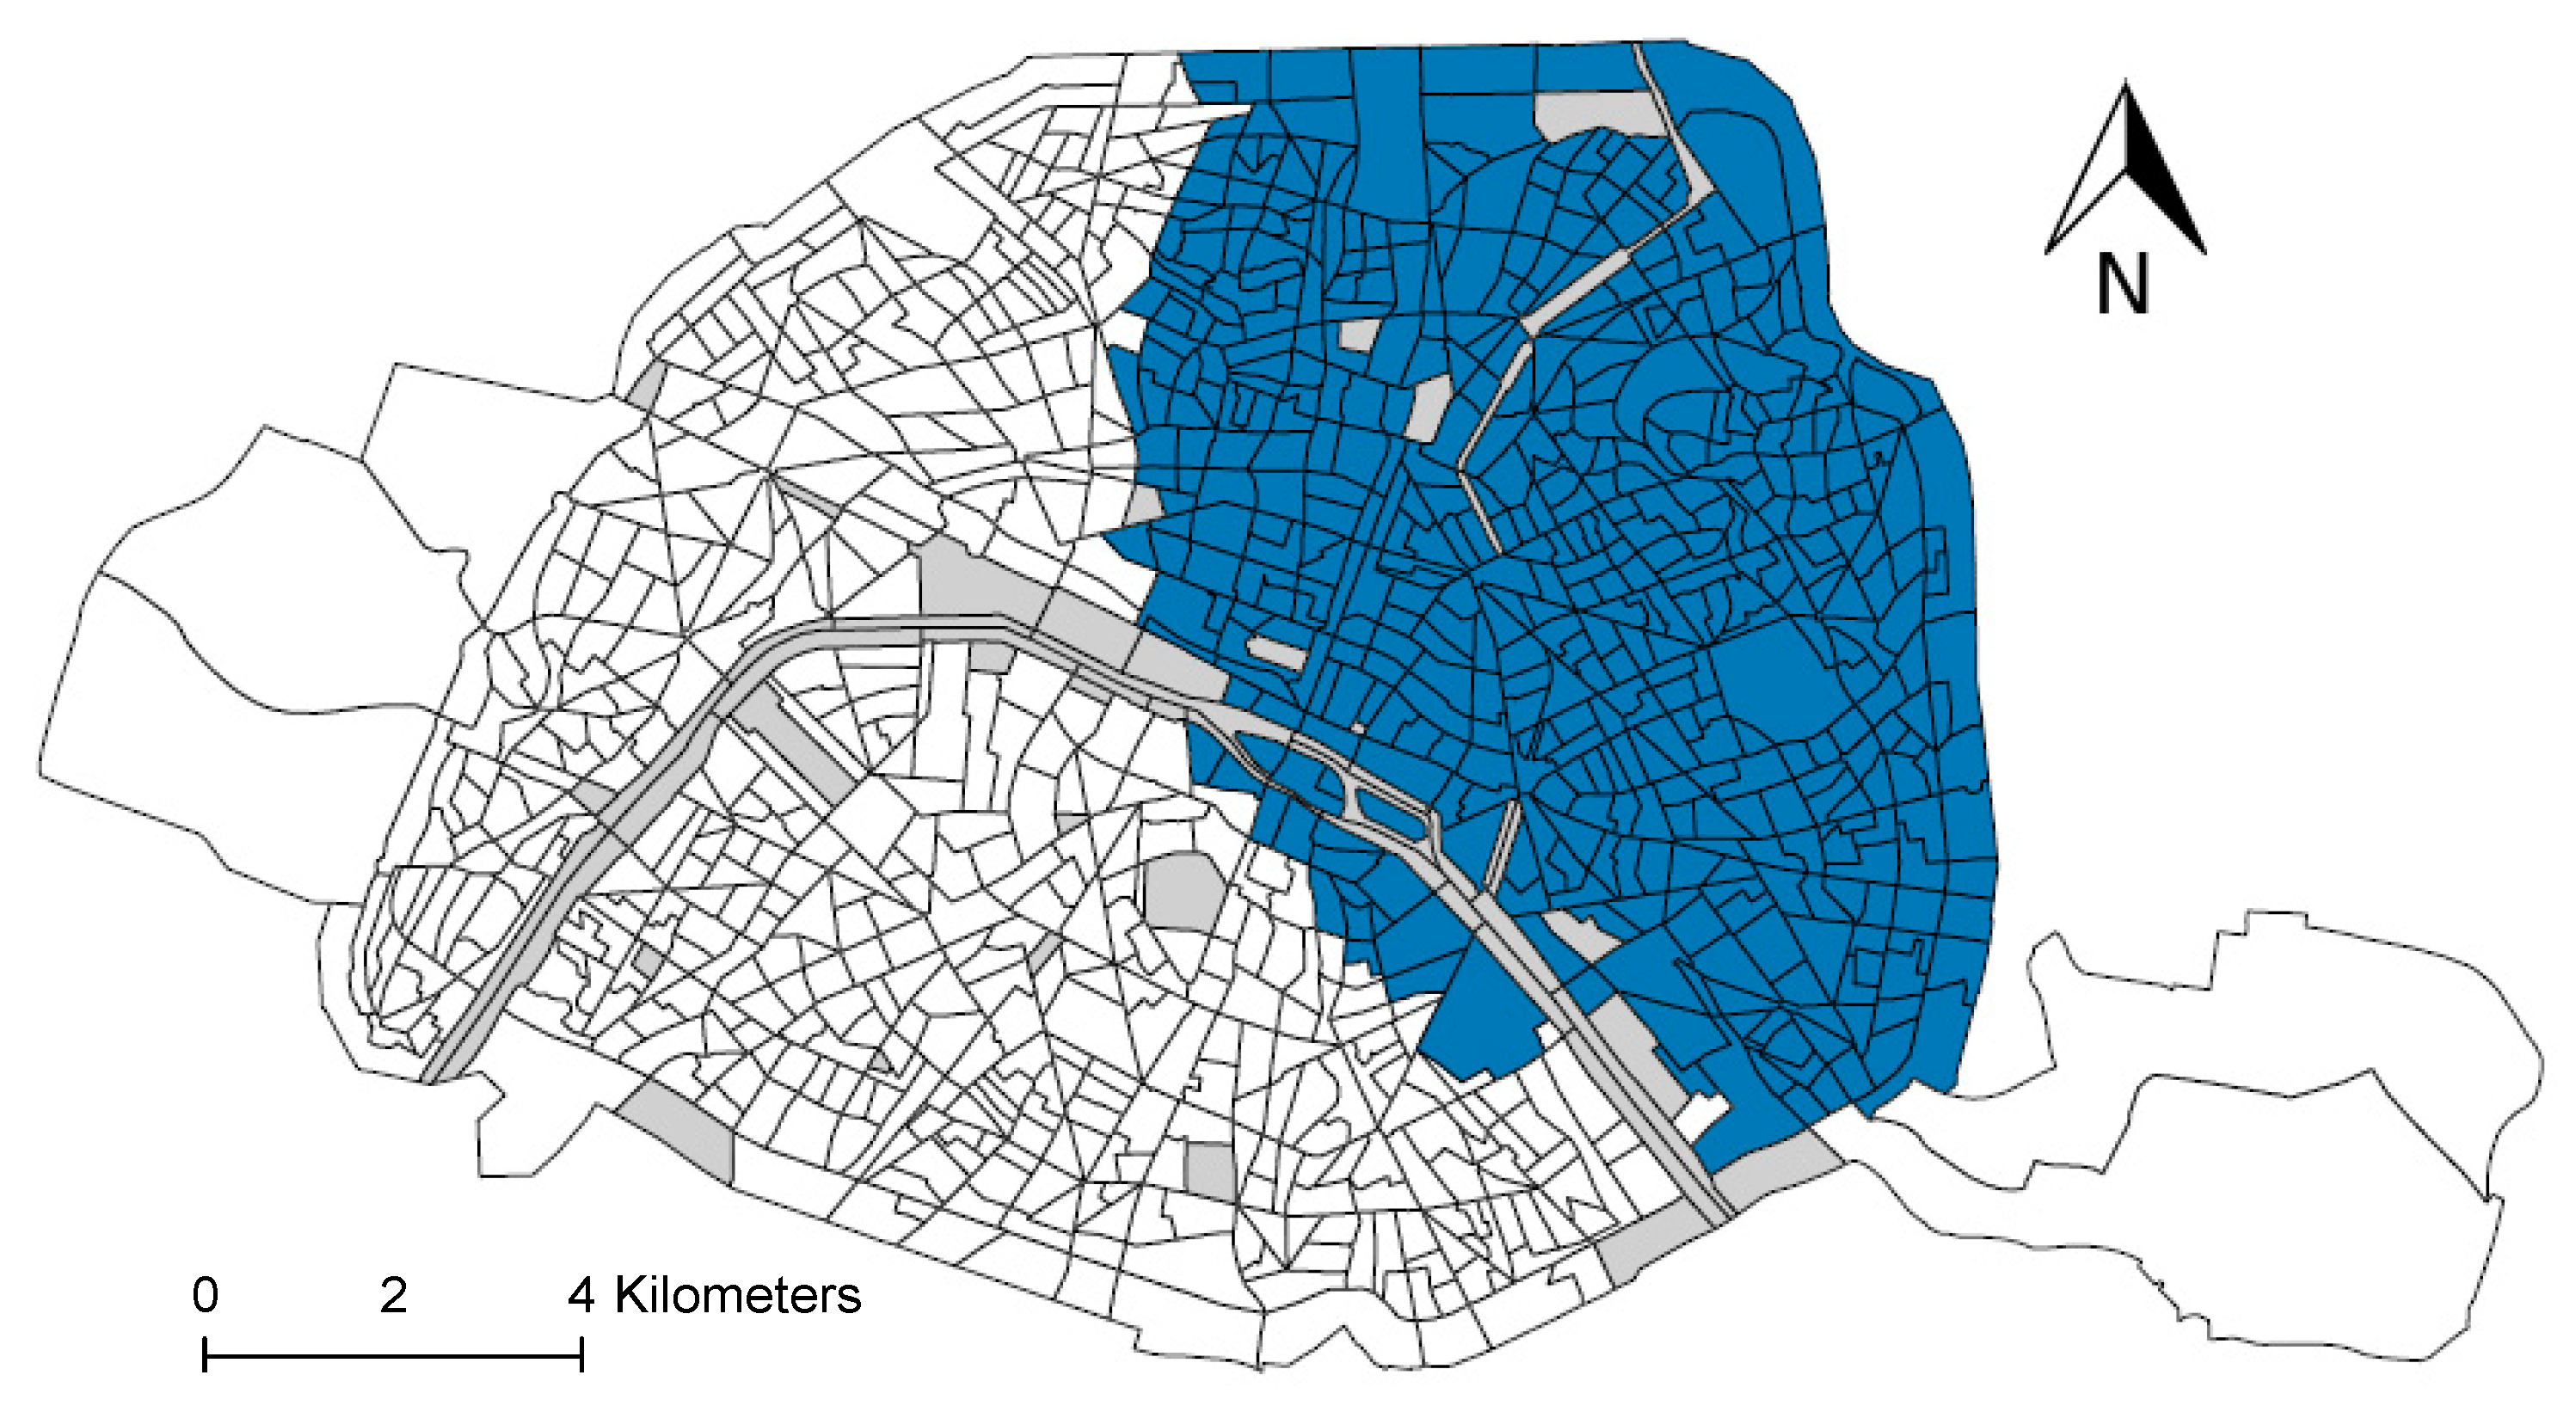
Finally, our study showed that “premature” deaths attributable to NO2 were not randomly distributed over the study area, with a cluster of excess “premature” deaths located in the northeastern area of Paris.
To our knowledge, our study is the first to stratify an environmental burden of disease by the socioeconomic deprivation level measured at the residential census block level, making it difficult to compare our findings with those of others.
Several limitations of this study should be addressed here.
First, the methodology used to estimate attributable deaths is based on the AirQ+ software, which is based on a reference model developed by WHO. However, one weakness is that it does not take into consideration the effects caused by exposure to several pollutants in combination or their synergistic effects. In our study, as in the majority of scientific literature, the effects of pollutants are investigated individually, which could bias our estimates.
Secondly, the exposure level attributed to the population was approximated by the annual average ambient concentrations of the pollutants estimated at the place of residence provided at the date of death. This is a common limitation of numerous epidemiological studies which investigate the health impact of long-term exposure to air pollution, ignoring temporal and spatial variability due to mobility of the population and it could lead to a misclassification of the exposure. A conceptual model has been recently proposed aiming to assess cumulative exposure to air pollution at a fine scale and applied in Paris at the census block level [
28]. The findings revealed that the level of population exposure to NO
2 decreased when including the population mobility within the census block. However, the decrease was lower for the arrondissements located in northeastern Paris where the level of socioeconomic deprivation is the highest. This finding further supports the hypothesis of differential exposure.
Third, the socioeconomic deprivation status was estimated at the census block level rather than the individual level. However, census blocks are defined to maximize their uniformity in terms of population size, socioeconomic and demographic characteristics, land use, and zoning, thus reducing the risk of ecological bias.
Finally, the major limitation of our paper is the lack of studies that stratify their analysis based on socioeconomic deprivation status. Indeed, to produce a robust dose-response function per socioeconomic deprivation class, a meta-analysis is recommended. However, only two studies conducted in areas comparable to Paris were identified in the literature. Using the dose (air pollution)-response (mortality) function (relative risk) of these studies, our findings revealed that the number of “premature” deaths varied according to the socioeconomic deprivation level measured at the place of residence. This reflects not only the different dose-response functions used, but also the level of air pollution exposure and the population density. However, our findings tend to show a higher impact of air pollution exposure among the more deprived areas.
Benefits of this Research for Public Health
This study provides answers to socioeconomic and environmental inequalities highlighted as an important public health issue by WHO. The research that formed the basis of public health policy provides little evidence for effective initiatives aiming to improve population health and tackle environmental and social inequalities in health. This paper is an attempt to fill the gap regarding the need for the development of powerful tools to support priority-setting and guide policymakers in their choice of environmental policies.
In this context, this study produced crucial information for policymakers to prioritize actions to investigate social health inequalities:
Quantification of the number of “premature” deaths attributable to a reduction of NO2, PM10, and PM2.5 stratified by residential socioeconomic deprivation status.
Spatial distribution of health and equity impacts of reducing these three pollutants.
In addition, this study illustrates the value of socio-spatial analysis implemented at a small spatial scale to pinpoint the areas where action is needed. In our study, for instance, we identified that an action conducted in northeastern Paris would be highly effective, since this area accounts for about 80% of the total number of “premature” deaths estimated.
At middle- and long-term, it could be really useful to perform the same study again with recent health and air pollution data, in order to investigate if the spatial distribution of the premature death changes over time, or if despite of the decrease of air pollution, cluster counting of a higher number of premature deaths related to air pollution is located in the same place.


