Percentile Curves for Body-Mass Index, Waist Circumference, Waist-To-Height Ratio and Waist-To-Height Ratio(Exp) in Croatian Adolescents


Abstract
:1. Introduction
2. Materials and Methods
2.1. Study Participants
2.2. Anthropometric Measures
2.3. Data Analysis
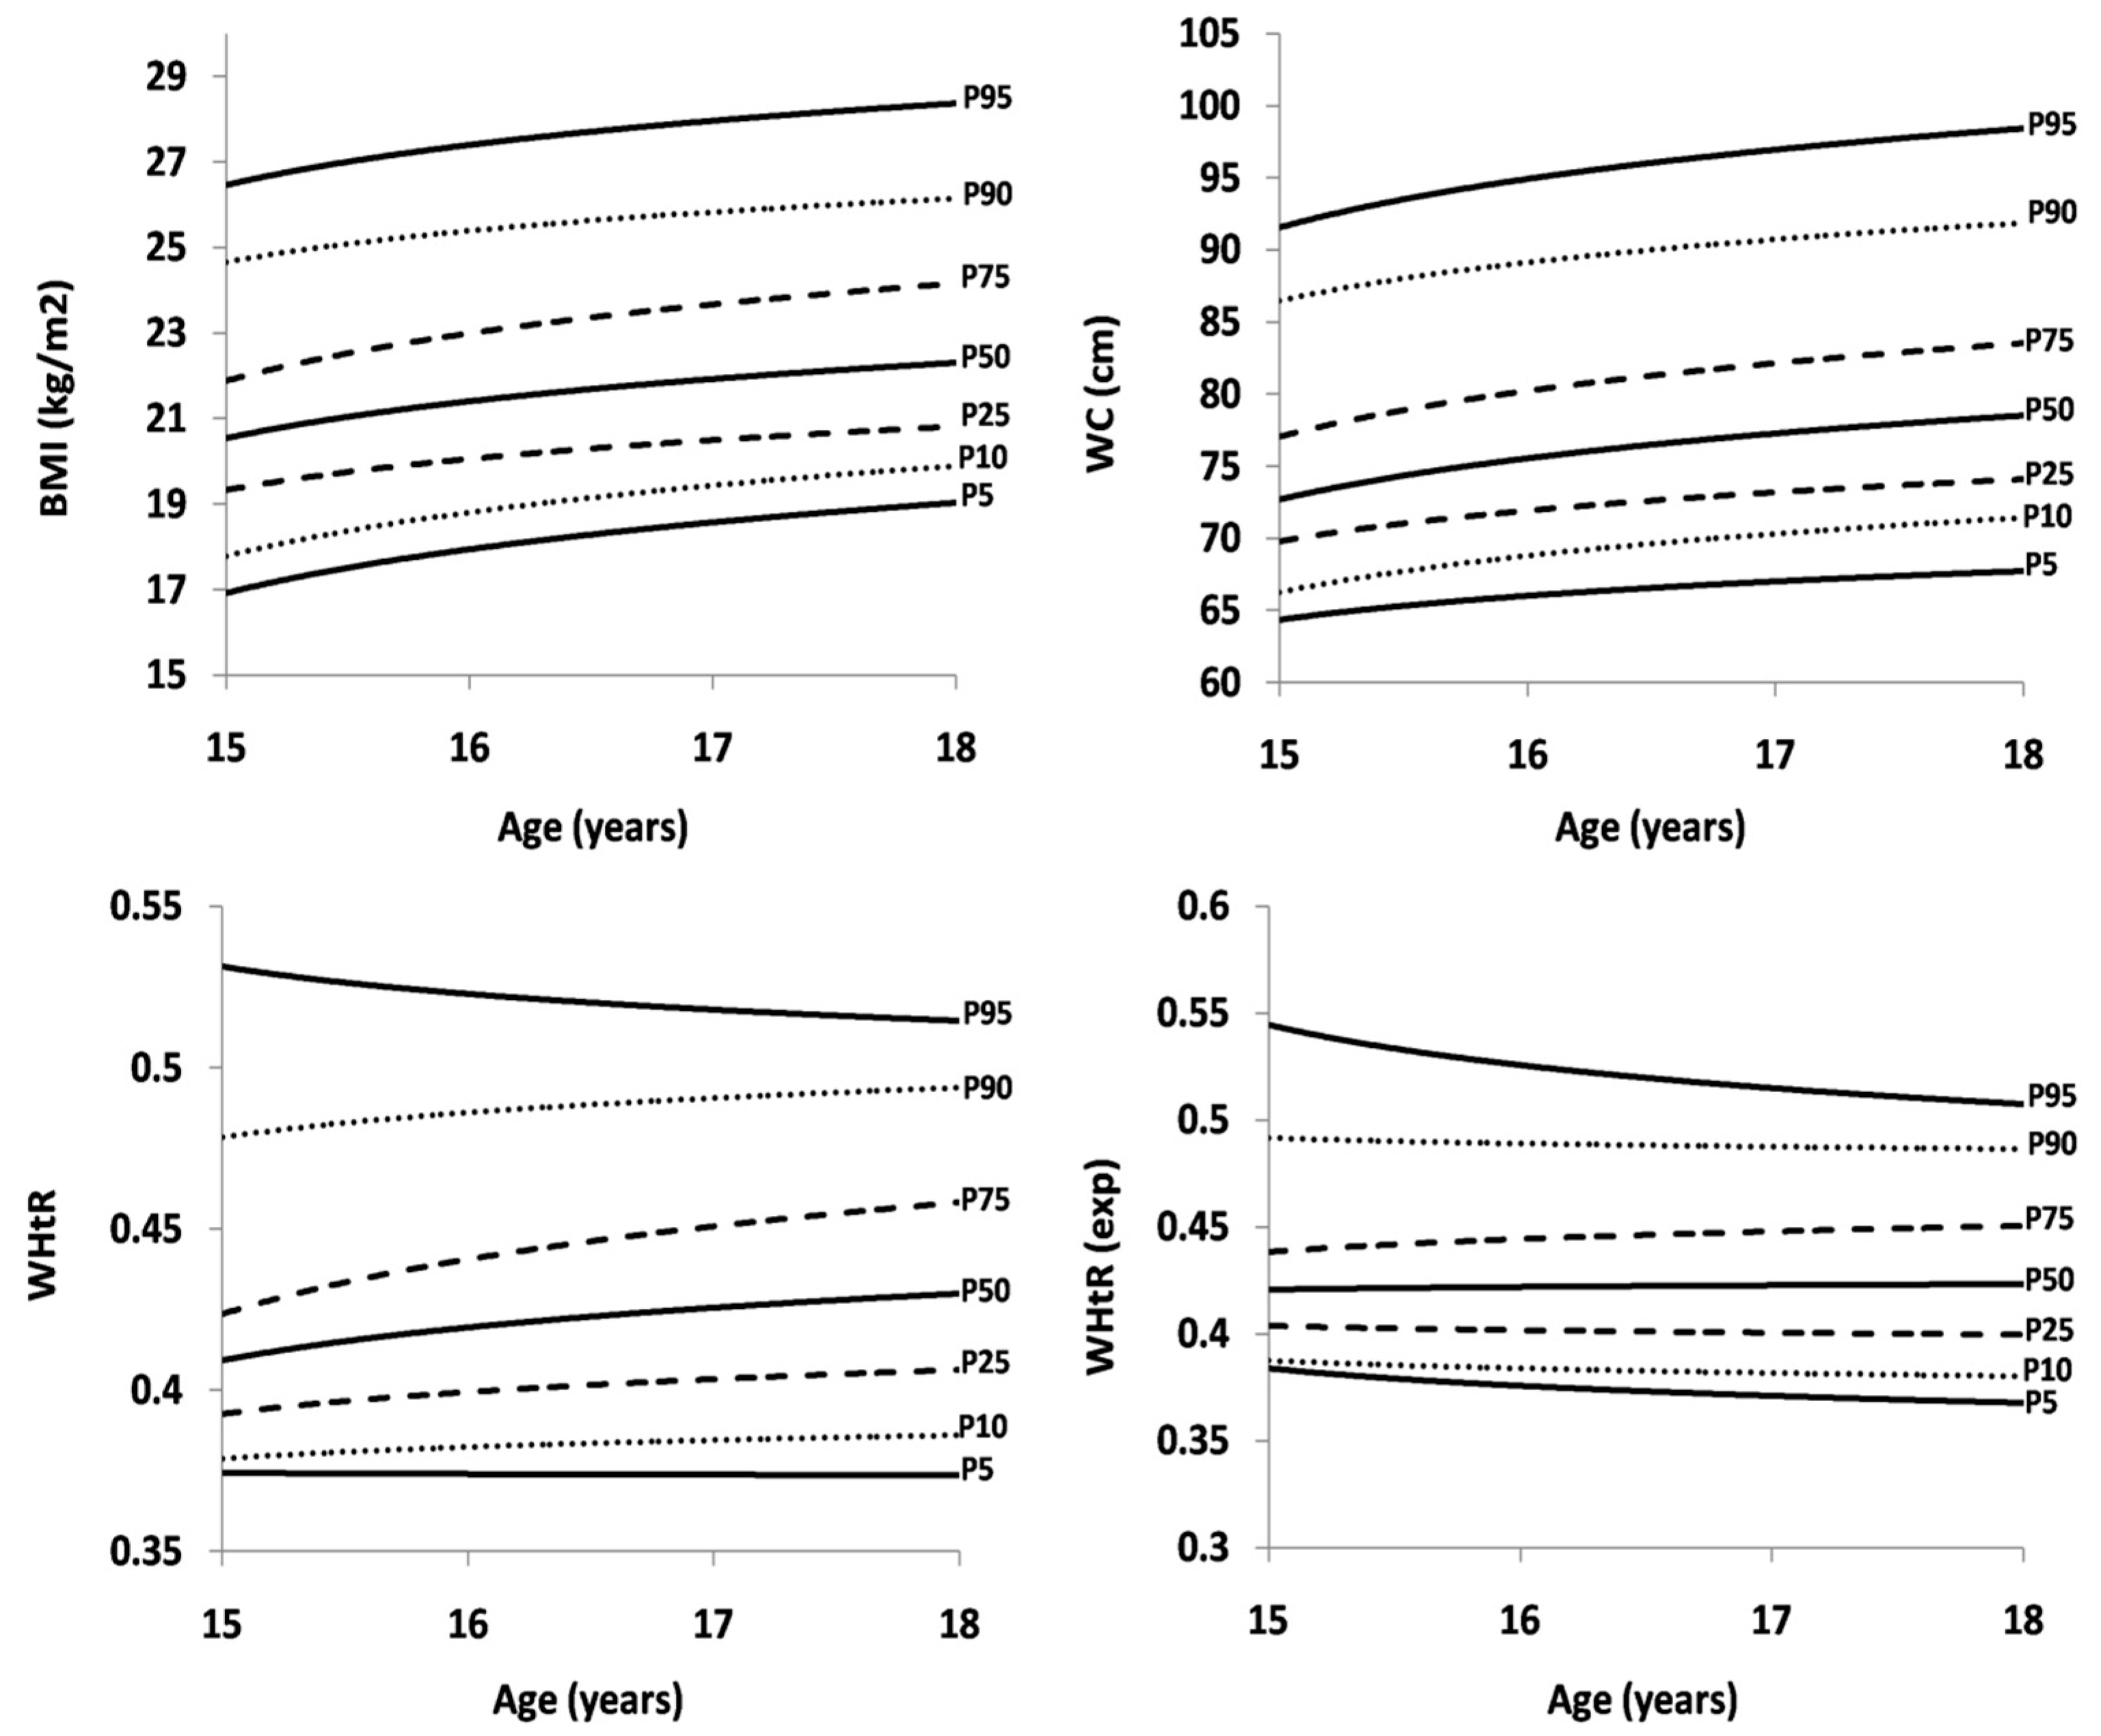
3. Results
4. Discussion
Author Contributions
Funding
Acknowledgments
Conflicts of Interest
References
- NCD Risk Factor Collaboration (NCD-RisC). Worldwide trends in body-mass index, underweight, overweight, and obesity from 1975 to 2016: A pooled analysis of 2416 population-based measurement studies in 128.9 million children, adolescents, and adults. Lancet 2017, 390, 2627–2642. [Google Scholar] [CrossRef]
- Dixon, J.B. The effect of obesity on health outcomes. Mol. Cell. Endocrinol. 2010, 316, 104–108. [Google Scholar] [CrossRef] [PubMed]
- Pećin, I.; Samovojska, R.; Heinrich, B.; Zeljković-Vrkić, T.; Laganović, M.; Jelaković, B. Hypertension, overweight and obesity in adolescents: The CRO-KOP Study. Coll. Antropol. 2013, 37, 761–764. [Google Scholar] [PubMed]
- Jureša, V.; Musil, V.; Majer, M. Are Croatian school-aged children really obese? Eur. J. Public Health 2016, 26. [Google Scholar] [CrossRef]
- WHO Global Health Observatory Data Repository [Online Database]; World Health Organization: Geneva, Switzerland, 2013; Available online: http://apps.who.int/gho/data/view.main (accessed on 29 March 2019).
- Jürimäe, T.; Hills, A.P. Body Composition Assessment in Children and Adolescents; Karger: Basel, Switzerland, 2000; 182p, ISBN 3-8055-7131-3. [Google Scholar]
- Santos, R.; Moreira, C.; Ruiz, J.; Vale, S.; Soares-Miranda, L.; Moreira, P.; Lopes, L.; Marques, A.I.; Oliveira-Tavares, A.; Santos, P.C.R. Reference curves for BMI, waist circumference and waist-height ratio for Azorean adolescents (Portugal). Public Health Nutr. 2011, 15, 1–17. [Google Scholar] [CrossRef] [PubMed]
- Cole, T.J.; Bellizzi, M.C.; Flegal, K.M.; Dietz, W.H. Establishing a standard definition for child overweight and obesity worldwide: International survey. BMJ 2000, 320, 1240–1243. [Google Scholar] [CrossRef]
- World Health Organization. Growth Reference Data for 5–19 Years. Available online: http://www.who.int/growthref/who2007_bmi_for_age/en/ (accessed on 29 March 2019).
- Centers for Disease Control and Prevention. CDC Growth Charts: United States. Available online: http://www.cdc.gov/growth charts (accessed on 29 March 2019).
- Brambilla, P.; Bedogni, G.; Moreno, L.A.; Goran, M.I.; Gutin, B.; Fox, K.R.; Peters, D.M.; Barbeau, P.; De Simone, M.; Pietrobelli, A.; et al. Cross-validation of anthropometry against magnetic resonance imaging for the assessment of visceral and subcutaneous adipose tissue in children. Int. J. Obes. 2006, 30, 23–30. [Google Scholar] [CrossRef] [PubMed]
- Kelishadi, R.; Mirmoghtadaee, P.; Najafi, H.; Keikha, M. Systematic review on the association of abdominal obesity in children and adolescents with cardio-metabolic risk factors. J. Res. Med. Sci. 2015, 20, 294–307. [Google Scholar]
- Browning, L.M.; Hsieh, S.D.; Ashwell, M. A systematic review of waist-to-height ratio as a screening tool for the prediction of cardiovascular disease and diabetes: 0.5 could be a suitable global boundary value. Nutr. Res. Rev. 2010, 23, 247–249. [Google Scholar] [CrossRef]
- McCharty, H.D.; Jarret, K.V.; Crawley, H.F. The development of waist circumference percentiles in British children aged 5.0–16.9 y. Eur. J. Clin. Nutr. 2001, 55, 902–907. [Google Scholar] [CrossRef]
- Moreno, L.A.; Fleta, J.; Mur, L.; Rodríquez, G.; Sarría, A.; Bueno, M. Waist circumference values in Spanish children—Gender related differences. Eur. J. Clin. Nutr. 1999, 53, 429–433. [Google Scholar] [CrossRef]
- Savva, S.C.; Kourides, Y.; Tornaritis, M.; Epiphaniou-Savva, M.; Tafouna, P.; Kafatos, A. Reference growth curves for Cypriot children 6 to 17 years of age. Obes. Rev. 2001, 9, 754–762. [Google Scholar] [CrossRef]
- Katzmarzyk, P.T. Waist circumference percentiles for Canadian youth 11–18y of age. Eur. J. Clin. Nutr. 2004, 58, 1011–1015. [Google Scholar] [CrossRef]
- Yan, W.; Yao, H.; Dai, J.; Cui, J.; Chen, Y.; Yang, X.; Harshfield, G.A.; Wang, X. Waist circumference cutoff points in school-aged Chinese Han and Uygur children. Obesity (Silver Spring) 2008, 16, 1687–1692. [Google Scholar] [CrossRef]
- Sung, R.Y.; So, H.-K.; Choi, K.-C.; Nelson, E.A.; Li, A.M.; Yin, J.A.; Kwok, C.W.; Ng, P.-C.; Fok, T.-F. Waist circumference and waist-to-height ratio of Hong Kong Chinese children. BMC Public Health 2008, 8, 324. [Google Scholar] [CrossRef]
- Xiong, F.; Garnett, S.P.; Cowell, C.T.; Biesheuvel, C.; Zeng, Y.; Long, C.L.; Wang, Q.; Wang, D.G.; Luo, Y.H.; Luo, S.Q. Waist circumference and waist-to-height ration in Han Chinese children living in Chongqing, south-west China. Public Health Nutr. 2011, 14, 20–26. [Google Scholar] [CrossRef]
- Eisenmann, J.C. Waist circumference percentiles for 7- to 15-year-old Australian children. Acta Paediatr. 2005, 94, 1182–1185. [Google Scholar] [CrossRef]
- Jureša, V.; Musil, V.; Kujundžić Tiljak, M. Growth charts for Croatian school children and secular trends in past twenty years. Coll.Antropol. 2012, 36, 47–57. [Google Scholar] [CrossRef]
- Jureša, V.; Musil, V.; Kujundžić Tiljak, M.; Majer, M. Comparison of body mass index percentiles for schoolchildren in Croatia with international reference values. Paediatr. Croat. 2018, 62, 1–8. [Google Scholar]
- Croatian Bureau of Statistics. First Release of the Upper Secondary Schools; End of 2016/2017 School Year and Beginning of 2017/2018 School Year. Available online: https://www.dzs.hr/Hrv_Eng/publication/2018/08-01-03_01_2018.htm (accessed on 29 March 2019).
- Alberti, K.G.; Zimmet, P.; Shaw, J. Metabolic syndrome—A new world-wide definition. A Consensus Statement from the Inter-national Diabetes Federation. Diabet. Med. 2006, 23, 469–480. [Google Scholar] [CrossRef]
- Tybor, D.J.; Lichtenstein, A.H.; Dallal, G.E.; Must, A. Waist-to-height ratio is correlated with height in US children and adolescents aged 2–18 years. Int. J. Pediatr. Obes. 2008, 3, 148–151. [Google Scholar] [CrossRef]
- Cole, T.J. The LMS method for constructing normalized growth standards. Eur. J. Clin. Nutr. 1990, 44, 45–60. [Google Scholar]
- Štefan, L.; Sorić, M.; Devrnja, A.; Petrić, V.; Mišigoj-Duraković, M. One-year changes in physical activity and sedentary behavior among adolescents: The Croatian Physical Activity in Adolescence Longitudinal Study (CRO-PALS). Int. J. Adolesc. Med. Health. 2018. Epub ahead of print. [Google Scholar] [CrossRef]
- Milosavljević, D.; Mandić, M.L.; Banjari, I. Nutritional knowledge and dietary habits survey in in high school population. Coll. Antropol. 2015, 39, 101–107. [Google Scholar]
- Carlson, J.A.; Crespo, N.C.; Sallis, J.F.; Patterson, R.E.; Elder, J.P. Dietary-related and physical activity-related predictors of obesity in children: A 2-year prospective study. Child. Obes. 2012, 8, 110–115. [Google Scholar] [CrossRef]
- Ma, J.; Wang, Z.; Song, Y.; Hu, P.; Zhang, B. BMI percentile curves for Chinese children aged 7–18 years, in comparison with the WHO and the US Centers for Disease Control and Prevention references. Public Health Nutr. 2010, 13, 1990–1996. [Google Scholar] [CrossRef]
- Bacopoulou, F.; Efthymiou, V.; Landis, G.; Rentoumis, A.; Chrousos, G.P. Waist circumference, waist-to-hip ratio and waist-to-height ratio reference percentiles for abdominal obesity among Greek adolescents. BMC Pediatr. 2015, 15, 50. [Google Scholar] [CrossRef]
- Galcheva, S.V.; Iotova, V.M.; Yotov, Y.T.; Grozdeva, K.P.; Stratev, V.K.; Tzaneva, V.I. Waist circumference percentile curves for Bulgarian children and adolescents aged 6–18 years. Int. J. Pediatr. Obes. 2009, 4, 381–388. [Google Scholar] [CrossRef]
- Kuriyan, R.; Thomas, T.; Lokesh, D.P.; Sheth, N.R.; Mahendra, A.; Joy, R.; Sumithra, S.; Bhat, S.; Kurpad, A.V. Waist circumference and waist for height percentiles in urban south Indian children aged 3–16 years. Indian Pediatr. 2011, 48, 765–771. [Google Scholar] [CrossRef]


| Sex | Age | n | BMI (kg/m2) | WC (cm) | WHtR | WHtR(exp) | ||||
|---|---|---|---|---|---|---|---|---|---|---|
| Mean | SD | Mean | SD | Mean | SD | Mean | SD | |||
| Boys | 15 | 117 | 21.1 | 3.0 | 75.0 | 8.3 | 0.42 | 0.05 | 0.45 | 0.05 |
| 16 | 105 | 21.5 | 2.6 | 76.8 | 8.2 | 0.43 | 0.04 | 0.40 | 0.04 | |
| 17 | 143 | 22.2 | 3.2 | 78.5 | 10.6 | 0.43 | 0.06 | 0.42 | 0.05 | |
| 18 | 98 | 23.2 | 3.5 | 80.4 | 10.3 | 0.44 | 0.06 | 0.45 | 0.06 | |
| Girls | 15 | 182 | 20.4 | 3.2 | 70.0 | 8.0 | 0.42 | 0.05 | 0.51 | 0.06 |
| 16 | 172 | 20.8 | 2.4 | 69.6 | 8.4 | 0.41 | 0.05 | 0.50 | 0.06 | |
| 17 | 117 | 20.6 | 2.2 | 69.1 | 6.6 | 0.41 | 0.04 | 0.47 | 0.04 | |
| 18 | 102 | 21.0 | 2.4 | 70.1 | 5.8 | 0.41 | 0.03 | 0.43 | 0.04 | |
| Measure | Sex | Age | n | Percentile | ||||||
|---|---|---|---|---|---|---|---|---|---|---|
| P5 | P10 | P25 | P50 | P75 | P90 | P95 | ||||
| BMI (kg/m2) | Boys | 15 | 117 | 16.9 | 17.7 | 19.6 | 20.7 | 22.1 | 24.9 | 26.7 |
| 16 | 105 | 18.0 | 19.1 | 19.6 | 21.2 | 22.5 | 25.0 | 26.8 | ||
| 17 | 143 | 18.2 | 19.2 | 20.2 | 21.7 | 23.5 | 25.6 | 28.2 | ||
| 18 | 98 | 19.2 | 19.4 | 21.3 | 22.6 | 24.6 | 26.5 | 28.5 | ||
| Girls | 15 | 182 | 16.7 | 17.2 | 18.4 | 19.9 | 21.8 | 24.1 | 25.2 | |
| 16 | 172 | 17.8 | 18.1 | 19.0 | 20.3 | 22.3 | 24.3 | 25.6 | ||
| 17 | 117 | 17.4 | 17.9 | 20.4 | 22.4 | 23.2 | 24.5 | 25.9 | ||
| 18 | 102 | 17.6 | 18.1 | 19.3 | 20.7 | 22.7 | 24.5 | 25.7 | ||
| WC (cm) | Boys | 15 | 117 | 65.0 | 66.9 | 70.0 | 73.0 | 77.0 | 86.2 | 93.2 |
| 16 | 105 | 65.0 | 68.0 | 72.0 | 75.0 | 80.0 | 90.0 | 92.7 | ||
| 17 | 143 | 66.0 | 69.0 | 72.0 | 77.0 | 83.0 | 90.0 | 94.0 | ||
| 18 | 98 | 69.0 | 72.9 | 75.0 | 79.0 | 83.0 | 92.0 | 102.0 | ||
| Girls | 15 | 182 | 60.2 | 62.3 | 65.0 | 68.0 | 73.0 | 80.0 | 84.0 | |
| 16 | 172 | 62.0 | 63.0 | 64.0 | 67.0 | 73.7 | 80.0 | 87.0 | ||
| 17 | 117 | 60.5 | 61.9 | 65.0 | 68.0 | 71.5 | 78.2 | 81.2 | ||
| 18 | 102 | 61.0 | 63.0 | 65.0 | 70.0 | 74.2 | 77.0 | 80.0 | ||
| WHtR | Boys | 15 | 117 | 0.37 | 0.38 | 0.39 | 0.40 | 0.42 | 0.48 | 0.54 |
| 16 | 105 | 0.38 | 0.38 | 0.40 | 0.42 | 0.44 | 0.49 | 0.51 | ||
| 17 | 143 | 0.37 | 0.38 | 0.40 | 0.42 | 0.44 | 0.49 | 0.51 | ||
| 18 | 98 | 0.37 | 0.39 | 0.41 | 0.43 | 0.46 | 0.49 | 0.53 | ||
| Girls | 15 | 182 | 0.36 | 0.37 | 0.38 | 0.41 | 0.43 | 0.48 | 0.50 | |
| 16 | 172 | 0.36 | 0.37 | 0.38 | 0.40 | 0.44 | 0.47 | 0.52 | ||
| 17 | 117 | 0.36 | 0.37 | 0.39 | 0.41 | 0.43 | 0.46 | 0.49 | ||
| 18 | 102 | 0.36 | 0.37 | 0.39 | 0.42 | 0.44 | 0.46 | 0.48 | ||
| WHtR(exp) | Boys | 15 | 117 | 0.40 | 0.40 | 0.42 | 0.44 | 0.46 | 0.50 | 0.58 |
| 16 | 105 | 0.35 | 0.36 | 0.38 | 0.40 | 0.41 | 0.46 | 0.47 | ||
| 17 | 143 | 0.37 | 0.37 | 0.39 | 0.42 | 0.44 | 0.48 | 0.50 | ||
| 18 | 98 | 0.38 | 0.40 | 0.42 | 0.44 | 0.47 | 0.50 | 0.54 | ||
| Girls | 15 | 182 | 0.45 | 0.46 | 0.47 | 0.49 | 0.53 | 0.58 | 0.61 | |
| 16 | 172 | 0.44 | 0.45 | 0.47 | 0.49 | 0.54 | 0.58 | 0.63 | ||
| 17 | 117 | 0.41 | 0.43 | 0.44 | 0.47 | 0.49 | 0.53 | 0.55 | ||
| 18 | 102 | 0.38 | 0.38 | 0.40 | 0.43 | 0.46 | 0.47 | 0.50 | ||
© 2019 by the authors. Licensee MDPI, Basel, Switzerland. This article is an open access article distributed under the terms and conditions of the Creative Commons Attribution (CC BY) license (http://creativecommons.org/licenses/by/4.0/).
Share and Cite
Zvonar, M.; Štefan, L.; Kasović, M. Percentile Curves for Body-Mass Index, Waist Circumference, Waist-To-Height Ratio and Waist-To-Height Ratio(Exp) in Croatian Adolescents. Int. J. Environ. Res. Public Health 2019, 16, 1920. https://doi.org/10.3390/ijerph16111920
Zvonar M, Štefan L, Kasović M. Percentile Curves for Body-Mass Index, Waist Circumference, Waist-To-Height Ratio and Waist-To-Height Ratio(Exp) in Croatian Adolescents. International Journal of Environmental Research and Public Health. 2019; 16(11):1920. https://doi.org/10.3390/ijerph16111920
Chicago/Turabian StyleZvonar, Martin, Lovro Štefan, and Mario Kasović. 2019. "Percentile Curves for Body-Mass Index, Waist Circumference, Waist-To-Height Ratio and Waist-To-Height Ratio(Exp) in Croatian Adolescents" International Journal of Environmental Research and Public Health 16, no. 11: 1920. https://doi.org/10.3390/ijerph16111920
APA StyleZvonar, M., Štefan, L., & Kasović, M. (2019). Percentile Curves for Body-Mass Index, Waist Circumference, Waist-To-Height Ratio and Waist-To-Height Ratio(Exp) in Croatian Adolescents. International Journal of Environmental Research and Public Health, 16(11), 1920. https://doi.org/10.3390/ijerph16111920